Zip Codes with the Highest Percentage of Population Employed in Administrative & Support Services in Huntsville, TX
RELATED REPORTS & OPTIONS
Administrative & Support Services
Huntsville
Compare Zip Codes
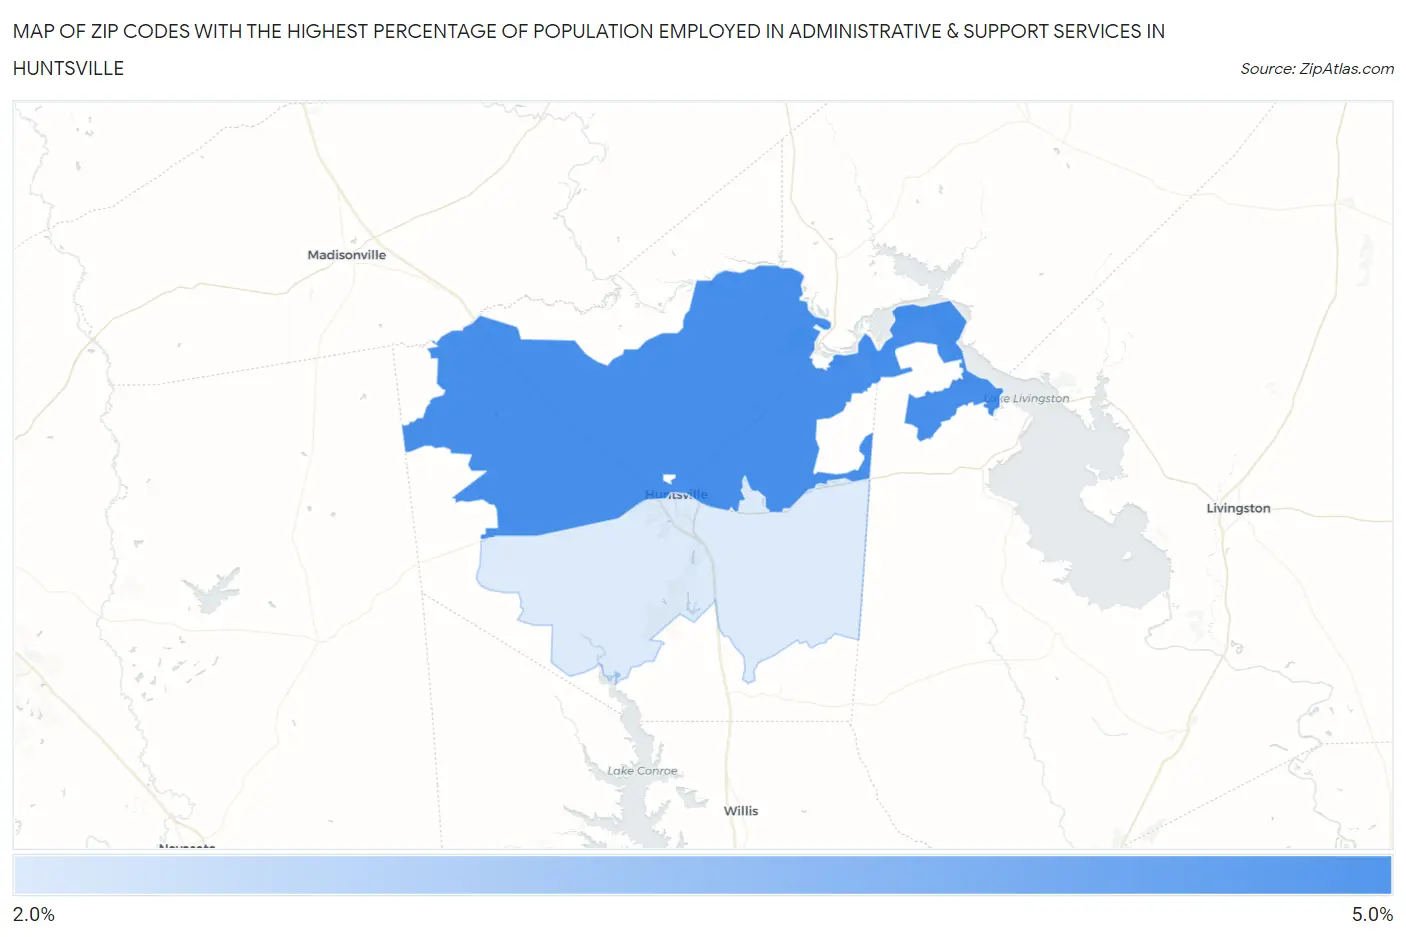
Map of Zip Codes with the Highest Percentage of Population Employed in Administrative & Support Services in Huntsville
0.0%
5.0%
Zip Codes with the Highest Percentage of Population Employed in Administrative & Support Services in Huntsville, TX
| Zip Code | % Employed | vs State | vs National | |
| 1. | 77320 | 4.8% | 4.4%(+0.422)#560 | 4.1%(+0.688)#7,600 |
| 2. | 77340 | 2.6% | 4.4%(-1.81)#1,134 | 4.1%(-1.54)#17,543 |
1
Common Questions
What are the Top Zip Codes with the Highest Percentage of Population Employed in Administrative & Support Services in Huntsville, TX?
Top Zip Codes with the Highest Percentage of Population Employed in Administrative & Support Services in Huntsville, TX are:
What zip code has the Highest Percentage of Population Employed in Administrative & Support Services in Huntsville, TX?
77320 has the Highest Percentage of Population Employed in Administrative & Support Services in Huntsville, TX with 4.8%.
What is the Percentage of Population Employed in Administrative & Support Services in Huntsville, TX?
Percentage of Population Employed in Administrative & Support Services in Huntsville is 2.1%.
What is the Percentage of Population Employed in Administrative & Support Services in Texas?
Percentage of Population Employed in Administrative & Support Services in Texas is 4.4%.
What is the Percentage of Population Employed in Administrative & Support Services in the United States?
Percentage of Population Employed in Administrative & Support Services in the United States is 4.1%.