Zip Codes with the Highest Percentage of Population Employed in Administrative & Support Services in Houston, TX
RELATED REPORTS & OPTIONS
Administrative & Support Services
Houston
Compare Zip Codes
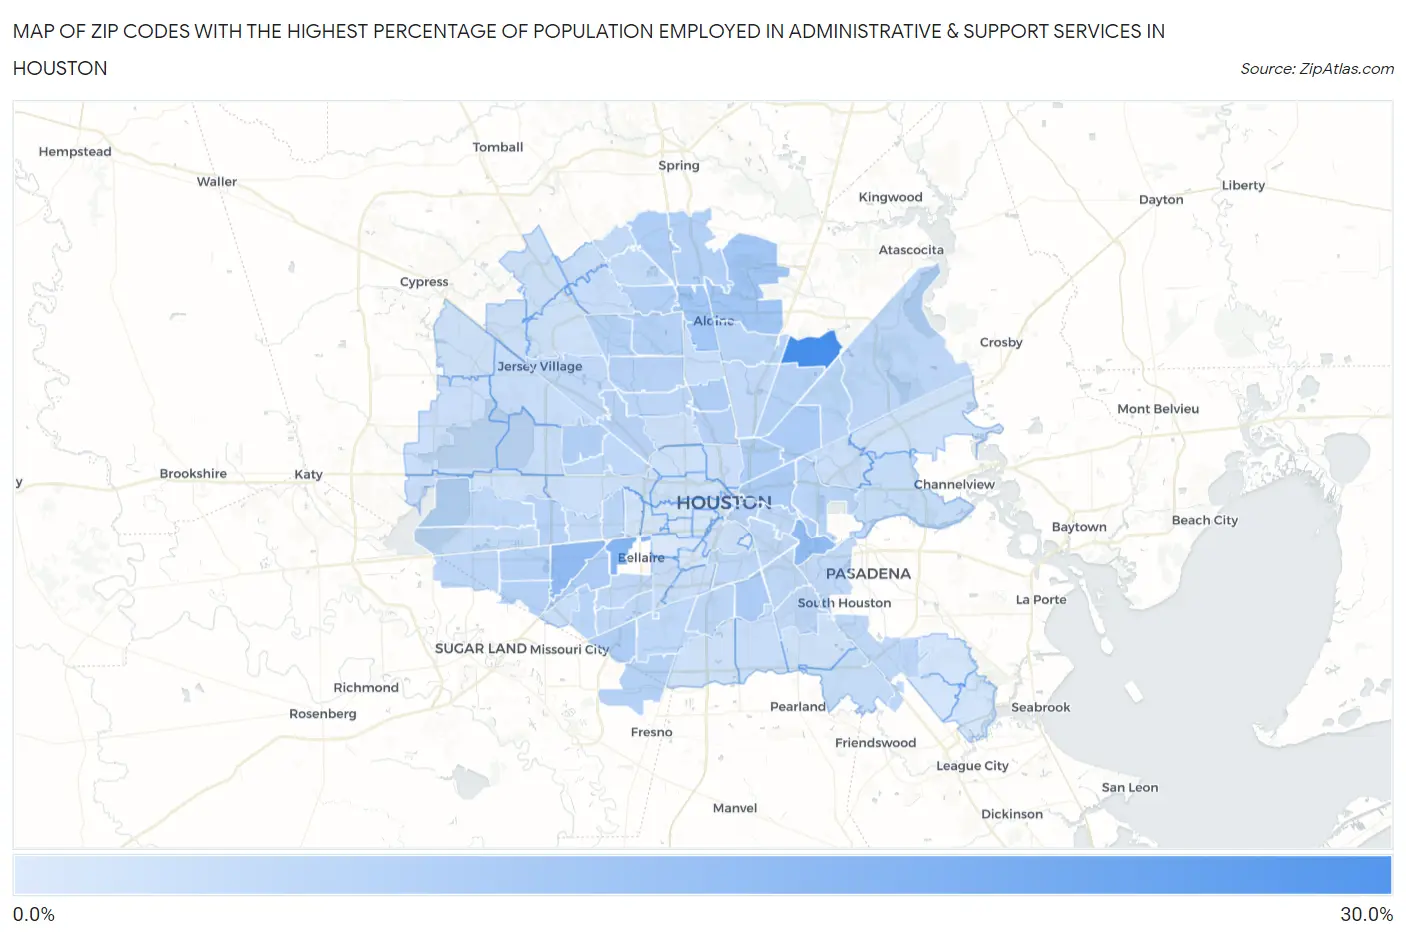
Map of Zip Codes with the Highest Percentage of Population Employed in Administrative & Support Services in Houston
0.0%
30.0%
Zip Codes with the Highest Percentage of Population Employed in Administrative & Support Services in Houston, TX
| Zip Code | % Employed | vs State | vs National | |
| 1. | 77050 | 29.0% | 4.4%(+24.5)#6 | 4.1%(+24.8)#150 |
| 2. | 77081 | 16.6% | 4.4%(+12.2)#26 | 4.1%(+12.4)#425 |
| 3. | 77036 | 14.4% | 4.4%(+9.96)#40 | 4.1%(+10.2)#586 |
| 4. | 77012 | 13.8% | 4.4%(+9.41)#43 | 4.1%(+9.68)#642 |
| 5. | 77060 | 10.7% | 4.4%(+6.28)#72 | 4.1%(+6.55)#1,091 |
| 6. | 77032 | 10.7% | 4.4%(+6.26)#74 | 4.1%(+6.53)#1,097 |
| 7. | 77020 | 9.1% | 4.4%(+4.70)#104 | 4.1%(+4.97)#1,630 |
| 8. | 77033 | 9.1% | 4.4%(+4.69)#105 | 4.1%(+4.96)#1,634 |
| 9. | 77028 | 8.9% | 4.4%(+4.50)#113 | 4.1%(+4.77)#1,733 |
| 10. | 77074 | 8.6% | 4.4%(+4.22)#127 | 4.1%(+4.49)#1,888 |
| 11. | 77076 | 8.5% | 4.4%(+4.12)#132 | 4.1%(+4.39)#1,946 |
| 12. | 77085 | 8.4% | 4.4%(+4.03)#135 | 4.1%(+4.30)#2,001 |
| 13. | 77026 | 8.4% | 4.4%(+3.97)#136 | 4.1%(+4.24)#2,033 |
| 14. | 77090 | 8.1% | 4.4%(+3.71)#147 | 4.1%(+3.97)#2,191 |
| 15. | 77067 | 8.0% | 4.4%(+3.55)#158 | 4.1%(+3.82)#2,300 |
| 16. | 77073 | 7.8% | 4.4%(+3.41)#167 | 4.1%(+3.68)#2,396 |
| 17. | 77080 | 7.7% | 4.4%(+3.32)#172 | 4.1%(+3.59)#2,469 |
| 18. | 77086 | 7.6% | 4.4%(+3.20)#181 | 4.1%(+3.46)#2,586 |
| 19. | 77072 | 7.6% | 4.4%(+3.16)#182 | 4.1%(+3.43)#2,616 |
| 20. | 77016 | 7.5% | 4.4%(+3.08)#187 | 4.1%(+3.34)#2,695 |
| 21. | 77099 | 7.5% | 4.4%(+3.06)#190 | 4.1%(+3.33)#2,707 |
| 22. | 77053 | 7.3% | 4.4%(+2.92)#202 | 4.1%(+3.18)#2,856 |
| 23. | 77038 | 7.3% | 4.4%(+2.88)#206 | 4.1%(+3.15)#2,891 |
| 24. | 77088 | 7.2% | 4.4%(+2.79)#209 | 4.1%(+3.06)#2,976 |
| 25. | 77042 | 7.1% | 4.4%(+2.68)#219 | 4.1%(+2.95)#3,105 |
| 26. | 77003 | 7.1% | 4.4%(+2.67)#222 | 4.1%(+2.94)#3,117 |
| 27. | 77022 | 7.0% | 4.4%(+2.62)#225 | 4.1%(+2.89)#3,180 |
| 28. | 77092 | 7.0% | 4.4%(+2.58)#228 | 4.1%(+2.85)#3,214 |
| 29. | 77029 | 6.8% | 4.4%(+2.36)#257 | 4.1%(+2.63)#3,507 |
| 30. | 77071 | 6.7% | 4.4%(+2.28)#264 | 4.1%(+2.55)#3,629 |
| 31. | 77078 | 6.6% | 4.4%(+2.15)#279 | 4.1%(+2.41)#3,821 |
| 32. | 77039 | 6.6% | 4.4%(+2.14)#281 | 4.1%(+2.41)#3,827 |
| 33. | 77044 | 6.4% | 4.4%(+2.01)#295 | 4.1%(+2.28)#4,024 |
| 34. | 77091 | 6.4% | 4.4%(+1.93)#303 | 4.1%(+2.20)#4,151 |
| 35. | 77083 | 6.2% | 4.4%(+1.82)#320 | 4.1%(+2.08)#4,357 |
| 36. | 77057 | 6.1% | 4.4%(+1.73)#340 | 4.1%(+1.99)#4,509 |
| 37. | 77051 | 6.1% | 4.4%(+1.70)#343 | 4.1%(+1.97)#4,561 |
| 38. | 77045 | 6.0% | 4.4%(+1.62)#357 | 4.1%(+1.88)#4,719 |
| 39. | 77011 | 6.0% | 4.4%(+1.61)#359 | 4.1%(+1.87)#4,736 |
| 40. | 77035 | 6.0% | 4.4%(+1.58)#364 | 4.1%(+1.85)#4,789 |
| 41. | 77087 | 6.0% | 4.4%(+1.56)#366 | 4.1%(+1.82)#4,839 |
| 42. | 77055 | 5.8% | 4.4%(+1.42)#378 | 4.1%(+1.69)#5,078 |
| 43. | 77021 | 5.8% | 4.4%(+1.38)#385 | 4.1%(+1.64)#5,161 |
| 44. | 77077 | 5.8% | 4.4%(+1.36)#388 | 4.1%(+1.63)#5,204 |
| 45. | 77034 | 5.7% | 4.4%(+1.24)#404 | 4.1%(+1.51)#5,442 |
| 46. | 77093 | 5.6% | 4.4%(+1.15)#415 | 4.1%(+1.41)#5,674 |
| 47. | 77096 | 5.5% | 4.4%(+1.12)#423 | 4.1%(+1.38)#5,754 |
| 48. | 77017 | 5.5% | 4.4%(+1.07)#429 | 4.1%(+1.34)#5,871 |
| 49. | 77023 | 5.4% | 4.4%(+0.968)#445 | 4.1%(+1.23)#6,116 |
| 50. | 77040 | 5.3% | 4.4%(+0.899)#454 | 4.1%(+1.17)#6,285 |
| 51. | 77061 | 5.3% | 4.4%(+0.874)#460 | 4.1%(+1.14)#6,356 |
| 52. | 77082 | 5.1% | 4.4%(+0.733)#493 | 4.1%(+0.999)#6,710 |
| 53. | 77063 | 5.1% | 4.4%(+0.676)#503 | 4.1%(+0.942)#6,868 |
| 54. | 77014 | 4.9% | 4.4%(+0.480)#544 | 4.1%(+0.746)#7,422 |
| 55. | 77068 | 4.9% | 4.4%(+0.455)#549 | 4.1%(+0.722)#7,497 |
| 56. | 77015 | 4.8% | 4.4%(+0.375)#569 | 4.1%(+0.641)#7,752 |
| 57. | 77089 | 4.5% | 4.4%(+0.077)#627 | 4.1%(+0.343)#8,748 |
| 58. | 77069 | 4.4% | 4.4%(+0.000)#640 | 4.1%(+0.267)#9,008 |
| 59. | 77048 | 4.4% | 4.4%(-0.023)#646 | 4.1%(+0.243)#9,102 |
| 60. | 77066 | 4.4% | 4.4%(-0.023)#647 | 4.1%(+0.243)#9,105 |
| 61. | 77041 | 4.3% | 4.4%(-0.087)#660 | 4.1%(+0.179)#9,351 |
| 62. | 77037 | 4.3% | 4.4%(-0.139)#670 | 4.1%(+0.127)#9,531 |
| 63. | 77043 | 4.2% | 4.4%(-0.235)#699 | 4.1%(+0.031)#9,908 |
| 64. | 77031 | 4.2% | 4.4%(-0.242)#704 | 4.1%(+0.024)#9,949 |
| 65. | 77013 | 4.0% | 4.4%(-0.413)#740 | 4.1%(-0.146)#10,675 |
| 66. | 77084 | 4.0% | 4.4%(-0.437)#750 | 4.1%(-0.171)#10,793 |
| 67. | 77054 | 3.8% | 4.4%(-0.601)#787 | 4.1%(-0.335)#11,473 |
| 68. | 77009 | 3.8% | 4.4%(-0.647)#802 | 4.1%(-0.380)#11,680 |
| 69. | 77094 | 3.7% | 4.4%(-0.713)#820 | 4.1%(-0.447)#11,982 |
| 70. | 77025 | 3.7% | 4.4%(-0.716)#821 | 4.1%(-0.450)#11,990 |
| 71. | 77070 | 3.5% | 4.4%(-0.963)#891 | 4.1%(-0.696)#13,196 |
| 72. | 77004 | 3.4% | 4.4%(-1.01)#899 | 4.1%(-0.744)#13,405 |
| 73. | 77018 | 3.3% | 4.4%(-1.09)#926 | 4.1%(-0.821)#13,795 |
| 74. | 77024 | 3.3% | 4.4%(-1.14)#938 | 4.1%(-0.869)#14,045 |
| 75. | 77065 | 3.3% | 4.4%(-1.14)#942 | 4.1%(-0.871)#14,054 |
| 76. | 77008 | 3.2% | 4.4%(-1.22)#972 | 4.1%(-0.951)#14,483 |
| 77. | 77095 | 3.2% | 4.4%(-1.22)#973 | 4.1%(-0.952)#14,488 |
| 78. | 77075 | 3.1% | 4.4%(-1.33)#1,006 | 4.1%(-1.07)#15,074 |
| 79. | 77064 | 3.0% | 4.4%(-1.38)#1,023 | 4.1%(-1.11)#15,282 |
| 80. | 77007 | 3.0% | 4.4%(-1.43)#1,036 | 4.1%(-1.16)#15,519 |
| 81. | 77047 | 3.0% | 4.4%(-1.43)#1,037 | 4.1%(-1.16)#15,528 |
| 82. | 77049 | 3.0% | 4.4%(-1.43)#1,038 | 4.1%(-1.16)#15,536 |
| 83. | 77056 | 2.6% | 4.4%(-1.85)#1,146 | 4.1%(-1.58)#17,787 |
| 84. | 77079 | 2.5% | 4.4%(-1.87)#1,151 | 4.1%(-1.61)#17,914 |
| 85. | 77058 | 2.5% | 4.4%(-1.94)#1,169 | 4.1%(-1.67)#18,242 |
| 86. | 77059 | 2.3% | 4.4%(-2.07)#1,198 | 4.1%(-1.81)#18,972 |
| 87. | 77006 | 2.3% | 4.4%(-2.11)#1,207 | 4.1%(-1.84)#19,153 |
| 88. | 77062 | 2.3% | 4.4%(-2.15)#1,213 | 4.1%(-1.88)#19,322 |
| 89. | 77019 | 2.0% | 4.4%(-2.44)#1,289 | 4.1%(-2.17)#20,737 |
| 90. | 77027 | 1.8% | 4.4%(-2.64)#1,327 | 4.1%(-2.37)#21,619 |
| 91. | 77030 | 1.7% | 4.4%(-2.67)#1,334 | 4.1%(-2.40)#21,748 |
| 92. | 77098 | 1.7% | 4.4%(-2.73)#1,349 | 4.1%(-2.47)#22,031 |
| 93. | 77005 | 1.6% | 4.4%(-2.77)#1,359 | 4.1%(-2.51)#22,193 |
| 94. | 77002 | 1.6% | 4.4%(-2.79)#1,365 | 4.1%(-2.53)#22,277 |
| 95. | 77204 | 0.76% | 4.4%(-3.66)#1,492 | 4.1%(-3.39)#25,236 |
1
Common Questions
What are the Top 10 Zip Codes with the Highest Percentage of Population Employed in Administrative & Support Services in Houston, TX?
Top 10 Zip Codes with the Highest Percentage of Population Employed in Administrative & Support Services in Houston, TX are:
What zip code has the Highest Percentage of Population Employed in Administrative & Support Services in Houston, TX?
77050 has the Highest Percentage of Population Employed in Administrative & Support Services in Houston, TX with 29.0%.
What is the Percentage of Population Employed in Administrative & Support Services in Houston, TX?
Percentage of Population Employed in Administrative & Support Services in Houston is 6.0%.
What is the Percentage of Population Employed in Administrative & Support Services in Texas?
Percentage of Population Employed in Administrative & Support Services in Texas is 4.4%.
What is the Percentage of Population Employed in Administrative & Support Services in the United States?
Percentage of Population Employed in Administrative & Support Services in the United States is 4.1%.