Zip Codes with the Highest Percentage of Population Employed in Administrative & Support Services in Hawaii
RELATED REPORTS & OPTIONS
Administrative & Support Services
Hawaii
Compare Zip Codes
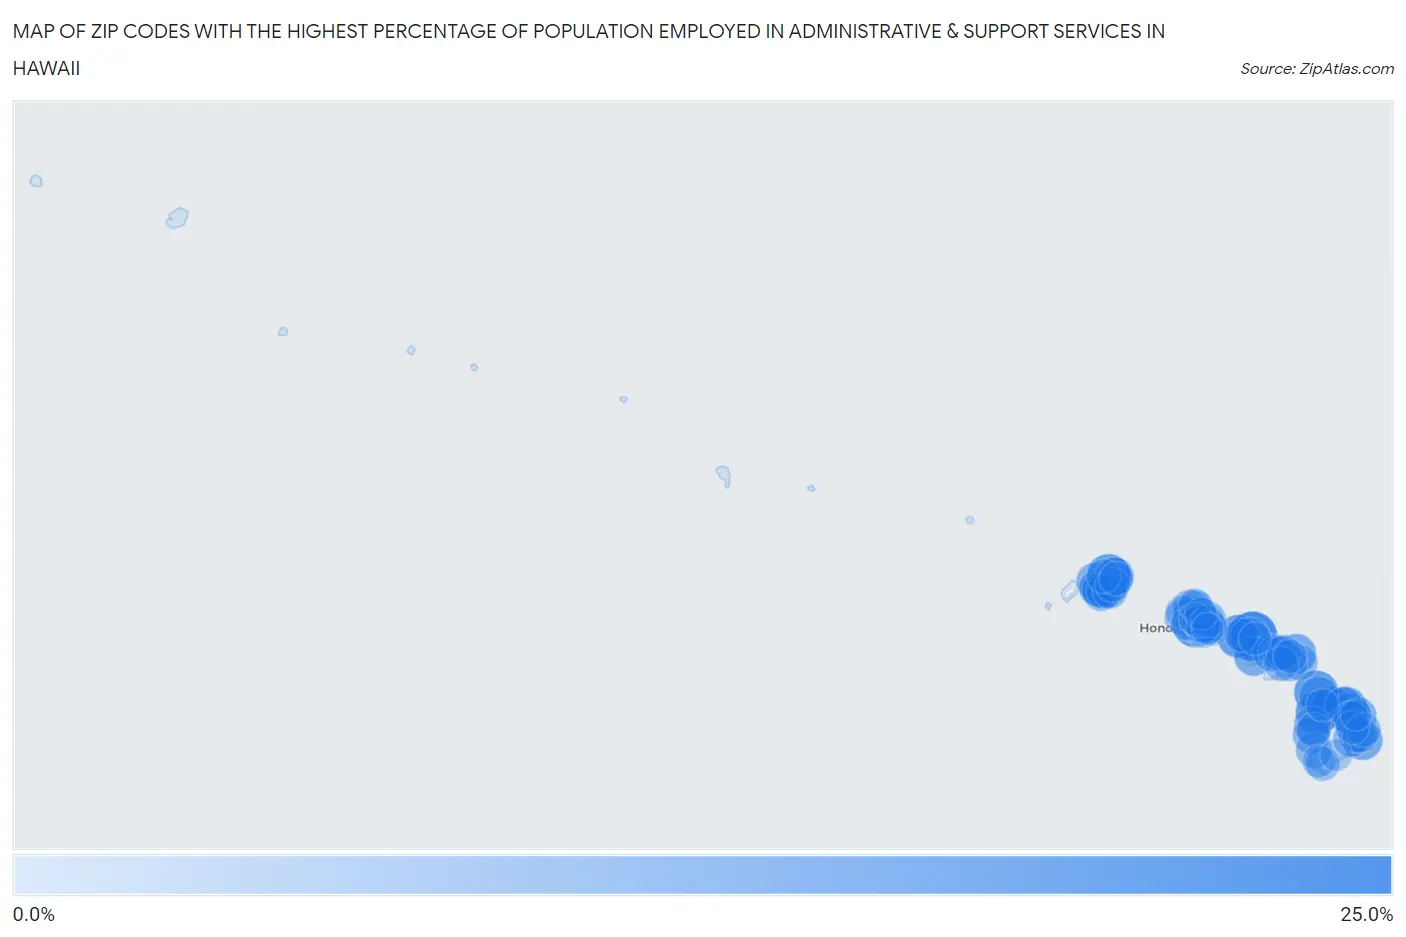
Map of Zip Codes with the Highest Percentage of Population Employed in Administrative & Support Services in Hawaii
0.0%
25.0%
Zip Codes with the Highest Percentage of Population Employed in Administrative & Support Services in Hawaii
| Zip Code | % Employed | vs State | vs National | |
| 1. | 96742 | 22.2% | 4.7%(+17.5)#1 | 4.1%(+18.1)#235 |
| 2. | 96860 | 16.5% | 4.7%(+11.7)#2 | 4.1%(+12.3)#429 |
| 3. | 96722 | 16.2% | 4.7%(+11.5)#3 | 4.1%(+12.1)#450 |
| 4. | 96774 | 16.2% | 4.7%(+11.4)#4 | 4.1%(+12.0)#452 |
| 5. | 96719 | 15.8% | 4.7%(+11.0)#5 | 4.1%(+11.6)#475 |
| 6. | 96738 | 15.3% | 4.7%(+10.5)#6 | 4.1%(+11.1)#508 |
| 7. | 96770 | 14.8% | 4.7%(+10.1)#7 | 4.1%(+10.7)#547 |
| 8. | 96778 | 11.4% | 4.7%(+6.60)#8 | 4.1%(+7.20)#949 |
| 9. | 96741 | 11.1% | 4.7%(+6.36)#9 | 4.1%(+6.95)#1,000 |
| 10. | 96708 | 10.9% | 4.7%(+6.18)#10 | 4.1%(+6.78)#1,035 |
| 11. | 96757 | 10.9% | 4.7%(+6.18)#11 | 4.1%(+6.77)#1,037 |
| 12. | 96727 | 10.9% | 4.7%(+6.17)#12 | 4.1%(+6.77)#1,038 |
| 13. | 96773 | 10.3% | 4.7%(+5.60)#13 | 4.1%(+6.20)#1,186 |
| 14. | 96755 | 10.1% | 4.7%(+5.37)#14 | 4.1%(+5.96)#1,252 |
| 15. | 96763 | 10.1% | 4.7%(+5.37)#15 | 4.1%(+5.96)#1,254 |
| 16. | 96716 | 9.7% | 4.7%(+4.97)#16 | 4.1%(+5.56)#1,389 |
| 17. | 96769 | 9.2% | 4.7%(+4.48)#17 | 4.1%(+5.08)#1,576 |
| 18. | 96783 | 9.0% | 4.7%(+4.22)#18 | 4.1%(+4.82)#1,705 |
| 19. | 96776 | 8.7% | 4.7%(+3.98)#19 | 4.1%(+4.58)#1,832 |
| 20. | 96703 | 8.5% | 4.7%(+3.74)#20 | 4.1%(+4.34)#1,972 |
| 21. | 96752 | 8.0% | 4.7%(+3.28)#21 | 4.1%(+3.87)#2,257 |
| 22. | 96863 | 7.8% | 4.7%(+3.10)#22 | 4.1%(+3.69)#2,388 |
| 23. | 96740 | 7.7% | 4.7%(+3.00)#23 | 4.1%(+3.60)#2,463 |
| 24. | 96796 | 7.7% | 4.7%(+2.98)#24 | 4.1%(+3.57)#2,494 |
| 25. | 96761 | 7.7% | 4.7%(+2.95)#25 | 4.1%(+3.54)#2,522 |
| 26. | 96750 | 7.6% | 4.7%(+2.82)#26 | 4.1%(+3.42)#2,625 |
| 27. | 96785 | 7.1% | 4.7%(+2.37)#27 | 4.1%(+2.96)#3,069 |
| 28. | 96704 | 6.5% | 4.7%(+1.77)#28 | 4.1%(+2.36)#3,882 |
| 29. | 96762 | 6.4% | 4.7%(+1.65)#29 | 4.1%(+2.25)#4,080 |
| 30. | 96754 | 6.4% | 4.7%(+1.63)#30 | 4.1%(+2.23)#4,113 |
| 31. | 96815 | 6.4% | 4.7%(+1.62)#31 | 4.1%(+2.21)#4,136 |
| 32. | 96792 | 6.3% | 4.7%(+1.53)#32 | 4.1%(+2.13)#4,275 |
| 33. | 96786 | 6.2% | 4.7%(+1.44)#33 | 4.1%(+2.03)#4,441 |
| 34. | 96747 | 6.1% | 4.7%(+1.34)#34 | 4.1%(+1.94)#4,619 |
| 35. | 96712 | 6.1% | 4.7%(+1.34)#35 | 4.1%(+1.94)#4,620 |
| 36. | 96771 | 6.0% | 4.7%(+1.23)#36 | 4.1%(+1.82)#4,837 |
| 37. | 96781 | 5.9% | 4.7%(+1.17)#37 | 4.1%(+1.77)#4,935 |
| 38. | 96760 | 5.9% | 4.7%(+1.14)#38 | 4.1%(+1.74)#4,982 |
| 39. | 96857 | 5.8% | 4.7%(+1.01)#39 | 4.1%(+1.61)#5,245 |
| 40. | 96713 | 5.6% | 4.7%(+0.877)#40 | 4.1%(+1.47)#5,537 |
| 41. | 96793 | 5.6% | 4.7%(+0.845)#41 | 4.1%(+1.44)#5,605 |
| 42. | 96814 | 5.5% | 4.7%(+0.715)#42 | 4.1%(+1.31)#5,932 |
| 43. | 96819 | 5.4% | 4.7%(+0.656)#43 | 4.1%(+1.25)#6,073 |
| 44. | 96790 | 5.3% | 4.7%(+0.541)#44 | 4.1%(+1.14)#6,363 |
| 45. | 96797 | 5.1% | 4.7%(+0.397)#45 | 4.1%(+0.994)#6,725 |
| 46. | 96732 | 5.1% | 4.7%(+0.362)#46 | 4.1%(+0.958)#6,827 |
| 47. | 96705 | 5.1% | 4.7%(+0.320)#47 | 4.1%(+0.917)#6,932 |
| 48. | 96779 | 5.1% | 4.7%(+0.310)#48 | 4.1%(+0.906)#6,949 |
| 49. | 96756 | 5.0% | 4.7%(+0.215)#49 | 4.1%(+0.811)#7,209 |
| 50. | 96725 | 4.8% | 4.7%(+0.018)#50 | 4.1%(+0.614)#7,835 |
| 51. | 96753 | 4.7% | 4.7%(+0.000)#51 | 4.1%(+0.596)#7,889 |
| 52. | 96717 | 4.6% | 4.7%(-0.160)#52 | 4.1%(+0.436)#8,426 |
| 53. | 96772 | 4.5% | 4.7%(-0.244)#53 | 4.1%(+0.352)#8,712 |
| 54. | 96766 | 4.4% | 4.7%(-0.314)#54 | 4.1%(+0.282)#8,947 |
| 55. | 96749 | 4.3% | 4.7%(-0.475)#55 | 4.1%(+0.122)#9,557 |
| 56. | 96706 | 4.3% | 4.7%(-0.489)#56 | 4.1%(+0.108)#9,599 |
| 57. | 96714 | 4.2% | 4.7%(-0.549)#57 | 4.1%(+0.047)#9,835 |
| 58. | 96816 | 4.2% | 4.7%(-0.570)#58 | 4.1%(+0.027)#9,935 |
| 59. | 96746 | 4.2% | 4.7%(-0.571)#59 | 4.1%(+0.025)#9,941 |
| 60. | 96826 | 4.1% | 4.7%(-0.598)#60 | 4.1%(-0.002)#10,050 |
| 61. | 96825 | 4.1% | 4.7%(-0.614)#61 | 4.1%(-0.017)#10,111 |
| 62. | 96818 | 4.0% | 4.7%(-0.722)#62 | 4.1%(-0.126)#10,596 |
| 63. | 96720 | 4.0% | 4.7%(-0.740)#63 | 4.1%(-0.144)#10,664 |
| 64. | 96791 | 4.0% | 4.7%(-0.772)#64 | 4.1%(-0.176)#10,806 |
| 65. | 96768 | 3.9% | 4.7%(-0.862)#65 | 4.1%(-0.266)#11,190 |
| 66. | 96744 | 3.8% | 4.7%(-0.969)#66 | 4.1%(-0.373)#11,646 |
| 67. | 96707 | 3.7% | 4.7%(-1.02)#67 | 4.1%(-0.420)#11,868 |
| 68. | 96782 | 3.7% | 4.7%(-1.07)#68 | 4.1%(-0.477)#12,131 |
| 69. | 96817 | 3.7% | 4.7%(-1.10)#69 | 4.1%(-0.499)#12,229 |
| 70. | 96813 | 3.6% | 4.7%(-1.11)#70 | 4.1%(-0.511)#12,284 |
| 71. | 96729 | 3.6% | 4.7%(-1.12)#71 | 4.1%(-0.528)#12,374 |
| 72. | 96795 | 3.4% | 4.7%(-1.30)#72 | 4.1%(-0.703)#13,233 |
| 73. | 96822 | 2.9% | 4.7%(-1.83)#73 | 4.1%(-1.24)#15,923 |
| 74. | 96789 | 2.8% | 4.7%(-1.99)#74 | 4.1%(-1.39)#16,806 |
| 75. | 96701 | 2.7% | 4.7%(-2.00)#75 | 4.1%(-1.41)#16,878 |
| 76. | 96743 | 2.7% | 4.7%(-2.02)#76 | 4.1%(-1.42)#16,932 |
| 77. | 96731 | 2.7% | 4.7%(-2.03)#77 | 4.1%(-1.43)#16,981 |
| 78. | 96734 | 2.7% | 4.7%(-2.04)#78 | 4.1%(-1.44)#17,039 |
| 79. | 96730 | 2.7% | 4.7%(-2.07)#79 | 4.1%(-1.48)#17,212 |
| 80. | 96737 | 2.5% | 4.7%(-2.22)#80 | 4.1%(-1.62)#17,982 |
| 81. | 96748 | 2.5% | 4.7%(-2.26)#81 | 4.1%(-1.67)#18,228 |
| 82. | 96821 | 2.1% | 4.7%(-2.68)#82 | 4.1%(-2.08)#20,295 |
| 83. | 96777 | 2.0% | 4.7%(-2.76)#83 | 4.1%(-2.16)#20,690 |
| 84. | 96728 | 0.96% | 4.7%(-3.79)#84 | 4.1%(-3.19)#24,642 |
1
Common Questions
What are the Top 10 Zip Codes with the Highest Percentage of Population Employed in Administrative & Support Services in Hawaii?
Top 10 Zip Codes with the Highest Percentage of Population Employed in Administrative & Support Services in Hawaii are:
What zip code has the Highest Percentage of Population Employed in Administrative & Support Services in Hawaii?
96742 has the Highest Percentage of Population Employed in Administrative & Support Services in Hawaii with 22.2%.
What is the Percentage of Population Employed in Administrative & Support Services in the State of Hawaii?
Percentage of Population Employed in Administrative & Support Services in Hawaii is 4.7%.
What is the Percentage of Population Employed in Administrative & Support Services in the United States?
Percentage of Population Employed in Administrative & Support Services in the United States is 4.1%.