Zip Codes with the Highest Percentage of Population Employed in Administrative & Support Services in Garland, TX
RELATED REPORTS & OPTIONS
Administrative & Support Services
Garland
Compare Zip Codes
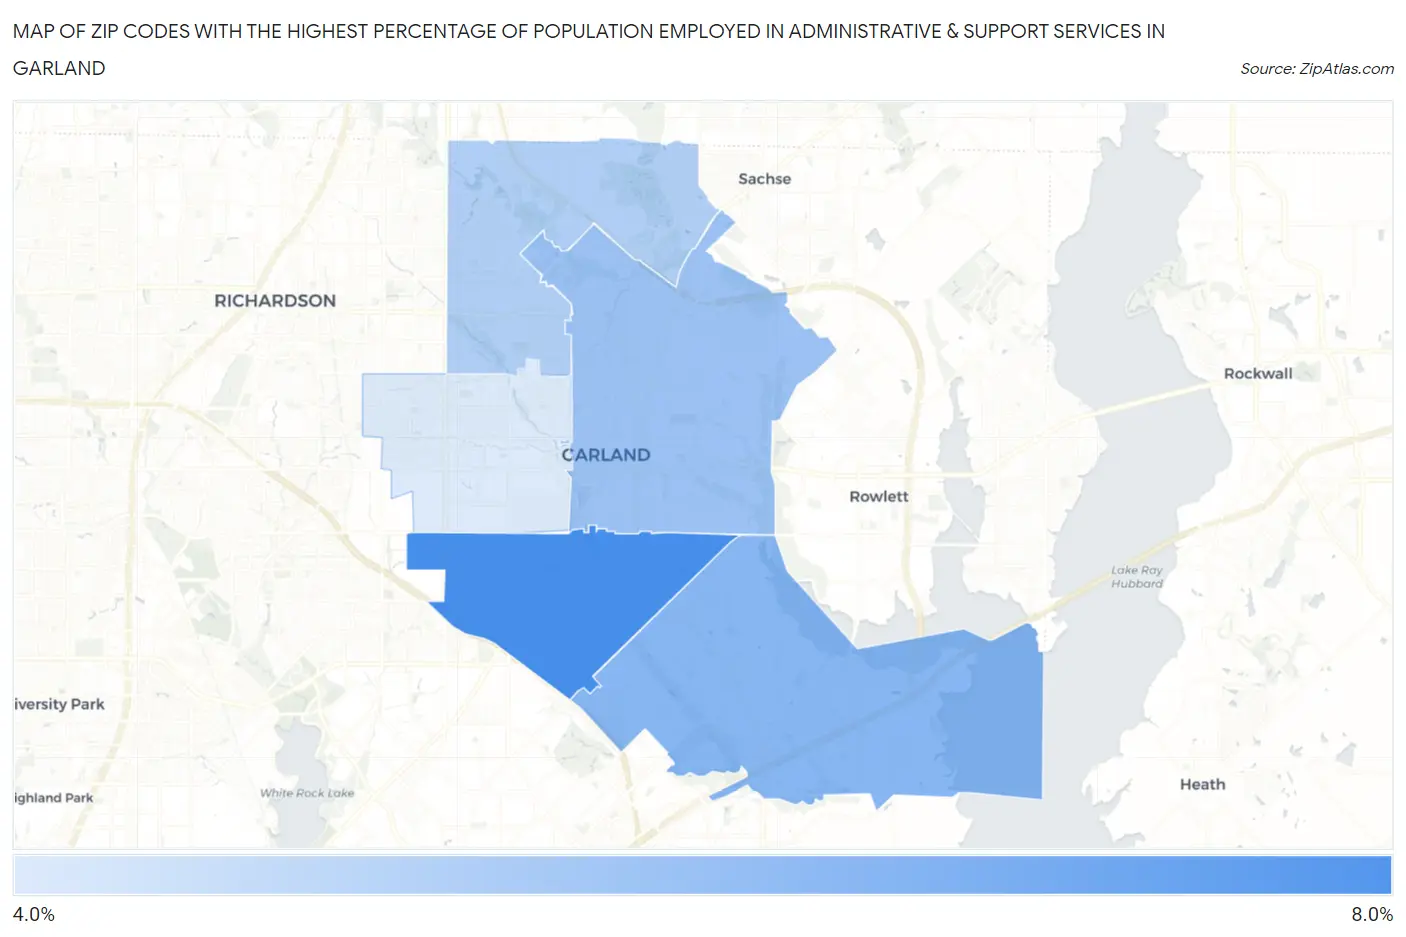
Map of Zip Codes with the Highest Percentage of Population Employed in Administrative & Support Services in Garland
0.0%
8.0%
Zip Codes with the Highest Percentage of Population Employed in Administrative & Support Services in Garland, TX
| Zip Code | % Employed | vs State | vs National | |
| 1. | 75041 | 6.4% | 4.4%(+2.00)#297 | 4.1%(+2.26)#4,053 |
| 2. | 75043 | 5.8% | 4.4%(+1.37)#386 | 4.1%(+1.64)#5,175 |
| 3. | 75040 | 5.6% | 4.4%(+1.16)#411 | 4.1%(+1.42)#5,648 |
| 4. | 75044 | 5.4% | 4.4%(+0.960)#447 | 4.1%(+1.23)#6,132 |
| 5. | 75042 | 5.0% | 4.4%(+0.544)#532 | 4.1%(+0.810)#7,210 |
1
Common Questions
What are the Top 3 Zip Codes with the Highest Percentage of Population Employed in Administrative & Support Services in Garland, TX?
Top 3 Zip Codes with the Highest Percentage of Population Employed in Administrative & Support Services in Garland, TX are:
What zip code has the Highest Percentage of Population Employed in Administrative & Support Services in Garland, TX?
75041 has the Highest Percentage of Population Employed in Administrative & Support Services in Garland, TX with 6.4%.
What is the Percentage of Population Employed in Administrative & Support Services in Garland, TX?
Percentage of Population Employed in Administrative & Support Services in Garland is 5.6%.
What is the Percentage of Population Employed in Administrative & Support Services in Texas?
Percentage of Population Employed in Administrative & Support Services in Texas is 4.4%.
What is the Percentage of Population Employed in Administrative & Support Services in the United States?
Percentage of Population Employed in Administrative & Support Services in the United States is 4.1%.