Zip Codes with the Highest Percentage of Population Employed in Administrative & Support Services in Weatherford, TX
RELATED REPORTS & OPTIONS
Administrative & Support Services
Weatherford
Compare Zip Codes
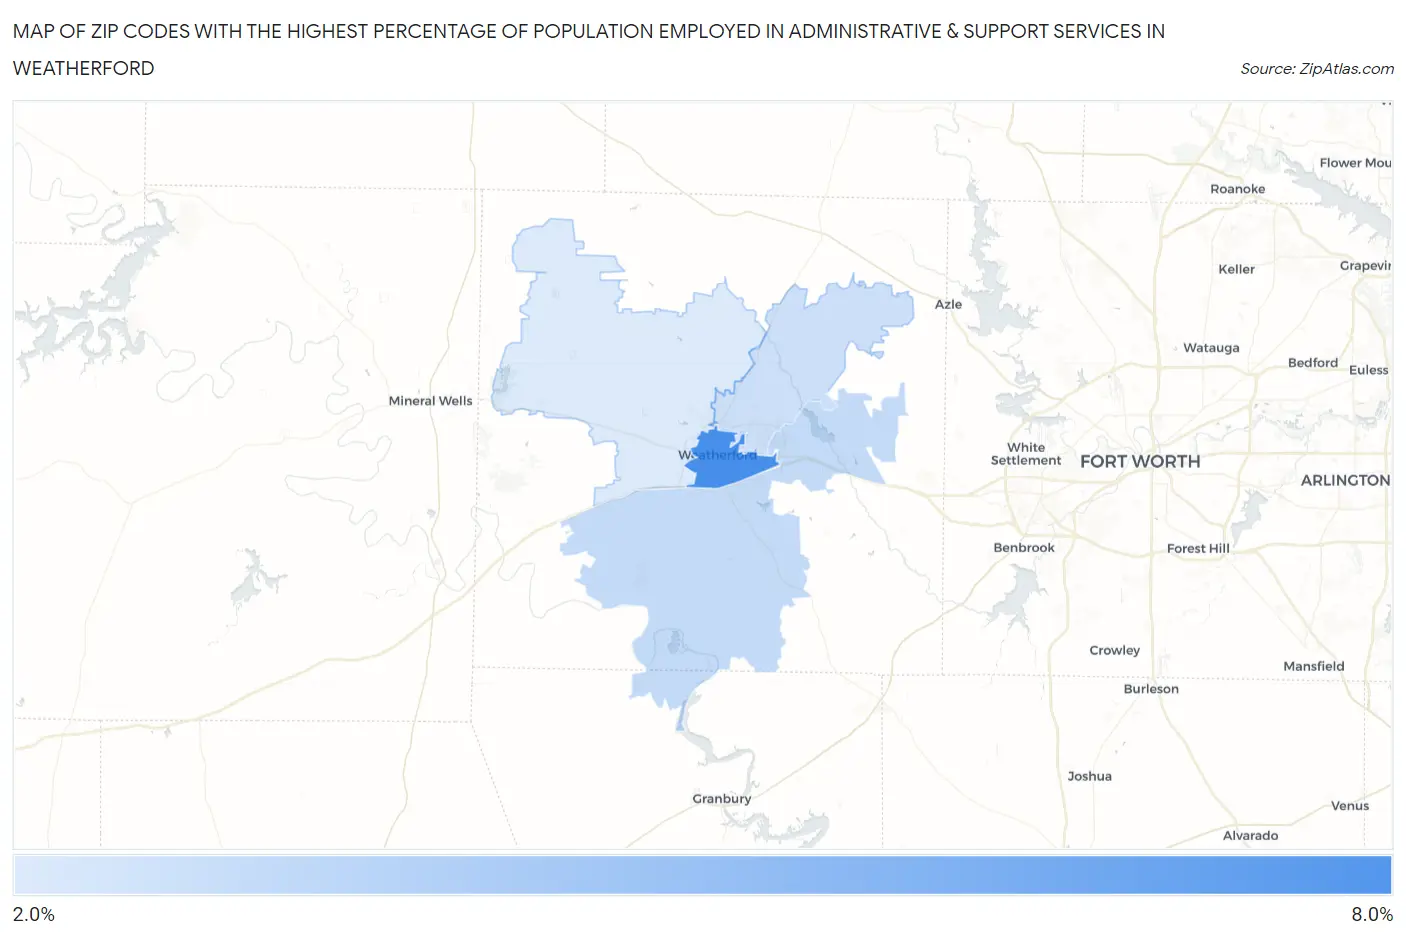
Map of Zip Codes with the Highest Percentage of Population Employed in Administrative & Support Services in Weatherford
0.0%
8.0%
Zip Codes with the Highest Percentage of Population Employed in Administrative & Support Services in Weatherford, TX
| Zip Code | % Employed | vs State | vs National | |
| 1. | 76086 | 7.8% | 4.4%(+3.38)#170 | 4.1%(+3.64)#2,427 |
| 2. | 76087 | 3.8% | 4.4%(-0.652)#804 | 4.1%(-0.386)#11,696 |
| 3. | 76085 | 3.5% | 4.4%(-0.929)#880 | 4.1%(-0.663)#13,033 |
| 4. | 76088 | 3.0% | 4.4%(-1.46)#1,053 | 4.1%(-1.20)#15,710 |
1
Common Questions
What are the Top 3 Zip Codes with the Highest Percentage of Population Employed in Administrative & Support Services in Weatherford, TX?
Top 3 Zip Codes with the Highest Percentage of Population Employed in Administrative & Support Services in Weatherford, TX are:
What zip code has the Highest Percentage of Population Employed in Administrative & Support Services in Weatherford, TX?
76086 has the Highest Percentage of Population Employed in Administrative & Support Services in Weatherford, TX with 7.8%.
What is the Percentage of Population Employed in Administrative & Support Services in Weatherford, TX?
Percentage of Population Employed in Administrative & Support Services in Weatherford is 6.1%.
What is the Percentage of Population Employed in Administrative & Support Services in Texas?
Percentage of Population Employed in Administrative & Support Services in Texas is 4.4%.
What is the Percentage of Population Employed in Administrative & Support Services in the United States?
Percentage of Population Employed in Administrative & Support Services in the United States is 4.1%.