Zip Codes with the Highest Percentage of Population Employed in Administrative & Support Services in Pearland, TX
RELATED REPORTS & OPTIONS
Administrative & Support Services
Pearland
Compare Zip Codes
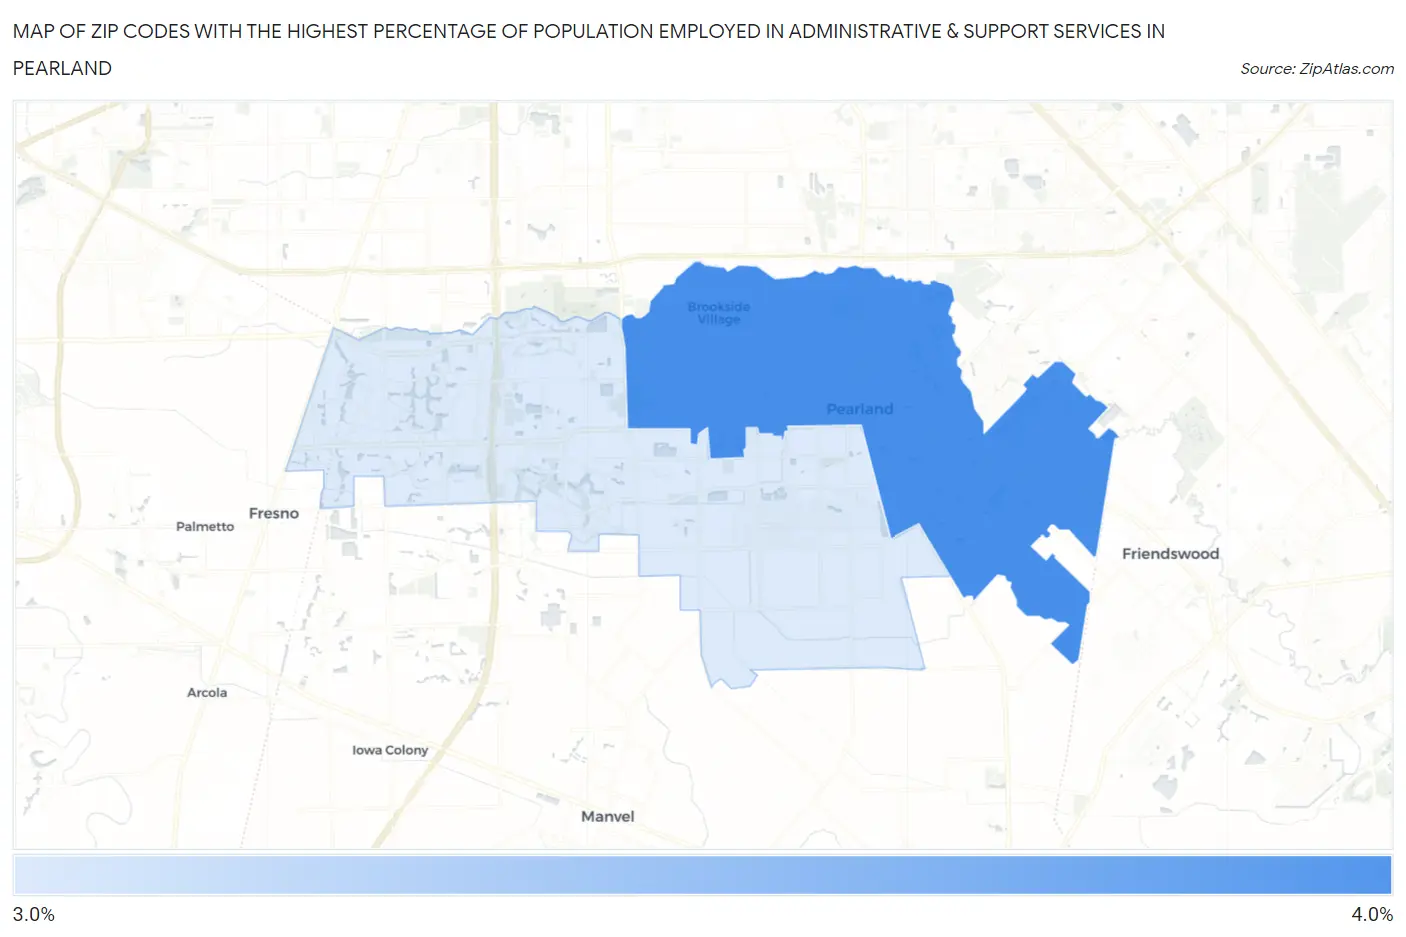
Map of Zip Codes with the Highest Percentage of Population Employed in Administrative & Support Services in Pearland
0.0%
4.0%
Zip Codes with the Highest Percentage of Population Employed in Administrative & Support Services in Pearland, TX
| Zip Code | % Employed | vs State | vs National | |
| 1. | 77581 | 3.2% | 4.4%(-1.19)#959 | 4.1%(-0.921)#14,318 |
| 2. | 77584 | 3.1% | 4.4%(-1.34)#1,009 | 4.1%(-1.07)#15,122 |
1
Common Questions
What are the Top Zip Codes with the Highest Percentage of Population Employed in Administrative & Support Services in Pearland, TX?
Top Zip Codes with the Highest Percentage of Population Employed in Administrative & Support Services in Pearland, TX are:
What zip code has the Highest Percentage of Population Employed in Administrative & Support Services in Pearland, TX?
77581 has the Highest Percentage of Population Employed in Administrative & Support Services in Pearland, TX with 3.2%.
What is the Percentage of Population Employed in Administrative & Support Services in Pearland, TX?
Percentage of Population Employed in Administrative & Support Services in Pearland is 2.8%.
What is the Percentage of Population Employed in Administrative & Support Services in Texas?
Percentage of Population Employed in Administrative & Support Services in Texas is 4.4%.
What is the Percentage of Population Employed in Administrative & Support Services in the United States?
Percentage of Population Employed in Administrative & Support Services in the United States is 4.1%.