Cities with the Largest Mexican Community in Alabama
RELATED REPORTS & OPTIONS
Mexican
Alabama
Compare Cities
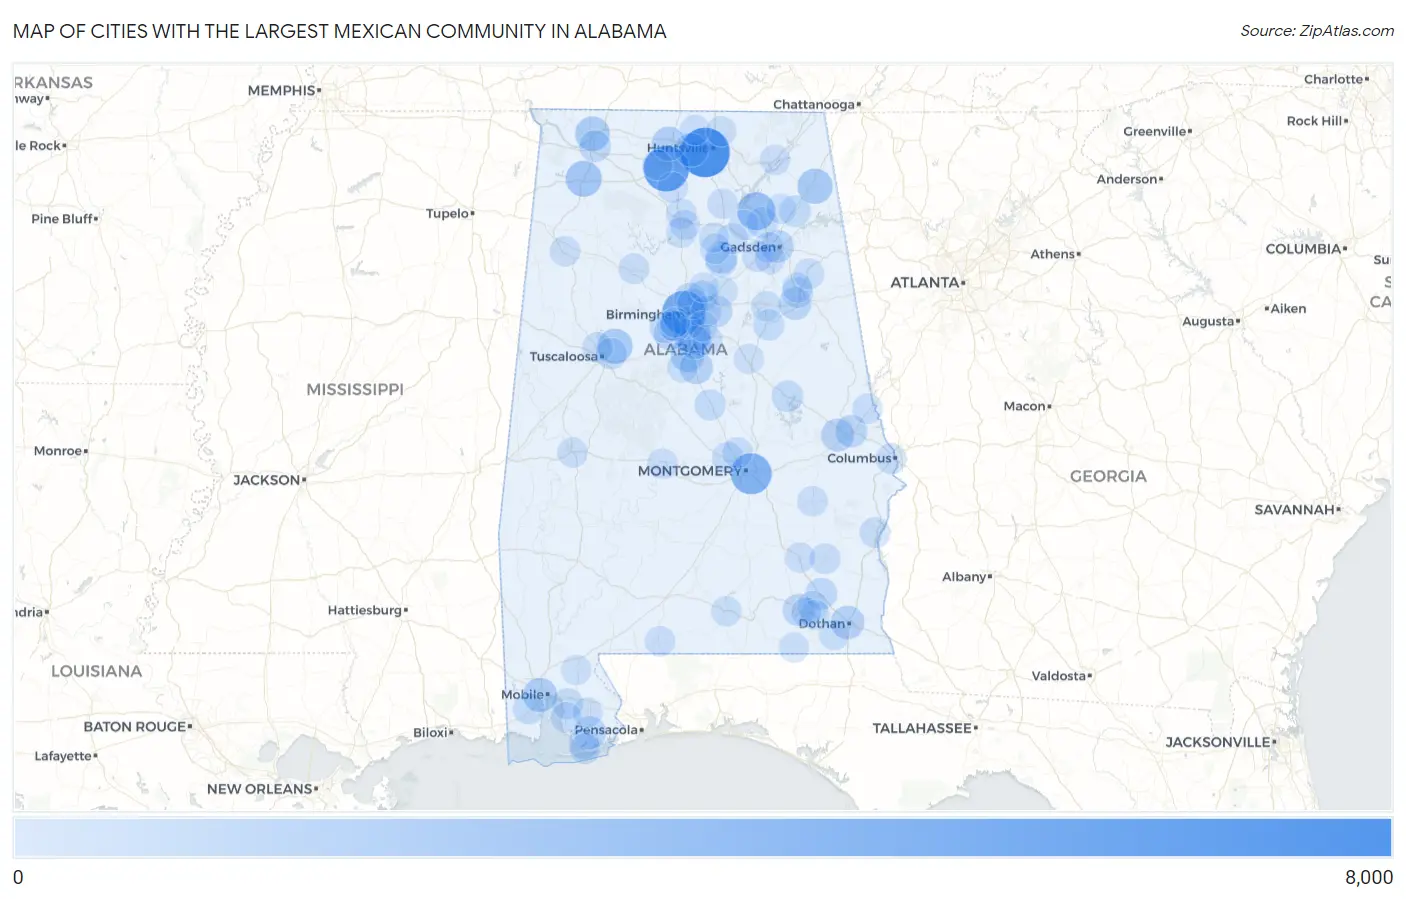
Map of Cities with the Largest Mexican Community in Alabama
0
8,000
Cities with the Largest Mexican Community in Alabama
| City | Mexican | vs State | vs National | |
| 1. | Huntsville | 7,376 | 135,823(5.43%)#1 | 37,145,956(0.02%)#687 |
| 2. | Decatur | 5,890 | 135,823(4.34%)#2 | 37,145,956(0.02%)#810 |
| 3. | Birmingham | 5,026 | 135,823(3.70%)#3 | 37,145,956(0.01%)#924 |
| 4. | Montgomery | 4,093 | 135,823(3.01%)#4 | 37,145,956(0.01%)#1,064 |
| 5. | Albertville | 3,031 | 135,823(2.23%)#5 | 37,145,956(0.01%)#1,351 |
| 6. | Hoover | 2,487 | 135,823(1.83%)#6 | 37,145,956(0.01%)#1,542 |
| 7. | Russellville | 2,300 | 135,823(1.69%)#7 | 37,145,956(0.01%)#1,636 |
| 8. | Fort Payne | 1,985 | 135,823(1.46%)#8 | 37,145,956(0.01%)#1,831 |
| 9. | Tuscaloosa | 1,931 | 135,823(1.42%)#9 | 37,145,956(0.01%)#1,867 |
| 10. | Florence | 1,814 | 135,823(1.34%)#10 | 37,145,956(0.00%)#1,930 |
| 11. | Athens | 1,671 | 135,823(1.23%)#11 | 37,145,956(0.00%)#2,039 |
| 12. | Mobile | 1,592 | 135,823(1.17%)#12 | 37,145,956(0.00%)#2,100 |
| 13. | Alabaster | 1,466 | 135,823(1.08%)#13 | 37,145,956(0.00%)#2,218 |
| 14. | Dothan | 1,408 | 135,823(1.04%)#14 | 37,145,956(0.00%)#2,276 |
| 15. | Madison | 1,395 | 135,823(1.03%)#15 | 37,145,956(0.00%)#2,296 |
| 16. | Calera | 1,297 | 135,823(0.95%)#16 | 37,145,956(0.00%)#2,390 |
| 17. | Pelham | 1,149 | 135,823(0.85%)#17 | 37,145,956(0.00%)#2,581 |
| 18. | Auburn | 1,124 | 135,823(0.83%)#18 | 37,145,956(0.00%)#2,616 |
| 19. | Bessemer | 1,076 | 135,823(0.79%)#19 | 37,145,956(0.00%)#2,710 |
| 20. | Gadsden | 1,056 | 135,823(0.78%)#20 | 37,145,956(0.00%)#2,742 |
| 21. | Oxford | 1,030 | 135,823(0.76%)#21 | 37,145,956(0.00%)#2,786 |
| 22. | Foley | 1,006 | 135,823(0.74%)#22 | 37,145,956(0.00%)#2,827 |
| 23. | Opelika | 981 | 135,823(0.72%)#23 | 37,145,956(0.00%)#2,869 |
| 24. | Homewood | 924 | 135,823(0.68%)#24 | 37,145,956(0.00%)#2,964 |
| 25. | Enterprise | 914 | 135,823(0.67%)#25 | 37,145,956(0.00%)#2,986 |
| 26. | Leeds | 848 | 135,823(0.62%)#26 | 37,145,956(0.00%)#3,126 |
| 27. | Fultondale | 801 | 135,823(0.59%)#27 | 37,145,956(0.00%)#3,230 |
| 28. | Oneonta | 746 | 135,823(0.55%)#28 | 37,145,956(0.00%)#3,384 |
| 29. | Muscle Shoals | 740 | 135,823(0.54%)#29 | 37,145,956(0.00%)#3,401 |
| 30. | Ozark | 733 | 135,823(0.54%)#30 | 37,145,956(0.00%)#3,420 |
| 31. | Collinsville | 683 | 135,823(0.50%)#31 | 37,145,956(0.00%)#3,555 |
| 32. | Alexander City | 671 | 135,823(0.49%)#32 | 37,145,956(0.00%)#3,596 |
| 33. | Allgood | 671 | 135,823(0.49%)#33 | 37,145,956(0.00%)#3,598 |
| 34. | Hueytown | 632 | 135,823(0.47%)#34 | 37,145,956(0.00%)#3,729 |
| 35. | Holt | 613 | 135,823(0.45%)#35 | 37,145,956(0.00%)#3,803 |
| 36. | Center Point | 612 | 135,823(0.45%)#36 | 37,145,956(0.00%)#3,805 |
| 37. | Tillmans Corner | 586 | 135,823(0.43%)#37 | 37,145,956(0.00%)#3,909 |
| 38. | Boaz | 554 | 135,823(0.41%)#38 | 37,145,956(0.00%)#4,036 |
| 39. | Talladega | 547 | 135,823(0.40%)#39 | 37,145,956(0.00%)#4,066 |
| 40. | Prattville | 546 | 135,823(0.40%)#40 | 37,145,956(0.00%)#4,069 |
| 41. | Anniston | 540 | 135,823(0.40%)#41 | 37,145,956(0.00%)#4,097 |
| 42. | Daphne | 507 | 135,823(0.37%)#42 | 37,145,956(0.00%)#4,233 |
| 43. | Clanton | 499 | 135,823(0.37%)#43 | 37,145,956(0.00%)#4,274 |
| 44. | Brighton | 494 | 135,823(0.36%)#44 | 37,145,956(0.00%)#4,299 |
| 45. | Steele | 458 | 135,823(0.34%)#45 | 37,145,956(0.00%)#4,486 |
| 46. | Lipscomb | 448 | 135,823(0.33%)#46 | 37,145,956(0.00%)#4,535 |
| 47. | Fairhope | 446 | 135,823(0.33%)#47 | 37,145,956(0.00%)#4,542 |
| 48. | Susan Moore | 445 | 135,823(0.33%)#48 | 37,145,956(0.00%)#4,550 |
| 49. | Phenix City | 422 | 135,823(0.31%)#49 | 37,145,956(0.00%)#4,697 |
| 50. | Jasper | 422 | 135,823(0.31%)#50 | 37,145,956(0.00%)#4,701 |
| 51. | Tarrant | 409 | 135,823(0.30%)#51 | 37,145,956(0.00%)#4,780 |
| 52. | Irondale | 404 | 135,823(0.30%)#52 | 37,145,956(0.00%)#4,817 |
| 53. | Eufaula | 401 | 135,823(0.30%)#53 | 37,145,956(0.00%)#4,841 |
| 54. | Bon Secour | 396 | 135,823(0.29%)#54 | 37,145,956(0.00%)#4,884 |
| 55. | Jacksonville | 385 | 135,823(0.28%)#55 | 37,145,956(0.00%)#4,952 |
| 56. | Gulf Shores | 384 | 135,823(0.28%)#56 | 37,145,956(0.00%)#4,958 |
| 57. | Northport | 374 | 135,823(0.28%)#57 | 37,145,956(0.00%)#5,028 |
| 58. | Clio | 367 | 135,823(0.27%)#58 | 37,145,956(0.00%)#5,072 |
| 59. | South Vinemont | 344 | 135,823(0.25%)#59 | 37,145,956(0.00%)#5,237 |
| 60. | Good Hope | 340 | 135,823(0.25%)#60 | 37,145,956(0.00%)#5,260 |
| 61. | Arab | 337 | 135,823(0.25%)#61 | 37,145,956(0.00%)#5,284 |
| 62. | Hartselle | 333 | 135,823(0.25%)#62 | 37,145,956(0.00%)#5,312 |
| 63. | Attalla | 331 | 135,823(0.24%)#63 | 37,145,956(0.00%)#5,330 |
| 64. | Selma | 329 | 135,823(0.24%)#64 | 37,145,956(0.00%)#5,346 |
| 65. | Millbrook | 321 | 135,823(0.24%)#65 | 37,145,956(0.00%)#5,412 |
| 66. | Union Springs | 321 | 135,823(0.24%)#66 | 37,145,956(0.00%)#5,418 |
| 67. | Harvest | 311 | 135,823(0.23%)#67 | 37,145,956(0.00%)#5,494 |
| 68. | Rainbow City | 307 | 135,823(0.23%)#68 | 37,145,956(0.00%)#5,528 |
| 69. | Scottsboro | 302 | 135,823(0.22%)#69 | 37,145,956(0.00%)#5,562 |
| 70. | Fort Rucker | 286 | 135,823(0.21%)#70 | 37,145,956(0.00%)#5,724 |
| 71. | Lanett | 272 | 135,823(0.20%)#71 | 37,145,956(0.00%)#5,851 |
| 72. | Cleveland | 268 | 135,823(0.20%)#72 | 37,145,956(0.00%)#5,902 |
| 73. | Andalusia | 266 | 135,823(0.20%)#73 | 37,145,956(0.00%)#5,919 |
| 74. | Lincoln | 262 | 135,823(0.19%)#74 | 37,145,956(0.00%)#5,960 |
| 75. | East Brewton | 262 | 135,823(0.19%)#75 | 37,145,956(0.00%)#5,961 |
| 76. | Brook Highland | 260 | 135,823(0.19%)#76 | 37,145,956(0.00%)#5,980 |
| 77. | Guin | 257 | 135,823(0.19%)#77 | 37,145,956(0.00%)#6,011 |
| 78. | Demopolis | 256 | 135,823(0.19%)#78 | 37,145,956(0.00%)#6,020 |
| 79. | Moores Mill | 246 | 135,823(0.18%)#79 | 37,145,956(0.00%)#6,139 |
| 80. | Chelsea | 243 | 135,823(0.18%)#80 | 37,145,956(0.00%)#6,174 |
| 81. | Malvern | 241 | 135,823(0.18%)#81 | 37,145,956(0.00%)#6,205 |
| 82. | Cullman | 240 | 135,823(0.18%)#82 | 37,145,956(0.00%)#6,213 |
| 83. | Brundidge | 239 | 135,823(0.18%)#83 | 37,145,956(0.00%)#6,230 |
| 84. | Mccalla | 236 | 135,823(0.17%)#84 | 37,145,956(0.00%)#6,256 |
| 85. | Bay Minette | 228 | 135,823(0.17%)#85 | 37,145,956(0.00%)#6,360 |
| 86. | Sylacauga | 224 | 135,823(0.16%)#86 | 37,145,956(0.00%)#6,410 |
| 87. | Saks | 224 | 135,823(0.16%)#87 | 37,145,956(0.00%)#6,412 |
| 88. | Montevallo | 220 | 135,823(0.16%)#88 | 37,145,956(0.00%)#6,463 |
| 89. | Trinity | 220 | 135,823(0.16%)#89 | 37,145,956(0.00%)#6,468 |
| 90. | Daleville | 213 | 135,823(0.16%)#90 | 37,145,956(0.00%)#6,583 |
| 91. | Blountsville | 206 | 135,823(0.15%)#91 | 37,145,956(0.00%)#6,690 |
| 92. | Mount Olive Cdp Jefferson County | 202 | 135,823(0.15%)#92 | 37,145,956(0.00%)#6,742 |
| 93. | Argo | 196 | 135,823(0.14%)#93 | 37,145,956(0.00%)#6,823 |
| 94. | Midfield | 193 | 135,823(0.14%)#94 | 37,145,956(0.00%)#6,870 |
| 95. | Geneva | 193 | 135,823(0.14%)#95 | 37,145,956(0.00%)#6,872 |
| 96. | Douglas | 192 | 135,823(0.14%)#96 | 37,145,956(0.00%)#6,892 |
| 97. | Level Plains | 190 | 135,823(0.14%)#97 | 37,145,956(0.00%)#6,920 |
| 98. | Pinson | 188 | 135,823(0.14%)#98 | 37,145,956(0.00%)#6,953 |
| 99. | Crossville | 185 | 135,823(0.14%)#99 | 37,145,956(0.00%)#7,014 |
| 100. | Robertsdale | 175 | 135,823(0.13%)#100 | 37,145,956(0.00%)#7,171 |
Common Questions
What are the Top 10 Cities with the Largest Mexican Community in Alabama?
Top 10 Cities with the Largest Mexican Community in Alabama are:
#1
7,376
#2
5,890
#3
5,026
#4
4,093
#5
3,031
#6
2,487
#7
2,300
#8
1,985
#9
1,931
#10
1,814
What city has the Largest Mexican Community in Alabama?
Huntsville has the Largest Mexican Community in Alabama with 7,376.
What is the Total Mexican Population in the State of Alabama?
Total Mexican Population in Alabama is 135,823.
What is the Total Mexican Population in the United States?
Total Mexican Population in the United States is 37,145,956.