Taylor borough, PA
Taylor borough Overview
6,274
TOTAL POPULATION
3,102
MALE POPULATION
3,172
FEMALE POPULATION
97.79
MALES / 100 FEMALES
102.26
FEMALES / 100 MALES
38.4
MEDIAN AGE
2.9
AVG FAMILY SIZE
2.5
AVG HOUSEHOLD SIZE
$31,708
PER CAPITA INCOME
$57,209
AVG FAMILY INCOME
$57,667
AVG HOUSEHOLD INCOME
13.6%
WAGE / INCOME GAP [ % ]
86.4¢/ $1
WAGE / INCOME GAP [ $ ]
0.48
INEQUALITY / GINI INDEX
2,912
LABOR FORCE [ PEOPLE ]
57.7%
PERCENT IN LABOR FORCE
9.5%
UNEMPLOYMENT RATE
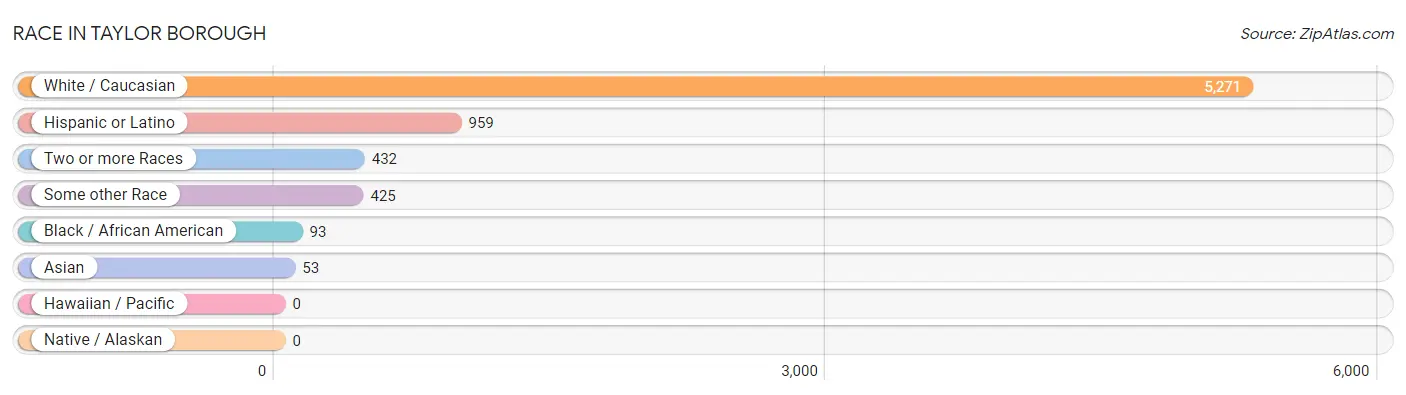
Race in Taylor borough
The most populous races in Taylor borough are White / Caucasian (5,271 | 84.0%), Hispanic or Latino (959 | 15.3%), and Two or more Races (432 | 6.9%).
| Race | # Population | % Population |
| Asian | 53 | 0.8% |
| Black / African American | 93 | 1.5% |
| Hawaiian / Pacific | 0 | 0.0% |
| Hispanic or Latino | 959 | 15.3% |
| Native / Alaskan | 0 | 0.0% |
| White / Caucasian | 5,271 | 84.0% |
| Two or more Races | 432 | 6.9% |
| Some other Race | 425 | 6.8% |
| Total | 6,274 | 100.0% |
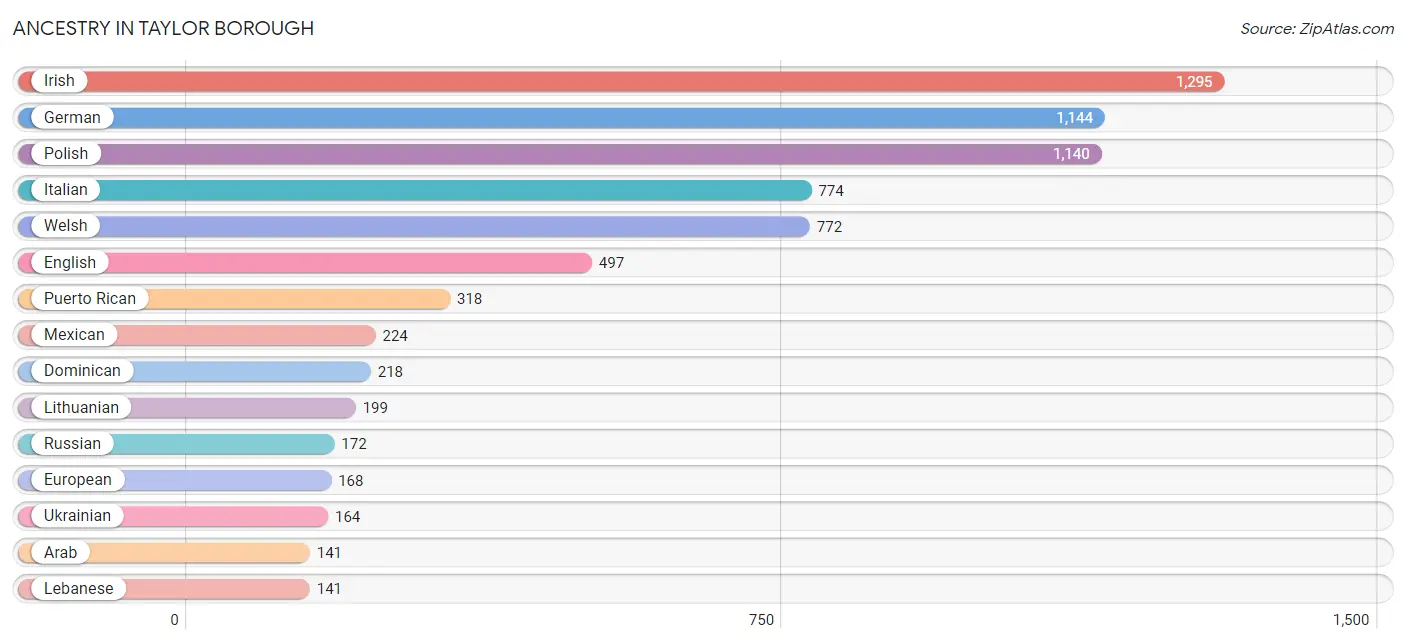
Ancestry in Taylor borough
The most populous ancestries reported in Taylor borough are Irish (1,295 | 20.6%), German (1,144 | 18.2%), Polish (1,140 | 18.2%), Italian (774 | 12.3%), and Welsh (772 | 12.3%), together accounting for 81.7% of all Taylor borough residents.
| Ancestry | # Population | % Population |
| American | 20 | 0.3% |
| Arab | 141 | 2.2% |
| Central American | 138 | 2.2% |
| Cherokee | 19 | 0.3% |
| Colombian | 61 | 1.0% |
| Czechoslovakian | 12 | 0.2% |
| Dominican | 218 | 3.5% |
| Dutch | 36 | 0.6% |
| Eastern European | 16 | 0.3% |
| English | 497 | 7.9% |
| European | 168 | 2.7% |
| French | 64 | 1.0% |
| German | 1,144 | 18.2% |
| Greek | 14 | 0.2% |
| Honduran | 70 | 1.1% |
| Irish | 1,295 | 20.6% |
| Iroquois | 7 | 0.1% |
| Israeli | 34 | 0.5% |
| Italian | 774 | 12.3% |
| Lebanese | 141 | 2.2% |
| Lithuanian | 199 | 3.2% |
| Mexican | 224 | 3.6% |
| Pakistani | 13 | 0.2% |
| Polish | 1,140 | 18.2% |
| Puerto Rican | 318 | 5.1% |
| Russian | 172 | 2.7% |
| Salvadoran | 68 | 1.1% |
| Scottish | 64 | 1.0% |
| Slavic | 20 | 0.3% |
| Slovak | 74 | 1.2% |
| South American | 61 | 1.0% |
| Swiss | 67 | 1.1% |
| Ukrainian | 164 | 2.6% |
| Welsh | 772 | 12.3% | View All 34 Rows |
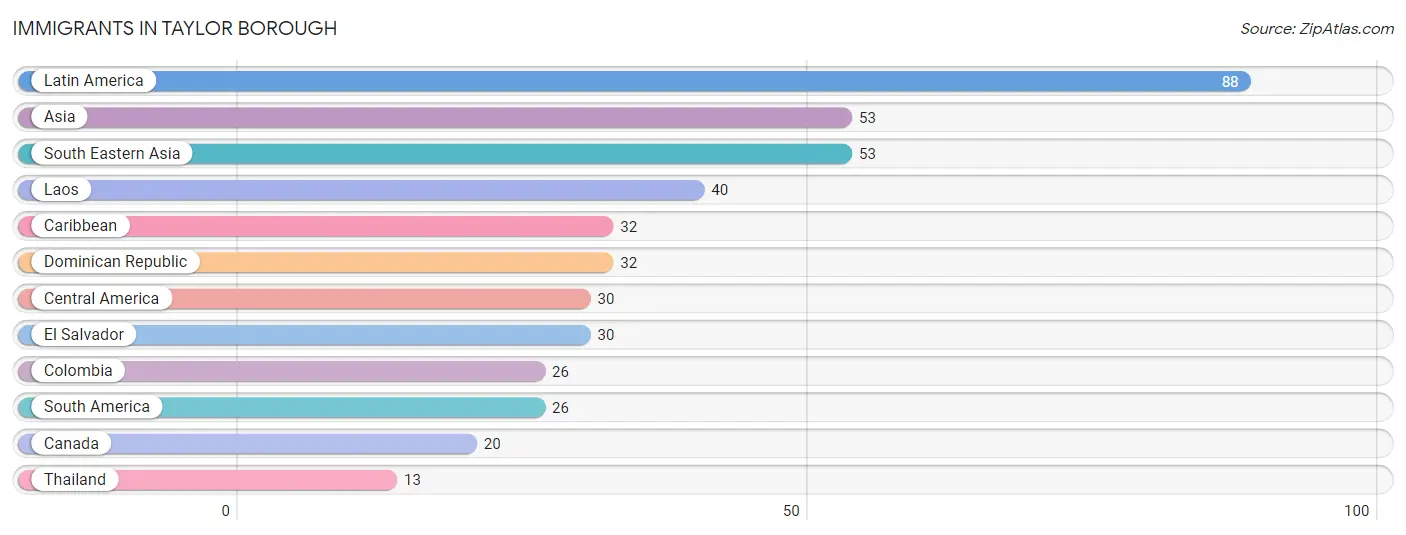
Immigrants in Taylor borough
The most numerous immigrant groups reported in Taylor borough came from Latin America (88 | 1.4%), Asia (53 | 0.8%), South Eastern Asia (53 | 0.8%), Laos (40 | 0.6%), and Caribbean (32 | 0.5%), together accounting for 4.2% of all Taylor borough residents.
| Immigration Origin | # Population | % Population |
| Asia | 53 | 0.8% |
| Canada | 20 | 0.3% |
| Caribbean | 32 | 0.5% |
| Central America | 30 | 0.5% |
| Colombia | 26 | 0.4% |
| Dominican Republic | 32 | 0.5% |
| El Salvador | 30 | 0.5% |
| Laos | 40 | 0.6% |
| Latin America | 88 | 1.4% |
| South America | 26 | 0.4% |
| South Eastern Asia | 53 | 0.8% |
| Thailand | 13 | 0.2% | View All 12 Rows |
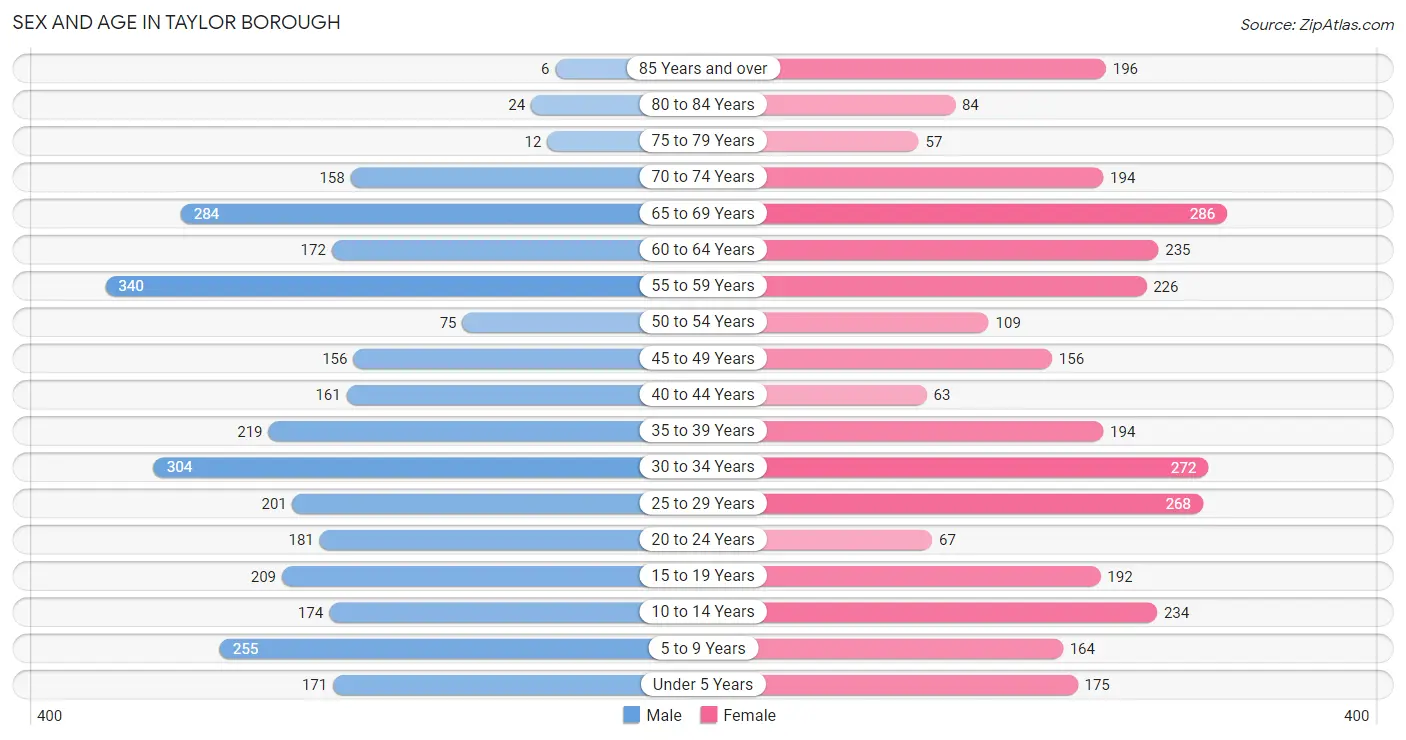
Sex and Age in Taylor borough
Sex and Age in Taylor borough
The most populous age groups in Taylor borough are 55 to 59 Years (340 | 11.0%) for men and 65 to 69 Years (286 | 9.0%) for women.
| Age Bracket | Male | Female |
| Under 5 Years | 171 (5.5%) | 175 (5.5%) |
| 5 to 9 Years | 255 (8.2%) | 164 (5.2%) |
| 10 to 14 Years | 174 (5.6%) | 234 (7.4%) |
| 15 to 19 Years | 209 (6.7%) | 192 (6.0%) |
| 20 to 24 Years | 181 (5.8%) | 67 (2.1%) |
| 25 to 29 Years | 201 (6.5%) | 268 (8.5%) |
| 30 to 34 Years | 304 (9.8%) | 272 (8.6%) |
| 35 to 39 Years | 219 (7.1%) | 194 (6.1%) |
| 40 to 44 Years | 161 (5.2%) | 63 (2.0%) |
| 45 to 49 Years | 156 (5.0%) | 156 (4.9%) |
| 50 to 54 Years | 75 (2.4%) | 109 (3.4%) |
| 55 to 59 Years | 340 (11.0%) | 226 (7.1%) |
| 60 to 64 Years | 172 (5.5%) | 235 (7.4%) |
| 65 to 69 Years | 284 (9.2%) | 286 (9.0%) |
| 70 to 74 Years | 158 (5.1%) | 194 (6.1%) |
| 75 to 79 Years | 12 (0.4%) | 57 (1.8%) |
| 80 to 84 Years | 24 (0.8%) | 84 (2.6%) |
| 85 Years and over | 6 (0.2%) | 196 (6.2%) |
| Total | 3,102 (100.0%) | 3,172 (100.0%) |
Families and Households in Taylor borough
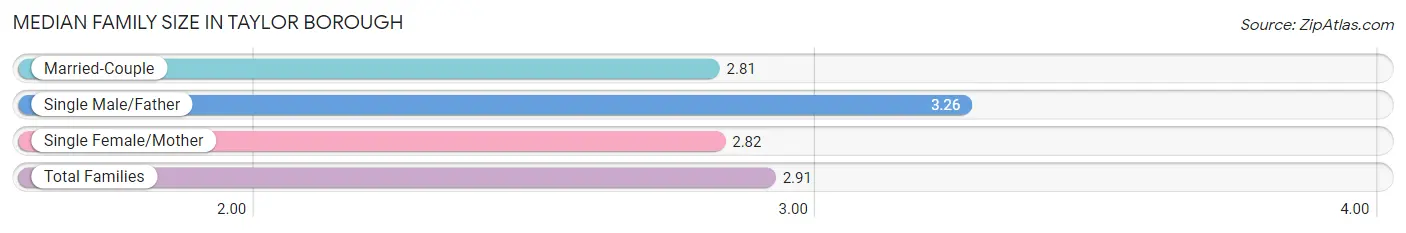
Median Family Size in Taylor borough
The median family size in Taylor borough is 2.91 persons per family, with single male/father families (382 | 21.9%) accounting for the largest median family size of 3.26 persons per family. On the other hand, married-couple families (907 | 52.0%) represent the smallest median family size with 2.81 persons per family.
| Family Type | # Families | Family Size |
| Married-Couple | 907 (52.0%) | 2.81 |
| Single Male/Father | 382 (21.9%) | 3.26 |
| Single Female/Mother | 455 (26.1%) | 2.82 |
| Total Families | 1,744 (100.0%) | 2.91 |
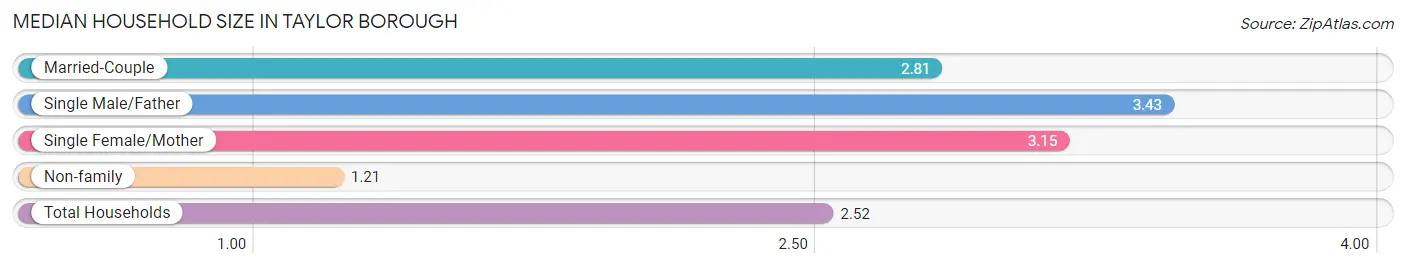
Median Household Size in Taylor borough
The median household size in Taylor borough is 2.52 persons per household, with single male/father households (382 | 15.7%) accounting for the largest median household size of 3.43 persons per household. non-family households (688 | 28.3%) represent the smallest median household size with 1.21 persons per household.
| Household Type | # Households | Household Size |
| Married-Couple | 907 (37.3%) | 2.81 |
| Single Male/Father | 382 (15.7%) | 3.43 |
| Single Female/Mother | 455 (18.7%) | 3.15 |
| Non-family | 688 (28.3%) | 1.21 |
| Total Households | 2,432 (100.0%) | 2.52 |
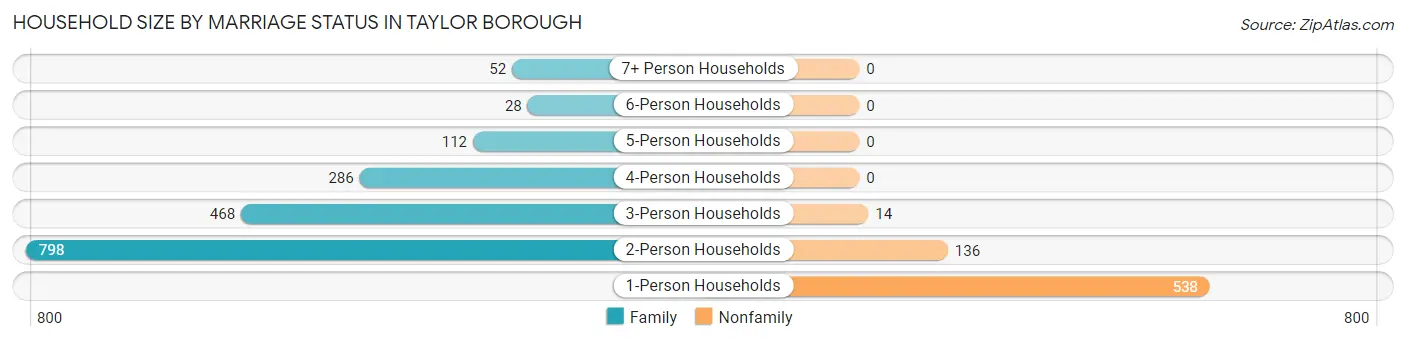
Household Size by Marriage Status in Taylor borough
Out of a total of 2,432 households in Taylor borough, 1,744 (71.7%) are family households, while 688 (28.3%) are nonfamily households. The most numerous type of family households are 2-person households, comprising 798, and the most common type of nonfamily households are 1-person households, comprising 538.
| Household Size | Family Households | Nonfamily Households |
| 1-Person Households | - | 538 (22.1%) |
| 2-Person Households | 798 (32.8%) | 136 (5.6%) |
| 3-Person Households | 468 (19.2%) | 14 (0.6%) |
| 4-Person Households | 286 (11.8%) | 0 (0.0%) |
| 5-Person Households | 112 (4.6%) | 0 (0.0%) |
| 6-Person Households | 28 (1.1%) | 0 (0.0%) |
| 7+ Person Households | 52 (2.1%) | 0 (0.0%) |
| Total | 1,744 (71.7%) | 688 (28.3%) |
Female Fertility in Taylor borough
Fertility by Age in Taylor borough
| Age Bracket | Women with Births | Births / 1,000 Women |
| 15 to 19 years | 0 (0.0%) | 0.0 |
| 20 to 34 years | 0 (0.0%) | 0.0 |
| 35 to 50 years | 0 (0.0%) | 0.0 |
| Total | 0 (0.0%) | 0.0 |
Fertility by Age by Marriage Status in Taylor borough
| Age Bracket | Married | Unmarried |
| 15 to 19 years | 0 (0.0%) | 0 (0.0%) |
| 20 to 34 years | 0 (0.0%) | 0 (0.0%) |
| 35 to 50 years | 0 (0.0%) | 0 (0.0%) |
| Total | 0 (0.0%) | 0 (0.0%) |
Fertility by Education in Taylor borough
| Educational Attainment | Women with Births | Births / 1,000 Women |
| Less than High School | 0 (0.0%) | 0.0 |
| High School Diploma | 0 (0.0%) | 0.0 |
| College or Associate's Degree | 0 (0.0%) | 0.0 |
| Bachelor's Degree | 0 (0.0%) | 0.0 |
| Graduate Degree | 0 (0.0%) | 0.0 |
| Total | 0 (0.0%) | 0.0 |
Fertility by Education by Marriage Status in Taylor borough
| Educational Attainment | Married | Unmarried |
| Less than High School | 0 (0.0%) | 0 (0.0%) |
| High School Diploma | 0 (0.0%) | 0 (0.0%) |
| College or Associate's Degree | 0 (0.0%) | 0 (0.0%) |
| Bachelor's Degree | 0 (0.0%) | 0 (0.0%) |
| Graduate Degree | 0 (0.0%) | 0 (0.0%) |
| Total | 0 (0.0%) | 0 (0.0%) |
Income in Taylor borough
Income Overview in Taylor borough
Per Capita Income in Taylor borough is $31,708, while median incomes of families and households are $57,209 and $57,667 respectively.
| Characteristic | Number | Measure |
| Per Capita Income | 6,274 | $31,708 |
| Median Family Income | 1,744 | $57,209 |
| Mean Family Income | 1,744 | $81,233 |
| Median Household Income | 2,432 | $57,667 |
| Mean Household Income | 2,432 | $81,718 |
| Income Deficit | 1,744 | $0 |
| Wage / Income Gap (%) | 6,274 | 13.59% |
| Wage / Income Gap ($) | 6,274 | 86.41¢ per $1 |
| Gini / Inequality Index | 6,274 | 0.48 |
Earnings by Sex in Taylor borough
Average Earnings in Taylor borough are $34,967, $31,974 for men and $37,004 for women, a difference of 13.6%.
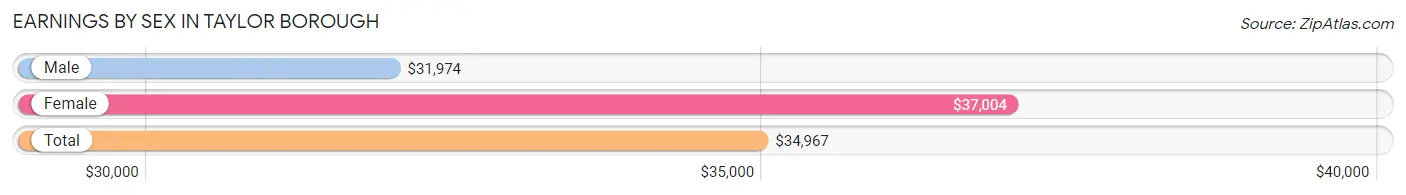
| Sex | Number | Average Earnings |
| Male | 1,656 (55.1%) | $31,974 |
| Female | 1,348 (44.9%) | $37,004 |
| Total | 3,004 (100.0%) | $34,967 |
Earnings by Sex by Income Bracket in Taylor borough
The most common earnings brackets in Taylor borough are $30,000 to $34,999 for men (152 | 9.2%) and $35,000 to $39,999 for women (146 | 10.8%).
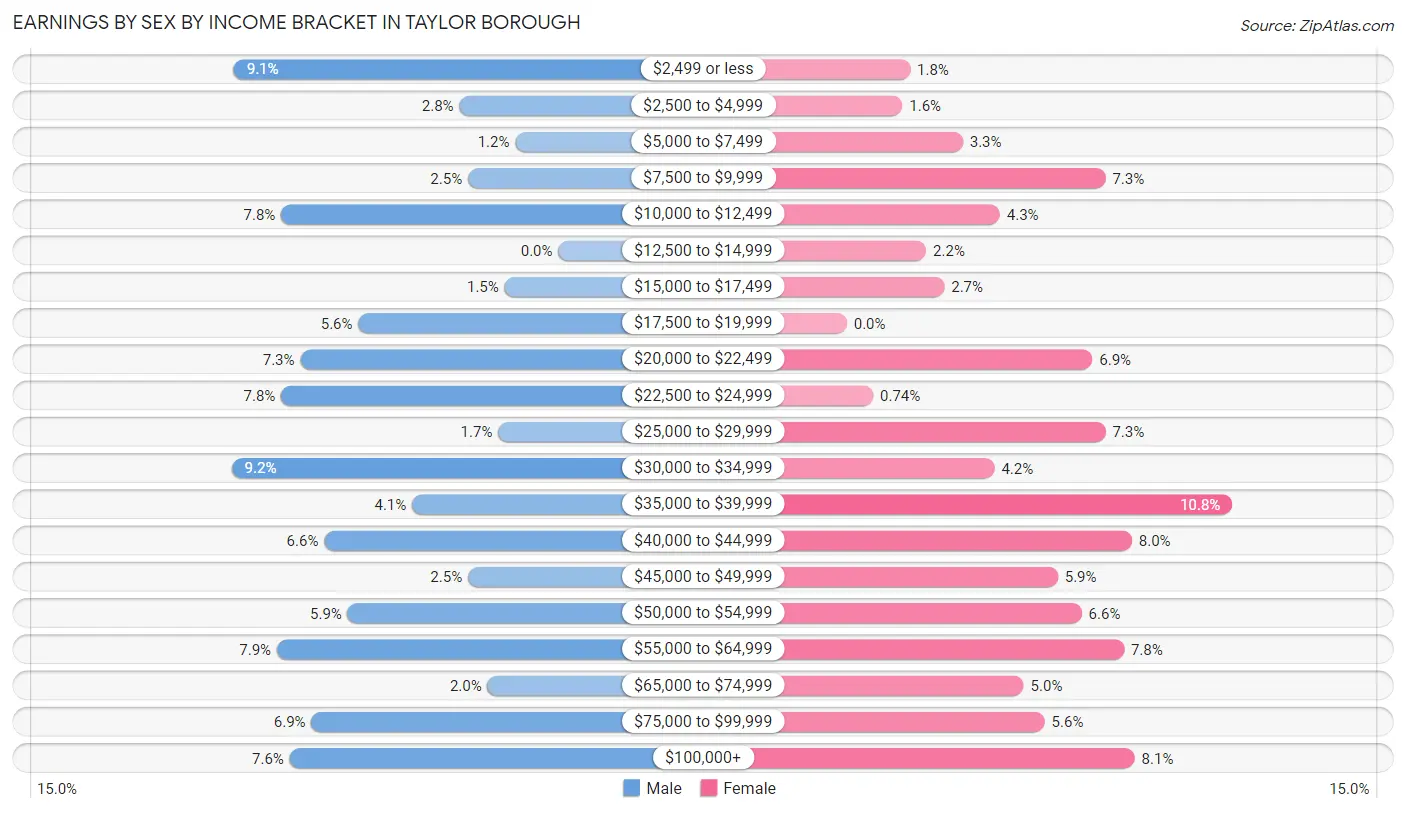
| Income | Male | Female |
| $2,499 or less | 151 (9.1%) | 24 (1.8%) |
| $2,500 to $4,999 | 46 (2.8%) | 21 (1.6%) |
| $5,000 to $7,499 | 20 (1.2%) | 44 (3.3%) |
| $7,500 to $9,999 | 42 (2.5%) | 98 (7.3%) |
| $10,000 to $12,499 | 129 (7.8%) | 58 (4.3%) |
| $12,500 to $14,999 | 0 (0.0%) | 30 (2.2%) |
| $15,000 to $17,499 | 25 (1.5%) | 37 (2.7%) |
| $17,500 to $19,999 | 93 (5.6%) | 0 (0.0%) |
| $20,000 to $22,499 | 120 (7.2%) | 93 (6.9%) |
| $22,500 to $24,999 | 129 (7.8%) | 10 (0.7%) |
| $25,000 to $29,999 | 28 (1.7%) | 98 (7.3%) |
| $30,000 to $34,999 | 152 (9.2%) | 56 (4.2%) |
| $35,000 to $39,999 | 68 (4.1%) | 146 (10.8%) |
| $40,000 to $44,999 | 109 (6.6%) | 108 (8.0%) |
| $45,000 to $49,999 | 42 (2.5%) | 80 (5.9%) |
| $50,000 to $54,999 | 98 (5.9%) | 89 (6.6%) |
| $55,000 to $64,999 | 131 (7.9%) | 105 (7.8%) |
| $65,000 to $74,999 | 33 (2.0%) | 67 (5.0%) |
| $75,000 to $99,999 | 115 (6.9%) | 75 (5.6%) |
| $100,000+ | 125 (7.5%) | 109 (8.1%) |
| Total | 1,656 (100.0%) | 1,348 (100.0%) |
Earnings by Sex by Educational Attainment in Taylor borough
Average earnings in Taylor borough are $35,790 for men and $37,176 for women, a difference of 3.7%. Men with an educational attainment of bachelor's degree enjoy the highest average annual earnings of $61,705, while those with less than high school education earn the least with $19,086. Women with an educational attainment of bachelor's degree earn the most with the average annual earnings of $51,750, while those with college or associate's degree education have the smallest earnings of $21,857.
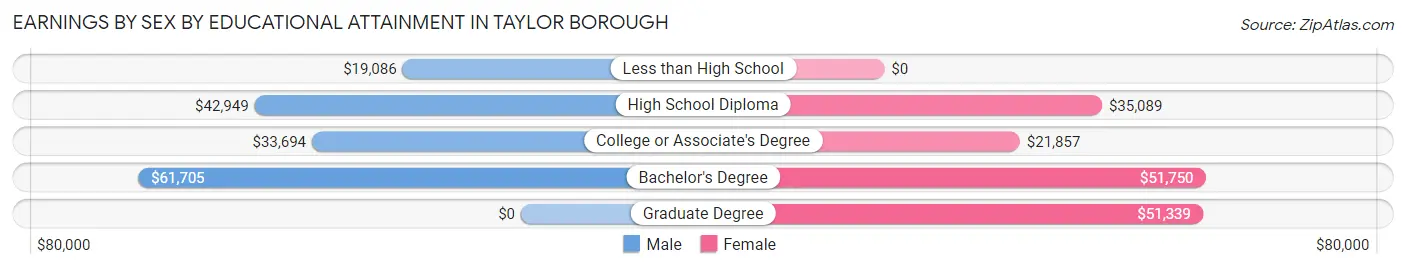
| Educational Attainment | Male Income | Female Income |
| Less than High School | $19,086 | $0 |
| High School Diploma | $42,949 | $35,089 |
| College or Associate's Degree | $33,694 | $21,857 |
| Bachelor's Degree | $61,705 | $51,750 |
| Graduate Degree | - | - |
| Total | $35,790 | $37,176 |
Family Income in Taylor borough
Family Income Brackets in Taylor borough
According to the Taylor borough family income data, there are 406 families falling into the $50,000 to $74,999 income range, which is the most common income bracket and makes up 23.3% of all families. Conversely, the less than $10,000 income bracket is the least frequent group with only 61 families (3.5%) belonging to this category.
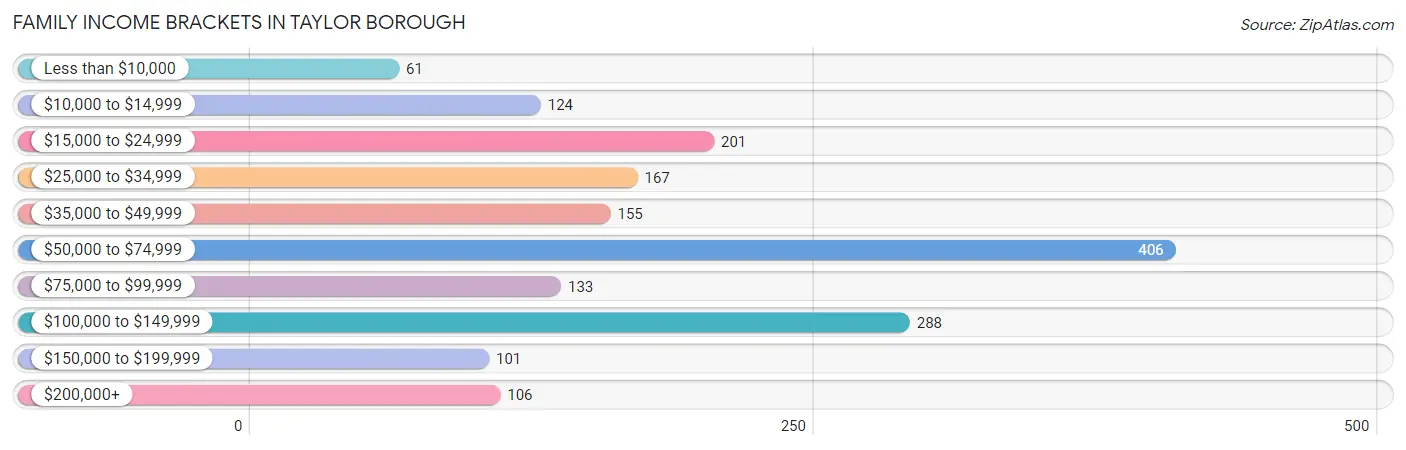
| Income Bracket | # Families | % Families |
| Less than $10,000 | 61 | 3.5% |
| $10,000 to $14,999 | 124 | 7.1% |
| $15,000 to $24,999 | 201 | 11.5% |
| $25,000 to $34,999 | 167 | 9.6% |
| $35,000 to $49,999 | 155 | 8.9% |
| $50,000 to $74,999 | 406 | 23.3% |
| $75,000 to $99,999 | 133 | 7.6% |
| $100,000 to $149,999 | 288 | 16.5% |
| $150,000 to $199,999 | 101 | 5.8% |
| $200,000+ | 106 | 6.1% |
Family Income by Famaliy Size in Taylor borough
2-person families (911 | 52.2%) account for the highest median family income in Taylor borough with $68,750 per family, while 2-person families (911 | 52.2%) have the highest median income of $34,375 per family member.
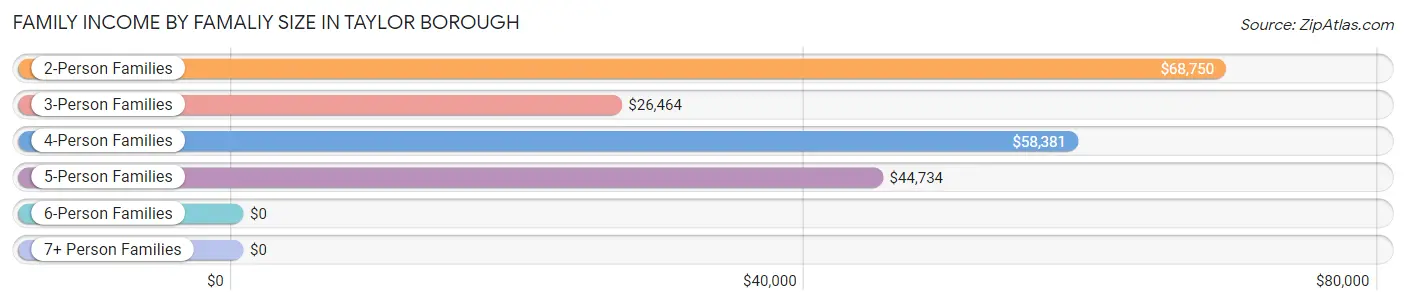
| Income Bracket | # Families | Median Income |
| 2-Person Families | 911 (52.2%) | $68,750 |
| 3-Person Families | 420 (24.1%) | $26,464 |
| 4-Person Families | 239 (13.7%) | $58,381 |
| 5-Person Families | 122 (7.0%) | $44,734 |
| 6-Person Families | 0 (0.0%) | $0 |
| 7+ Person Families | 52 (3.0%) | $0 |
| Total | 1,744 (100.0%) | $57,209 |
Family Income by Number of Earners in Taylor borough
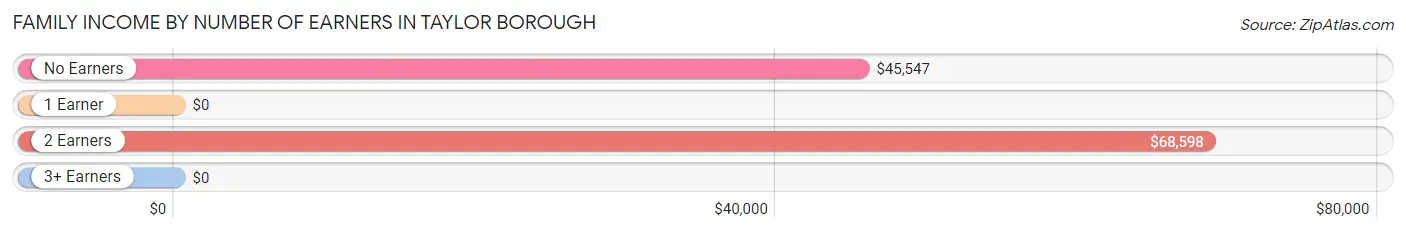
| Number of Earners | # Families | Median Income |
| No Earners | 363 (20.8%) | $45,547 |
| 1 Earner | 591 (33.9%) | $0 |
| 2 Earners | 714 (40.9%) | $68,598 |
| 3+ Earners | 76 (4.4%) | $0 |
| Total | 1,744 (100.0%) | $57,209 |
Household Income in Taylor borough
Household Income Brackets in Taylor borough
With 559 households falling in the category, the $50,000 to $74,999 income range is the most frequent in Taylor borough, accounting for 23.0% of all households. In contrast, only 100 households (4.1%) fall into the less than $10,000 income bracket, making it the least populous group.
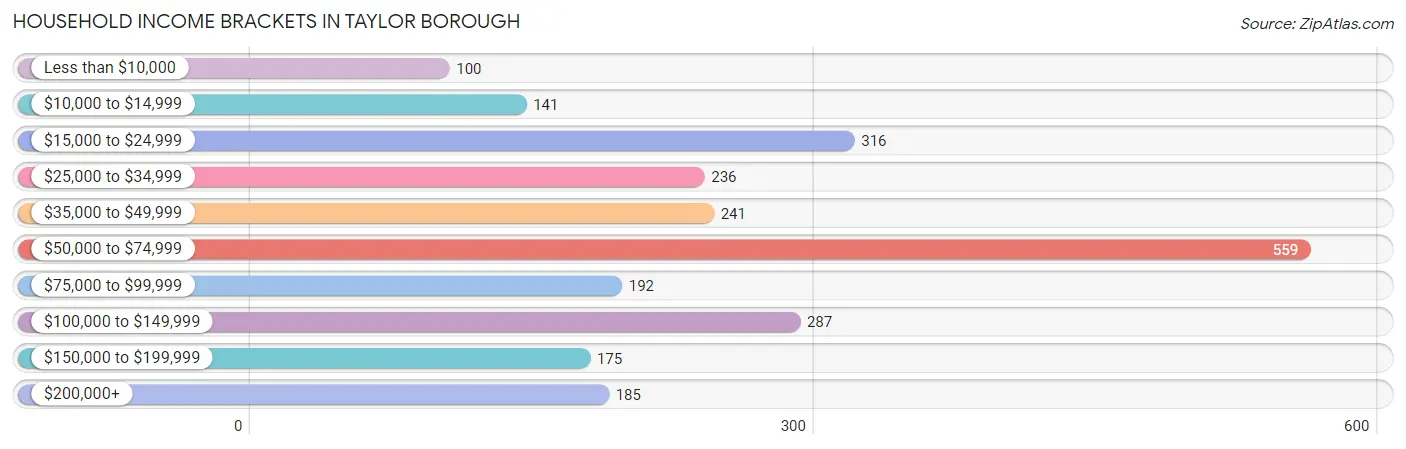
| Income Bracket | # Households | % Households |
| Less than $10,000 | 100 | 4.1% |
| $10,000 to $14,999 | 141 | 5.8% |
| $15,000 to $24,999 | 316 | 13.0% |
| $25,000 to $34,999 | 236 | 9.7% |
| $35,000 to $49,999 | 241 | 9.9% |
| $50,000 to $74,999 | 559 | 23.0% |
| $75,000 to $99,999 | 192 | 7.9% |
| $100,000 to $149,999 | 287 | 11.8% |
| $150,000 to $199,999 | 175 | 7.2% |
| $200,000+ | 185 | 7.6% |
Household Income by Householder Age in Taylor borough
The median household income in Taylor borough is $57,667, with the highest median household income of $73,848 found in the 45 to 64 years age bracket for the primary householder. A total of 921 households (37.9%) fall into this category. Meanwhile, the 15 to 24 years age bracket for the primary householder has the lowest median household income of $0, with 21 households (0.9%) in this group.
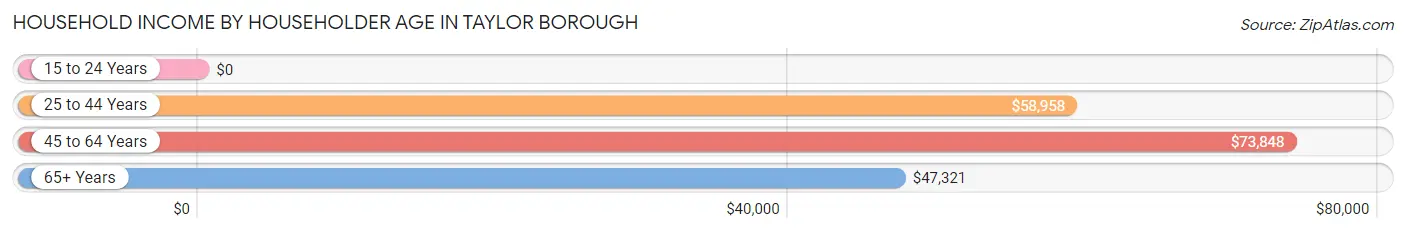
| Income Bracket | # Households | Median Income |
| 15 to 24 Years | 21 (0.9%) | $0 |
| 25 to 44 Years | 760 (31.2%) | $58,958 |
| 45 to 64 Years | 921 (37.9%) | $73,848 |
| 65+ Years | 730 (30.0%) | $47,321 |
| Total | 2,432 (100.0%) | $57,667 |
Poverty in Taylor borough
Income Below Poverty by Sex and Age in Taylor borough
With 11.2% poverty level for males and 25.9% for females among the residents of Taylor borough, 12 to 14 year old males and 5 year old females are the most vulnerable to poverty, with 29 males (23.0%) and 29 females (100.0%) in their respective age groups living below the poverty level.
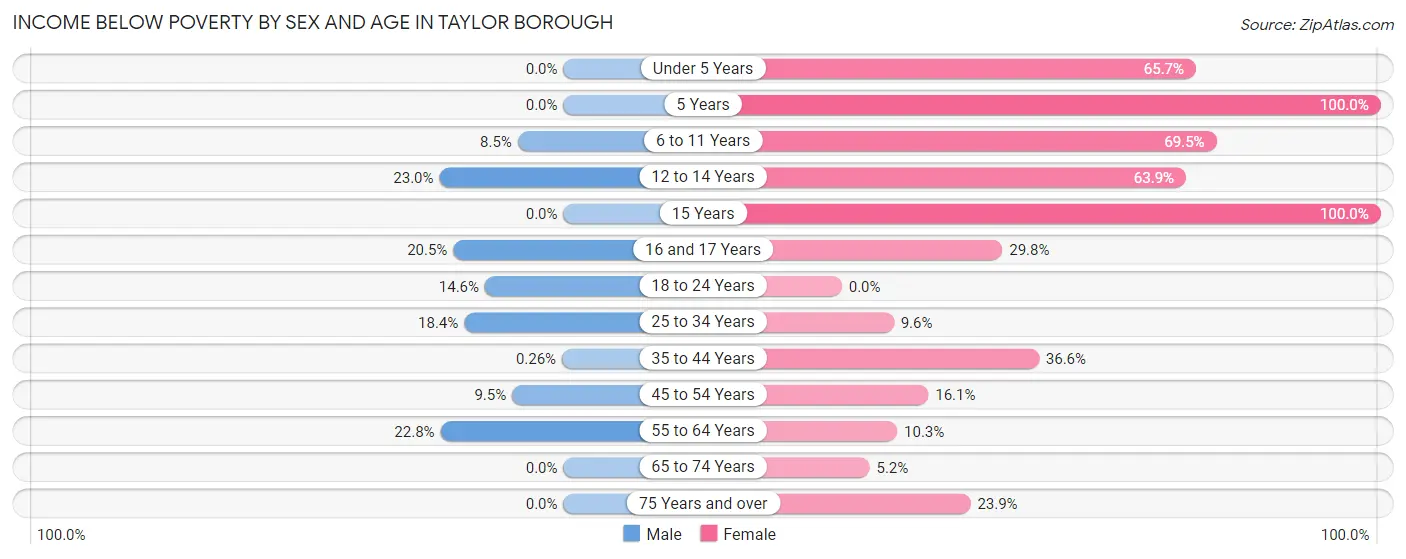
| Age Bracket | Male | Female |
| Under 5 Years | 0 (0.0%) | 115 (65.7%) |
| 5 Years | 0 (0.0%) | 29 (100.0%) |
| 6 to 11 Years | 21 (8.5%) | 162 (69.5%) |
| 12 to 14 Years | 29 (23.0%) | 76 (63.9%) |
| 15 Years | 0 (0.0%) | 55 (100.0%) |
| 16 and 17 Years | 18 (20.4%) | 28 (29.8%) |
| 18 to 24 Years | 44 (14.6%) | 0 (0.0%) |
| 25 to 34 Years | 93 (18.4%) | 52 (9.6%) |
| 35 to 44 Years | 1 (0.3%) | 94 (36.6%) |
| 45 to 54 Years | 22 (9.5%) | 40 (16.1%) |
| 55 to 64 Years | 115 (22.8%) | 46 (10.3%) |
| 65 to 74 Years | 0 (0.0%) | 24 (5.1%) |
| 75 Years and over | 0 (0.0%) | 69 (23.9%) |
| Total | 343 (11.2%) | 790 (25.9%) |
Income Above Poverty by Sex and Age in Taylor borough
According to the poverty statistics in Taylor borough, males aged under 5 years and females aged 18 to 24 years are the age groups that are most secure financially, with 100.0% of males and 100.0% of females in these age groups living above the poverty line.
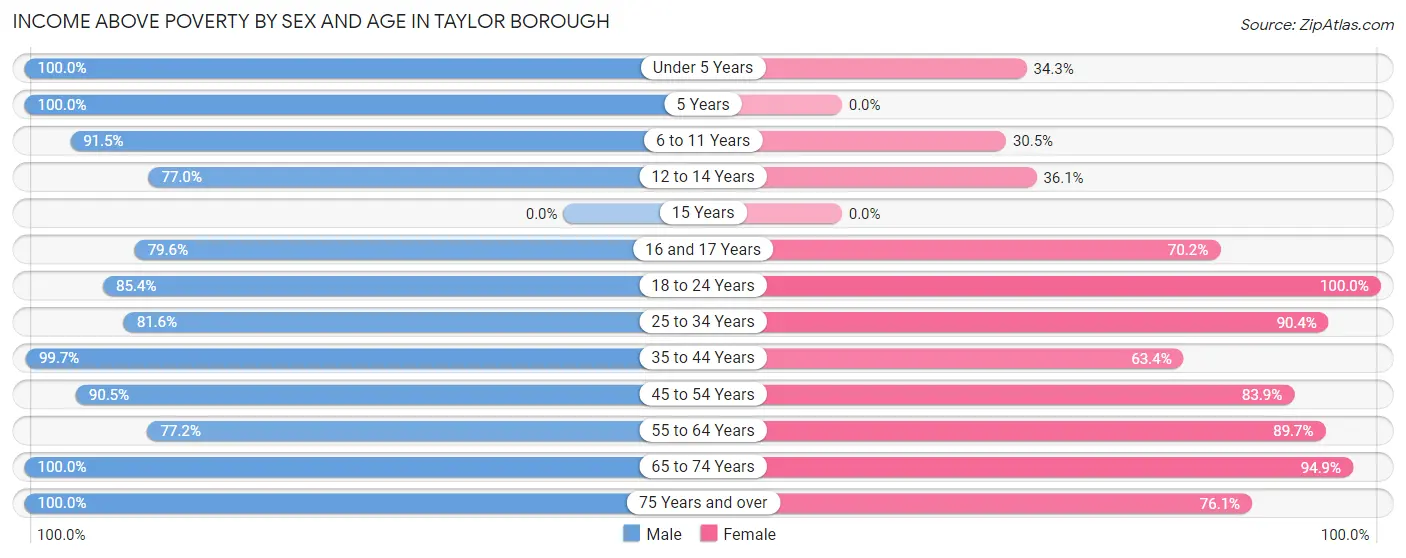
| Age Bracket | Male | Female |
| Under 5 Years | 171 (100.0%) | 60 (34.3%) |
| 5 Years | 55 (100.0%) | 0 (0.0%) |
| 6 to 11 Years | 227 (91.5%) | 71 (30.5%) |
| 12 to 14 Years | 97 (77.0%) | 43 (36.1%) |
| 15 Years | 0 (0.0%) | 0 (0.0%) |
| 16 and 17 Years | 70 (79.5%) | 66 (70.2%) |
| 18 to 24 Years | 258 (85.4%) | 97 (100.0%) |
| 25 to 34 Years | 412 (81.6%) | 488 (90.4%) |
| 35 to 44 Years | 379 (99.7%) | 163 (63.4%) |
| 45 to 54 Years | 209 (90.5%) | 209 (83.9%) |
| 55 to 64 Years | 389 (77.2%) | 402 (89.7%) |
| 65 to 74 Years | 435 (100.0%) | 442 (94.9%) |
| 75 Years and over | 22 (100.0%) | 220 (76.1%) |
| Total | 2,724 (88.8%) | 2,261 (74.1%) |
Income Below Poverty Among Married-Couple Families in Taylor borough
The poverty statistics for married-couple families in Taylor borough show that 6.8% or 62 of the total 907 families live below the poverty line. Families with 3 or 4 children have the highest poverty rate of 40.4%, comprising of 19 families. On the other hand, families with 1 or 2 children have the lowest poverty rate of 0.0%, which includes 0 families.
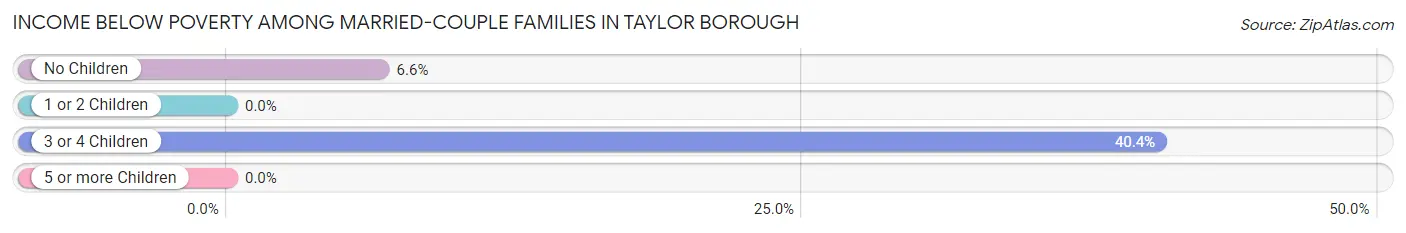
| Children | Above Poverty | Below Poverty |
| No Children | 609 (93.4%) | 43 (6.6%) |
| 1 or 2 Children | 208 (100.0%) | 0 (0.0%) |
| 3 or 4 Children | 28 (59.6%) | 19 (40.4%) |
| 5 or more Children | 0 (0.0%) | 0 (0.0%) |
| Total | 845 (93.2%) | 62 (6.8%) |
Income Below Poverty Among Single-Parent Households in Taylor borough
According to the poverty data in Taylor borough, 24.3% or 93 single-father households and 40.2% or 183 single-mother households are living below the poverty line. Among single-father households, those with 1 or 2 children have the highest poverty rate, with 93 households (79.5%) experiencing poverty. Likewise, among single-mother households, those with 3 or 4 children have the highest poverty rate, with 68 households (85.0%) falling below the poverty line.
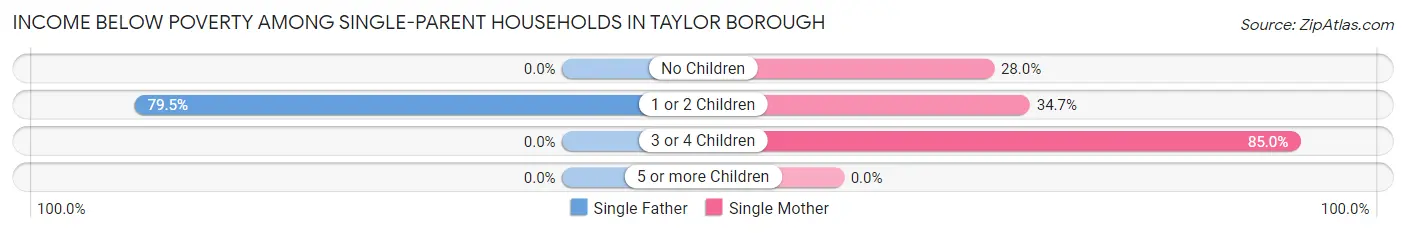
| Children | Single Father | Single Mother |
| No Children | 0 (0.0%) | 63 (28.0%) |
| 1 or 2 Children | 93 (79.5%) | 52 (34.7%) |
| 3 or 4 Children | 0 (0.0%) | 68 (85.0%) |
| 5 or more Children | 0 (0.0%) | 0 (0.0%) |
| Total | 93 (24.3%) | 183 (40.2%) |
Income Below Poverty Among Married-Couple vs Single-Parent Households in Taylor borough
The poverty data for Taylor borough shows that 62 of the married-couple family households (6.8%) and 276 of the single-parent households (33.0%) are living below the poverty level. Within the married-couple family households, those with 3 or 4 children have the highest poverty rate, with 19 households (40.4%) falling below the poverty line. Among the single-parent households, those with 1 or 2 children have the highest poverty rate, with 145 household (54.3%) living below poverty.
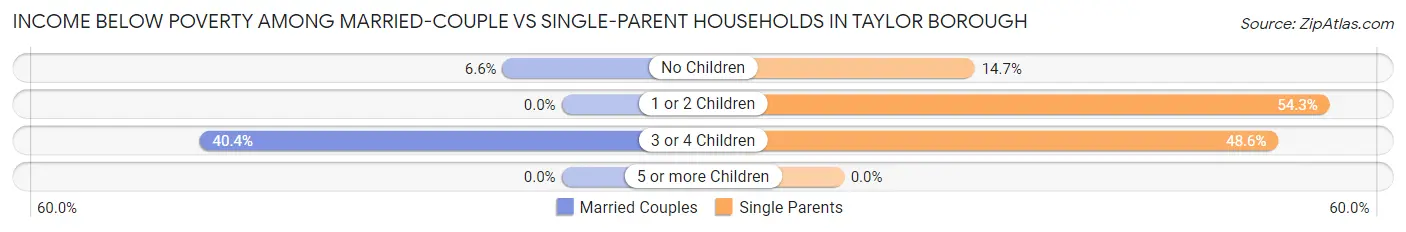
| Children | Married-Couple Families | Single-Parent Households |
| No Children | 43 (6.6%) | 63 (14.6%) |
| 1 or 2 Children | 0 (0.0%) | 145 (54.3%) |
| 3 or 4 Children | 19 (40.4%) | 68 (48.6%) |
| 5 or more Children | 0 (0.0%) | 0 (0.0%) |
| Total | 62 (6.8%) | 276 (33.0%) |
Employment Characteristics in Taylor borough
Employment by Class of Employer in Taylor borough
Among the 2,637 employed individuals in Taylor borough, private company employees (2,128 | 80.7%), state government employees (172 | 6.5%), and federal government employees (119 | 4.5%) make up the most common classes of employment.

| Employer Class | # Employees | % Employees |
| Private Company Employees | 2,128 | 80.7% |
| Self-Employed (Incorporated) | 62 | 2.4% |
| Self-Employed (Not Incorporated) | 24 | 0.9% |
| Not-for-profit Organizations | 85 | 3.2% |
| Local Government Employees | 37 | 1.4% |
| State Government Employees | 172 | 6.5% |
| Federal Government Employees | 119 | 4.5% |
| Unpaid Family Workers | 10 | 0.4% |
| Total | 2,637 | 100.0% |
Employment Status by Age in Taylor borough
According to the labor force statistics for Taylor borough, out of the total population over 16 years of age (5,046), 57.7% or 2,912 individuals are in the labor force, with 9.5% or 277 of them unemployed. The age group with the highest labor force participation rate is 25 to 29 years, with 92.8% or 435 individuals in the labor force. Within the labor force, the 16 to 19 years age range has the highest percentage of unemployed individuals, with 37.8% or 34 of them being unemployed.
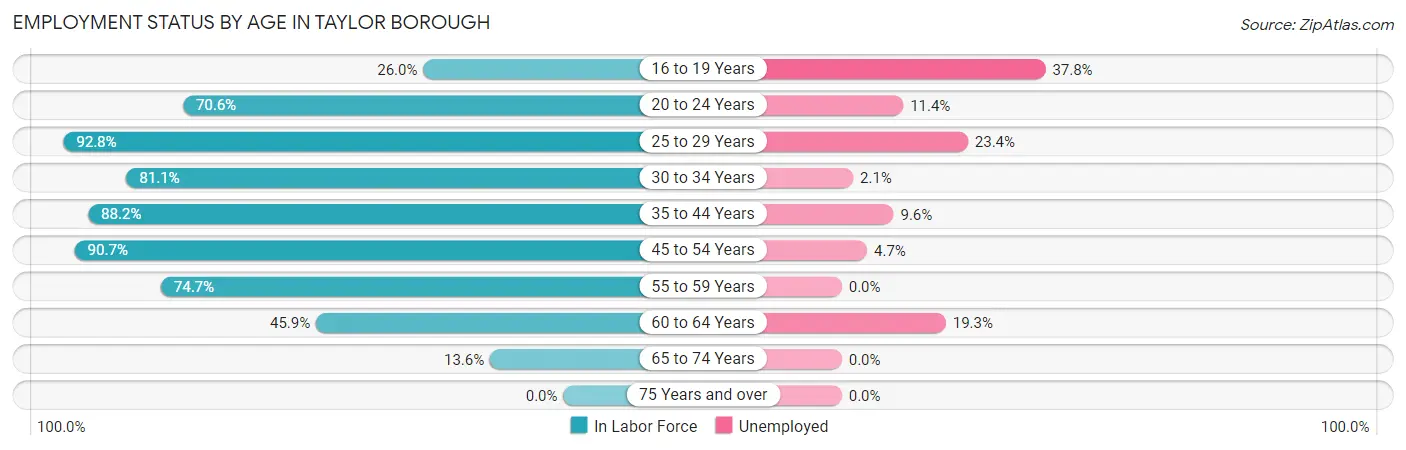
| Age Bracket | In Labor Force | Unemployed |
| 16 to 19 Years | 90 (26.0%) | 34 (37.8%) |
| 20 to 24 Years | 175 (70.6%) | 20 (11.4%) |
| 25 to 29 Years | 435 (92.8%) | 102 (23.4%) |
| 30 to 34 Years | 467 (81.1%) | 10 (2.1%) |
| 35 to 44 Years | 562 (88.2%) | 54 (9.6%) |
| 45 to 54 Years | 450 (90.7%) | 21 (4.7%) |
| 55 to 59 Years | 423 (74.7%) | 0 (0.0%) |
| 60 to 64 Years | 187 (45.9%) | 36 (19.3%) |
| 65 to 74 Years | 125 (13.6%) | 0 (0.0%) |
| 75 Years and over | 0 (0.0%) | 0 (0.0%) |
| Total | 2,912 (57.7%) | 277 (9.5%) |
Employment Status by Educational Attainment in Taylor borough
According to labor force statistics for Taylor borough, 80.1% of individuals (2,524) out of the total population between 25 and 64 years of age (3,151) are in the labor force, with 8.8% or 222 of them being unemployed. The group with the highest labor force participation rate are those with the educational attainment of bachelor's degree or higher, with 93.3% or 553 individuals in the labor force. Within the labor force, individuals with less than high school education have the highest percentage of unemployment, with 16.2% or 21 of them being unemployed.
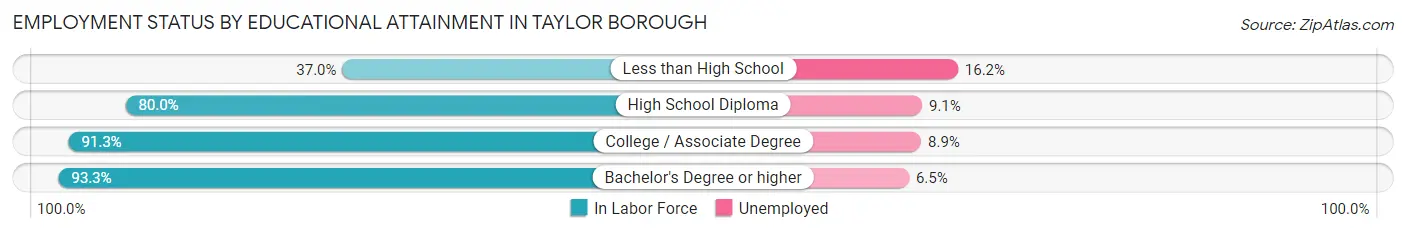
| Educational Attainment | In Labor Force | Unemployed |
| Less than High School | 130 (37.0%) | 57 (16.2%) |
| High School Diploma | 1,234 (80.0%) | 140 (9.1%) |
| College / Associate Degree | 607 (91.3%) | 59 (8.9%) |
| Bachelor's Degree or higher | 553 (93.3%) | 39 (6.5%) |
| Total | 2,524 (80.1%) | 277 (8.8%) |
Employment Occupations by Sex in Taylor borough
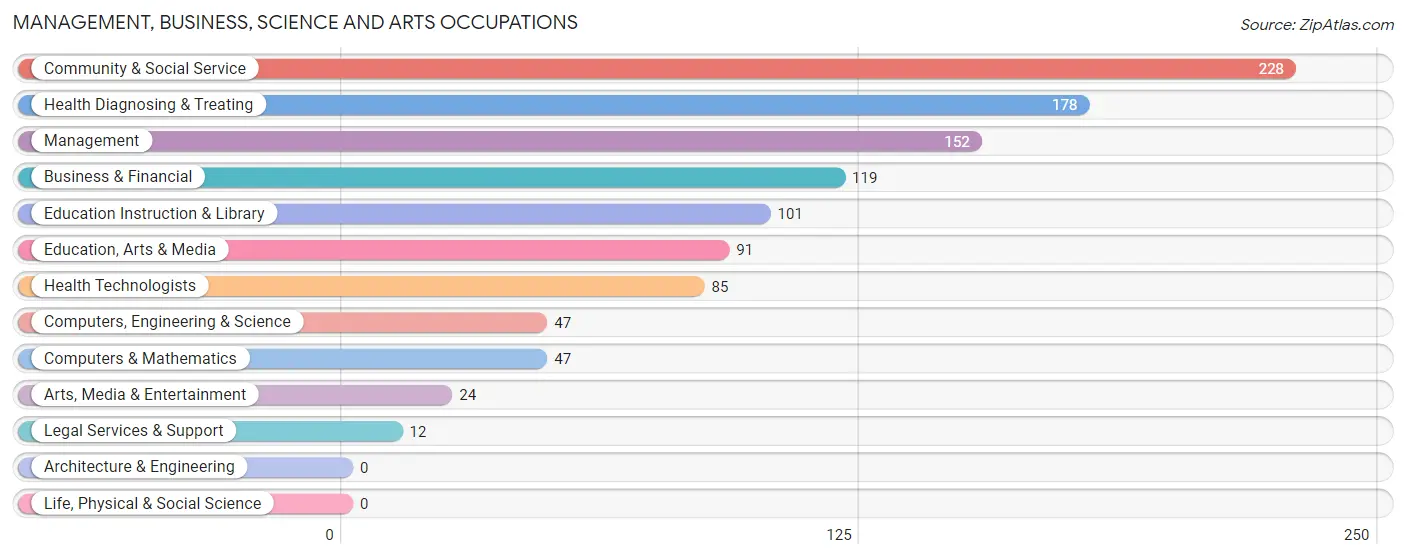
Management, Business, Science and Arts Occupations
The most common Management, Business, Science and Arts occupations in Taylor borough are Community & Social Service (228 | 8.6%), Health Diagnosing & Treating (178 | 6.8%), Management (152 | 5.8%), Business & Financial (119 | 4.5%), and Education Instruction & Library (101 | 3.8%).
Management, Business, Science and Arts Occupations by Sex
Within the Management, Business, Science and Arts occupations in Taylor borough, the most male-oriented occupations are Legal Services & Support (100.0%), Computers, Engineering & Science (72.3%), and Computers & Mathematics (72.3%), while the most female-oriented occupations are Education Instruction & Library (100.0%), Arts, Media & Entertainment (100.0%), and Health Technologists (100.0%).
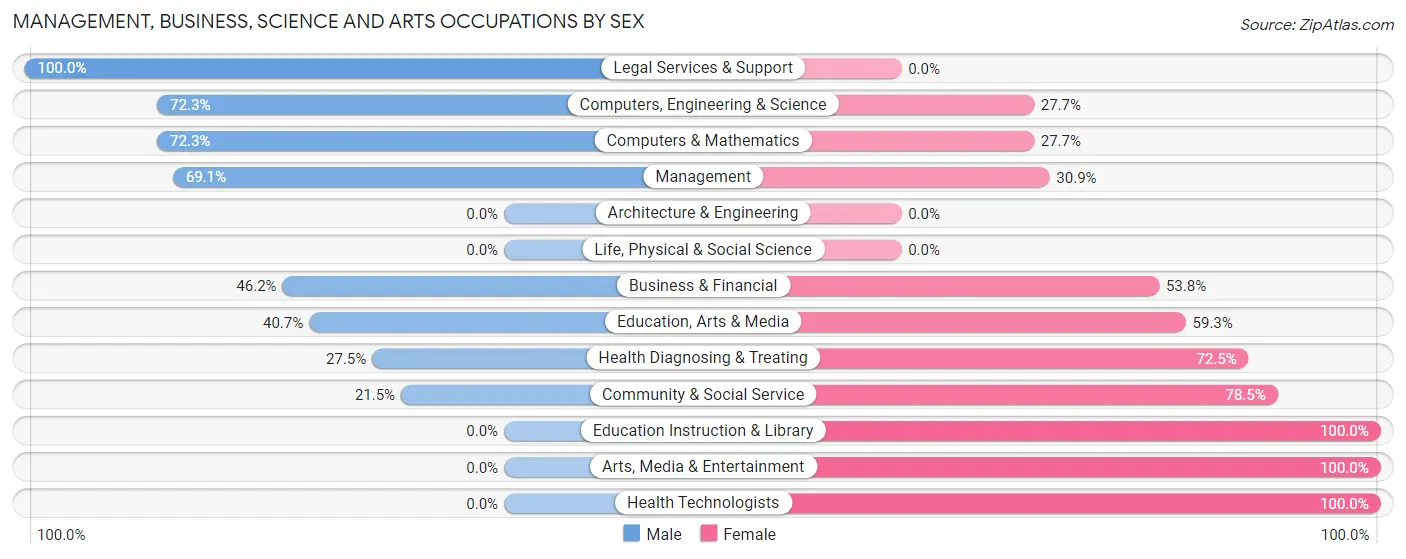
| Occupation | Male | Female |
| Management | 105 (69.1%) | 47 (30.9%) |
| Business & Financial | 55 (46.2%) | 64 (53.8%) |
| Computers, Engineering & Science | 34 (72.3%) | 13 (27.7%) |
| Computers & Mathematics | 34 (72.3%) | 13 (27.7%) |
| Architecture & Engineering | 0 (0.0%) | 0 (0.0%) |
| Life, Physical & Social Science | 0 (0.0%) | 0 (0.0%) |
| Community & Social Service | 49 (21.5%) | 179 (78.5%) |
| Education, Arts & Media | 37 (40.7%) | 54 (59.3%) |
| Legal Services & Support | 12 (100.0%) | 0 (0.0%) |
| Education Instruction & Library | 0 (0.0%) | 101 (100.0%) |
| Arts, Media & Entertainment | 0 (0.0%) | 24 (100.0%) |
| Health Diagnosing & Treating | 49 (27.5%) | 129 (72.5%) |
| Health Technologists | 0 (0.0%) | 85 (100.0%) |
| Total (Category) | 292 (40.3%) | 432 (59.7%) |
| Total (Overall) | 1,437 (54.5%) | 1,200 (45.5%) |
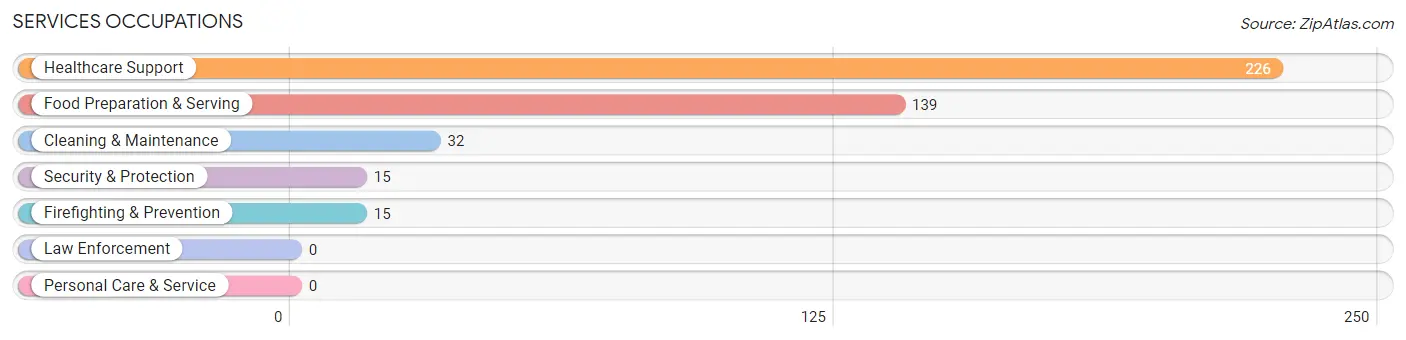
Services Occupations
The most common Services occupations in Taylor borough are Healthcare Support (226 | 8.6%), Food Preparation & Serving (139 | 5.3%), Cleaning & Maintenance (32 | 1.2%), Security & Protection (15 | 0.6%), and Firefighting & Prevention (15 | 0.6%).
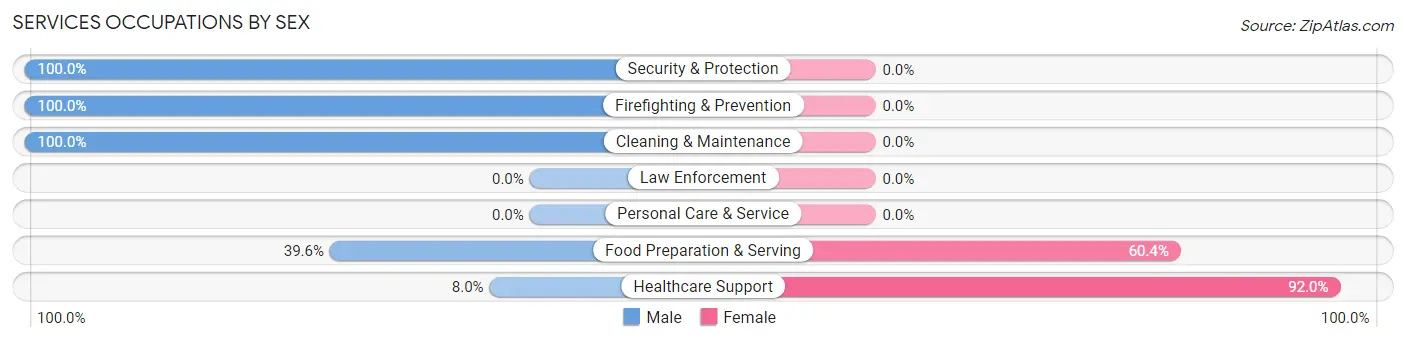
Services Occupations by Sex
Within the Services occupations in Taylor borough, the most male-oriented occupations are Security & Protection (100.0%), Firefighting & Prevention (100.0%), and Cleaning & Maintenance (100.0%), while the most female-oriented occupations are Healthcare Support (92.0%), and Food Preparation & Serving (60.4%).
| Occupation | Male | Female |
| Healthcare Support | 18 (8.0%) | 208 (92.0%) |
| Security & Protection | 15 (100.0%) | 0 (0.0%) |
| Firefighting & Prevention | 15 (100.0%) | 0 (0.0%) |
| Law Enforcement | 0 (0.0%) | 0 (0.0%) |
| Food Preparation & Serving | 55 (39.6%) | 84 (60.4%) |
| Cleaning & Maintenance | 32 (100.0%) | 0 (0.0%) |
| Personal Care & Service | 0 (0.0%) | 0 (0.0%) |
| Total (Category) | 120 (29.1%) | 292 (70.9%) |
| Total (Overall) | 1,437 (54.5%) | 1,200 (45.5%) |
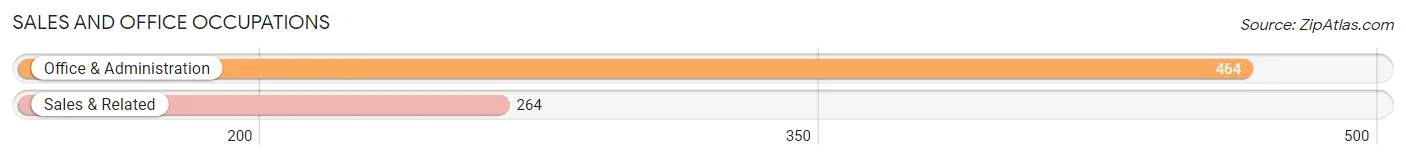
Sales and Office Occupations
The most common Sales and Office occupations in Taylor borough are Office & Administration (464 | 17.6%), and Sales & Related (264 | 10.0%).
Sales and Office Occupations by Sex
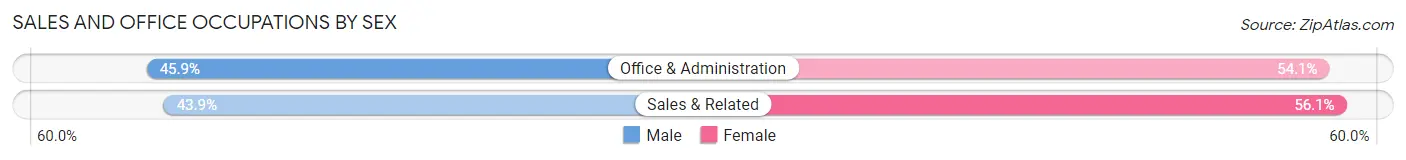
| Occupation | Male | Female |
| Sales & Related | 116 (43.9%) | 148 (56.1%) |
| Office & Administration | 213 (45.9%) | 251 (54.1%) |
| Total (Category) | 329 (45.2%) | 399 (54.8%) |
| Total (Overall) | 1,437 (54.5%) | 1,200 (45.5%) |
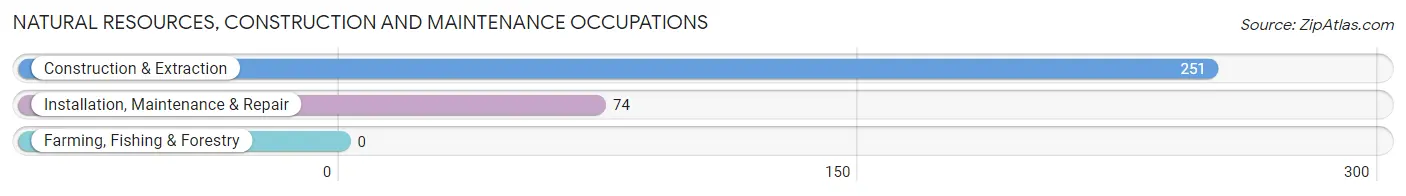
Natural Resources, Construction and Maintenance Occupations
The most common Natural Resources, Construction and Maintenance occupations in Taylor borough are Construction & Extraction (251 | 9.5%), and Installation, Maintenance & Repair (74 | 2.8%).
Natural Resources, Construction and Maintenance Occupations by Sex
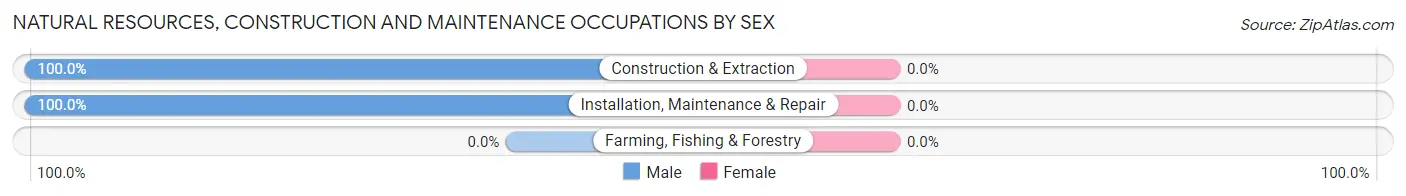
| Occupation | Male | Female |
| Farming, Fishing & Forestry | 0 (0.0%) | 0 (0.0%) |
| Construction & Extraction | 251 (100.0%) | 0 (0.0%) |
| Installation, Maintenance & Repair | 74 (100.0%) | 0 (0.0%) |
| Total (Category) | 325 (100.0%) | 0 (0.0%) |
| Total (Overall) | 1,437 (54.5%) | 1,200 (45.5%) |
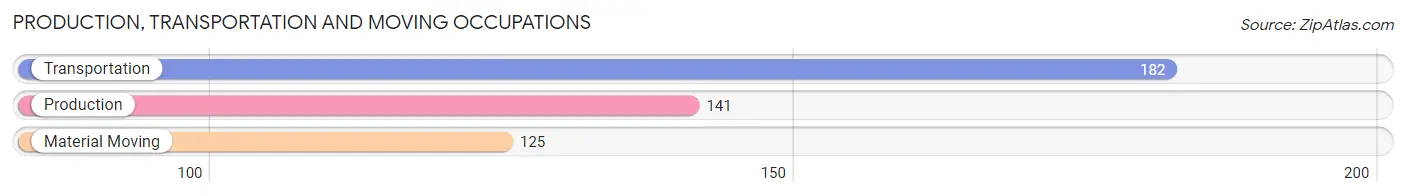
Production, Transportation and Moving Occupations
The most common Production, Transportation and Moving occupations in Taylor borough are Transportation (182 | 6.9%), Production (141 | 5.3%), and Material Moving (125 | 4.7%).
Production, Transportation and Moving Occupations by Sex
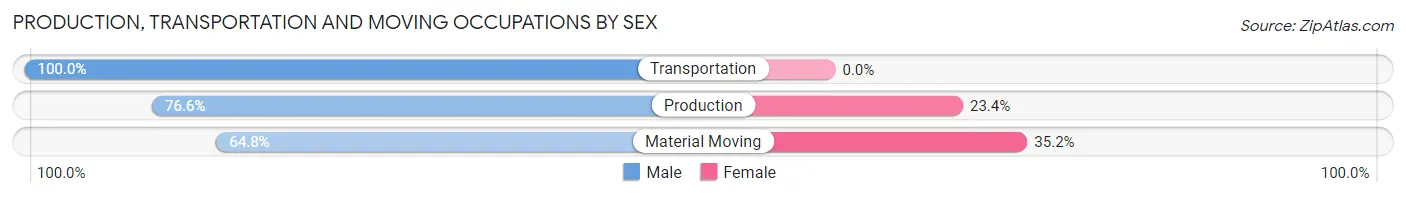
| Occupation | Male | Female |
| Production | 108 (76.6%) | 33 (23.4%) |
| Transportation | 182 (100.0%) | 0 (0.0%) |
| Material Moving | 81 (64.8%) | 44 (35.2%) |
| Total (Category) | 371 (82.8%) | 77 (17.2%) |
| Total (Overall) | 1,437 (54.5%) | 1,200 (45.5%) |
Employment Industries by Sex in Taylor borough
Employment Industries in Taylor borough
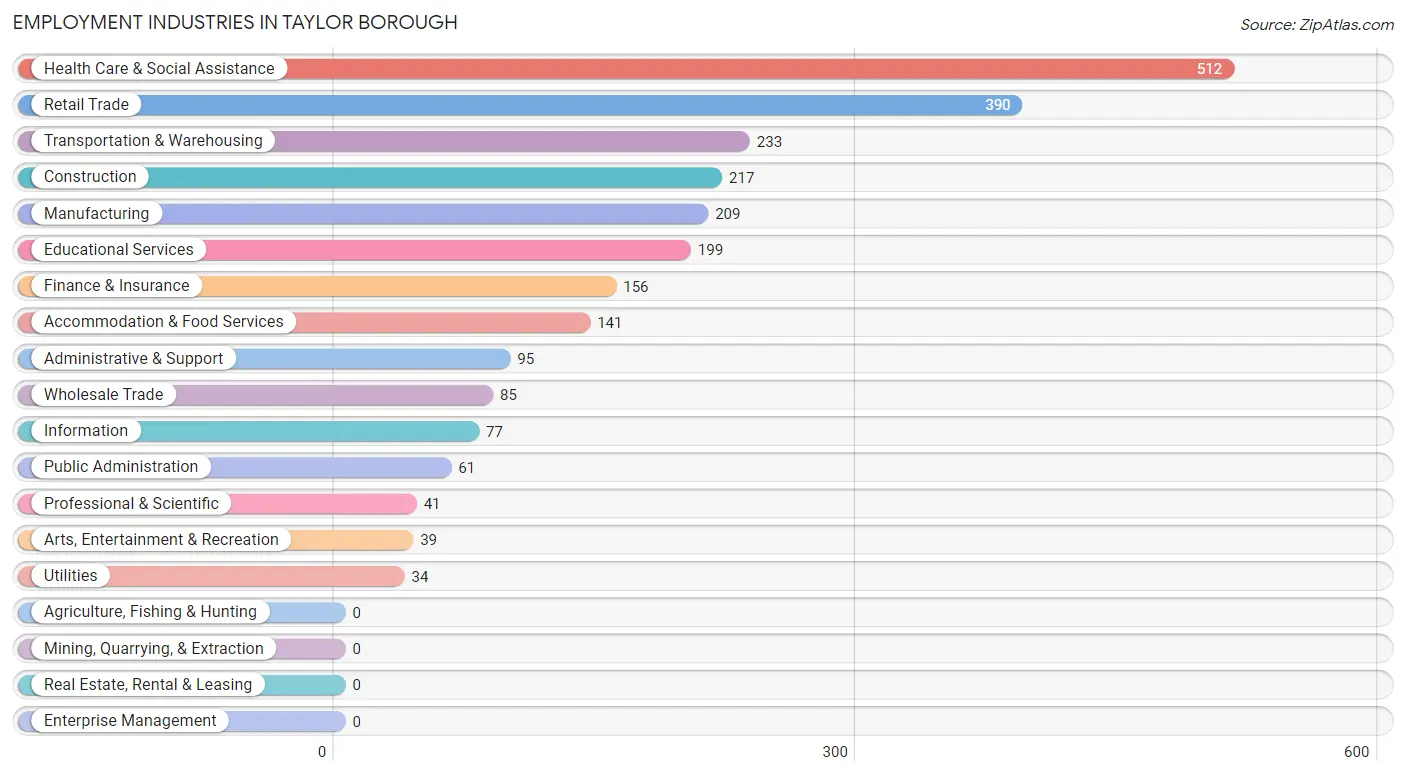
The major employment industries in Taylor borough include Health Care & Social Assistance (512 | 19.4%), Retail Trade (390 | 14.8%), Transportation & Warehousing (233 | 8.8%), Construction (217 | 8.2%), and Manufacturing (209 | 7.9%).
Employment Industries by Sex in Taylor borough
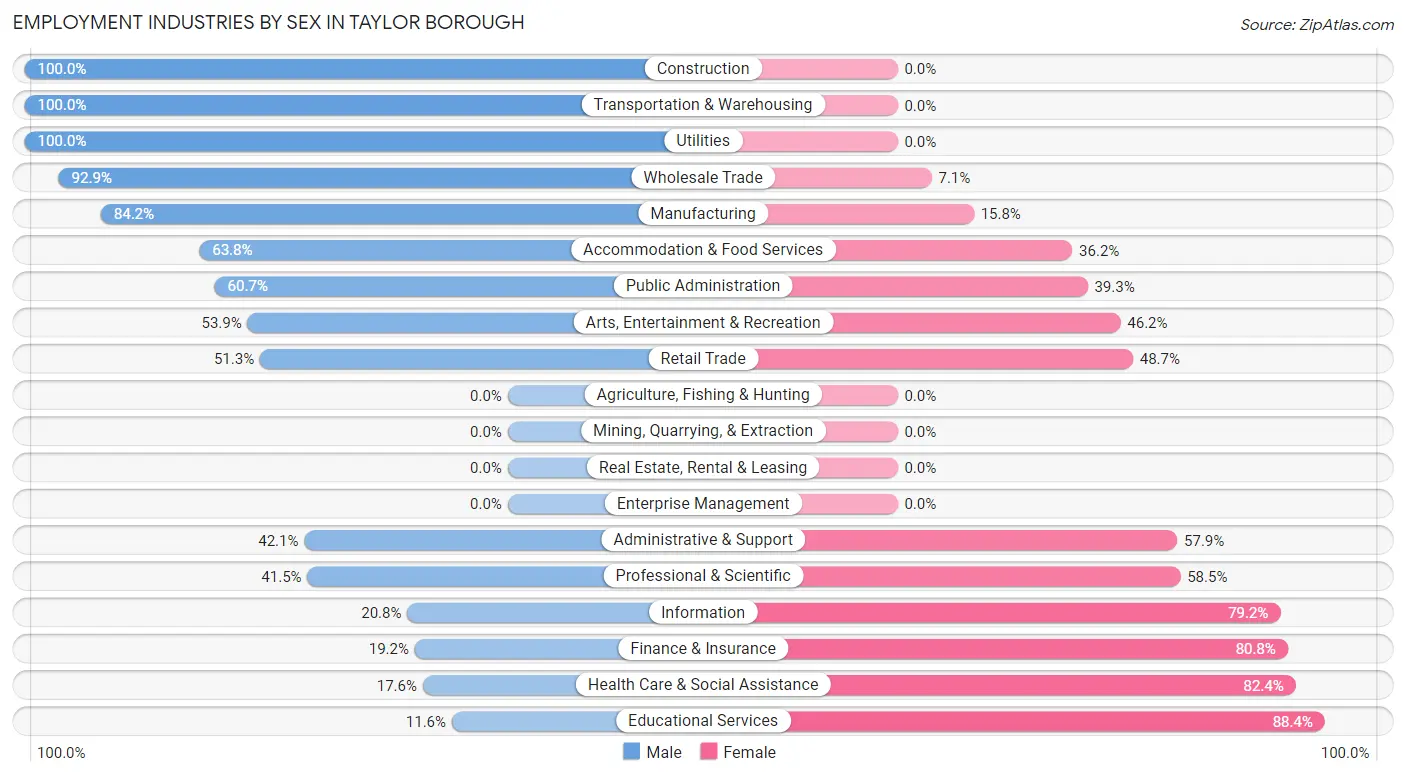
The Taylor borough industries that see more men than women are Construction (100.0%), Transportation & Warehousing (100.0%), and Utilities (100.0%), whereas the industries that tend to have a higher number of women are Educational Services (88.4%), Health Care & Social Assistance (82.4%), and Finance & Insurance (80.8%).
| Industry | Male | Female |
| Agriculture, Fishing & Hunting | 0 (0.0%) | 0 (0.0%) |
| Mining, Quarrying, & Extraction | 0 (0.0%) | 0 (0.0%) |
| Construction | 217 (100.0%) | 0 (0.0%) |
| Manufacturing | 176 (84.2%) | 33 (15.8%) |
| Wholesale Trade | 79 (92.9%) | 6 (7.1%) |
| Retail Trade | 200 (51.3%) | 190 (48.7%) |
| Transportation & Warehousing | 233 (100.0%) | 0 (0.0%) |
| Utilities | 34 (100.0%) | 0 (0.0%) |
| Information | 16 (20.8%) | 61 (79.2%) |
| Finance & Insurance | 30 (19.2%) | 126 (80.8%) |
| Real Estate, Rental & Leasing | 0 (0.0%) | 0 (0.0%) |
| Professional & Scientific | 17 (41.5%) | 24 (58.5%) |
| Enterprise Management | 0 (0.0%) | 0 (0.0%) |
| Administrative & Support | 40 (42.1%) | 55 (57.9%) |
| Educational Services | 23 (11.6%) | 176 (88.4%) |
| Health Care & Social Assistance | 90 (17.6%) | 422 (82.4%) |
| Arts, Entertainment & Recreation | 21 (53.8%) | 18 (46.2%) |
| Accommodation & Food Services | 90 (63.8%) | 51 (36.2%) |
| Public Administration | 37 (60.7%) | 24 (39.3%) |
| Total | 1,437 (54.5%) | 1,200 (45.5%) |
Education in Taylor borough
School Enrollment in Taylor borough
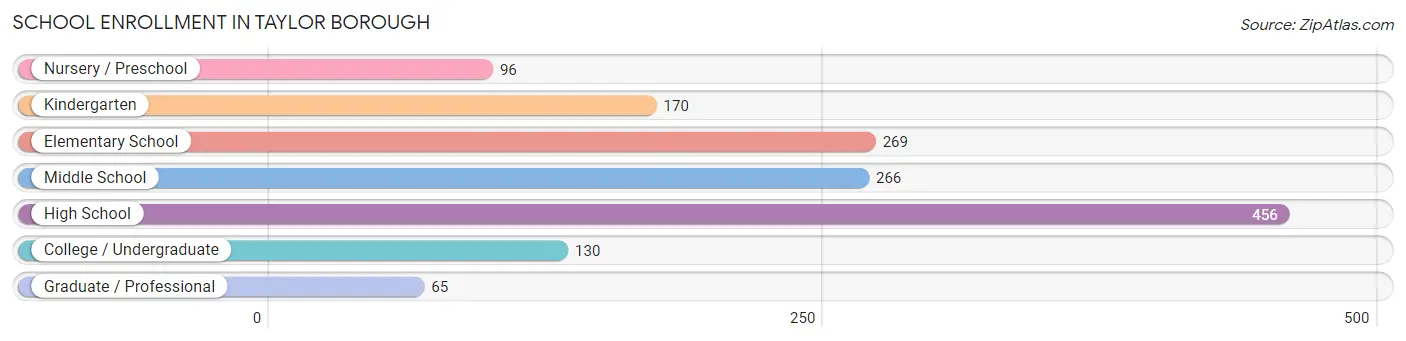
The most common levels of schooling among the 1,452 students in Taylor borough are high school (456 | 31.4%), elementary school (269 | 18.5%), and middle school (266 | 18.3%).
| School Level | # Students | % Students |
| Nursery / Preschool | 96 | 6.6% |
| Kindergarten | 170 | 11.7% |
| Elementary School | 269 | 18.5% |
| Middle School | 266 | 18.3% |
| High School | 456 | 31.4% |
| College / Undergraduate | 130 | 8.9% |
| Graduate / Professional | 65 | 4.5% |
| Total | 1,452 | 100.0% |
School Enrollment by Age by Funding Source in Taylor borough
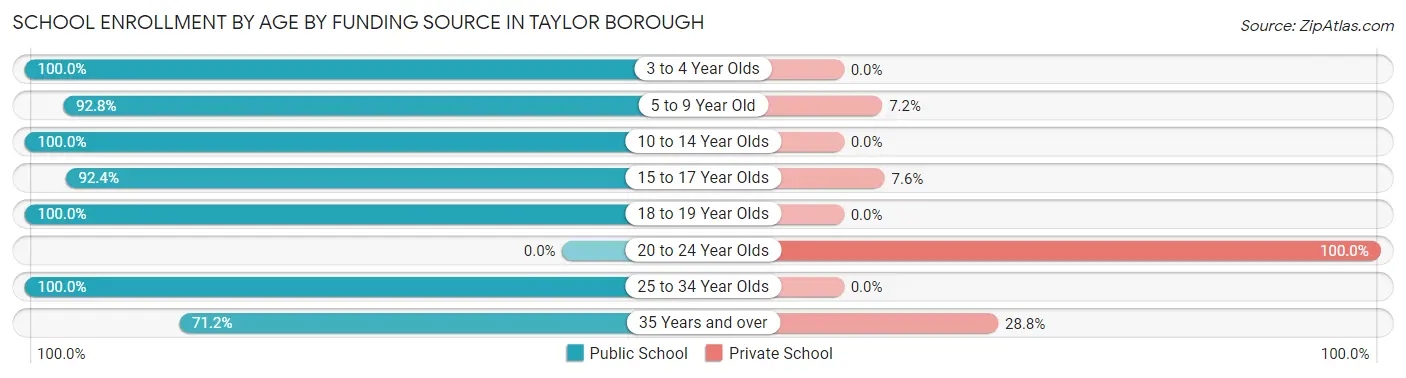
Out of a total of 1,452 students who are enrolled in schools in Taylor borough, 122 (8.4%) attend a private institution, while the remaining 1,330 (91.6%) are enrolled in public schools. The age group of 20 to 24 year olds has the highest likelihood of being enrolled in private schools, with 36 (100.0% in the age bracket) enrolled. Conversely, the age group of 3 to 4 year olds has the lowest likelihood of being enrolled in a private school, with 145 (100.0% in the age bracket) attending a public institution.
| Age Bracket | Public School | Private School |
| 3 to 4 Year Olds | 145 (100.0%) | 0 (0.0%) |
| 5 to 9 Year Old | 362 (92.8%) | 28 (7.2%) |
| 10 to 14 Year Olds | 379 (100.0%) | 0 (0.0%) |
| 15 to 17 Year Olds | 194 (92.4%) | 16 (7.6%) |
| 18 to 19 Year Olds | 109 (100.0%) | 0 (0.0%) |
| 20 to 24 Year Olds | 0 (0.0%) | 36 (100.0%) |
| 25 to 34 Year Olds | 37 (100.0%) | 0 (0.0%) |
| 35 Years and over | 104 (71.2%) | 42 (28.8%) |
| Total | 1,330 (91.6%) | 122 (8.4%) |
Educational Attainment by Field of Study in Taylor borough
Business (273 | 25.9%), education (209 | 19.8%), science & technology (119 | 11.3%), arts & humanities (93 | 8.8%), and psychology (83 | 7.9%) are the most common fields of study among 1,054 individuals in Taylor borough who have obtained a bachelor's degree or higher.
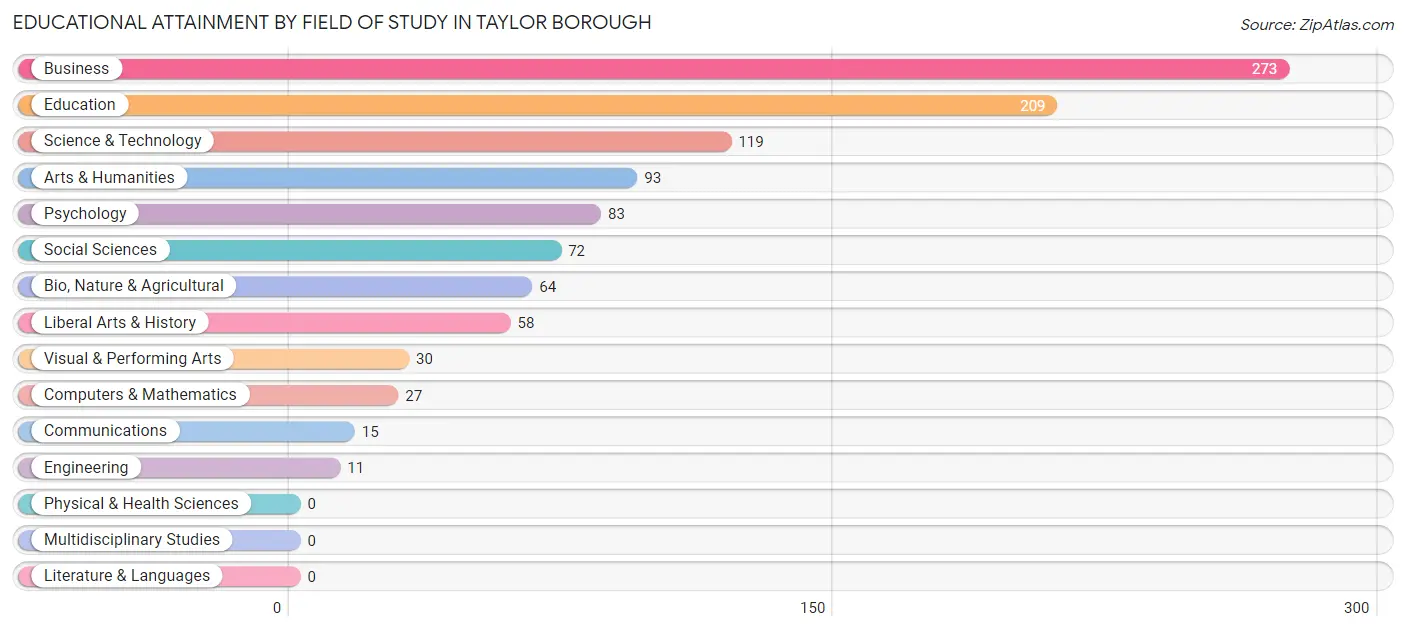
| Field of Study | # Graduates | % Graduates |
| Computers & Mathematics | 27 | 2.6% |
| Bio, Nature & Agricultural | 64 | 6.1% |
| Physical & Health Sciences | 0 | 0.0% |
| Psychology | 83 | 7.9% |
| Social Sciences | 72 | 6.8% |
| Engineering | 11 | 1.0% |
| Multidisciplinary Studies | 0 | 0.0% |
| Science & Technology | 119 | 11.3% |
| Business | 273 | 25.9% |
| Education | 209 | 19.8% |
| Literature & Languages | 0 | 0.0% |
| Liberal Arts & History | 58 | 5.5% |
| Visual & Performing Arts | 30 | 2.9% |
| Communications | 15 | 1.4% |
| Arts & Humanities | 93 | 8.8% |
| Total | 1,054 | 100.0% |
Transportation & Commute in Taylor borough
Vehicle Availability by Sex in Taylor borough
The most prevalent vehicle ownership categories in Taylor borough are males with 2 vehicles (864, accounting for 60.2%) and females with 2 vehicles (756, making up 72.0%).
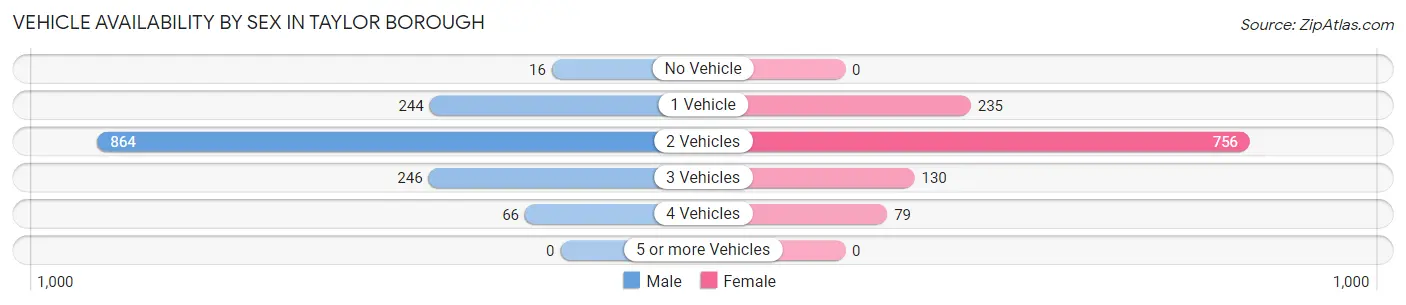
| Vehicles Available | Male | Female |
| No Vehicle | 16 (1.1%) | 0 (0.0%) |
| 1 Vehicle | 244 (17.0%) | 235 (19.6%) |
| 2 Vehicles | 864 (60.2%) | 756 (63.0%) |
| 3 Vehicles | 246 (17.1%) | 130 (10.8%) |
| 4 Vehicles | 66 (4.6%) | 79 (6.6%) |
| 5 or more Vehicles | 0 (0.0%) | 0 (0.0%) |
| Total | 1,436 (100.0%) | 1,200 (100.0%) |
Commute Time in Taylor borough
The most frequently occuring commute durations in Taylor borough are 10 to 14 minutes (553 commuters, 22.5%), 15 to 19 minutes (453 commuters, 18.4%), and 20 to 24 minutes (408 commuters, 16.6%).
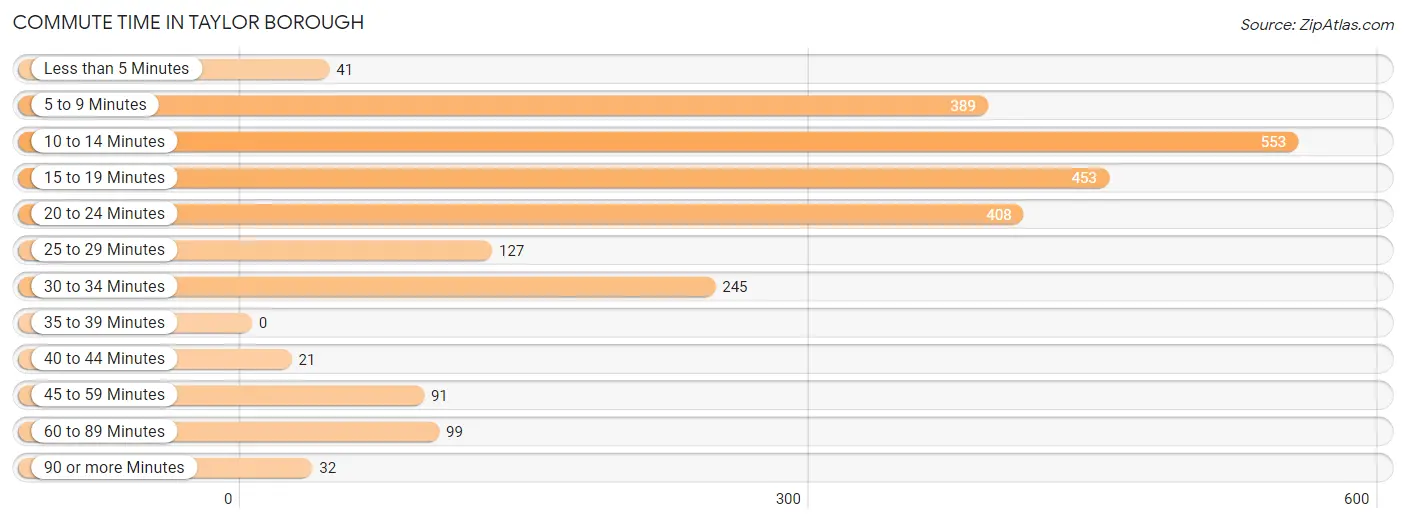
| Commute Time | # Commuters | % Commuters |
| Less than 5 Minutes | 41 | 1.7% |
| 5 to 9 Minutes | 389 | 15.8% |
| 10 to 14 Minutes | 553 | 22.5% |
| 15 to 19 Minutes | 453 | 18.4% |
| 20 to 24 Minutes | 408 | 16.6% |
| 25 to 29 Minutes | 127 | 5.2% |
| 30 to 34 Minutes | 245 | 10.0% |
| 35 to 39 Minutes | 0 | 0.0% |
| 40 to 44 Minutes | 21 | 0.9% |
| 45 to 59 Minutes | 91 | 3.7% |
| 60 to 89 Minutes | 99 | 4.0% |
| 90 or more Minutes | 32 | 1.3% |
Commute Time by Sex in Taylor borough
The most common commute times in Taylor borough are 15 to 19 minutes (301 commuters, 21.0%) for males and 10 to 14 minutes (311 commuters, 30.3%) for females.
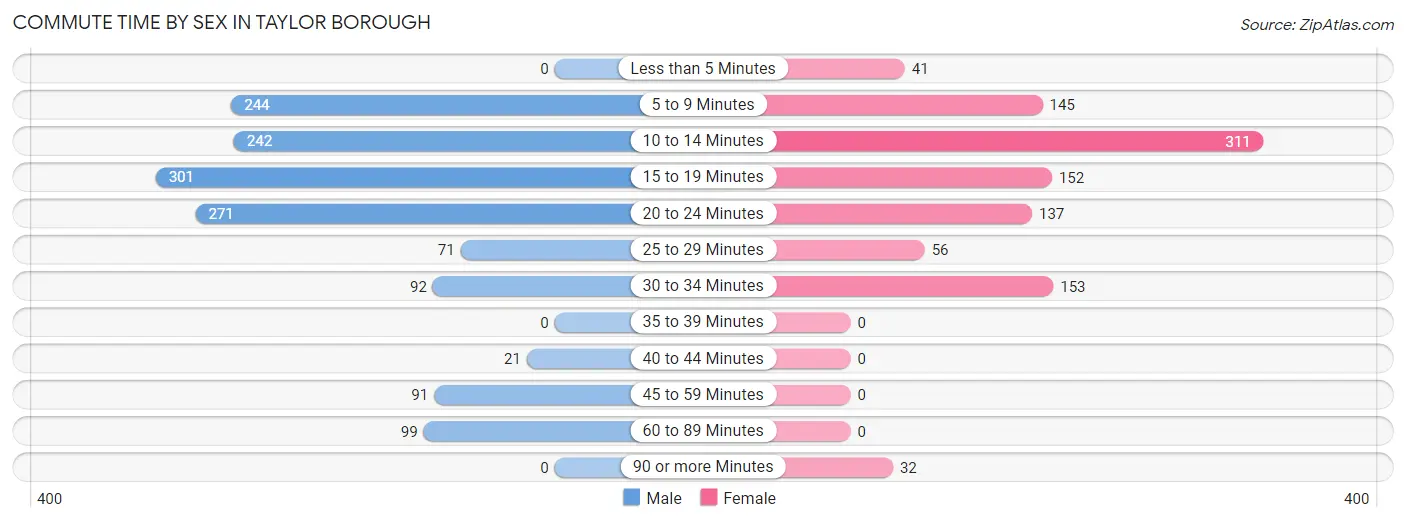
| Commute Time | Male | Female |
| Less than 5 Minutes | 0 (0.0%) | 41 (4.0%) |
| 5 to 9 Minutes | 244 (17.0%) | 145 (14.1%) |
| 10 to 14 Minutes | 242 (16.9%) | 311 (30.3%) |
| 15 to 19 Minutes | 301 (21.0%) | 152 (14.8%) |
| 20 to 24 Minutes | 271 (18.9%) | 137 (13.3%) |
| 25 to 29 Minutes | 71 (5.0%) | 56 (5.4%) |
| 30 to 34 Minutes | 92 (6.4%) | 153 (14.9%) |
| 35 to 39 Minutes | 0 (0.0%) | 0 (0.0%) |
| 40 to 44 Minutes | 21 (1.5%) | 0 (0.0%) |
| 45 to 59 Minutes | 91 (6.4%) | 0 (0.0%) |
| 60 to 89 Minutes | 99 (6.9%) | 0 (0.0%) |
| 90 or more Minutes | 0 (0.0%) | 32 (3.1%) |
Time of Departure to Work by Sex in Taylor borough
The most frequent times of departure to work in Taylor borough are 8:30 AM to 8:59 AM (303, 21.2%) for males and 7:30 AM to 7:59 AM (281, 27.4%) for females.
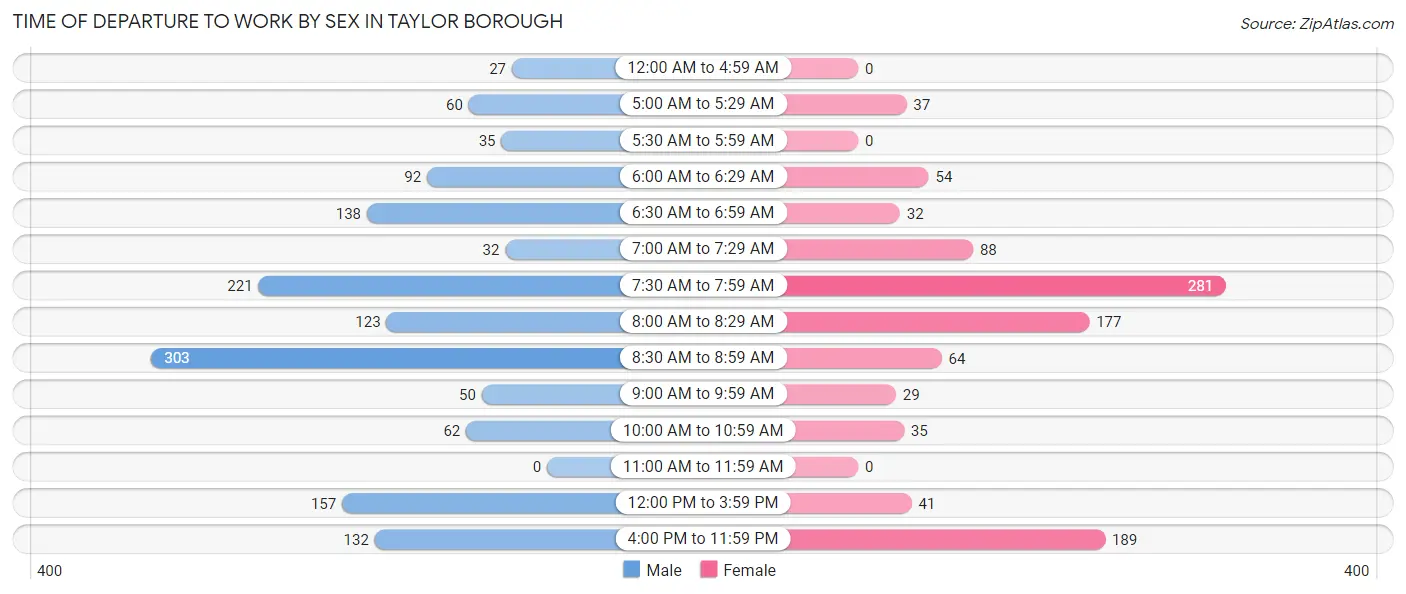
| Time of Departure | Male | Female |
| 12:00 AM to 4:59 AM | 27 (1.9%) | 0 (0.0%) |
| 5:00 AM to 5:29 AM | 60 (4.2%) | 37 (3.6%) |
| 5:30 AM to 5:59 AM | 35 (2.4%) | 0 (0.0%) |
| 6:00 AM to 6:29 AM | 92 (6.4%) | 54 (5.3%) |
| 6:30 AM to 6:59 AM | 138 (9.6%) | 32 (3.1%) |
| 7:00 AM to 7:29 AM | 32 (2.2%) | 88 (8.6%) |
| 7:30 AM to 7:59 AM | 221 (15.4%) | 281 (27.4%) |
| 8:00 AM to 8:29 AM | 123 (8.6%) | 177 (17.2%) |
| 8:30 AM to 8:59 AM | 303 (21.2%) | 64 (6.2%) |
| 9:00 AM to 9:59 AM | 50 (3.5%) | 29 (2.8%) |
| 10:00 AM to 10:59 AM | 62 (4.3%) | 35 (3.4%) |
| 11:00 AM to 11:59 AM | 0 (0.0%) | 0 (0.0%) |
| 12:00 PM to 3:59 PM | 157 (11.0%) | 41 (4.0%) |
| 4:00 PM to 11:59 PM | 132 (9.2%) | 189 (18.4%) |
| Total | 1,432 (100.0%) | 1,027 (100.0%) |
Housing Occupancy in Taylor borough
Occupancy by Ownership in Taylor borough
Of the total 2,432 dwellings in Taylor borough, owner-occupied units account for 1,523 (62.6%), while renter-occupied units make up 909 (37.4%).
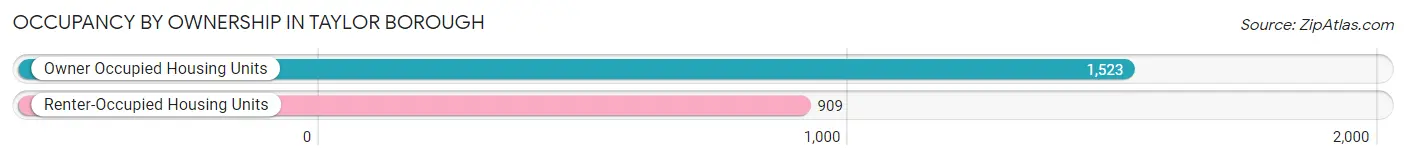
| Occupancy | # Housing Units | % Housing Units |
| Owner Occupied Housing Units | 1,523 | 62.6% |
| Renter-Occupied Housing Units | 909 | 37.4% |
| Total Occupied Housing Units | 2,432 | 100.0% |
Occupancy by Household Size in Taylor borough
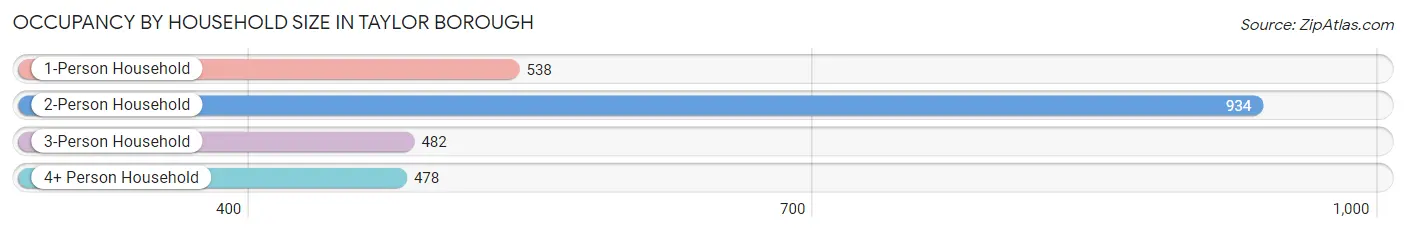
| Household Size | # Housing Units | % Housing Units |
| 1-Person Household | 538 | 22.1% |
| 2-Person Household | 934 | 38.4% |
| 3-Person Household | 482 | 19.8% |
| 4+ Person Household | 478 | 19.7% |
| Total Housing Units | 2,432 | 100.0% |
Occupancy by Ownership by Household Size in Taylor borough
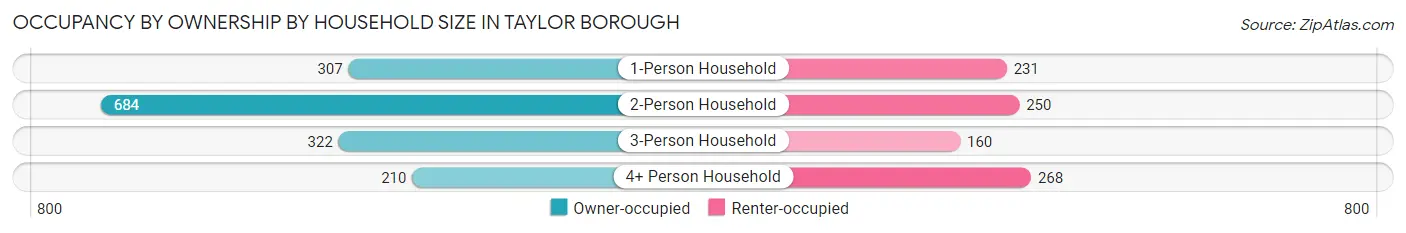
| Household Size | Owner-occupied | Renter-occupied |
| 1-Person Household | 307 (57.1%) | 231 (42.9%) |
| 2-Person Household | 684 (73.2%) | 250 (26.8%) |
| 3-Person Household | 322 (66.8%) | 160 (33.2%) |
| 4+ Person Household | 210 (43.9%) | 268 (56.1%) |
| Total Housing Units | 1,523 (62.6%) | 909 (37.4%) |
Occupancy by Educational Attainment in Taylor borough
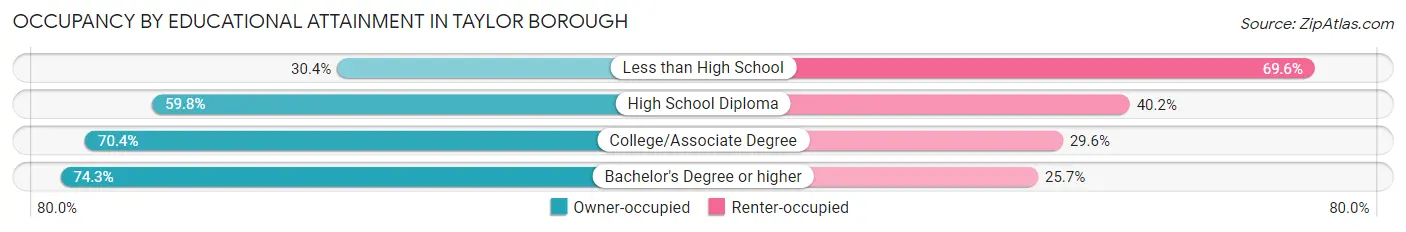
| Household Size | Owner-occupied | Renter-occupied |
| Less than High School | 84 (30.4%) | 192 (69.6%) |
| High School Diploma | 590 (59.8%) | 397 (40.2%) |
| College/Associate Degree | 357 (70.4%) | 150 (29.6%) |
| Bachelor's Degree or higher | 492 (74.3%) | 170 (25.7%) |
Occupancy by Age of Householder in Taylor borough
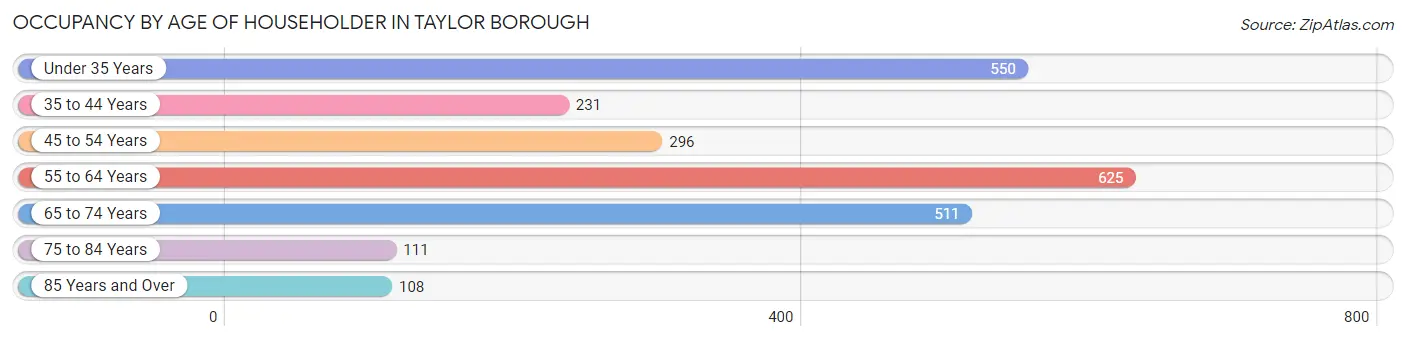
| Age Bracket | # Households | % Households |
| Under 35 Years | 550 | 22.6% |
| 35 to 44 Years | 231 | 9.5% |
| 45 to 54 Years | 296 | 12.2% |
| 55 to 64 Years | 625 | 25.7% |
| 65 to 74 Years | 511 | 21.0% |
| 75 to 84 Years | 111 | 4.6% |
| 85 Years and Over | 108 | 4.4% |
| Total | 2,432 | 100.0% |
Housing Finances in Taylor borough
Median Income by Occupancy in Taylor borough
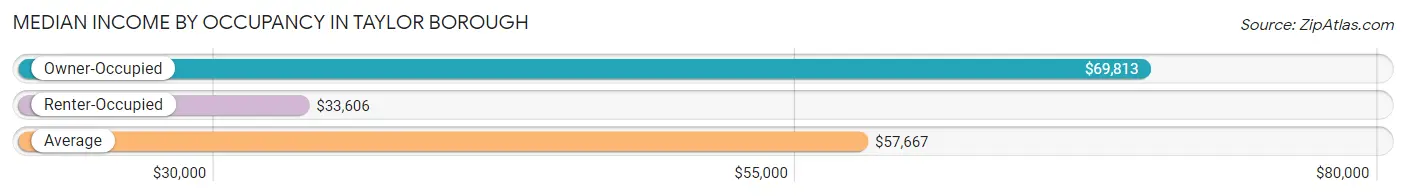
| Occupancy Type | # Households | Median Income |
| Owner-Occupied | 1,523 (62.6%) | $69,813 |
| Renter-Occupied | 909 (37.4%) | $33,606 |
| Average | 2,432 (100.0%) | $57,667 |
Occupancy by Householder Income Bracket in Taylor borough
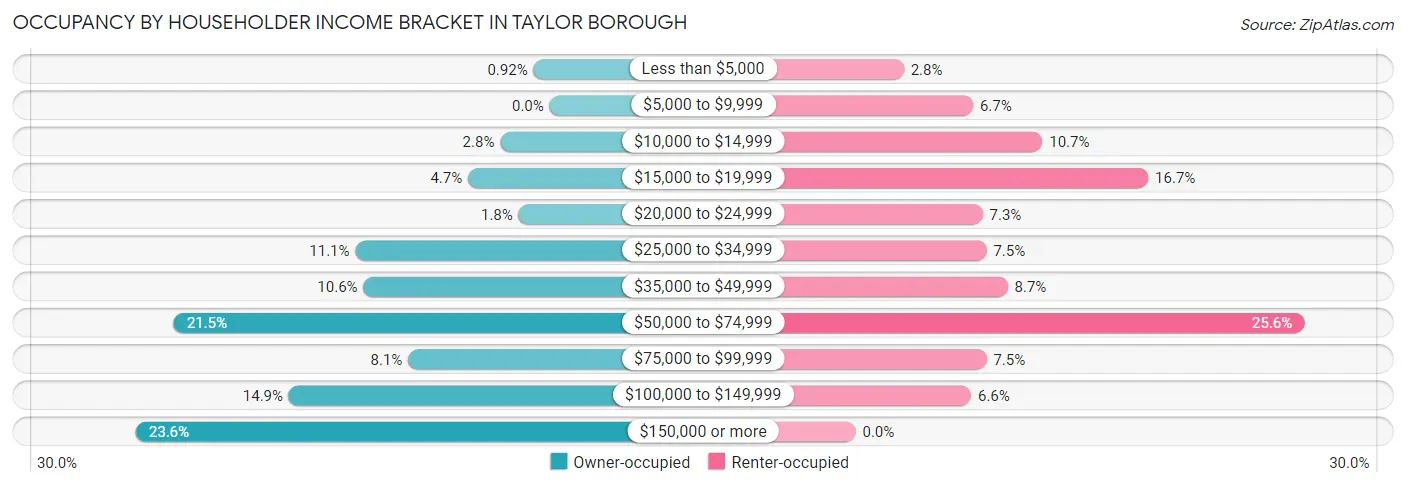
| Income Bracket | Owner-occupied | Renter-occupied |
| Less than $5,000 | 14 (0.9%) | 25 (2.8%) |
| $5,000 to $9,999 | 0 (0.0%) | 61 (6.7%) |
| $10,000 to $14,999 | 43 (2.8%) | 97 (10.7%) |
| $15,000 to $19,999 | 71 (4.7%) | 152 (16.7%) |
| $20,000 to $24,999 | 27 (1.8%) | 66 (7.3%) |
| $25,000 to $34,999 | 169 (11.1%) | 68 (7.5%) |
| $35,000 to $49,999 | 162 (10.6%) | 79 (8.7%) |
| $50,000 to $74,999 | 327 (21.5%) | 233 (25.6%) |
| $75,000 to $99,999 | 123 (8.1%) | 68 (7.5%) |
| $100,000 to $149,999 | 227 (14.9%) | 60 (6.6%) |
| $150,000 or more | 360 (23.6%) | 0 (0.0%) |
| Total | 1,523 (100.0%) | 909 (100.0%) |
Monthly Housing Cost Tiers in Taylor borough
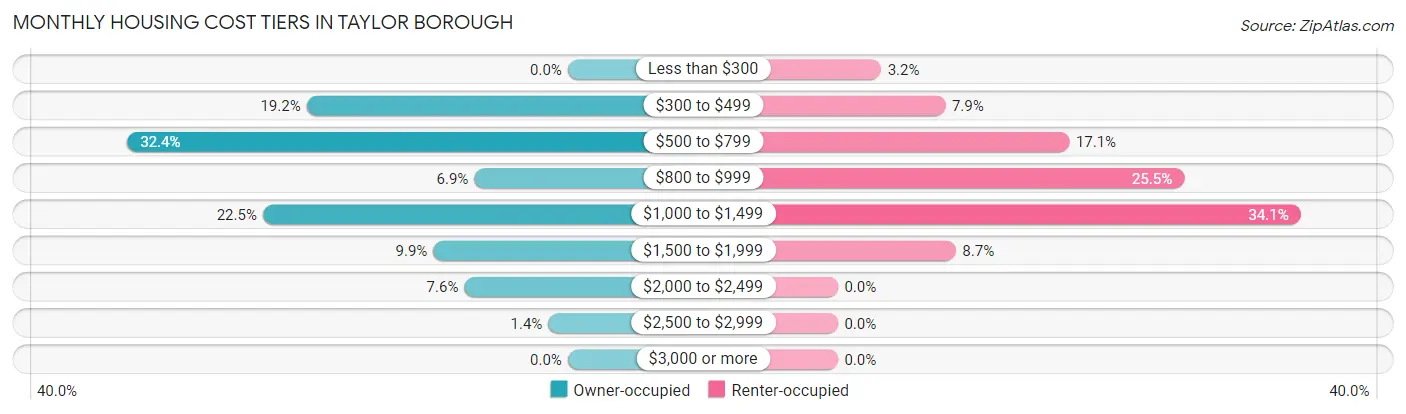
| Monthly Cost | Owner-occupied | Renter-occupied |
| Less than $300 | 0 (0.0%) | 29 (3.2%) |
| $300 to $499 | 293 (19.2%) | 72 (7.9%) |
| $500 to $799 | 494 (32.4%) | 155 (17.1%) |
| $800 to $999 | 105 (6.9%) | 232 (25.5%) |
| $1,000 to $1,499 | 342 (22.5%) | 310 (34.1%) |
| $1,500 to $1,999 | 151 (9.9%) | 79 (8.7%) |
| $2,000 to $2,499 | 116 (7.6%) | 0 (0.0%) |
| $2,500 to $2,999 | 22 (1.4%) | 0 (0.0%) |
| $3,000 or more | 0 (0.0%) | 0 (0.0%) |
| Total | 1,523 (100.0%) | 909 (100.0%) |
Physical Housing Characteristics in Taylor borough
Housing Structures in Taylor borough
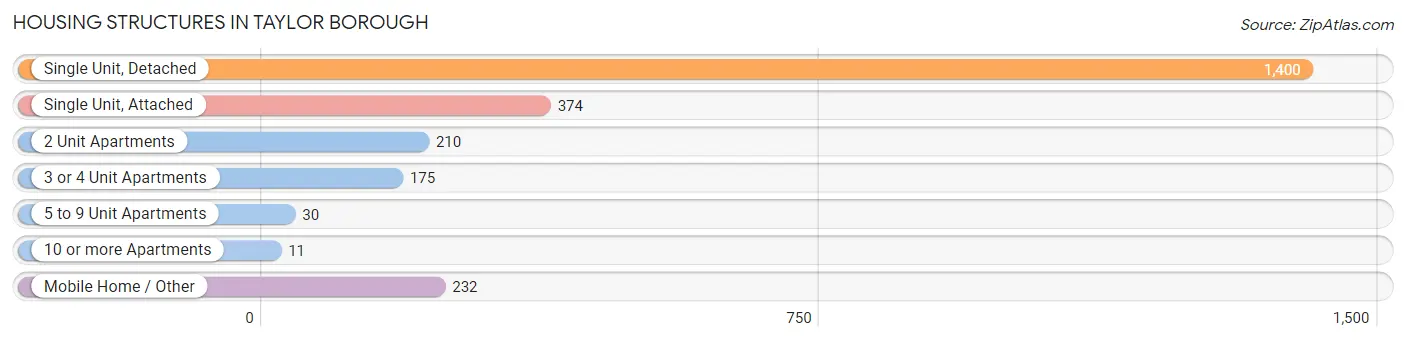
| Structure Type | # Housing Units | % Housing Units |
| Single Unit, Detached | 1,400 | 57.6% |
| Single Unit, Attached | 374 | 15.4% |
| 2 Unit Apartments | 210 | 8.6% |
| 3 or 4 Unit Apartments | 175 | 7.2% |
| 5 to 9 Unit Apartments | 30 | 1.2% |
| 10 or more Apartments | 11 | 0.4% |
| Mobile Home / Other | 232 | 9.5% |
| Total | 2,432 | 100.0% |
Housing Structures by Occupancy in Taylor borough
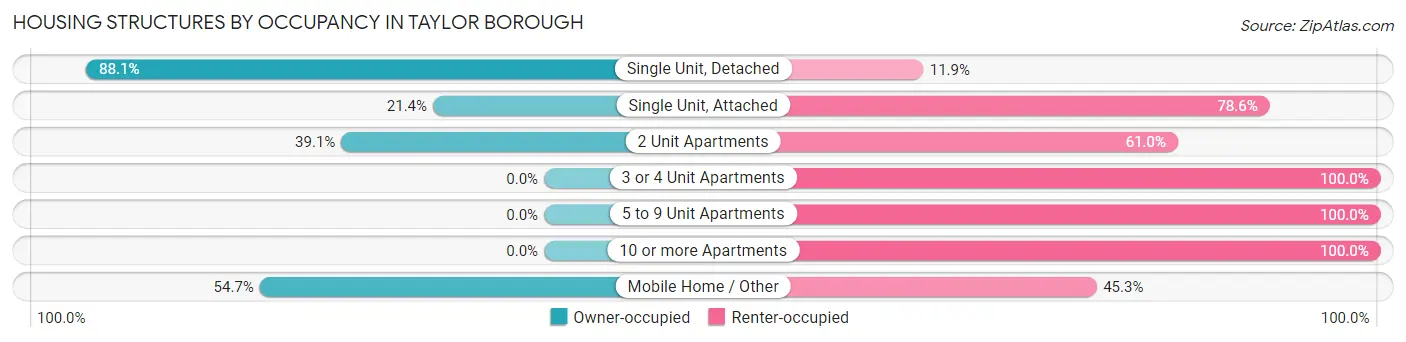
| Structure Type | Owner-occupied | Renter-occupied |
| Single Unit, Detached | 1,234 (88.1%) | 166 (11.9%) |
| Single Unit, Attached | 80 (21.4%) | 294 (78.6%) |
| 2 Unit Apartments | 82 (39.1%) | 128 (61.0%) |
| 3 or 4 Unit Apartments | 0 (0.0%) | 175 (100.0%) |
| 5 to 9 Unit Apartments | 0 (0.0%) | 30 (100.0%) |
| 10 or more Apartments | 0 (0.0%) | 11 (100.0%) |
| Mobile Home / Other | 127 (54.7%) | 105 (45.3%) |
| Total | 1,523 (62.6%) | 909 (37.4%) |
Housing Structures by Number of Rooms in Taylor borough
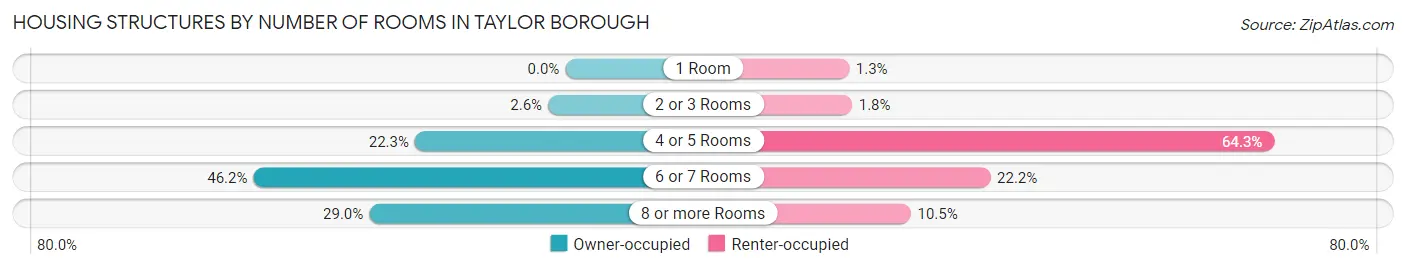
| Number of Rooms | Owner-occupied | Renter-occupied |
| 1 Room | 0 (0.0%) | 12 (1.3%) |
| 2 or 3 Rooms | 39 (2.6%) | 16 (1.8%) |
| 4 or 5 Rooms | 339 (22.3%) | 584 (64.2%) |
| 6 or 7 Rooms | 703 (46.2%) | 202 (22.2%) |
| 8 or more Rooms | 442 (29.0%) | 95 (10.4%) |
| Total | 1,523 (100.0%) | 909 (100.0%) |
Housing Structure by Heating Type in Taylor borough
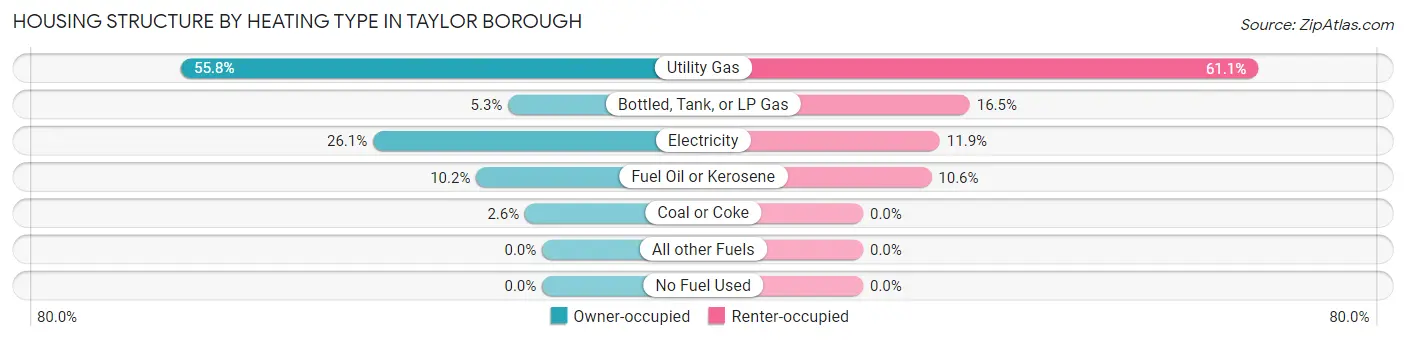
| Heating Type | Owner-occupied | Renter-occupied |
| Utility Gas | 850 (55.8%) | 555 (61.1%) |
| Bottled, Tank, or LP Gas | 80 (5.2%) | 150 (16.5%) |
| Electricity | 398 (26.1%) | 108 (11.9%) |
| Fuel Oil or Kerosene | 155 (10.2%) | 96 (10.6%) |
| Coal or Coke | 40 (2.6%) | 0 (0.0%) |
| All other Fuels | 0 (0.0%) | 0 (0.0%) |
| No Fuel Used | 0 (0.0%) | 0 (0.0%) |
| Total | 1,523 (100.0%) | 909 (100.0%) |
Household Vehicle Usage in Taylor borough
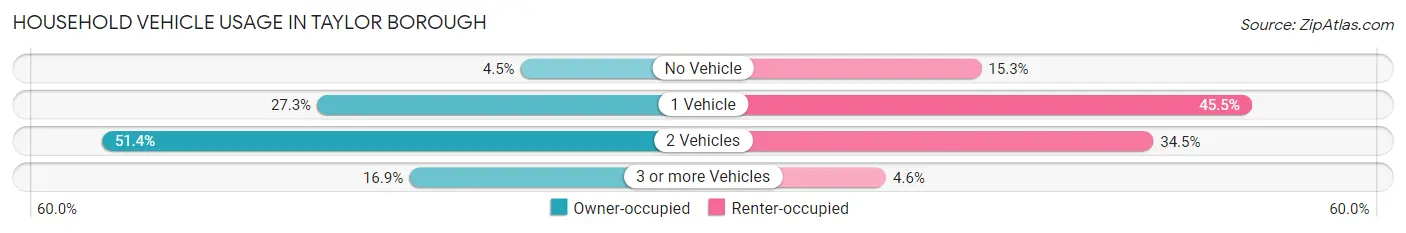
| Vehicles per Household | Owner-occupied | Renter-occupied |
| No Vehicle | 68 (4.5%) | 139 (15.3%) |
| 1 Vehicle | 415 (27.3%) | 414 (45.5%) |
| 2 Vehicles | 782 (51.3%) | 314 (34.5%) |
| 3 or more Vehicles | 258 (16.9%) | 42 (4.6%) |
| Total | 1,523 (100.0%) | 909 (100.0%) |
Real Estate & Mortgages in Taylor borough
Real Estate and Mortgage Overview in Taylor borough
| Characteristic | Without Mortgage | With Mortgage |
| Housing Units | 944 | 579 |
| Median Property Value | $149,000 | $166,000 |
| Median Household Income | $62,632 | $119 |
| Monthly Housing Costs | $614 | $0 |
| Real Estate Taxes | $2,237 | $0 |
Property Value by Mortgage Status in Taylor borough
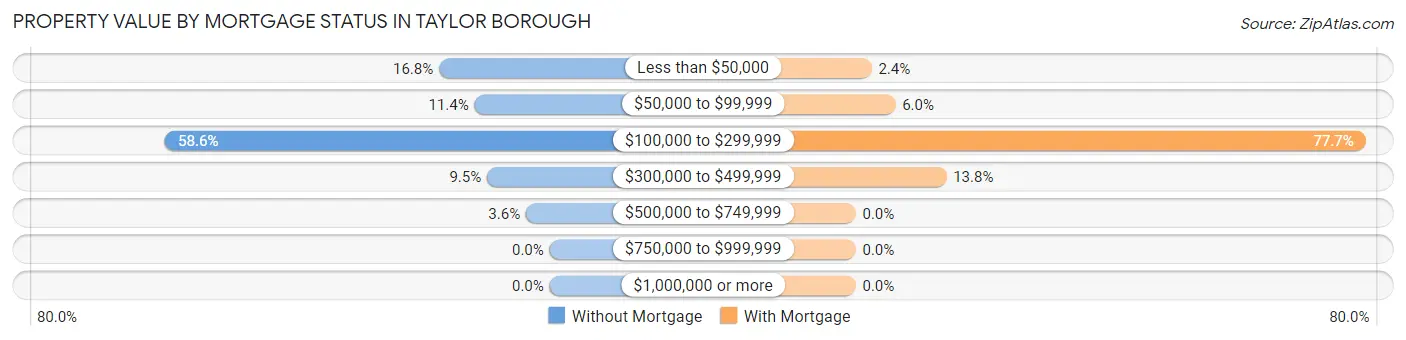
| Property Value | Without Mortgage | With Mortgage |
| Less than $50,000 | 159 (16.8%) | 14 (2.4%) |
| $50,000 to $99,999 | 108 (11.4%) | 35 (6.0%) |
| $100,000 to $299,999 | 553 (58.6%) | 450 (77.7%) |
| $300,000 to $499,999 | 90 (9.5%) | 80 (13.8%) |
| $500,000 to $749,999 | 34 (3.6%) | 0 (0.0%) |
| $750,000 to $999,999 | 0 (0.0%) | 0 (0.0%) |
| $1,000,000 or more | 0 (0.0%) | 0 (0.0%) |
| Total | 944 (100.0%) | 579 (100.0%) |
Household Income by Mortgage Status in Taylor borough
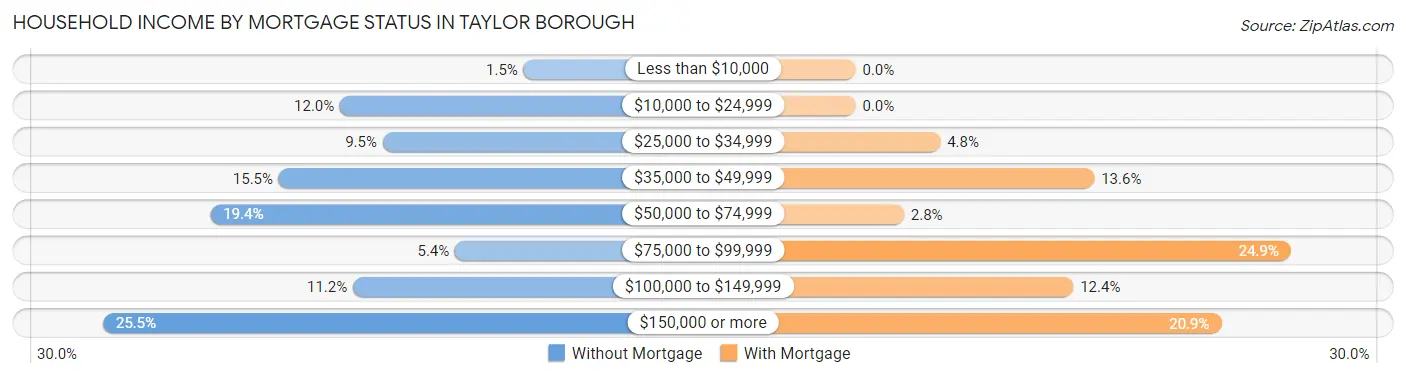
| Household Income | Without Mortgage | With Mortgage |
| Less than $10,000 | 14 (1.5%) | 0 (0.0%) |
| $10,000 to $24,999 | 113 (12.0%) | 0 (0.0%) |
| $25,000 to $34,999 | 90 (9.5%) | 28 (4.8%) |
| $35,000 to $49,999 | 146 (15.5%) | 79 (13.6%) |
| $50,000 to $74,999 | 183 (19.4%) | 16 (2.8%) |
| $75,000 to $99,999 | 51 (5.4%) | 144 (24.9%) |
| $100,000 to $149,999 | 106 (11.2%) | 72 (12.4%) |
| $150,000 or more | 241 (25.5%) | 121 (20.9%) |
| Total | 944 (100.0%) | 579 (100.0%) |
Property Value to Household Income Ratio in Taylor borough
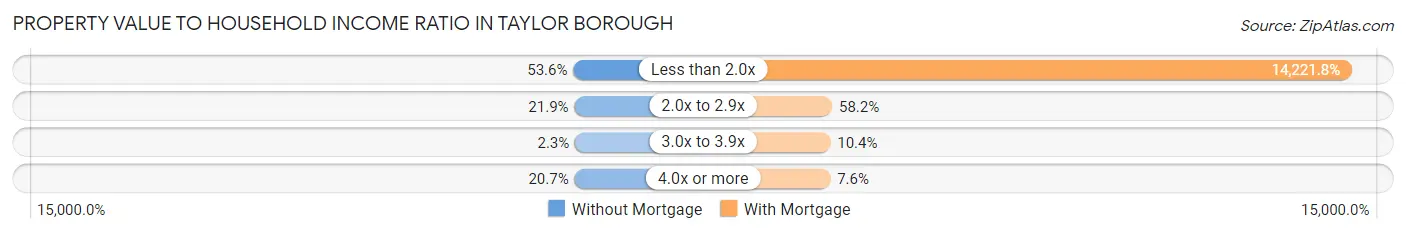
| Value-to-Income Ratio | Without Mortgage | With Mortgage |
| Less than 2.0x | 506 (53.6%) | 82,344 (14,221.8%) |
| 2.0x to 2.9x | 207 (21.9%) | 337 (58.2%) |
| 3.0x to 3.9x | 22 (2.3%) | 60 (10.4%) |
| 4.0x or more | 195 (20.7%) | 44 (7.6%) |
| Total | 944 (100.0%) | 579 (100.0%) |
Real Estate Taxes by Mortgage Status in Taylor borough
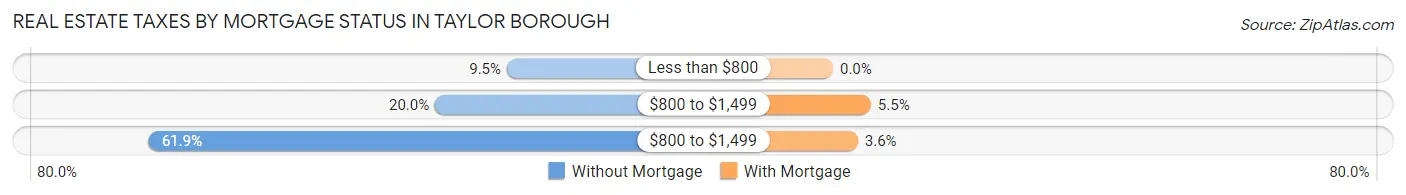
| Property Taxes | Without Mortgage | With Mortgage |
| Less than $800 | 90 (9.5%) | 0 (0.0%) |
| $800 to $1,499 | 189 (20.0%) | 32 (5.5%) |
| $800 to $1,499 | 584 (61.9%) | 21 (3.6%) |
| Total | 944 (100.0%) | 579 (100.0%) |
Health & Disability in Taylor borough
Health Insurance Coverage by Age in Taylor borough
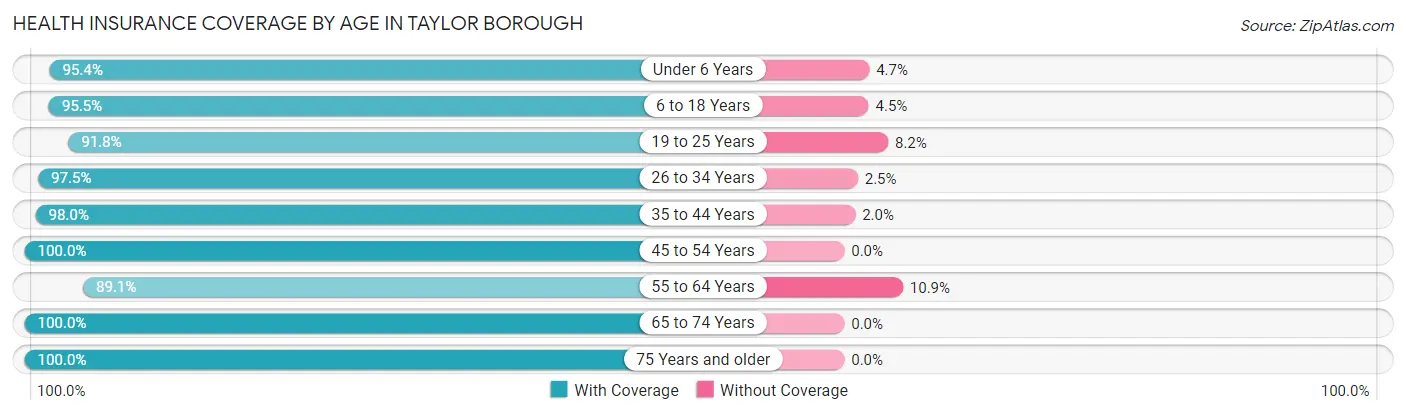
| Age Bracket | With Coverage | Without Coverage |
| Under 6 Years | 410 (95.4%) | 20 (4.6%) |
| 6 to 18 Years | 1,012 (95.5%) | 48 (4.5%) |
| 19 to 25 Years | 450 (91.8%) | 40 (8.2%) |
| 26 to 34 Years | 852 (97.5%) | 22 (2.5%) |
| 35 to 44 Years | 624 (98.0%) | 13 (2.0%) |
| 45 to 54 Years | 480 (100.0%) | 0 (0.0%) |
| 55 to 64 Years | 848 (89.1%) | 104 (10.9%) |
| 65 to 74 Years | 901 (100.0%) | 0 (0.0%) |
| 75 Years and older | 311 (100.0%) | 0 (0.0%) |
| Total | 5,888 (96.0%) | 247 (4.0%) |
Health Insurance Coverage by Citizenship Status in Taylor borough
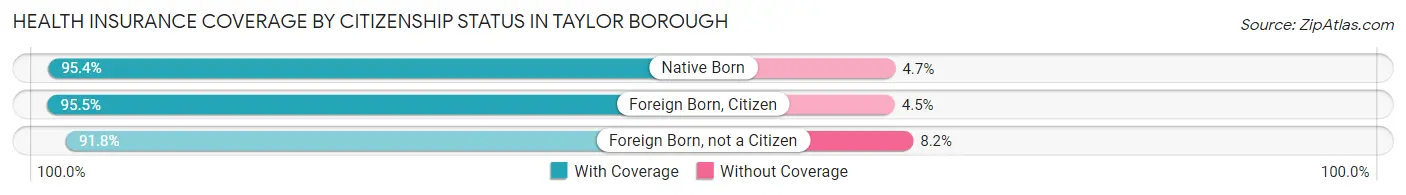
| Citizenship Status | With Coverage | Without Coverage |
| Native Born | 410 (95.4%) | 20 (4.6%) |
| Foreign Born, Citizen | 1,012 (95.5%) | 48 (4.5%) |
| Foreign Born, not a Citizen | 450 (91.8%) | 40 (8.2%) |
Health Insurance Coverage by Household Income in Taylor borough
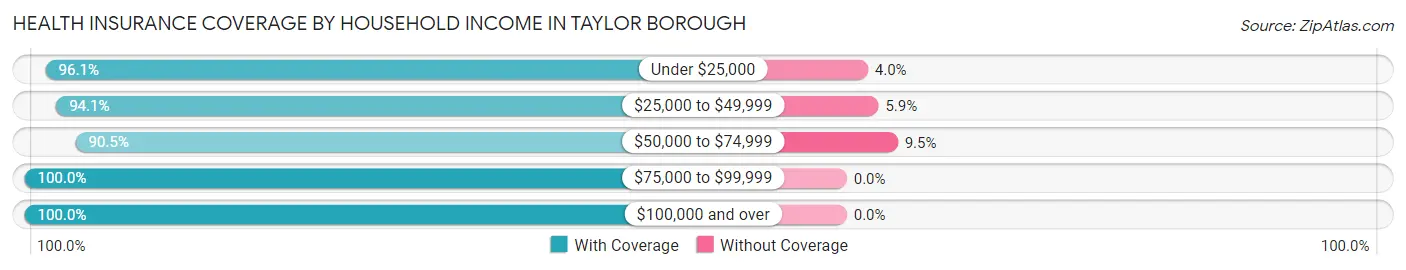
| Household Income | With Coverage | Without Coverage |
| Under $25,000 | 1,143 (96.1%) | 47 (4.0%) |
| $25,000 to $49,999 | 1,268 (94.1%) | 80 (5.9%) |
| $50,000 to $74,999 | 1,128 (90.5%) | 119 (9.5%) |
| $75,000 to $99,999 | 504 (100.0%) | 0 (0.0%) |
| $100,000 and over | 1,839 (100.0%) | 0 (0.0%) |
Public vs Private Health Insurance Coverage by Age in Taylor borough
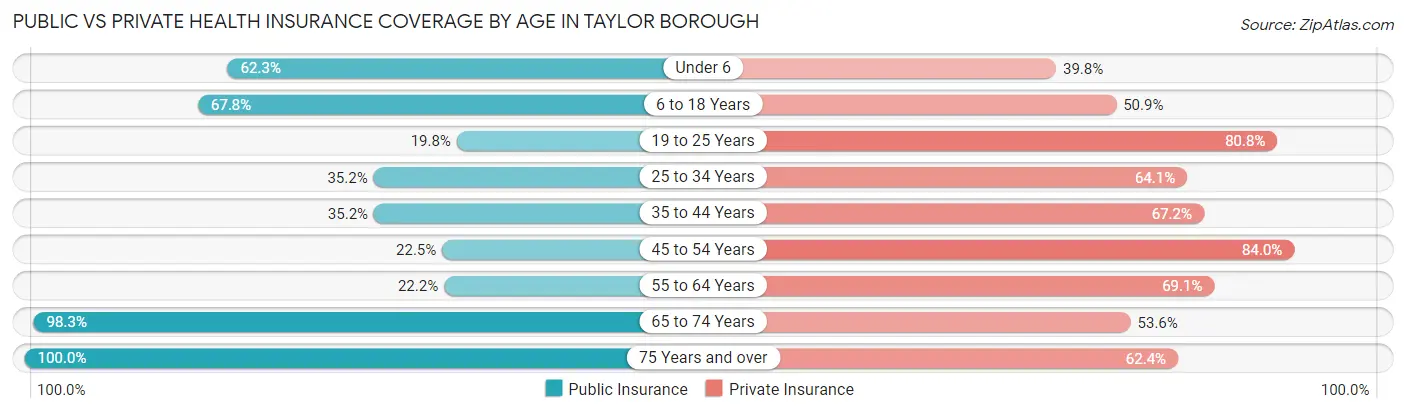
| Age Bracket | Public Insurance | Private Insurance |
| Under 6 | 268 (62.3%) | 171 (39.8%) |
| 6 to 18 Years | 719 (67.8%) | 540 (50.9%) |
| 19 to 25 Years | 97 (19.8%) | 396 (80.8%) |
| 25 to 34 Years | 308 (35.2%) | 560 (64.1%) |
| 35 to 44 Years | 224 (35.2%) | 428 (67.2%) |
| 45 to 54 Years | 108 (22.5%) | 403 (84.0%) |
| 55 to 64 Years | 211 (22.2%) | 658 (69.1%) |
| 65 to 74 Years | 886 (98.3%) | 483 (53.6%) |
| 75 Years and over | 311 (100.0%) | 194 (62.4%) |
| Total | 3,132 (51.0%) | 3,833 (62.5%) |
Disability Status by Sex by Age in Taylor borough
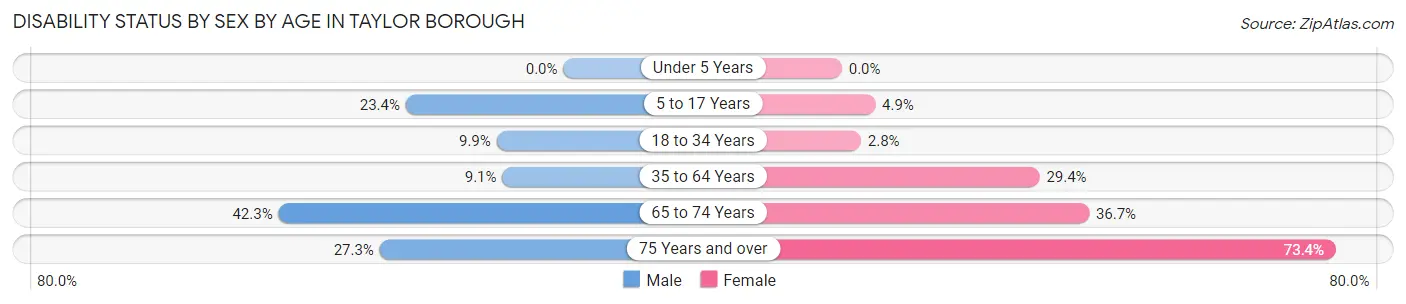
| Age Bracket | Male | Female |
| Under 5 Years | 0 (0.0%) | 0 (0.0%) |
| 5 to 17 Years | 121 (23.4%) | 27 (4.9%) |
| 18 to 34 Years | 80 (9.9%) | 18 (2.8%) |
| 35 to 64 Years | 101 (9.1%) | 280 (29.3%) |
| 65 to 74 Years | 184 (42.3%) | 171 (36.7%) |
| 75 Years and over | 6 (27.3%) | 212 (73.4%) |
Disability Class by Sex by Age in Taylor borough
Disability Class: Hearing Difficulty
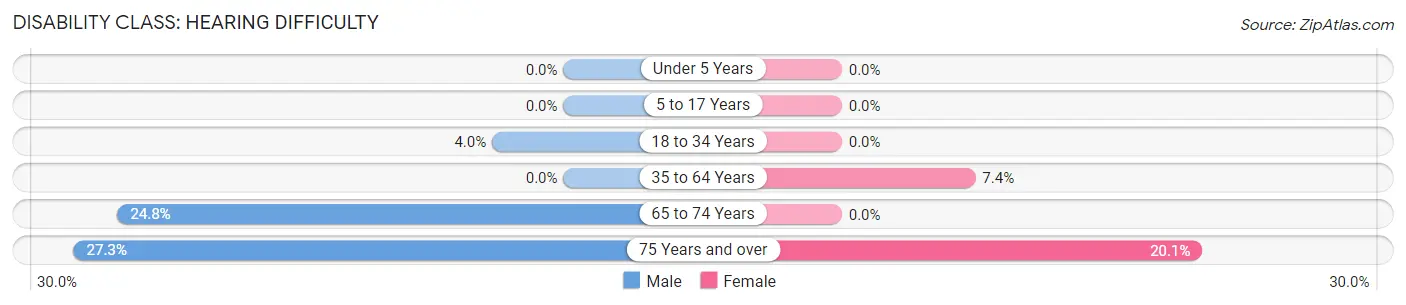
| Age Bracket | Male | Female |
| Under 5 Years | 0 (0.0%) | 0 (0.0%) |
| 5 to 17 Years | 0 (0.0%) | 0 (0.0%) |
| 18 to 34 Years | 32 (4.0%) | 0 (0.0%) |
| 35 to 64 Years | 0 (0.0%) | 71 (7.4%) |
| 65 to 74 Years | 108 (24.8%) | 0 (0.0%) |
| 75 Years and over | 6 (27.3%) | 58 (20.1%) |
Disability Class: Vision Difficulty
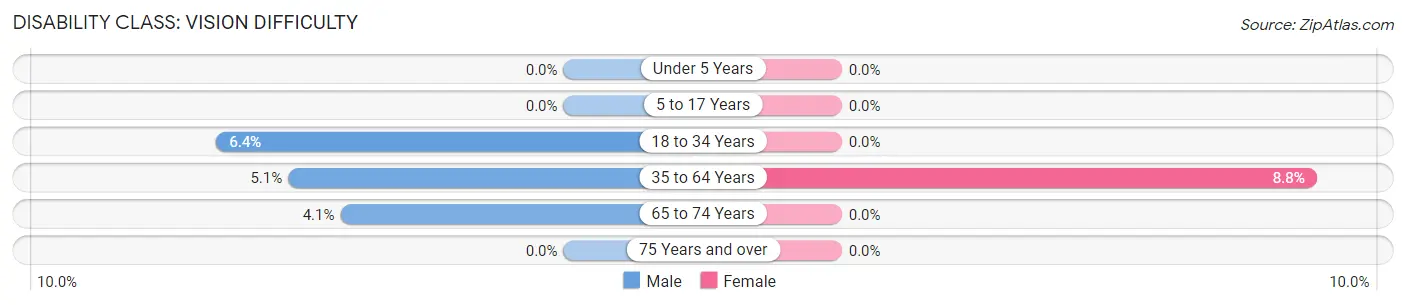
| Age Bracket | Male | Female |
| Under 5 Years | 0 (0.0%) | 0 (0.0%) |
| 5 to 17 Years | 0 (0.0%) | 0 (0.0%) |
| 18 to 34 Years | 52 (6.4%) | 0 (0.0%) |
| 35 to 64 Years | 57 (5.1%) | 84 (8.8%) |
| 65 to 74 Years | 18 (4.1%) | 0 (0.0%) |
| 75 Years and over | 0 (0.0%) | 0 (0.0%) |
Disability Class: Cognitive Difficulty
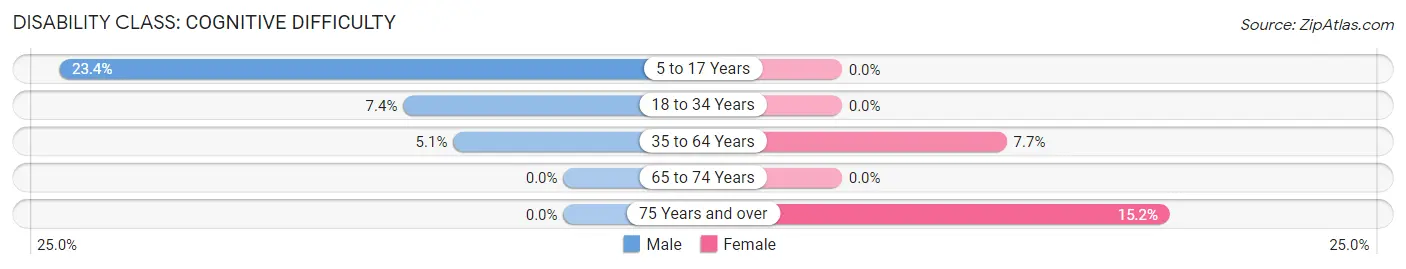
| Age Bracket | Male | Female |
| 5 to 17 Years | 121 (23.4%) | 0 (0.0%) |
| 18 to 34 Years | 60 (7.4%) | 0 (0.0%) |
| 35 to 64 Years | 57 (5.1%) | 73 (7.6%) |
| 65 to 74 Years | 0 (0.0%) | 0 (0.0%) |
| 75 Years and over | 0 (0.0%) | 44 (15.2%) |
Disability Class: Ambulatory Difficulty
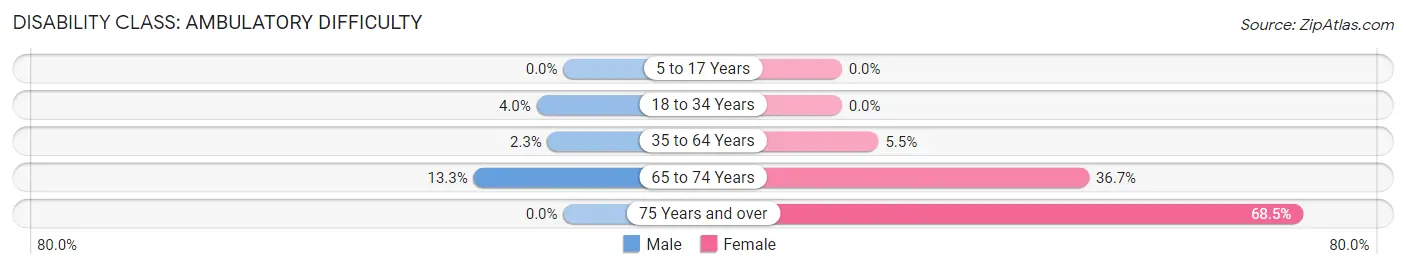
| Age Bracket | Male | Female |
| 5 to 17 Years | 0 (0.0%) | 0 (0.0%) |
| 18 to 34 Years | 32 (4.0%) | 0 (0.0%) |
| 35 to 64 Years | 26 (2.3%) | 52 (5.4%) |
| 65 to 74 Years | 58 (13.3%) | 171 (36.7%) |
| 75 Years and over | 0 (0.0%) | 198 (68.5%) |
Disability Class: Self-Care Difficulty
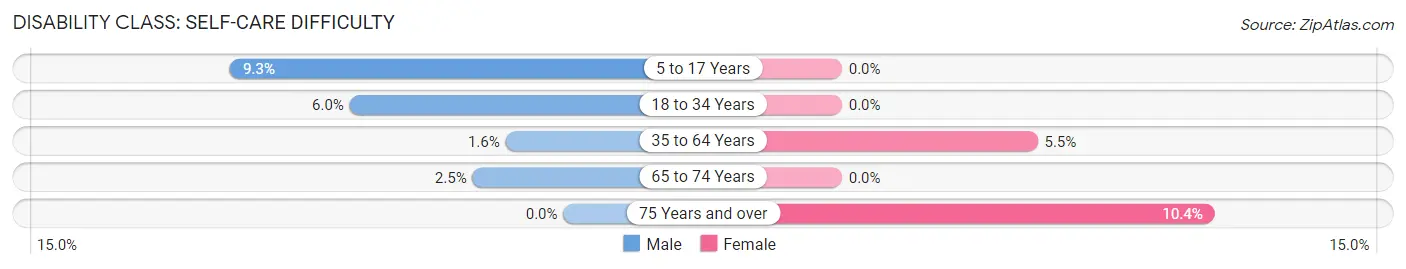
| Age Bracket | Male | Female |
| 5 to 17 Years | 48 (9.3%) | 0 (0.0%) |
| 18 to 34 Years | 48 (5.9%) | 0 (0.0%) |
| 35 to 64 Years | 18 (1.6%) | 52 (5.4%) |
| 65 to 74 Years | 11 (2.5%) | 0 (0.0%) |
| 75 Years and over | 0 (0.0%) | 30 (10.4%) |
Technology Access in Taylor borough
Computing Device Access in Taylor borough
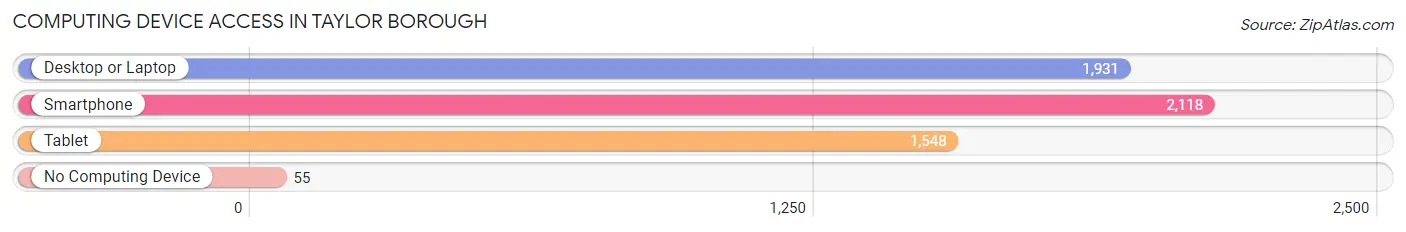
| Device Type | # Households | % Households |
| Desktop or Laptop | 1,931 | 79.4% |
| Smartphone | 2,118 | 87.1% |
| Tablet | 1,548 | 63.6% |
| No Computing Device | 55 | 2.3% |
| Total | 2,432 | 100.0% |
Internet Access in Taylor borough
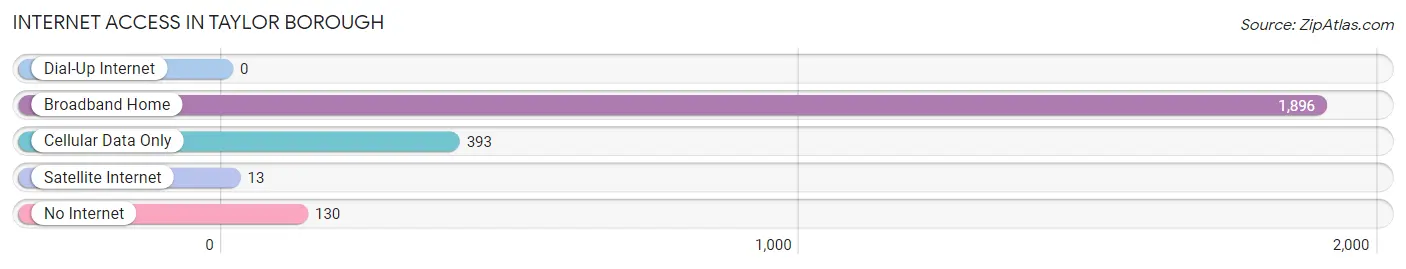
| Internet Type | # Households | % Households |
| Dial-Up Internet | 0 | 0.0% |
| Broadband Home | 1,896 | 78.0% |
| Cellular Data Only | 393 | 16.2% |
| Satellite Internet | 13 | 0.5% |
| No Internet | 130 | 5.3% |
| Total | 2,432 | 100.0% |
Taylor borough Summary
History
Taylor Borough is a small borough located in Lackawanna County, Pennsylvania. It is situated in the Scranton-Wilkes Barre-Hazleton Metropolitan Statistical Area. The borough was incorporated in 1866 and is named after William Taylor, a local landowner.
The area that is now Taylor Borough was originally inhabited by the Susquehannock Native American tribe. The first European settlers arrived in the area in the late 1700s. The area was part of the Connecticut Western Reserve, which was a large tract of land in the western part of Pennsylvania that was granted to Connecticut by the British government in 1786.
The first industry in the area was the coal mining industry, which began in the early 1800s. The coal industry was the main source of employment for the residents of Taylor Borough until the mid-1900s. The borough also had a thriving manufacturing industry, which included the production of textiles, furniture, and other goods.
The borough was also home to a number of educational institutions, including the Taylor Borough High School, which was established in 1891. The school was later renamed the Taylor High School and is still in operation today.
Geography
Taylor Borough is located in Lackawanna County, Pennsylvania. It is situated in the Scranton-Wilkes Barre-Hazleton Metropolitan Statistical Area. The borough is bordered by the cities of Scranton and Wilkes-Barre to the north, and the boroughs of Old Forge and Moosic to the south.
The borough has a total area of 1.3 square miles, all of which is land. The borough is located in the Lackawanna Valley, which is a region of rolling hills and valleys. The borough is located at an elevation of 1,000 feet above sea level.
The climate in Taylor Borough is classified as humid continental, with cold winters and hot, humid summers. The average annual temperature is 48 degrees Fahrenheit, and the average annual precipitation is 40 inches.
Economy
The economy of Taylor Borough is largely based on the service industry. The borough is home to a number of retail stores, restaurants, and other businesses. The borough also has a number of manufacturing companies, including a furniture manufacturer and a textile manufacturer.
The borough is also home to a number of educational institutions, including the Taylor High School and the Lackawanna College. The borough is also home to a number of medical facilities, including the Taylor Hospital and the Taylor Medical Center.
Demographics
As of the 2010 census, the population of Taylor Borough was 6,817. The racial makeup of the borough was 94.3% White, 2.2% African American, 0.3% Native American, 0.7% Asian, 0.1% Pacific Islander, and 2.4% from other races. Hispanic or Latino of any race were 4.2% of the population.
The median household income in Taylor Borough was $37,917, and the median family income was $45,938. The per capita income in the borough was $19,945. About 11.3% of families and 14.2% of the population were below the poverty line, including 22.2% of those under age 18 and 8.2% of those age 65 or over.
Common Questions
What is the Total Population of Taylor borough?
Total Population of Taylor borough is 6,274.
What is the Total Male Population of Taylor borough?
Total Male Population of Taylor borough is 3,102.
What is the Total Female Population of Taylor borough?
Total Female Population of Taylor borough is 3,172.
What is the Ratio of Males per 100 Females in Taylor borough?
There are 97.79 Males per 100 Females in Taylor borough.
What is the Ratio of Females per 100 Males in Taylor borough?
There are 102.26 Females per 100 Males in Taylor borough.
What is the Median Population Age in Taylor borough?
Median Population Age in Taylor borough is 38.4 Years.
What is the Average Family Size in Taylor borough
Average Family Size in Taylor borough is 2.9 People.
What is the Average Household Size in Taylor borough
Average Household Size in Taylor borough is 2.5 People.
What is Per Capita Income in Taylor borough?
Per Capita income in Taylor borough is $31,708.
What is the Median Family Income in Taylor borough?
Median Family Income in Taylor borough is $57,209.
What is the Median Household income in Taylor borough?
Median Household Income in Taylor borough is $57,667.
What is Income or Wage Gap in Taylor borough?
Income or Wage Gap in Taylor borough is 13.6%.
Women in Taylor borough earn 86.4 cents for every dollar earned by a man.
What is Inequality or Gini Index in Taylor borough?
Inequality or Gini Index in Taylor borough is 0.48.
How Large is the Labor Force in Taylor borough?
There are 2,912 People in the Labor Forcein in Taylor borough.
What is the Percentage of People in the Labor Force in Taylor borough?
57.7% of People are in the Labor Force in Taylor borough.
What is the Unemployment Rate in Taylor borough?
Unemployment Rate in Taylor borough is 9.5%.