Cities with the Lowest Wage/Income Gap (%) in Kansas
RELATED REPORTS & OPTIONS
Lowest Wage/Income Gap (%)
Kansas
Compare Cities
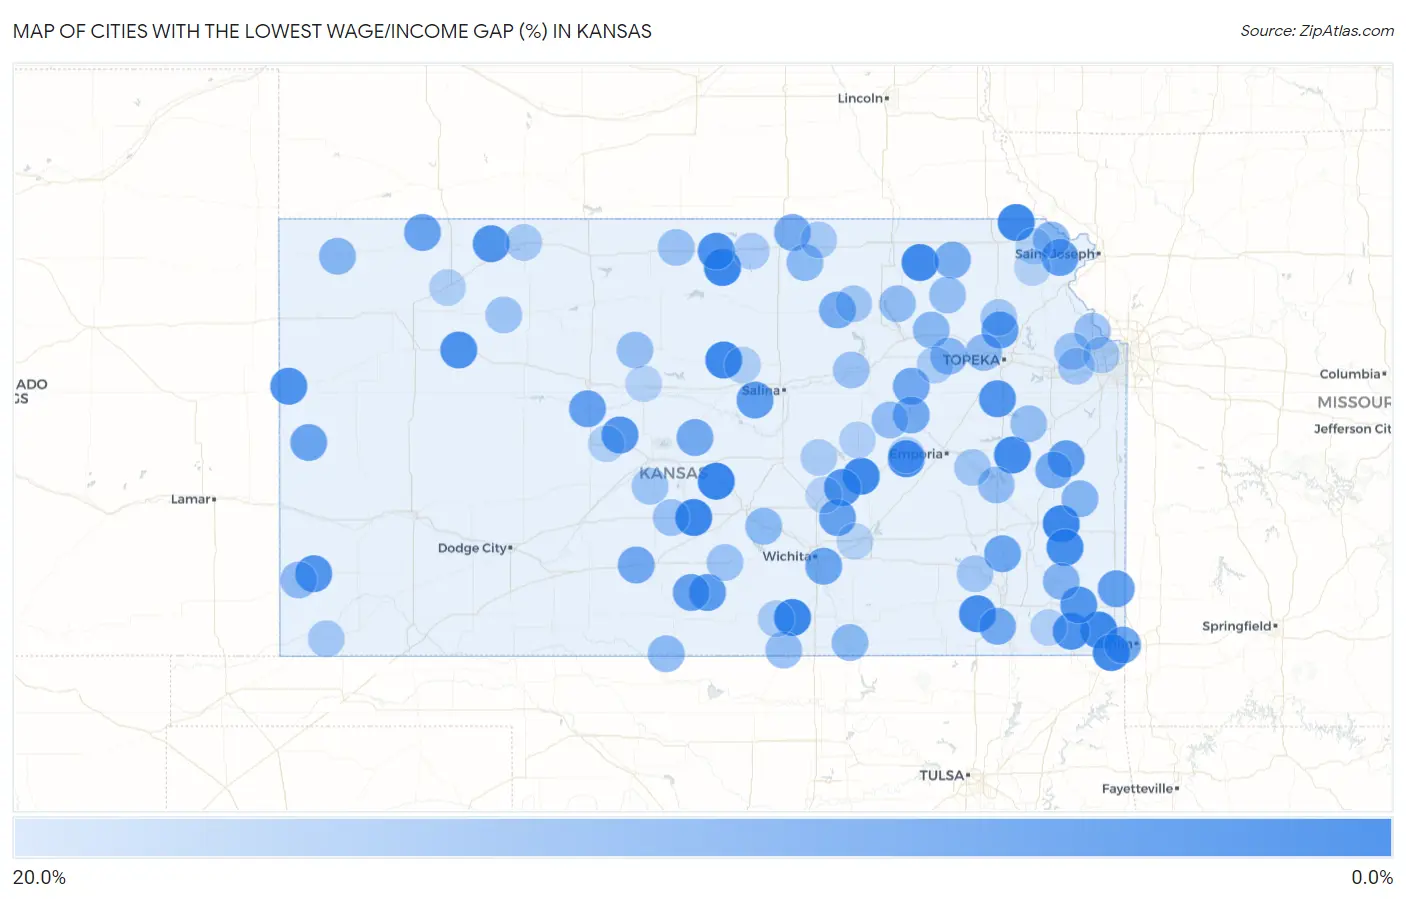
Map of Cities with the Lowest Wage/Income Gap (%) in Kansas
20.0%
0.0%
Cities with the Lowest Wage/Income Gap (%) in Kansas
| City | Wage/Income Gap (%) | vs State | vs National | |
| 1. | Sterling | 0.89% | 30.4%(-0.295)#1 | 28.0%(-0.271)#216 |
| 2. | Mayfield | 1.1% | 30.4%(-0.293)#2 | 28.0%(-0.269)#280 |
| 3. | Sylvia | 1.3% | 30.4%(-0.291)#3 | 28.0%(-0.266)#353 |
| 4. | Moran | 1.4% | 30.4%(-0.290)#4 | 28.0%(-0.266)#373 |
| 5. | Jewell | 1.4% | 30.4%(-0.290)#5 | 28.0%(-0.265)#377 |
| 6. | Reserve | 1.8% | 30.4%(-0.287)#6 | 28.0%(-0.262)#450 |
| 7. | Columbus | 1.8% | 30.4%(-0.286)#7 | 28.0%(-0.262)#459 |
| 8. | Baxter Springs | 2.0% | 30.4%(-0.284)#8 | 28.0%(-0.260)#495 |
| 9. | Florence | 2.0% | 30.4%(-0.284)#9 | 28.0%(-0.260)#496 |
| 10. | Frankfort | 2.0% | 30.4%(-0.284)#10 | 28.0%(-0.260)#499 |
| 11. | Lincoln Center | 2.1% | 30.4%(-0.283)#11 | 28.0%(-0.259)#524 |
| 12. | Waverly | 2.5% | 30.4%(-0.280)#12 | 28.0%(-0.255)#618 |
| 13. | Savonburg | 2.8% | 30.4%(-0.276)#13 | 28.0%(-0.252)#699 |
| 14. | Elk City | 2.9% | 30.4%(-0.275)#14 | 28.0%(-0.251)#734 |
| 15. | Cottonwood Falls | 3.0% | 30.4%(-0.274)#15 | 28.0%(-0.250)#758 |
| 16. | Weskan | 3.8% | 30.4%(-0.266)#16 | 28.0%(-0.242)#942 |
| 17. | Mankato | 3.8% | 30.4%(-0.266)#17 | 28.0%(-0.241)#958 |
| 18. | Grainfield | 3.8% | 30.4%(-0.266)#18 | 28.0%(-0.241)#962 |
| 19. | Oswego | 4.0% | 30.4%(-0.265)#19 | 28.0%(-0.240)#992 |
| 20. | Norcatur | 4.0% | 30.4%(-0.264)#20 | 28.0%(-0.240)#1,013 |
| 21. | Scranton | 4.4% | 30.4%(-0.261)#21 | 28.0%(-0.236)#1,098 |
| 22. | Peabody | 4.5% | 30.4%(-0.259)#22 | 28.0%(-0.235)#1,140 |
| 23. | Mccune | 4.8% | 30.4%(-0.257)#23 | 28.0%(-0.232)#1,194 |
| 24. | Johnson City | 4.8% | 30.4%(-0.256)#24 | 28.0%(-0.231)#1,213 |
| 25. | Otis | 5.0% | 30.4%(-0.254)#25 | 28.0%(-0.230)#1,266 |
| 26. | Zenda | 5.6% | 30.4%(-0.248)#26 | 28.0%(-0.224)#1,441 |
| 27. | Hoyt | 6.2% | 30.4%(-0.242)#27 | 28.0%(-0.218)#1,591 |
| 28. | Brookville | 6.2% | 30.4%(-0.242)#28 | 28.0%(-0.218)#1,592 |
| 29. | Bendena | 6.5% | 30.4%(-0.239)#29 | 28.0%(-0.215)#1,658 |
| 30. | Greeley | 6.5% | 30.4%(-0.239)#30 | 28.0%(-0.214)#1,666 |
| 31. | Frontenac | 6.8% | 30.4%(-0.236)#31 | 28.0%(-0.212)#1,731 |
| 32. | Schoenchen | 7.0% | 30.4%(-0.234)#32 | 28.0%(-0.210)#1,782 |
| 33. | Whitewater | 7.4% | 30.4%(-0.230)#33 | 28.0%(-0.206)#1,904 |
| 34. | Nashville | 7.5% | 30.4%(-0.229)#34 | 28.0%(-0.205)#1,944 |
| 35. | Herndon | 7.6% | 30.4%(-0.229)#35 | 28.0%(-0.204)#1,964 |
| 36. | Horace | 7.9% | 30.4%(-0.226)#36 | 28.0%(-0.201)#2,056 |
| 37. | Galena | 7.9% | 30.4%(-0.225)#37 | 28.0%(-0.201)#2,073 |
| 38. | Buffalo | 8.2% | 30.4%(-0.222)#38 | 28.0%(-0.198)#2,155 |
| 39. | Mcconnell Afb | 8.2% | 30.4%(-0.222)#39 | 28.0%(-0.198)#2,160 |
| 40. | Greeley County Unified Government (Balance) | 8.5% | 30.4%(-0.219)#40 | 28.0%(-0.194)#2,272 |
| 41. | Alta Vista | 8.9% | 30.4%(-0.215)#41 | 28.0%(-0.191)#2,370 |
| 42. | Cullison | 9.0% | 30.4%(-0.214)#42 | 28.0%(-0.190)#2,394 |
| 43. | Bushton | 9.0% | 30.4%(-0.214)#43 | 28.0%(-0.189)#2,413 |
| 44. | Council Grove | 9.4% | 30.4%(-0.211)#44 | 28.0%(-0.186)#2,511 |
| 45. | Garnett | 9.4% | 30.4%(-0.210)#45 | 28.0%(-0.186)#2,534 |
| 46. | Independence | 9.6% | 30.4%(-0.209)#46 | 28.0%(-0.184)#2,574 |
| 47. | Munden | 9.7% | 30.4%(-0.207)#47 | 28.0%(-0.183)#2,606 |
| 48. | Clay Center | 9.7% | 30.4%(-0.207)#48 | 28.0%(-0.183)#2,608 |
| 49. | Centralia | 10.0% | 30.4%(-0.204)#49 | 28.0%(-0.180)#2,697 |
| 50. | St Paul | 11.6% | 30.4%(-0.188)#50 | 28.0%(-0.164)#3,204 |
| 51. | Bird City | 11.7% | 30.4%(-0.187)#51 | 28.0%(-0.162)#3,250 |
| 52. | Highland | 11.8% | 30.4%(-0.186)#52 | 28.0%(-0.162)#3,266 |
| 53. | Blue Mound | 11.9% | 30.4%(-0.185)#53 | 28.0%(-0.161)#3,295 |
| 54. | Paxico | 12.2% | 30.4%(-0.182)#54 | 28.0%(-0.157)#3,419 |
| 55. | Louisville | 12.3% | 30.4%(-0.181)#55 | 28.0%(-0.156)#3,460 |
| 56. | Haven | 12.6% | 30.4%(-0.178)#56 | 28.0%(-0.154)#3,556 |
| 57. | Agenda | 12.7% | 30.4%(-0.177)#57 | 28.0%(-0.153)#3,582 |
| 58. | Arkansas City | 12.8% | 30.4%(-0.177)#58 | 28.0%(-0.152)#3,610 |
| 59. | Hardtner | 12.8% | 30.4%(-0.176)#59 | 28.0%(-0.152)#3,621 |
| 60. | Manter | 13.0% | 30.4%(-0.175)#60 | 28.0%(-0.150)#3,667 |
| 61. | Silver Lake | 13.2% | 30.4%(-0.172)#61 | 28.0%(-0.147)#3,767 |
| 62. | Caldwell | 13.7% | 30.4%(-0.168)#62 | 28.0%(-0.143)#3,911 |
| 63. | Olsburg | 13.7% | 30.4%(-0.167)#63 | 28.0%(-0.143)#3,921 |
| 64. | Burlington | 13.7% | 30.4%(-0.167)#64 | 28.0%(-0.143)#3,930 |
| 65. | Wilsey | 13.8% | 30.4%(-0.166)#65 | 28.0%(-0.141)#3,970 |
| 66. | Paradise | 14.2% | 30.4%(-0.162)#66 | 28.0%(-0.138)#4,085 |
| 67. | Pomona | 14.3% | 30.4%(-0.161)#67 | 28.0%(-0.137)#4,131 |
| 68. | Onaga | 14.3% | 30.4%(-0.161)#68 | 28.0%(-0.137)#4,134 |
| 69. | Lansing | 14.6% | 30.4%(-0.158)#69 | 28.0%(-0.134)#4,231 |
| 70. | Lebanon | 14.7% | 30.4%(-0.157)#70 | 28.0%(-0.133)#4,262 |
| 71. | Chapman | 14.7% | 30.4%(-0.157)#71 | 28.0%(-0.133)#4,268 |
| 72. | Stafford | 14.8% | 30.4%(-0.157)#72 | 28.0%(-0.132)#4,285 |
| 73. | Tonganoxie | 14.9% | 30.4%(-0.155)#73 | 28.0%(-0.131)#4,332 |
| 74. | Kingman | 15.0% | 30.4%(-0.154)#74 | 28.0%(-0.130)#4,370 |
| 75. | Morland | 15.0% | 30.4%(-0.154)#75 | 28.0%(-0.129)#4,389 |
| 76. | Seward | 15.1% | 30.4%(-0.153)#76 | 28.0%(-0.128)#4,426 |
| 77. | Linwood | 15.7% | 30.4%(-0.147)#77 | 28.0%(-0.123)#4,645 |
| 78. | New Albany | 15.8% | 30.4%(-0.146)#78 | 28.0%(-0.122)#4,685 |
| 79. | Hartford | 15.9% | 30.4%(-0.146)#79 | 28.0%(-0.121)#4,717 |
| 80. | Mayetta | 16.1% | 30.4%(-0.144)#80 | 28.0%(-0.119)#4,799 |
| 81. | Green | 16.1% | 30.4%(-0.143)#81 | 28.0%(-0.119)#4,823 |
| 82. | Rolla | 16.2% | 30.4%(-0.143)#82 | 28.0%(-0.118)#4,845 |
| 83. | Norton | 16.5% | 30.4%(-0.139)#83 | 28.0%(-0.115)#4,978 |
| 84. | Edwardsville | 16.6% | 30.4%(-0.138)#84 | 28.0%(-0.114)#5,048 |
| 85. | Milan | 16.6% | 30.4%(-0.138)#85 | 28.0%(-0.114)#5,053 |
| 86. | Haddam | 16.6% | 30.4%(-0.138)#86 | 28.0%(-0.113)#5,060 |
| 87. | Courtland | 16.9% | 30.4%(-0.135)#87 | 28.0%(-0.111)#5,163 |
| 88. | Lehigh | 17.1% | 30.4%(-0.133)#88 | 28.0%(-0.108)#5,249 |
| 89. | Alma | 17.2% | 30.4%(-0.133)#89 | 28.0%(-0.108)#5,254 |
| 90. | Beverly | 17.4% | 30.4%(-0.130)#90 | 28.0%(-0.106)#5,354 |
| 91. | Altamont | 17.7% | 30.4%(-0.127)#91 | 28.0%(-0.103)#5,481 |
| 92. | Timken | 17.8% | 30.4%(-0.126)#92 | 28.0%(-0.102)#5,515 |
| 93. | Lincolnville | 17.8% | 30.4%(-0.126)#93 | 28.0%(-0.102)#5,522 |
| 94. | Selden | 17.8% | 30.4%(-0.126)#94 | 28.0%(-0.102)#5,526 |
| 95. | Strong City | 18.0% | 30.4%(-0.124)#95 | 28.0%(-0.100)#5,600 |
| 96. | Towanda | 18.3% | 30.4%(-0.121)#96 | 28.0%(-0.097)#5,736 |
| 97. | Robinson | 18.4% | 30.4%(-0.120)#97 | 28.0%(-0.096)#5,766 |
| 98. | Everest | 18.4% | 30.4%(-0.120)#98 | 28.0%(-0.096)#5,770 |
| 99. | Russell | 18.5% | 30.4%(-0.120)#99 | 28.0%(-0.095)#5,797 |
| 100. | Walton | 18.6% | 30.4%(-0.118)#100 | 28.0%(-0.094)#5,866 |
Common Questions
What are the Top 10 Cities with the Lowest Wage/Income Gap (%) in Kansas?
Top 10 Cities with the Lowest Wage/Income Gap (%) in Kansas are:
What city has the Lowest Wage/Income Gap (%) in Kansas?
Sterling has the Lowest Wage/Income Gap (%) in Kansas with 0.89%.
What is the Wage / Income Gap in Percentage Terms in the State of Kansas?
Wage / Income Gap in Percentage Terms in Kansas is 30.4%.
What is the Wage / Income Gap in Percentage Terms in the United States?
Wage / Income Gap in Percentage Terms in the United States is 28.0%.