Cities with the Lowest Poverty Level Among Children Under the Age of 16 in Kansas
RELATED REPORTS & OPTIONS
Lowest Poverty | Child 0-16
Kansas
Compare Cities
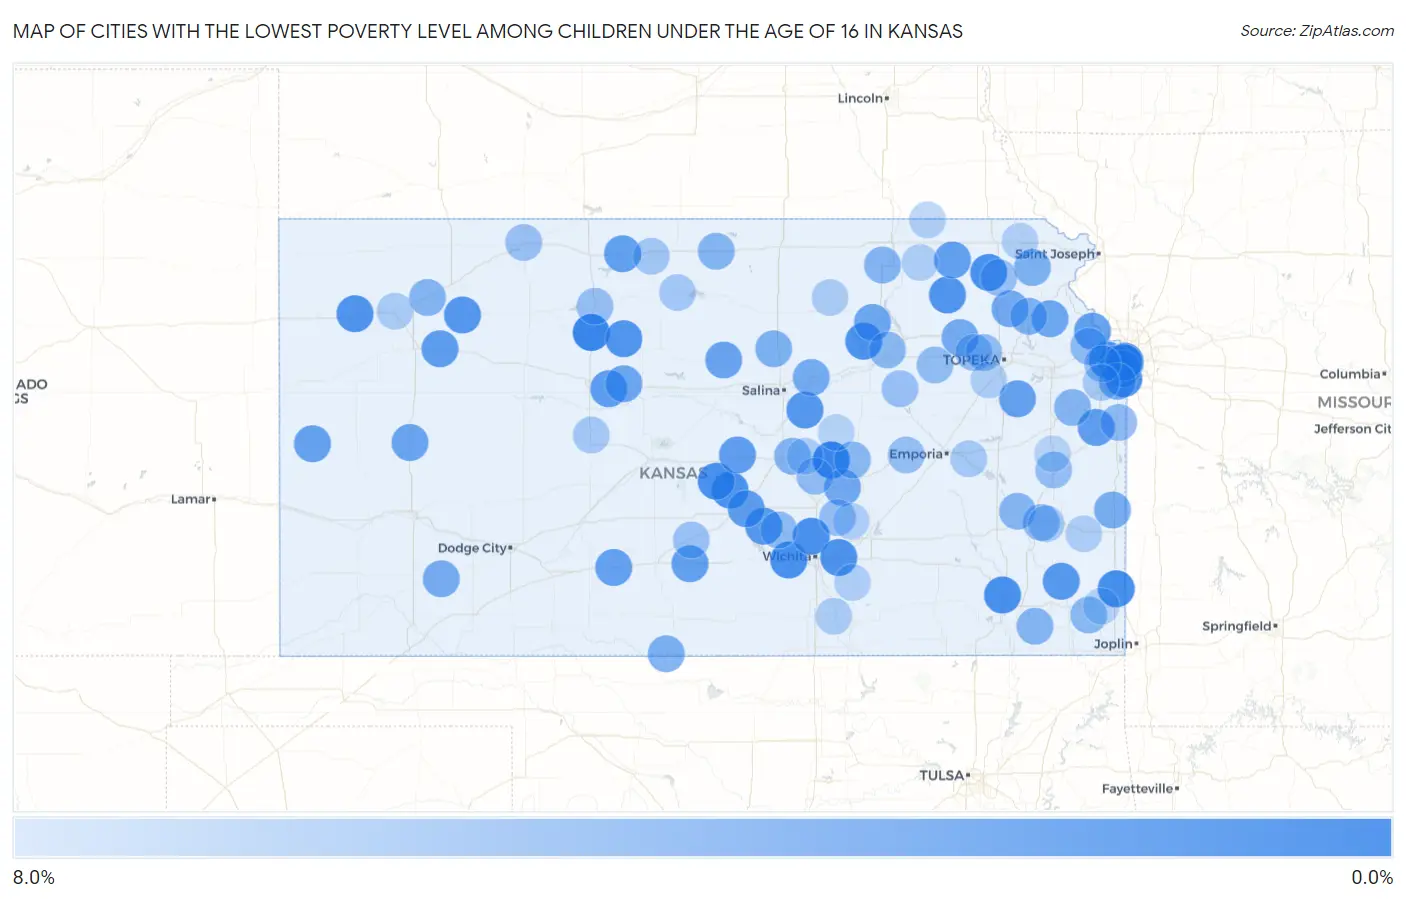
Map of Cities with the Lowest Poverty Level Among Children Under the Age of 16 in Kansas
8.0%
0.0%
Cities with the Lowest Poverty Level Among Children Under the Age of 16 in Kansas
| City | Child Poverty | vs State | vs National | |
| 1. | Hillsboro | 0.21% | 14.1%(-13.9)#1 | 16.9%(-16.7)#10 |
| 2. | Mission Hills | 0.24% | 14.1%(-13.9)#2 | 16.9%(-16.7)#15 |
| 3. | Plainville | 0.25% | 14.1%(-13.9)#3 | 16.9%(-16.7)#16 |
| 4. | Leawood | 0.85% | 14.1%(-13.3)#4 | 16.9%(-16.1)#203 |
| 5. | Frontenac | 0.88% | 14.1%(-13.3)#5 | 16.9%(-16.1)#228 |
| 6. | Goddard | 1.1% | 14.1%(-13.0)#6 | 16.9%(-15.8)#343 |
| 7. | Nickerson | 1.1% | 14.1%(-13.0)#7 | 16.9%(-15.8)#363 |
| 8. | Neodesha | 1.2% | 14.1%(-13.0)#8 | 16.9%(-15.8)#377 |
| 9. | Sterling | 1.2% | 14.1%(-13.0)#9 | 16.9%(-15.8)#383 |
| 10. | Wetmore | 1.2% | 14.1%(-12.9)#10 | 16.9%(-15.7)#403 |
| 11. | Valley Center | 1.2% | 14.1%(-12.9)#11 | 16.9%(-15.7)#414 |
| 12. | Lake Quivira | 1.3% | 14.1%(-12.9)#12 | 16.9%(-15.7)#418 |
| 13. | Westwood | 1.4% | 14.1%(-12.8)#13 | 16.9%(-15.6)#477 |
| 14. | Milford | 1.4% | 14.1%(-12.7)#14 | 16.9%(-15.5)#507 |
| 15. | Andover | 1.4% | 14.1%(-12.7)#15 | 16.9%(-15.5)#508 |
| 16. | Brewster | 1.5% | 14.1%(-12.6)#16 | 16.9%(-15.4)#558 |
| 17. | Merriam | 1.6% | 14.1%(-12.6)#17 | 16.9%(-15.4)#610 |
| 18. | Onaga | 1.6% | 14.1%(-12.5)#18 | 16.9%(-15.3)#636 |
| 19. | Natoma | 1.6% | 14.1%(-12.5)#19 | 16.9%(-15.3)#645 |
| 20. | Gypsum | 1.8% | 14.1%(-12.3)#20 | 16.9%(-15.1)#779 |
| 21. | Haven | 1.8% | 14.1%(-12.3)#21 | 16.9%(-15.1)#789 |
| 22. | Hoxie | 1.8% | 14.1%(-12.3)#22 | 16.9%(-15.1)#791 |
| 23. | St Paul | 2.0% | 14.1%(-12.1)#23 | 16.9%(-14.9)#912 |
| 24. | Victoria | 2.2% | 14.1%(-12.0)#24 | 16.9%(-14.8)#1,013 |
| 25. | Grinnell | 2.3% | 14.1%(-11.8)#25 | 16.9%(-14.6)#1,118 |
| 26. | South Hutchinson | 2.3% | 14.1%(-11.8)#26 | 16.9%(-14.6)#1,133 |
| 27. | Little River | 2.4% | 14.1%(-11.8)#27 | 16.9%(-14.6)#1,150 |
| 28. | Paola | 2.4% | 14.1%(-11.7)#28 | 16.9%(-14.5)#1,195 |
| 29. | Cunningham | 2.6% | 14.1%(-11.6)#29 | 16.9%(-14.4)#1,286 |
| 30. | Prairie Village | 2.6% | 14.1%(-11.6)#30 | 16.9%(-14.4)#1,291 |
| 31. | Lansing | 2.6% | 14.1%(-11.6)#31 | 16.9%(-14.4)#1,295 |
| 32. | Kensington | 2.6% | 14.1%(-11.6)#32 | 16.9%(-14.4)#1,315 |
| 33. | Centralia | 2.6% | 14.1%(-11.5)#33 | 16.9%(-14.3)#1,324 |
| 34. | Haviland | 2.7% | 14.1%(-11.4)#34 | 16.9%(-14.2)#1,403 |
| 35. | Tribune | 2.8% | 14.1%(-11.4)#35 | 16.9%(-14.2)#1,455 |
| 36. | Overbrook | 2.8% | 14.1%(-11.3)#36 | 16.9%(-14.1)#1,486 |
| 37. | Lincoln Center | 2.9% | 14.1%(-11.2)#37 | 16.9%(-14.0)#1,543 |
| 38. | Scott City | 3.0% | 14.1%(-11.1)#38 | 16.9%(-13.9)#1,640 |
| 39. | Riley | 3.1% | 14.1%(-11.1)#39 | 16.9%(-13.9)#1,657 |
| 40. | Gorham | 3.1% | 14.1%(-11.0)#40 | 16.9%(-13.8)#1,699 |
| 41. | Winchester | 3.2% | 14.1%(-11.0)#41 | 16.9%(-13.8)#1,729 |
| 42. | Fairway | 3.2% | 14.1%(-10.9)#42 | 16.9%(-13.7)#1,782 |
| 43. | Denison | 3.3% | 14.1%(-10.8)#43 | 16.9%(-13.6)#1,842 |
| 44. | Peabody | 3.4% | 14.1%(-10.7)#44 | 16.9%(-13.5)#1,895 |
| 45. | St Marys | 3.5% | 14.1%(-10.6)#45 | 16.9%(-13.4)#1,983 |
| 46. | Solomon | 3.6% | 14.1%(-10.5)#46 | 16.9%(-13.3)#2,009 |
| 47. | Overland Park | 3.6% | 14.1%(-10.5)#47 | 16.9%(-13.3)#2,043 |
| 48. | Copeland | 3.7% | 14.1%(-10.4)#48 | 16.9%(-13.2)#2,085 |
| 49. | Fulton | 3.8% | 14.1%(-10.3)#49 | 16.9%(-13.1)#2,181 |
| 50. | Hardtner | 4.0% | 14.1%(-10.1)#50 | 16.9%(-12.9)#2,286 |
| 51. | Valley Falls | 4.0% | 14.1%(-10.1)#51 | 16.9%(-12.9)#2,306 |
| 52. | Minneapolis | 4.1% | 14.1%(-10.1)#52 | 16.9%(-12.9)#2,320 |
| 53. | Everest | 4.1% | 14.1%(-10.1)#53 | 16.9%(-12.9)#2,341 |
| 54. | Waterville | 4.4% | 14.1%(-9.73)#54 | 16.9%(-12.5)#2,561 |
| 55. | Galva | 4.4% | 14.1%(-9.69)#55 | 16.9%(-12.5)#2,589 |
| 56. | Mound Valley | 4.5% | 14.1%(-9.66)#56 | 16.9%(-12.5)#2,626 |
| 57. | Wellsville | 4.5% | 14.1%(-9.65)#57 | 16.9%(-12.4)#2,634 |
| 58. | Mankato | 4.5% | 14.1%(-9.59)#58 | 16.9%(-12.4)#2,664 |
| 59. | Rexford | 4.5% | 14.1%(-9.59)#59 | 16.9%(-12.4)#2,675 |
| 60. | Gas | 4.7% | 14.1%(-9.49)#60 | 16.9%(-12.3)#2,736 |
| 61. | Neosho Falls | 4.7% | 14.1%(-9.49)#61 | 16.9%(-12.3)#2,741 |
| 62. | Ogden | 4.7% | 14.1%(-9.42)#62 | 16.9%(-12.2)#2,775 |
| 63. | Marion | 4.7% | 14.1%(-9.39)#63 | 16.9%(-12.2)#2,793 |
| 64. | West Mineral | 4.8% | 14.1%(-9.38)#64 | 16.9%(-12.2)#2,813 |
| 65. | Basehor | 4.9% | 14.1%(-9.21)#65 | 16.9%(-12.0)#2,918 |
| 66. | Mount Hope | 4.9% | 14.1%(-9.21)#66 | 16.9%(-12.0)#2,919 |
| 67. | Louisburg | 4.9% | 14.1%(-9.20)#67 | 16.9%(-12.0)#2,933 |
| 68. | Goessel | 5.1% | 14.1%(-9.05)#68 | 16.9%(-11.9)#3,031 |
| 69. | Alma | 5.2% | 14.1%(-8.93)#69 | 16.9%(-11.7)#3,126 |
| 70. | Willard | 5.3% | 14.1%(-8.88)#70 | 16.9%(-11.7)#3,165 |
| 71. | Silver Lake | 5.3% | 14.1%(-8.85)#71 | 16.9%(-11.6)#3,172 |
| 72. | Whitewater | 5.4% | 14.1%(-8.78)#72 | 16.9%(-11.6)#3,215 |
| 73. | Garnett | 5.4% | 14.1%(-8.77)#73 | 16.9%(-11.6)#3,226 |
| 74. | Stockton | 5.4% | 14.1%(-8.71)#74 | 16.9%(-11.5)#3,256 |
| 75. | Shawnee | 5.4% | 14.1%(-8.70)#75 | 16.9%(-11.5)#3,262 |
| 76. | Strong City | 5.5% | 14.1%(-8.64)#76 | 16.9%(-11.4)#3,300 |
| 77. | Norton | 5.5% | 14.1%(-8.60)#77 | 16.9%(-11.4)#3,330 |
| 78. | Dwight | 5.6% | 14.1%(-8.58)#78 | 16.9%(-11.4)#3,357 |
| 79. | Netawaka | 5.6% | 14.1%(-8.58)#79 | 16.9%(-11.4)#3,366 |
| 80. | Turon | 5.7% | 14.1%(-8.48)#80 | 16.9%(-11.3)#3,442 |
| 81. | Smith Center | 6.2% | 14.1%(-7.97)#81 | 16.9%(-10.8)#3,814 |
| 82. | Downs | 6.2% | 14.1%(-7.89)#82 | 16.9%(-10.7)#3,870 |
| 83. | La Crosse | 6.3% | 14.1%(-7.85)#83 | 16.9%(-10.6)#3,895 |
| 84. | Olathe | 6.4% | 14.1%(-7.73)#84 | 16.9%(-10.5)#3,973 |
| 85. | Neosho Rapids | 6.4% | 14.1%(-7.73)#85 | 16.9%(-10.5)#3,977 |
| 86. | Canton | 6.6% | 14.1%(-7.52)#86 | 16.9%(-10.3)#4,117 |
| 87. | Colby | 6.6% | 14.1%(-7.51)#87 | 16.9%(-10.3)#4,122 |
| 88. | Oxford | 6.7% | 14.1%(-7.47)#88 | 16.9%(-10.3)#4,145 |
| 89. | La Harpe | 6.7% | 14.1%(-7.47)#89 | 16.9%(-10.3)#4,147 |
| 90. | Morganville | 6.7% | 14.1%(-7.47)#90 | 16.9%(-10.3)#4,154 |
| 91. | Auburn | 6.7% | 14.1%(-7.42)#91 | 16.9%(-10.2)#4,172 |
| 92. | Uniontown | 6.7% | 14.1%(-7.40)#92 | 16.9%(-10.2)#4,193 |
| 93. | Frankfort | 6.8% | 14.1%(-7.37)#93 | 16.9%(-10.2)#4,200 |
| 94. | Hiawatha | 6.8% | 14.1%(-7.32)#94 | 16.9%(-10.1)#4,244 |
| 95. | Douglass | 6.8% | 14.1%(-7.31)#95 | 16.9%(-10.1)#4,248 |
| 96. | Potwin | 6.9% | 14.1%(-7.24)#96 | 16.9%(-10.0)#4,296 |
| 97. | Summerfield | 6.9% | 14.1%(-7.24)#97 | 16.9%(-10.0)#4,305 |
| 98. | Cherokee | 7.1% | 14.1%(-7.05)#98 | 16.9%(-9.85)#4,435 |
| 99. | Tampa | 7.1% | 14.1%(-7.00)#99 | 16.9%(-9.80)#4,495 |
| 100. | Richmond | 7.2% | 14.1%(-6.92)#100 | 16.9%(-9.72)#4,534 |
Common Questions
What are the Top 10 Cities with the Lowest Poverty Level Among Children Under the Age of 16 in Kansas?
Top 10 Cities with the Lowest Poverty Level Among Children Under the Age of 16 in Kansas are:
#1
0.21%
#2
0.24%
#3
0.25%
#4
0.85%
#5
0.88%
#6
1.1%
#7
1.1%
#8
1.2%
#9
1.2%
#10
1.2%
What city has the Lowest Poverty Level Among Children Under the Age of 16 in Kansas?
Hillsboro has the Lowest Poverty Level Among Children Under the Age of 16 in Kansas with 0.21%.
What is the Poverty Level Among Children Under the Age of 16 in the State of Kansas?
Poverty Level Among Children Under the Age of 16 in Kansas is 14.1%.
What is the Poverty Level Among Children Under the Age of 16 in the United States?
Poverty Level Among Children Under the Age of 16 in the United States is 16.9%.