Cities with the Largest Hispanic or Latino Community in Kansas
RELATED REPORTS & OPTIONS
Hispanic or Latino
Kansas
Compare Cities
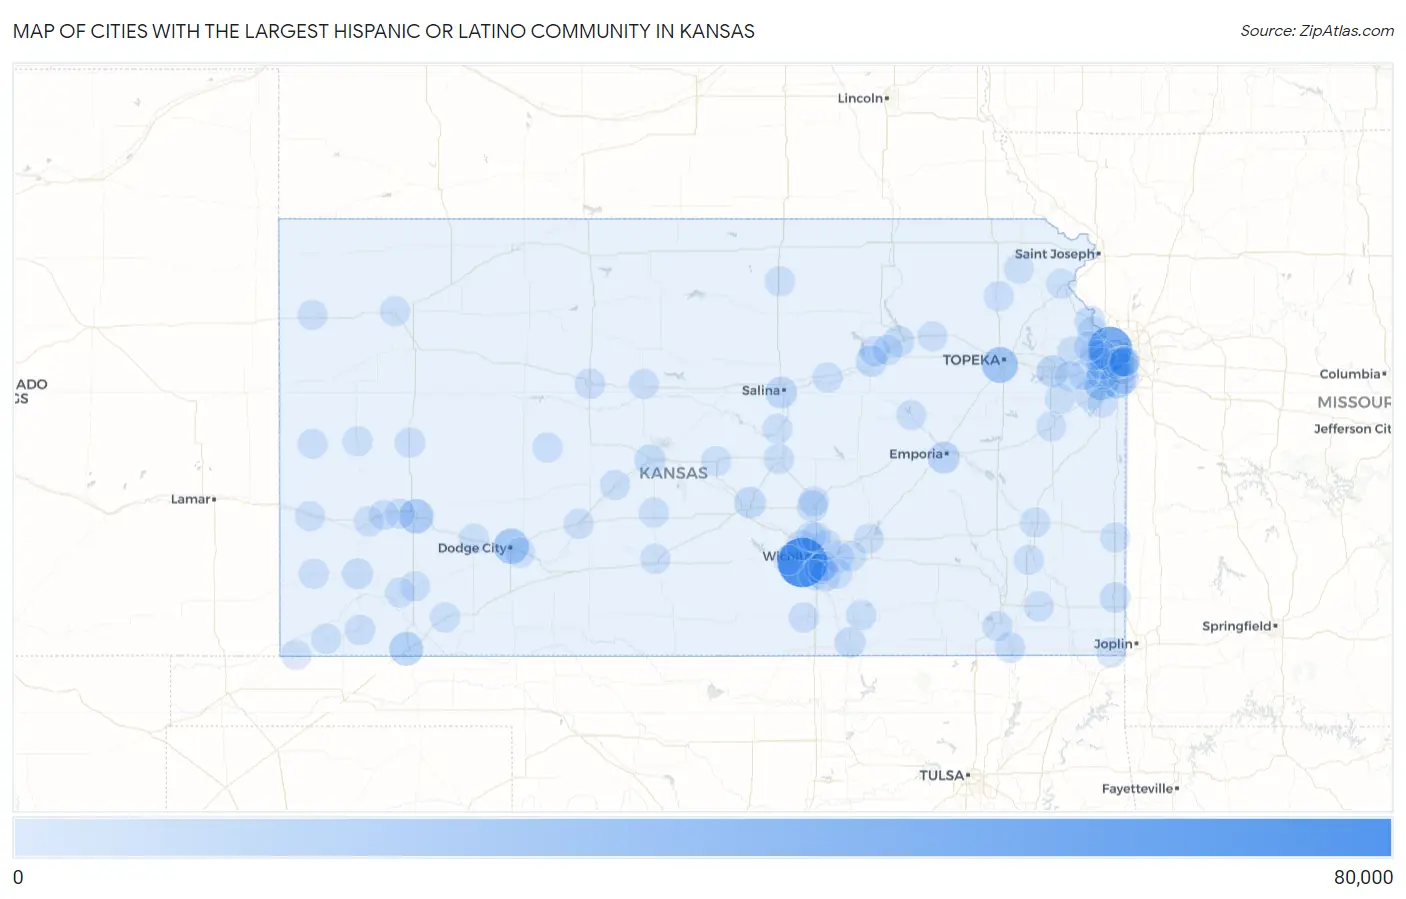
Map of Cities with the Largest Hispanic or Latino Community in Kansas
0
80,000
Cities with the Largest Hispanic or Latino Community in Kansas
| City | Hispanic or Latino | vs State | vs National | |
| 1. | Wichita | 69,539 | 369,970(18.80%)#1 | 61,755,866(0.11%)#102 |
| 2. | Kansas City | 49,190 | 369,970(13.30%)#2 | 61,755,866(0.08%)#163 |
| 3. | Topeka | 20,694 | 369,970(5.59%)#3 | 61,755,866(0.03%)#450 |
| 4. | Dodge City | 18,105 | 369,970(4.89%)#4 | 61,755,866(0.03%)#522 |
| 5. | Olathe | 16,618 | 369,970(4.49%)#5 | 61,755,866(0.03%)#569 |
| 6. | Garden City | 15,149 | 369,970(4.09%)#6 | 61,755,866(0.02%)#613 |
| 7. | Overland Park | 13,784 | 369,970(3.73%)#7 | 61,755,866(0.02%)#682 |
| 8. | Liberal | 12,649 | 369,970(3.42%)#8 | 61,755,866(0.02%)#724 |
| 9. | Lawrence | 6,921 | 369,970(1.87%)#9 | 61,755,866(0.01%)#1,226 |
| 10. | Emporia | 6,889 | 369,970(1.86%)#10 | 61,755,866(0.01%)#1,229 |
| 11. | Salina | 5,834 | 369,970(1.58%)#11 | 61,755,866(0.01%)#1,401 |
| 12. | Lenexa | 5,462 | 369,970(1.48%)#12 | 61,755,866(0.01%)#1,464 |
| 13. | Shawnee | 5,289 | 369,970(1.43%)#13 | 61,755,866(0.01%)#1,496 |
| 14. | Hutchinson | 5,159 | 369,970(1.39%)#14 | 61,755,866(0.01%)#1,530 |
| 15. | Manhattan | 4,184 | 369,970(1.13%)#15 | 61,755,866(0.01%)#1,804 |
| 16. | Junction City | 3,945 | 369,970(1.07%)#16 | 61,755,866(0.01%)#1,894 |
| 17. | Newton | 3,621 | 369,970(0.98%)#17 | 61,755,866(0.01%)#2,014 |
| 18. | Great Bend | 3,500 | 369,970(0.95%)#18 | 61,755,866(0.01%)#2,062 |
| 19. | Leavenworth | 2,991 | 369,970(0.81%)#19 | 61,755,866(0.00%)#2,293 |
| 20. | Ulysses | 2,977 | 369,970(0.80%)#20 | 61,755,866(0.00%)#2,302 |
| 21. | Derby | 2,777 | 369,970(0.75%)#21 | 61,755,866(0.00%)#2,423 |
| 22. | Arkansas City | 2,550 | 369,970(0.69%)#22 | 61,755,866(0.00%)#2,575 |
| 23. | Pittsburg | 2,202 | 369,970(0.60%)#23 | 61,755,866(0.00%)#2,821 |
| 24. | Hugoton | 1,816 | 369,970(0.49%)#24 | 61,755,866(0.00%)#3,231 |
| 25. | Fort Riley | 1,663 | 369,970(0.45%)#25 | 61,755,866(0.00%)#3,399 |
| 26. | Gardner | 1,602 | 369,970(0.43%)#26 | 61,755,866(0.00%)#3,484 |
| 27. | Coffeyville | 1,488 | 369,970(0.40%)#27 | 61,755,866(0.00%)#3,650 |
| 28. | Andover | 1,342 | 369,970(0.36%)#28 | 61,755,866(0.00%)#3,894 |
| 29. | Hays | 1,319 | 369,970(0.36%)#29 | 61,755,866(0.00%)#3,933 |
| 30. | Maize | 1,176 | 369,970(0.32%)#30 | 61,755,866(0.00%)#4,210 |
| 31. | Prairie Village | 1,167 | 369,970(0.32%)#31 | 61,755,866(0.00%)#4,233 |
| 32. | Leawood | 1,084 | 369,970(0.29%)#32 | 61,755,866(0.00%)#4,399 |
| 33. | Bel Aire | 1,052 | 369,970(0.28%)#33 | 61,755,866(0.00%)#4,488 |
| 34. | Oaklawn Sunview | 1,035 | 369,970(0.28%)#34 | 61,755,866(0.00%)#4,530 |
| 35. | Scott City | 1,017 | 369,970(0.27%)#35 | 61,755,866(0.00%)#4,571 |
| 36. | Holcomb | 986 | 369,970(0.27%)#36 | 61,755,866(0.00%)#4,655 |
| 37. | Merriam | 979 | 369,970(0.26%)#37 | 61,755,866(0.00%)#4,681 |
| 38. | Winfield | 977 | 369,970(0.26%)#38 | 61,755,866(0.00%)#4,687 |
| 39. | Roeland Park | 949 | 369,970(0.26%)#39 | 61,755,866(0.00%)#4,766 |
| 40. | Mcpherson | 877 | 369,970(0.24%)#40 | 61,755,866(0.00%)#4,985 |
| 41. | Wellington | 835 | 369,970(0.23%)#41 | 61,755,866(0.00%)#5,114 |
| 42. | Edwardsville | 800 | 369,970(0.22%)#42 | 61,755,866(0.00%)#5,239 |
| 43. | Haysville | 778 | 369,970(0.21%)#43 | 61,755,866(0.00%)#5,311 |
| 44. | Bonner Springs | 748 | 369,970(0.20%)#44 | 61,755,866(0.00%)#5,423 |
| 45. | Lakin | 744 | 369,970(0.20%)#45 | 61,755,866(0.00%)#5,440 |
| 46. | Lyons | 700 | 369,970(0.19%)#46 | 61,755,866(0.00%)#5,627 |
| 47. | Lansing | 696 | 369,970(0.19%)#47 | 61,755,866(0.00%)#5,641 |
| 48. | Park City | 693 | 369,970(0.19%)#48 | 61,755,866(0.00%)#5,653 |
| 49. | Plains | 684 | 369,970(0.18%)#49 | 61,755,866(0.00%)#5,699 |
| 50. | Independence | 663 | 369,970(0.18%)#50 | 61,755,866(0.00%)#5,784 |
| 51. | Chanute | 651 | 369,970(0.18%)#51 | 61,755,866(0.00%)#5,843 |
| 52. | Goodland | 650 | 369,970(0.18%)#52 | 61,755,866(0.00%)#5,852 |
| 53. | Parsons | 621 | 369,970(0.17%)#53 | 61,755,866(0.00%)#5,973 |
| 54. | Valley Center | 620 | 369,970(0.17%)#54 | 61,755,866(0.00%)#5,981 |
| 55. | Mission | 619 | 369,970(0.17%)#55 | 61,755,866(0.00%)#5,985 |
| 56. | Tonganoxie | 595 | 369,970(0.16%)#56 | 61,755,866(0.00%)#6,098 |
| 57. | Ottawa | 586 | 369,970(0.16%)#57 | 61,755,866(0.00%)#6,148 |
| 58. | Johnson City | 583 | 369,970(0.16%)#58 | 61,755,866(0.00%)#6,170 |
| 59. | Pratt | 579 | 369,970(0.16%)#59 | 61,755,866(0.00%)#6,188 |
| 60. | El Dorado | 576 | 369,970(0.16%)#60 | 61,755,866(0.00%)#6,203 |
| 61. | Syracuse | 523 | 369,970(0.14%)#61 | 61,755,866(0.00%)#6,497 |
| 62. | Leoti | 515 | 369,970(0.14%)#62 | 61,755,866(0.00%)#6,550 |
| 63. | Wilroads Gardens | 509 | 369,970(0.14%)#63 | 61,755,866(0.00%)#6,584 |
| 64. | Atchison | 480 | 369,970(0.13%)#64 | 61,755,866(0.00%)#6,735 |
| 65. | Sublette | 474 | 369,970(0.13%)#65 | 61,755,866(0.00%)#6,781 |
| 66. | Colby | 468 | 369,970(0.13%)#66 | 61,755,866(0.00%)#6,823 |
| 67. | Cimarron | 451 | 369,970(0.12%)#67 | 61,755,866(0.00%)#6,948 |
| 68. | Deerfield | 448 | 369,970(0.12%)#68 | 61,755,866(0.00%)#6,971 |
| 69. | Holton | 446 | 369,970(0.12%)#69 | 61,755,866(0.00%)#6,984 |
| 70. | Augusta | 443 | 369,970(0.12%)#70 | 61,755,866(0.00%)#6,998 |
| 71. | De Soto | 440 | 369,970(0.12%)#71 | 61,755,866(0.00%)#7,017 |
| 72. | Eudora | 433 | 369,970(0.12%)#72 | 61,755,866(0.00%)#7,066 |
| 73. | Rose Hill | 421 | 369,970(0.11%)#73 | 61,755,866(0.00%)#7,167 |
| 74. | Abilene | 394 | 369,970(0.11%)#74 | 61,755,866(0.00%)#7,364 |
| 75. | Rolla | 379 | 369,970(0.10%)#75 | 61,755,866(0.00%)#7,484 |
| 76. | Kinsley | 378 | 369,970(0.10%)#76 | 61,755,866(0.00%)#7,492 |
| 77. | Goddard | 360 | 369,970(0.10%)#77 | 61,755,866(0.00%)#7,653 |
| 78. | Baxter Springs | 357 | 369,970(0.10%)#78 | 61,755,866(0.00%)#7,674 |
| 79. | Concordia | 341 | 369,970(0.09%)#79 | 61,755,866(0.00%)#7,829 |
| 80. | Baldwin City | 324 | 369,970(0.09%)#80 | 61,755,866(0.00%)#7,997 |
| 81. | Iola | 317 | 369,970(0.09%)#81 | 61,755,866(0.00%)#8,075 |
| 82. | St John | 308 | 369,970(0.08%)#82 | 61,755,866(0.00%)#8,167 |
| 83. | Satanta | 299 | 369,970(0.08%)#83 | 61,755,866(0.00%)#8,276 |
| 84. | Larned | 293 | 369,970(0.08%)#84 | 61,755,866(0.00%)#8,337 |
| 85. | Spring Hill | 290 | 369,970(0.08%)#85 | 61,755,866(0.00%)#8,375 |
| 86. | Basehor | 283 | 369,970(0.08%)#86 | 61,755,866(0.00%)#8,458 |
| 87. | Lindsborg | 279 | 369,970(0.08%)#87 | 61,755,866(0.00%)#8,518 |
| 88. | Horton | 279 | 369,970(0.08%)#88 | 61,755,866(0.00%)#8,521 |
| 89. | Wamego | 274 | 369,970(0.07%)#89 | 61,755,866(0.00%)#8,589 |
| 90. | Russell | 269 | 369,970(0.07%)#90 | 61,755,866(0.00%)#8,649 |
| 91. | Fairway | 267 | 369,970(0.07%)#91 | 61,755,866(0.00%)#8,680 |
| 92. | Council Grove | 259 | 369,970(0.07%)#92 | 61,755,866(0.00%)#8,773 |
| 93. | Westwood | 256 | 369,970(0.07%)#93 | 61,755,866(0.00%)#8,822 |
| 94. | Fort Scott | 254 | 369,970(0.07%)#94 | 61,755,866(0.00%)#8,854 |
| 95. | Tribune | 246 | 369,970(0.07%)#95 | 61,755,866(0.00%)#8,988 |
| 96. | Elkhart | 243 | 369,970(0.07%)#96 | 61,755,866(0.00%)#9,013 |
| 97. | North Newton | 218 | 369,970(0.06%)#97 | 61,755,866(0.00%)#9,388 |
| 98. | Bazine | 214 | 369,970(0.06%)#98 | 61,755,866(0.00%)#9,461 |
| 99. | Ogden | 210 | 369,970(0.06%)#99 | 61,755,866(0.00%)#9,531 |
| 100. | Mcconnell Afb | 202 | 369,970(0.05%)#100 | 61,755,866(0.00%)#9,675 |
Common Questions
What are the Top 10 Cities with the Largest Hispanic or Latino Community in Kansas?
Top 10 Cities with the Largest Hispanic or Latino Community in Kansas are:
#1
69,539
#2
49,190
#3
20,694
#4
18,105
#5
16,618
#6
15,149
#7
13,784
#8
12,649
#9
6,921
#10
6,889
What city has the Largest Hispanic or Latino Community in Kansas?
Wichita has the Largest Hispanic or Latino Community in Kansas with 69,539.
What is the Total Hispanic or Latino Population in the State of Kansas?
Total Hispanic or Latino Population in Kansas is 369,970.
What is the Total Hispanic or Latino Population in the United States?
Total Hispanic or Latino Population in the United States is 61,755,866.