Fairway, KS
Fairway Map
Fairway Overview
4,162
TOTAL POPULATION
1,832
MALE POPULATION
2,330
FEMALE POPULATION
78.63
MALES / 100 FEMALES
127.18
FEMALES / 100 MALES
37.9
MEDIAN AGE
3.2
AVG FAMILY SIZE
2.7
AVG HOUSEHOLD SIZE
$97,722
PER CAPITA INCOME
$223,690
AVG FAMILY INCOME
$154,981
AVG HOUSEHOLD INCOME
33.3%
WAGE / INCOME GAP [ % ]
66.7¢/ $1
WAGE / INCOME GAP [ $ ]
$10,646
FAMILY INCOME DEFICIT
0.48
INEQUALITY / GINI INDEX
2,297
LABOR FORCE [ PEOPLE ]
71.6%
PERCENT IN LABOR FORCE
0.7%
UNEMPLOYMENT RATE
Fairway Area Codes
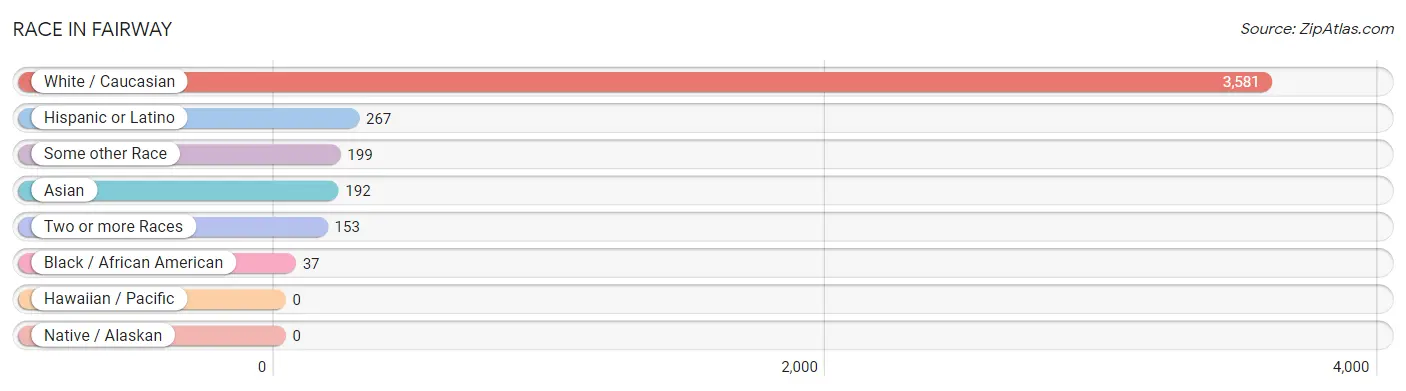
Race in Fairway
The most populous races in Fairway are White / Caucasian (3,581 | 86.0%), Hispanic or Latino (267 | 6.4%), and Some other Race (199 | 4.8%).
| Race | # Population | % Population |
| Asian | 192 | 4.6% |
| Black / African American | 37 | 0.9% |
| Hawaiian / Pacific | 0 | 0.0% |
| Hispanic or Latino | 267 | 6.4% |
| Native / Alaskan | 0 | 0.0% |
| White / Caucasian | 3,581 | 86.0% |
| Two or more Races | 153 | 3.7% |
| Some other Race | 199 | 4.8% |
| Total | 4,162 | 100.0% |
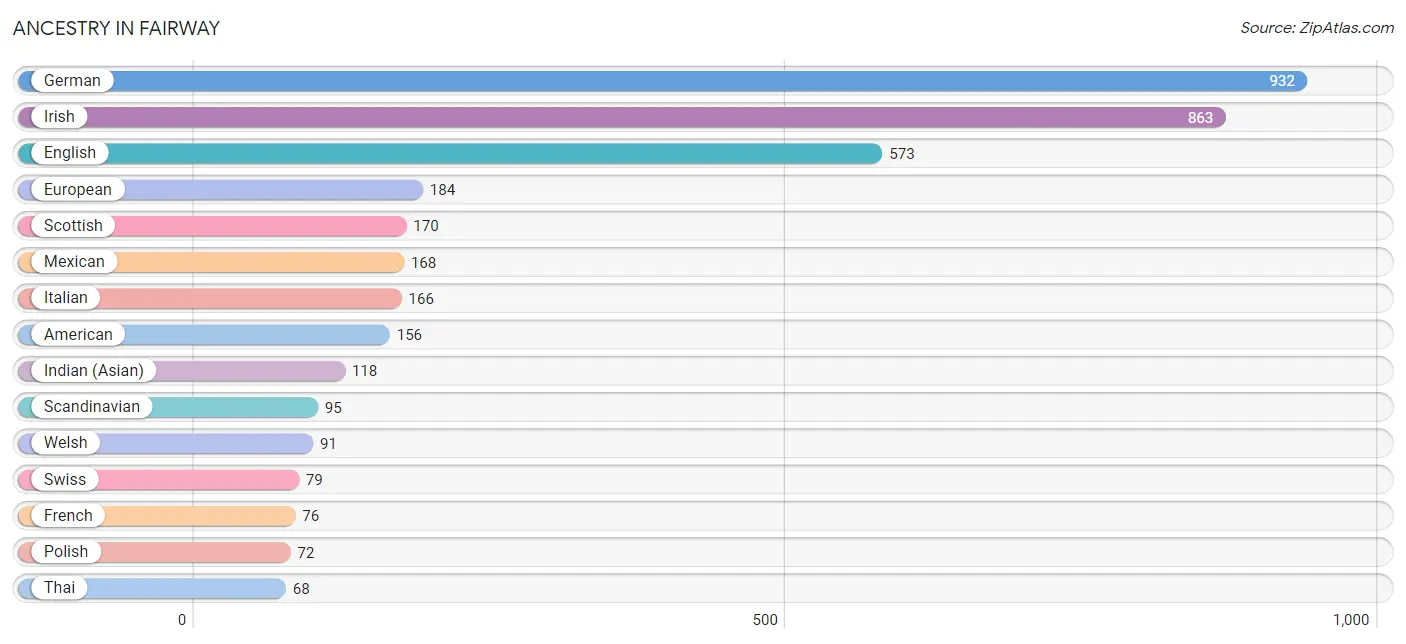
Ancestry in Fairway
The most populous ancestries reported in Fairway are German (932 | 22.4%), Irish (863 | 20.7%), English (573 | 13.8%), European (184 | 4.4%), and Scottish (170 | 4.1%), together accounting for 65.4% of all Fairway residents.
| Ancestry | # Population | % Population |
| American | 156 | 3.7% |
| Armenian | 6 | 0.1% |
| Austrian | 8 | 0.2% |
| British | 18 | 0.4% |
| Burmese | 19 | 0.5% |
| Canadian | 5 | 0.1% |
| Central American | 56 | 1.3% |
| Cherokee | 14 | 0.3% |
| Croatian | 18 | 0.4% |
| Cuban | 43 | 1.0% |
| Danish | 54 | 1.3% |
| Dutch | 38 | 0.9% |
| Eastern European | 17 | 0.4% |
| English | 573 | 13.8% |
| European | 184 | 4.4% |
| French | 76 | 1.8% |
| German | 932 | 22.4% |
| Hungarian | 11 | 0.3% |
| Indian (Asian) | 118 | 2.8% |
| Irish | 863 | 20.7% |
| Italian | 166 | 4.0% |
| Latvian | 51 | 1.2% |
| Mexican | 168 | 4.0% |
| Nigerian | 9 | 0.2% |
| Norwegian | 43 | 1.0% |
| Polish | 72 | 1.7% |
| Portuguese | 51 | 1.2% |
| Russian | 59 | 1.4% |
| Salvadoran | 56 | 1.3% |
| Scandinavian | 95 | 2.3% |
| Scotch-Irish | 48 | 1.1% |
| Scottish | 170 | 4.1% |
| Slovak | 18 | 0.4% |
| Slovene | 7 | 0.2% |
| Subsaharan African | 9 | 0.2% |
| Swedish | 56 | 1.3% |
| Swiss | 79 | 1.9% |
| Thai | 68 | 1.6% |
| Turkish | 11 | 0.3% |
| Ukrainian | 34 | 0.8% |
| Welsh | 91 | 2.2% | View All 41 Rows |
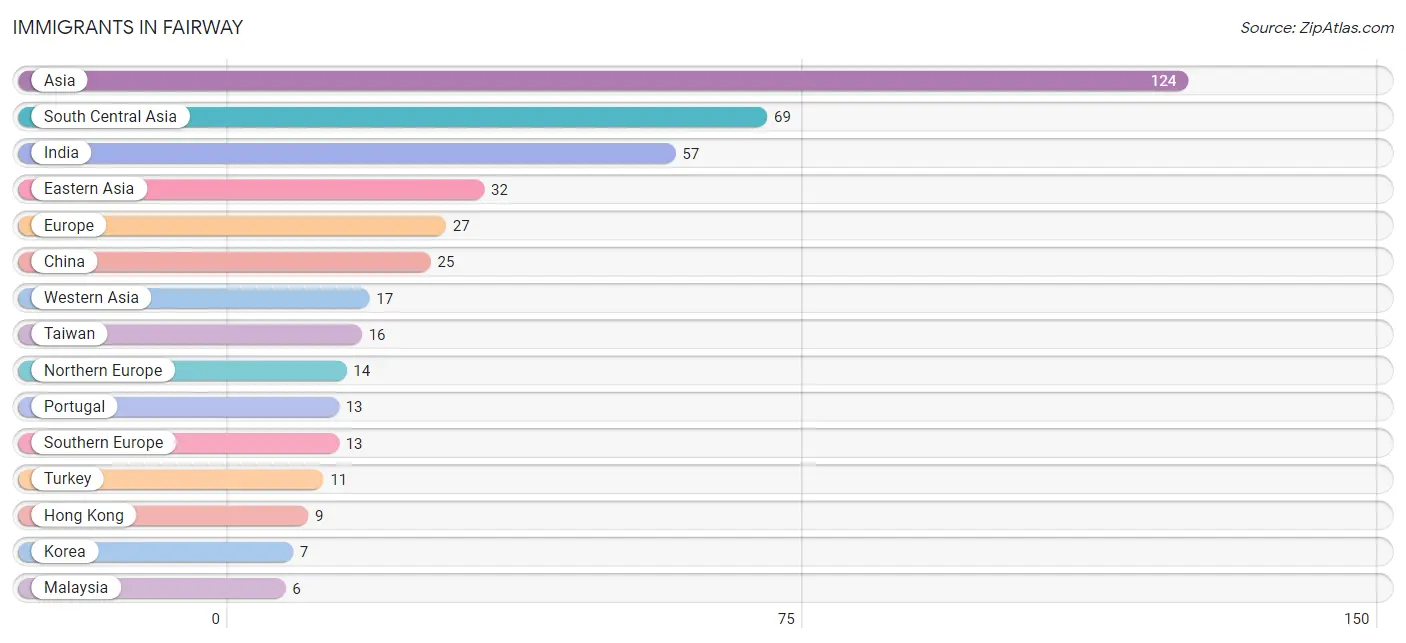
Immigrants in Fairway
The most numerous immigrant groups reported in Fairway came from Asia (124 | 3.0%), South Central Asia (69 | 1.7%), India (57 | 1.4%), Eastern Asia (32 | 0.8%), and Europe (27 | 0.6%), together accounting for 7.4% of all Fairway residents.
| Immigration Origin | # Population | % Population |
| Asia | 124 | 3.0% |
| Canada | 5 | 0.1% |
| China | 25 | 0.6% |
| Eastern Asia | 32 | 0.8% |
| Europe | 27 | 0.6% |
| Hong Kong | 9 | 0.2% |
| India | 57 | 1.4% |
| Korea | 7 | 0.2% |
| Malaysia | 6 | 0.1% |
| Northern Europe | 14 | 0.3% |
| Portugal | 13 | 0.3% |
| South Central Asia | 69 | 1.7% |
| South Eastern Asia | 6 | 0.1% |
| Southern Europe | 13 | 0.3% |
| Taiwan | 16 | 0.4% |
| Turkey | 11 | 0.3% |
| Western Asia | 17 | 0.4% | View All 17 Rows |
Sex and Age in Fairway
Sex and Age in Fairway
The most populous age groups in Fairway are 35 to 39 Years (191 | 10.4%) for men and 35 to 39 Years (215 | 9.2%) for women.
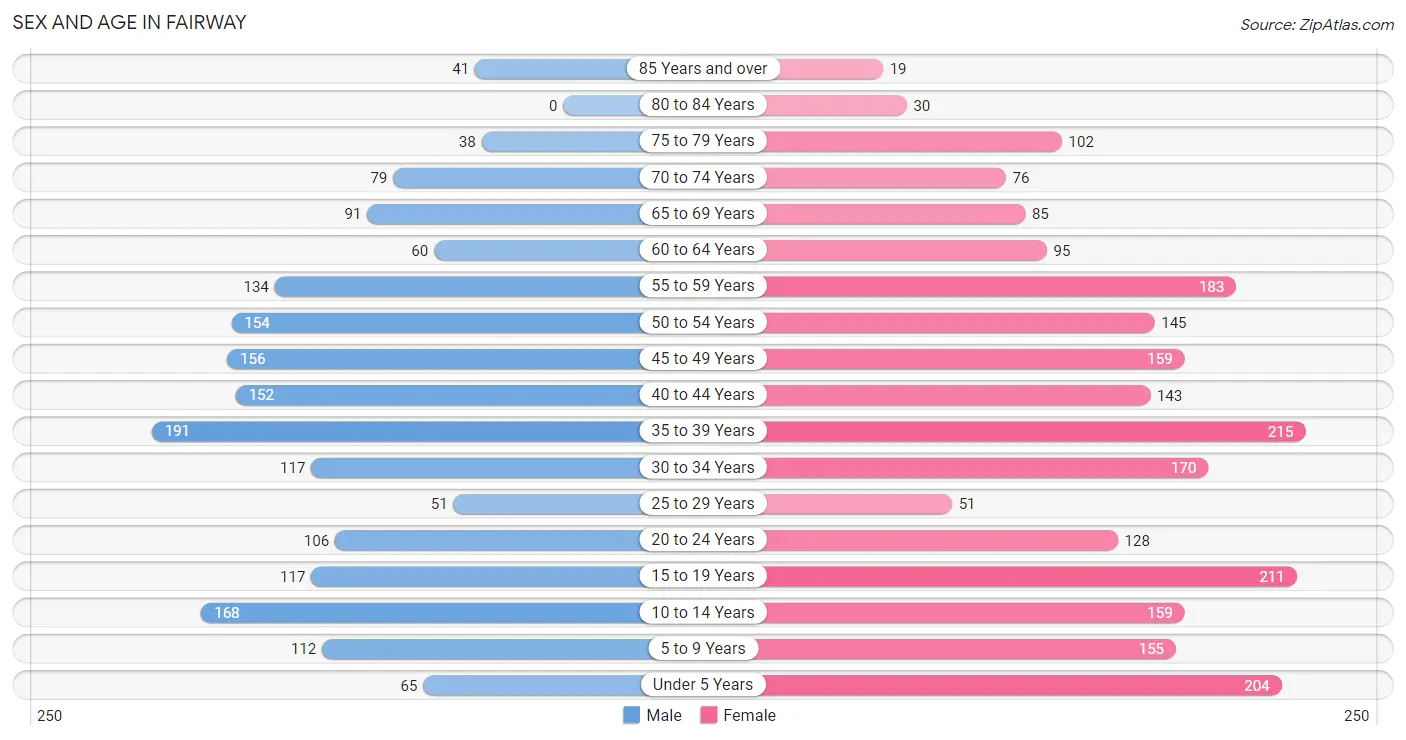
| Age Bracket | Male | Female |
| Under 5 Years | 65 (3.5%) | 204 (8.8%) |
| 5 to 9 Years | 112 (6.1%) | 155 (6.7%) |
| 10 to 14 Years | 168 (9.2%) | 159 (6.8%) |
| 15 to 19 Years | 117 (6.4%) | 211 (9.1%) |
| 20 to 24 Years | 106 (5.8%) | 128 (5.5%) |
| 25 to 29 Years | 51 (2.8%) | 51 (2.2%) |
| 30 to 34 Years | 117 (6.4%) | 170 (7.3%) |
| 35 to 39 Years | 191 (10.4%) | 215 (9.2%) |
| 40 to 44 Years | 152 (8.3%) | 143 (6.1%) |
| 45 to 49 Years | 156 (8.5%) | 159 (6.8%) |
| 50 to 54 Years | 154 (8.4%) | 145 (6.2%) |
| 55 to 59 Years | 134 (7.3%) | 183 (7.9%) |
| 60 to 64 Years | 60 (3.3%) | 95 (4.1%) |
| 65 to 69 Years | 91 (5.0%) | 85 (3.6%) |
| 70 to 74 Years | 79 (4.3%) | 76 (3.3%) |
| 75 to 79 Years | 38 (2.1%) | 102 (4.4%) |
| 80 to 84 Years | 0 (0.0%) | 30 (1.3%) |
| 85 Years and over | 41 (2.2%) | 19 (0.8%) |
| Total | 1,832 (100.0%) | 2,330 (100.0%) |
Families and Households in Fairway
Median Family Size in Fairway
The median family size in Fairway is 3.18 persons per family, with married-couple families (1,049 | 94.9%) accounting for the largest median family size of 3.2 persons per family. On the other hand, single male/father families (11 | 1.0%) represent the smallest median family size with 1.64 persons per family.
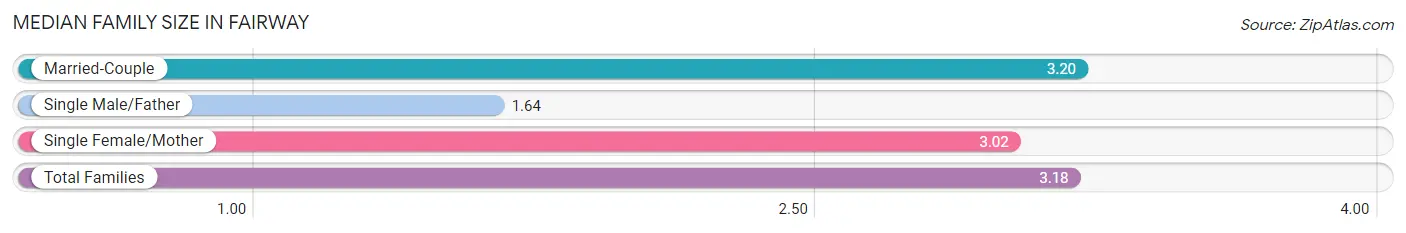
| Family Type | # Families | Family Size |
| Married-Couple | 1,049 (94.9%) | 3.20 |
| Single Male/Father | 11 (1.0%) | 1.64 |
| Single Female/Mother | 46 (4.2%) | 3.02 |
| Total Families | 1,106 (100.0%) | 3.18 |
Median Household Size in Fairway
The median household size in Fairway is 2.66 persons per household, with married-couple households (1,049 | 67.3%) accounting for the largest median household size of 3.26 persons per household. non-family households (453 | 29.1%) represent the smallest median household size with 1.28 persons per household.
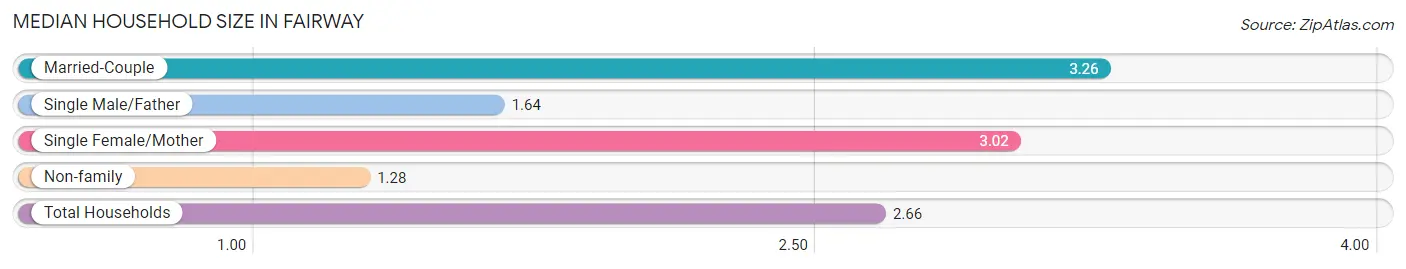
| Household Type | # Households | Household Size |
| Married-Couple | 1,049 (67.3%) | 3.26 |
| Single Male/Father | 11 (0.7%) | 1.64 |
| Single Female/Mother | 46 (2.9%) | 3.02 |
| Non-family | 453 (29.1%) | 1.28 |
| Total Households | 1,559 (100.0%) | 2.66 |
Household Size by Marriage Status in Fairway
Out of a total of 1,559 households in Fairway, 1,106 (70.9%) are family households, while 453 (29.1%) are nonfamily households. The most numerous type of family households are 2-person households, comprising 437, and the most common type of nonfamily households are 1-person households, comprising 333.
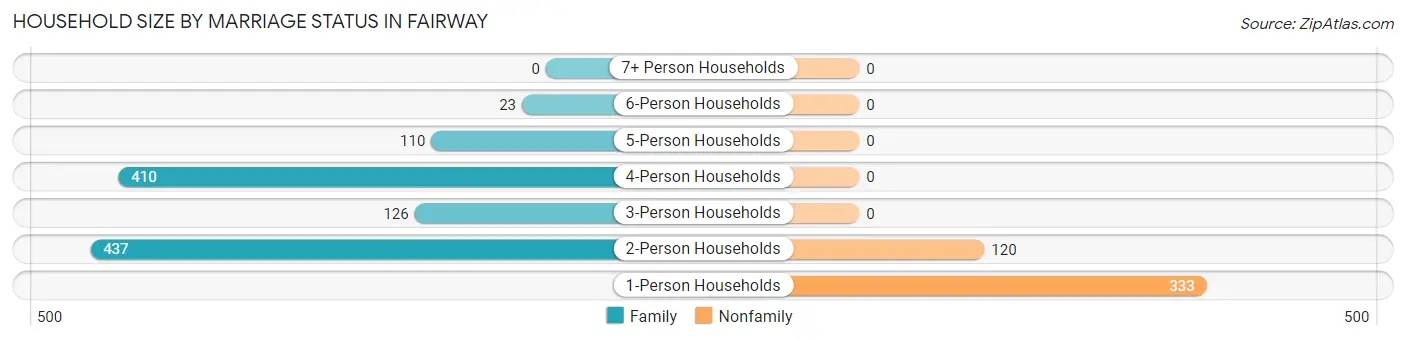
| Household Size | Family Households | Nonfamily Households |
| 1-Person Households | - | 333 (21.4%) |
| 2-Person Households | 437 (28.0%) | 120 (7.7%) |
| 3-Person Households | 126 (8.1%) | 0 (0.0%) |
| 4-Person Households | 410 (26.3%) | 0 (0.0%) |
| 5-Person Households | 110 (7.1%) | 0 (0.0%) |
| 6-Person Households | 23 (1.5%) | 0 (0.0%) |
| 7+ Person Households | 0 (0.0%) | 0 (0.0%) |
| Total | 1,106 (70.9%) | 453 (29.1%) |
Female Fertility in Fairway
Fertility by Age in Fairway
Average fertility rate in Fairway is 48.0 births per 1,000 women. Women in the age bracket of 20 to 34 years have the highest fertility rate with 60.0 births per 1,000 women. Women in the age bracket of 35 to 50 years acount for 59.6% of all women with births.
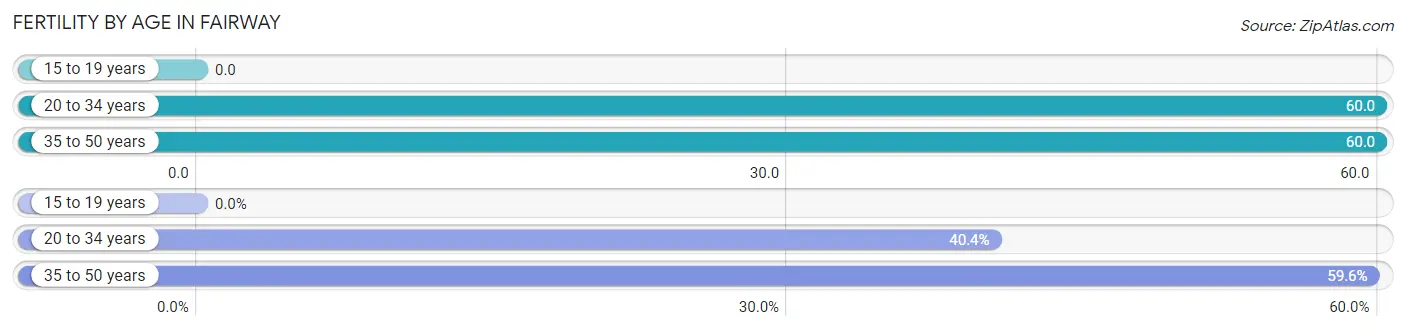
| Age Bracket | Women with Births | Births / 1,000 Women |
| 15 to 19 years | 0 (0.0%) | 0.0 |
| 20 to 34 years | 21 (40.4%) | 60.0 |
| 35 to 50 years | 31 (59.6%) | 60.0 |
| Total | 52 (100.0%) | 48.0 |
Fertility by Age by Marriage Status in Fairway
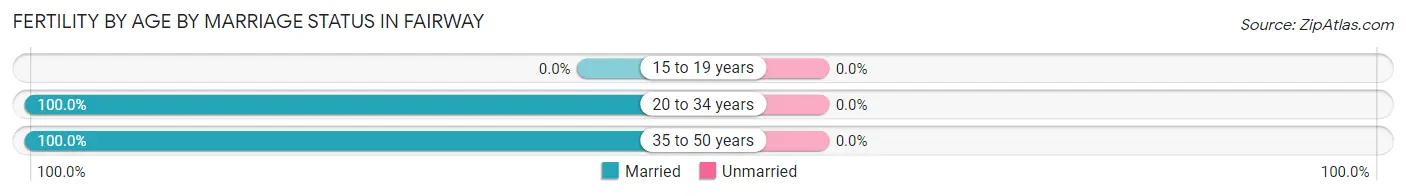
| Age Bracket | Married | Unmarried |
| 15 to 19 years | 0 (0.0%) | 0 (0.0%) |
| 20 to 34 years | 21 (100.0%) | 0 (0.0%) |
| 35 to 50 years | 31 (100.0%) | 0 (0.0%) |
| Total | 52 (100.0%) | 0 (0.0%) |
Fertility by Education in Fairway
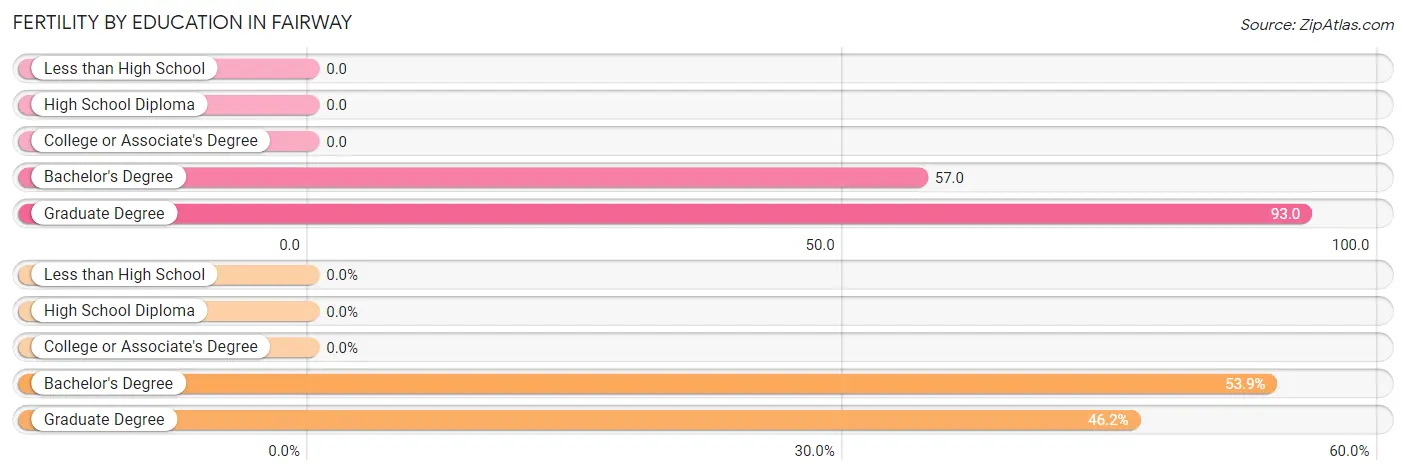
| Educational Attainment | Women with Births | Births / 1,000 Women |
| Less than High School | 0 (0.0%) | 0.0 |
| High School Diploma | 0 (0.0%) | 0.0 |
| College or Associate's Degree | 0 (0.0%) | 0.0 |
| Bachelor's Degree | 28 (53.8%) | 57.0 |
| Graduate Degree | 24 (46.2%) | 93.0 |
| Total | 52 (100.0%) | 48.0 |
Fertility by Education by Marriage Status in Fairway
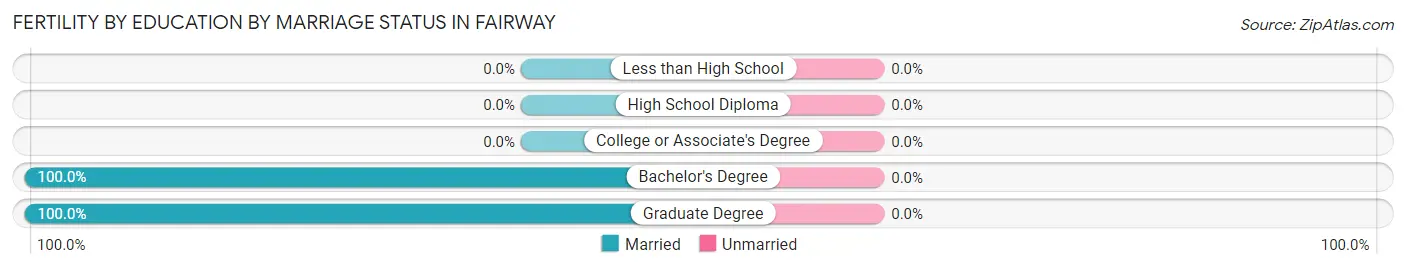
| Educational Attainment | Married | Unmarried |
| Less than High School | 0 (0.0%) | 0 (0.0%) |
| High School Diploma | 0 (0.0%) | 0 (0.0%) |
| College or Associate's Degree | 0 (0.0%) | 0 (0.0%) |
| Bachelor's Degree | 28 (100.0%) | 0 (0.0%) |
| Graduate Degree | 24 (100.0%) | 0 (0.0%) |
| Total | 52 (100.0%) | 0 (0.0%) |
Income in Fairway
Income Overview in Fairway
Per Capita Income in Fairway is $97,722, while median incomes of families and households are $223,690 and $154,981 respectively.
| Characteristic | Number | Measure |
| Per Capita Income | 4,162 | $97,722 |
| Median Family Income | 1,106 | $223,690 |
| Mean Family Income | 1,106 | $322,919 |
| Median Household Income | 1,559 | $154,981 |
| Mean Household Income | 1,559 | $266,363 |
| Income Deficit | 1,106 | $10,646 |
| Wage / Income Gap (%) | 4,162 | 33.28% |
| Wage / Income Gap ($) | 4,162 | 66.72¢ per $1 |
| Gini / Inequality Index | 4,162 | 0.48 |
Earnings by Sex in Fairway
Average Earnings in Fairway are $75,658, $102,200 for men and $68,192 for women, a difference of 33.3%.
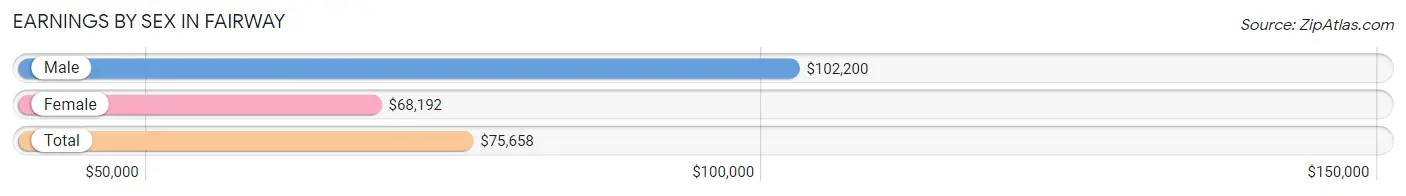
| Sex | Number | Average Earnings |
| Male | 1,212 (51.8%) | $102,200 |
| Female | 1,128 (48.2%) | $68,192 |
| Total | 2,340 (100.0%) | $75,658 |
Earnings by Sex by Income Bracket in Fairway
The most common earnings brackets in Fairway are $100,000+ for men (628 | 51.8%) and $100,000+ for women (275 | 24.4%).

| Income | Male | Female |
| $2,499 or less | 39 (3.2%) | 15 (1.3%) |
| $2,500 to $4,999 | 4 (0.3%) | 70 (6.2%) |
| $5,000 to $7,499 | 14 (1.2%) | 49 (4.3%) |
| $7,500 to $9,999 | 14 (1.2%) | 2 (0.2%) |
| $10,000 to $12,499 | 0 (0.0%) | 68 (6.0%) |
| $12,500 to $14,999 | 0 (0.0%) | 102 (9.0%) |
| $15,000 to $17,499 | 0 (0.0%) | 17 (1.5%) |
| $17,500 to $19,999 | 13 (1.1%) | 0 (0.0%) |
| $20,000 to $22,499 | 0 (0.0%) | 0 (0.0%) |
| $22,500 to $24,999 | 29 (2.4%) | 25 (2.2%) |
| $25,000 to $29,999 | 30 (2.5%) | 0 (0.0%) |
| $30,000 to $34,999 | 53 (4.4%) | 40 (3.5%) |
| $35,000 to $39,999 | 20 (1.7%) | 4 (0.4%) |
| $40,000 to $44,999 | 11 (0.9%) | 22 (1.9%) |
| $45,000 to $49,999 | 23 (1.9%) | 69 (6.1%) |
| $50,000 to $54,999 | 75 (6.2%) | 11 (1.0%) |
| $55,000 to $64,999 | 99 (8.2%) | 52 (4.6%) |
| $65,000 to $74,999 | 66 (5.4%) | 114 (10.1%) |
| $75,000 to $99,999 | 94 (7.8%) | 193 (17.1%) |
| $100,000+ | 628 (51.8%) | 275 (24.4%) |
| Total | 1,212 (100.0%) | 1,128 (100.0%) |
Earnings by Sex by Educational Attainment in Fairway
Average earnings in Fairway are $125,408 for men and $70,333 for women, a difference of 43.9%. Men with an educational attainment of graduate degree enjoy the highest average annual earnings of $190,694, while those with college or associate's degree education earn the least with $54,848. Women with an educational attainment of graduate degree earn the most with the average annual earnings of $74,706, while those with bachelor's degree education have the smallest earnings of $70,917.
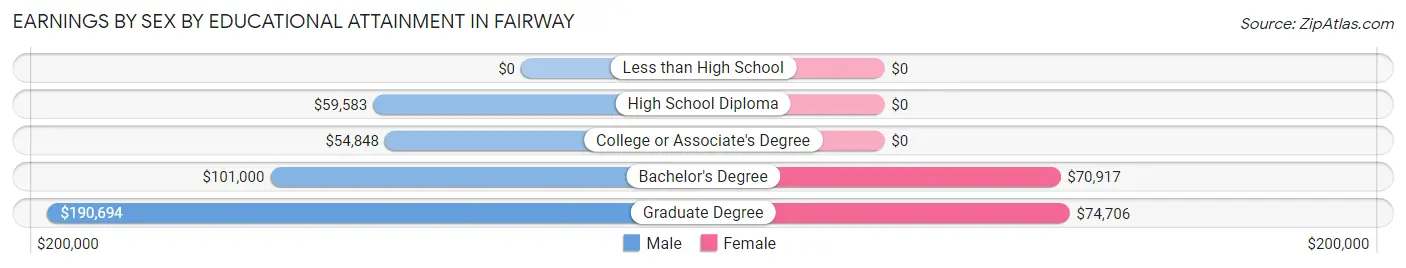
| Educational Attainment | Male Income | Female Income |
| Less than High School | - | - |
| High School Diploma | $59,583 | $0 |
| College or Associate's Degree | $54,848 | $0 |
| Bachelor's Degree | $101,000 | $70,917 |
| Graduate Degree | $190,694 | $74,706 |
| Total | $125,408 | $70,333 |
Family Income in Fairway
Family Income Brackets in Fairway
According to the Fairway family income data, there are 593 families falling into the $200,000+ income range, which is the most common income bracket and makes up 53.6% of all families.
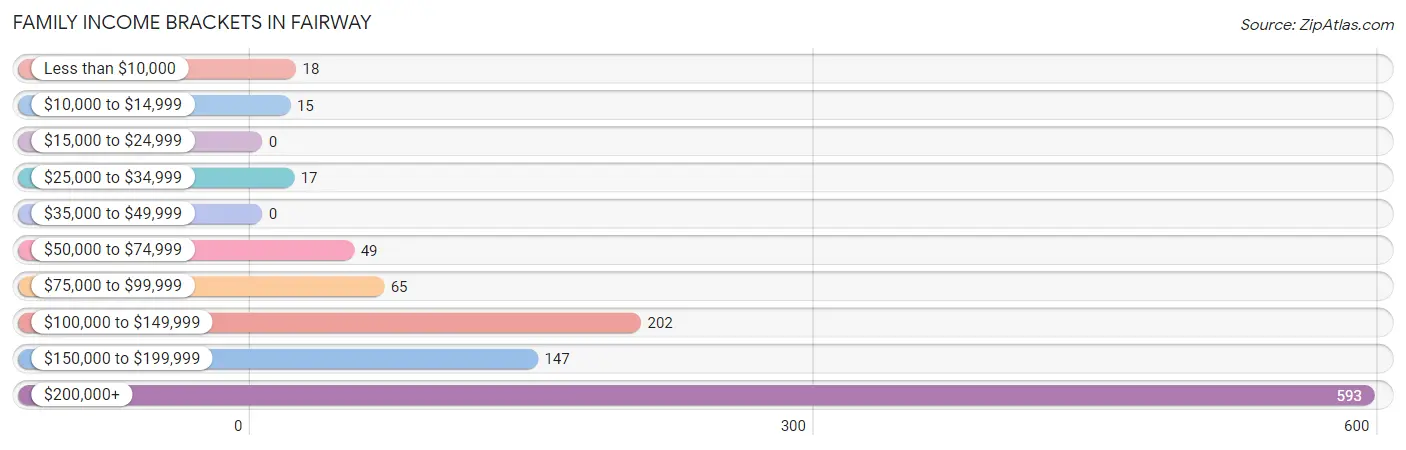
| Income Bracket | # Families | % Families |
| Less than $10,000 | 18 | 1.6% |
| $10,000 to $14,999 | 15 | 1.4% |
| $15,000 to $24,999 | 0 | 0.0% |
| $25,000 to $34,999 | 17 | 1.5% |
| $35,000 to $49,999 | 0 | 0.0% |
| $50,000 to $74,999 | 49 | 4.4% |
| $75,000 to $99,999 | 65 | 5.9% |
| $100,000 to $149,999 | 202 | 18.3% |
| $150,000 to $199,999 | 147 | 13.3% |
| $200,000+ | 593 | 53.6% |
Family Income by Famaliy Size in Fairway
4-person families (362 | 32.7%) account for the highest median family income in Fairway with $250,001 per family, while 2-person families (437 | 39.5%) have the highest median income of $97,656 per family member.
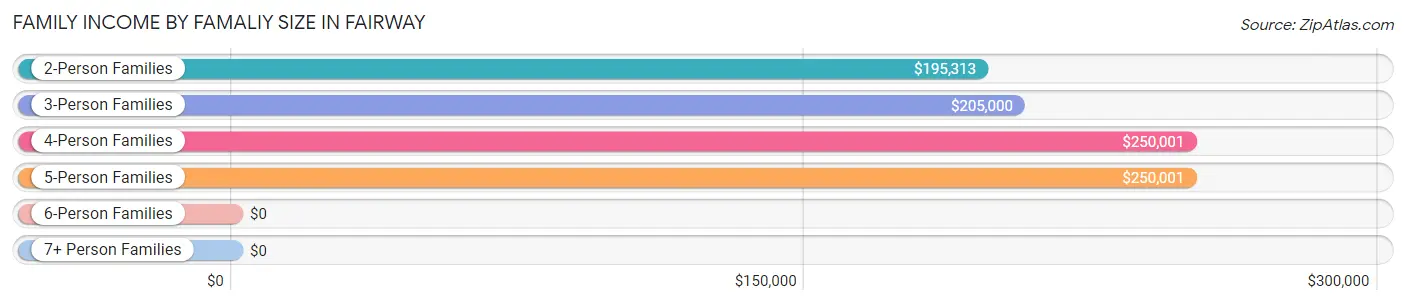
| Income Bracket | # Families | Median Income |
| 2-Person Families | 437 (39.5%) | $195,313 |
| 3-Person Families | 174 (15.7%) | $205,000 |
| 4-Person Families | 362 (32.7%) | $250,001 |
| 5-Person Families | 110 (10.0%) | $250,001 |
| 6-Person Families | 23 (2.1%) | $0 |
| 7+ Person Families | 0 (0.0%) | $0 |
| Total | 1,106 (100.0%) | $223,690 |
Family Income by Number of Earners in Fairway
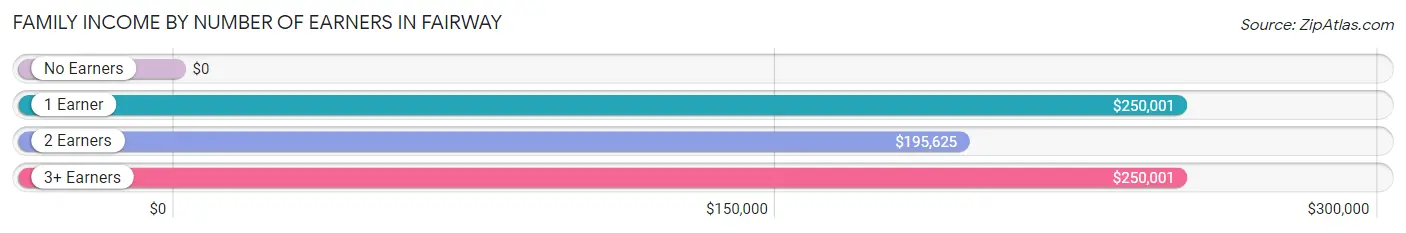
| Number of Earners | # Families | Median Income |
| No Earners | 120 (10.8%) | $0 |
| 1 Earner | 168 (15.2%) | $250,001 |
| 2 Earners | 682 (61.7%) | $195,625 |
| 3+ Earners | 136 (12.3%) | $250,001 |
| Total | 1,106 (100.0%) | $223,690 |
Household Income in Fairway
Household Income Brackets in Fairway
With 631 households falling in the category, the $200,000+ income range is the most frequent in Fairway, accounting for 40.5% of all households. In contrast, only 16 households (1.0%) fall into the $10,000 to $14,999 income bracket, making it the least populous group.
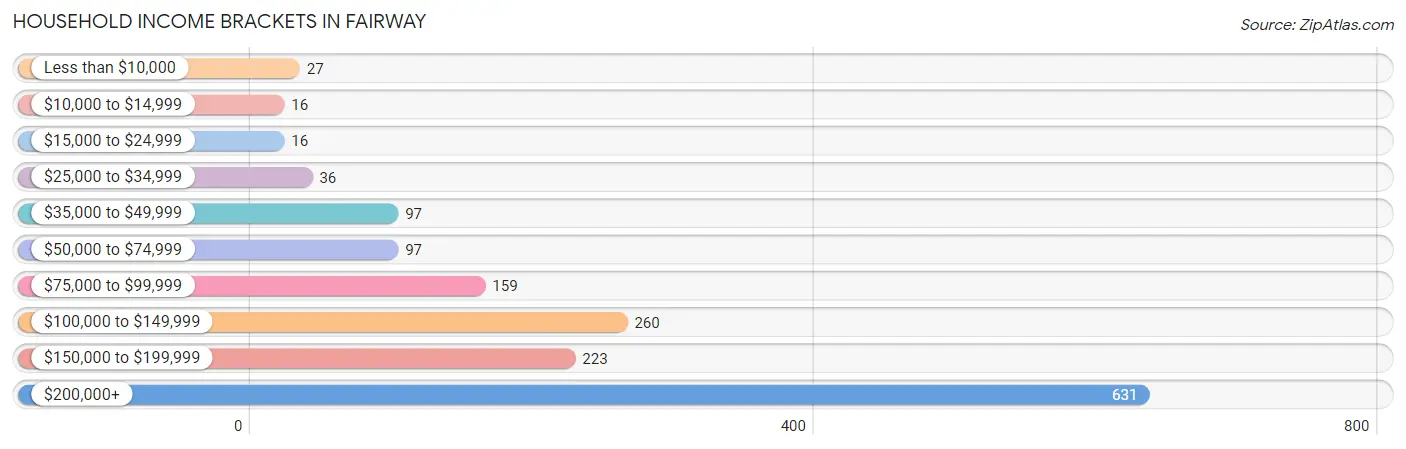
| Income Bracket | # Households | % Households |
| Less than $10,000 | 27 | 1.7% |
| $10,000 to $14,999 | 16 | 1.0% |
| $15,000 to $24,999 | 16 | 1.0% |
| $25,000 to $34,999 | 36 | 2.3% |
| $35,000 to $49,999 | 97 | 6.2% |
| $50,000 to $74,999 | 97 | 6.2% |
| $75,000 to $99,999 | 159 | 10.2% |
| $100,000 to $149,999 | 260 | 16.7% |
| $150,000 to $199,999 | 223 | 14.3% |
| $200,000+ | 631 | 40.5% |
Household Income by Householder Age in Fairway
The median household income in Fairway is $154,981, with the highest median household income of $207,763 found in the 25 to 44 years age bracket for the primary householder. A total of 596 households (38.2%) fall into this category.
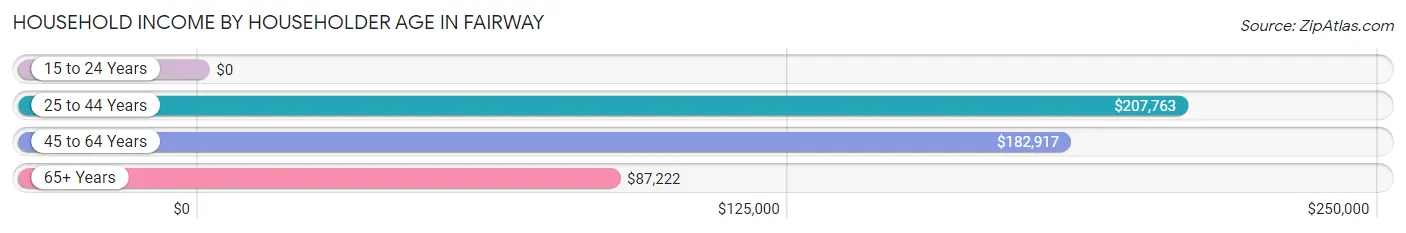
| Income Bracket | # Households | Median Income |
| 15 to 24 Years | 0 (0.0%) | $0 |
| 25 to 44 Years | 596 (38.2%) | $207,763 |
| 45 to 64 Years | 601 (38.6%) | $182,917 |
| 65+ Years | 362 (23.2%) | $87,222 |
| Total | 1,559 (100.0%) | $154,981 |
Poverty in Fairway
Income Below Poverty by Sex and Age in Fairway
With 6.9% poverty level for males and 5.0% for females among the residents of Fairway, 15 year old males and 18 to 24 year old females are the most vulnerable to poverty, with 15 males (34.9%) and 56 females (23.1%) in their respective age groups living below the poverty level.
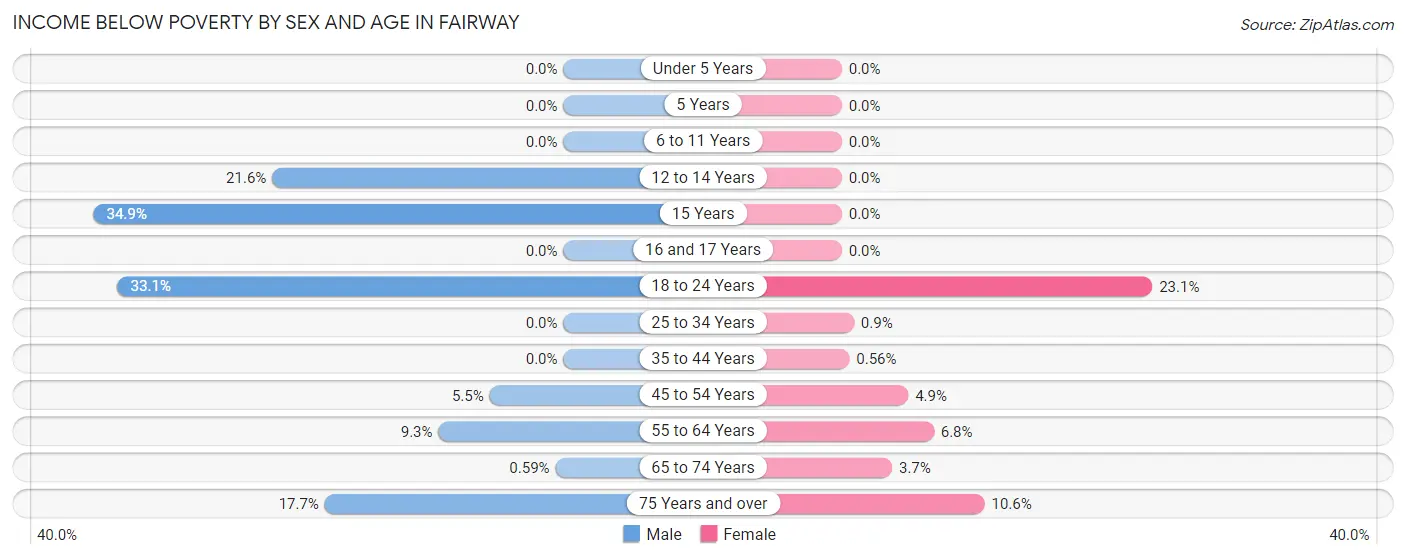
| Age Bracket | Male | Female |
| Under 5 Years | 0 (0.0%) | 0 (0.0%) |
| 5 Years | 0 (0.0%) | 0 (0.0%) |
| 6 to 11 Years | 0 (0.0%) | 0 (0.0%) |
| 12 to 14 Years | 16 (21.6%) | 0 (0.0%) |
| 15 Years | 15 (34.9%) | 0 (0.0%) |
| 16 and 17 Years | 0 (0.0%) | 0 (0.0%) |
| 18 to 24 Years | 46 (33.1%) | 56 (23.1%) |
| 25 to 34 Years | 0 (0.0%) | 2 (0.9%) |
| 35 to 44 Years | 0 (0.0%) | 2 (0.6%) |
| 45 to 54 Years | 17 (5.5%) | 15 (4.9%) |
| 55 to 64 Years | 18 (9.3%) | 19 (6.8%) |
| 65 to 74 Years | 1 (0.6%) | 6 (3.7%) |
| 75 Years and over | 14 (17.7%) | 16 (10.6%) |
| Total | 127 (6.9%) | 116 (5.0%) |
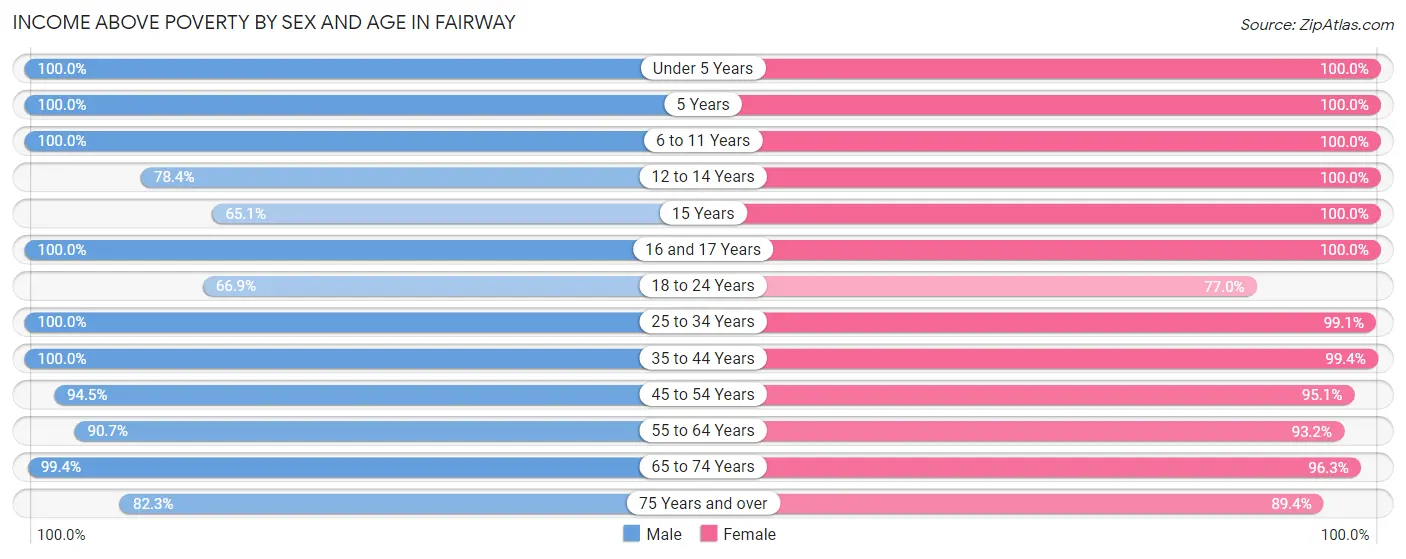
Income Above Poverty by Sex and Age in Fairway
According to the poverty statistics in Fairway, males aged under 5 years and females aged under 5 years are the age groups that are most secure financially, with 100.0% of males and 100.0% of females in these age groups living above the poverty line.
| Age Bracket | Male | Female |
| Under 5 Years | 65 (100.0%) | 204 (100.0%) |
| 5 Years | 18 (100.0%) | 4 (100.0%) |
| 6 to 11 Years | 188 (100.0%) | 208 (100.0%) |
| 12 to 14 Years | 58 (78.4%) | 102 (100.0%) |
| 15 Years | 28 (65.1%) | 48 (100.0%) |
| 16 and 17 Years | 41 (100.0%) | 48 (100.0%) |
| 18 to 24 Years | 93 (66.9%) | 187 (76.9%) |
| 25 to 34 Years | 168 (100.0%) | 219 (99.1%) |
| 35 to 44 Years | 343 (100.0%) | 356 (99.4%) |
| 45 to 54 Years | 293 (94.5%) | 289 (95.1%) |
| 55 to 64 Years | 176 (90.7%) | 259 (93.2%) |
| 65 to 74 Years | 169 (99.4%) | 155 (96.3%) |
| 75 Years and over | 65 (82.3%) | 135 (89.4%) |
| Total | 1,705 (93.1%) | 2,214 (95.0%) |
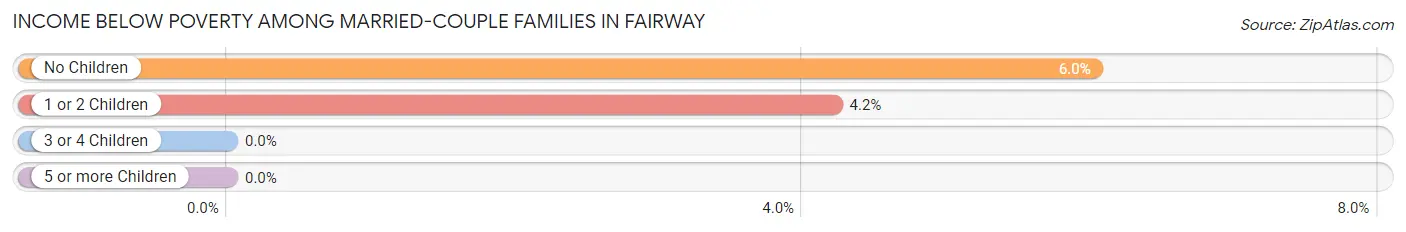
Income Below Poverty Among Married-Couple Families in Fairway
The poverty statistics for married-couple families in Fairway show that 4.8% or 50 of the total 1,049 families live below the poverty line. Families with no children have the highest poverty rate of 6.0%, comprising of 33 families. On the other hand, families with 3 or 4 children have the lowest poverty rate of 0.0%, which includes 0 families.
| Children | Above Poverty | Below Poverty |
| No Children | 515 (94.0%) | 33 (6.0%) |
| 1 or 2 Children | 387 (95.8%) | 17 (4.2%) |
| 3 or 4 Children | 97 (100.0%) | 0 (0.0%) |
| 5 or more Children | 0 (0.0%) | 0 (0.0%) |
| Total | 999 (95.2%) | 50 (4.8%) |
Income Below Poverty Among Single-Parent Households in Fairway
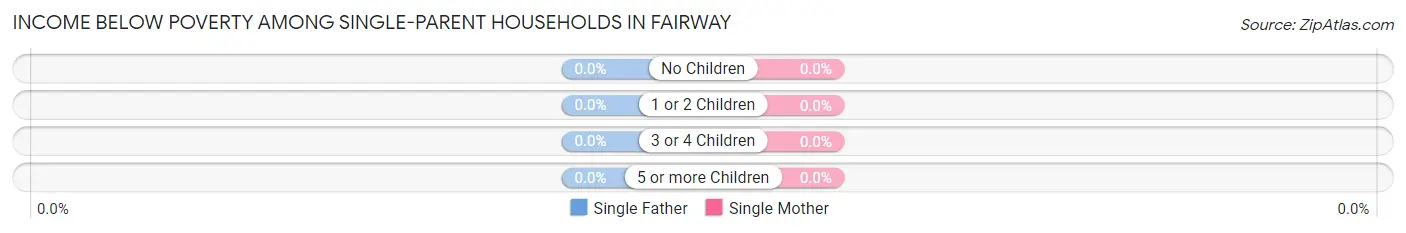
| Children | Single Father | Single Mother |
| No Children | 0 (0.0%) | 0 (0.0%) |
| 1 or 2 Children | 0 (0.0%) | 0 (0.0%) |
| 3 or 4 Children | 0 (0.0%) | 0 (0.0%) |
| 5 or more Children | 0 (0.0%) | 0 (0.0%) |
| Total | 0 (0.0%) | 0 (0.0%) |
Income Below Poverty Among Married-Couple vs Single-Parent Households in Fairway
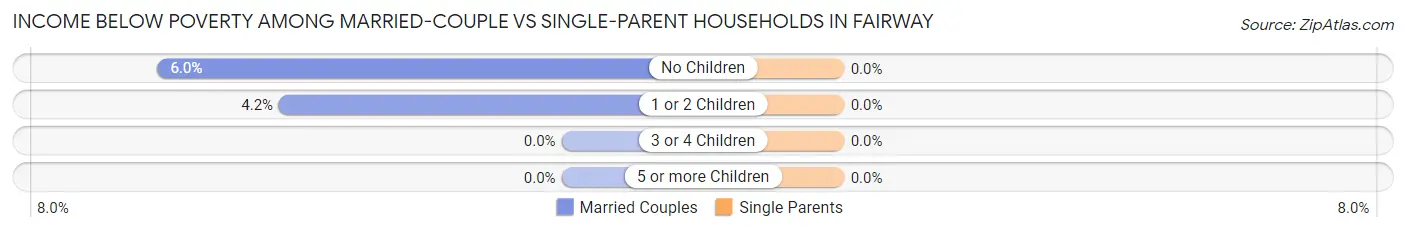
| Children | Married-Couple Families | Single-Parent Households |
| No Children | 33 (6.0%) | 0 (0.0%) |
| 1 or 2 Children | 17 (4.2%) | 0 (0.0%) |
| 3 or 4 Children | 0 (0.0%) | 0 (0.0%) |
| 5 or more Children | 0 (0.0%) | 0 (0.0%) |
| Total | 50 (4.8%) | 0 (0.0%) |
Employment Characteristics in Fairway
Employment by Class of Employer in Fairway
Among the 2,250 employed individuals in Fairway, private company employees (1,475 | 65.6%), not-for-profit organizations (228 | 10.1%), and self-employed (not incorporated) (185 | 8.2%) make up the most common classes of employment.
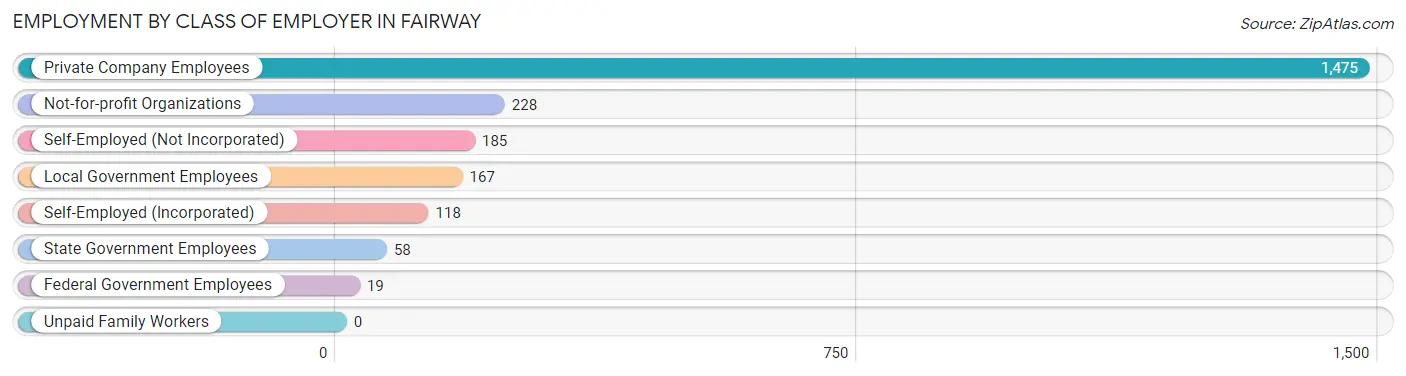
| Employer Class | # Employees | % Employees |
| Private Company Employees | 1,475 | 65.6% |
| Self-Employed (Incorporated) | 118 | 5.2% |
| Self-Employed (Not Incorporated) | 185 | 8.2% |
| Not-for-profit Organizations | 228 | 10.1% |
| Local Government Employees | 167 | 7.4% |
| State Government Employees | 58 | 2.6% |
| Federal Government Employees | 19 | 0.8% |
| Unpaid Family Workers | 0 | 0.0% |
| Total | 2,250 | 100.0% |
Employment Status by Age in Fairway
According to the labor force statistics for Fairway, out of the total population over 16 years of age (3,208), 71.6% or 2,297 individuals are in the labor force, with 0.7% or 16 of them unemployed. The age group with the highest labor force participation rate is 25 to 29 years, with 98.0% or 100 individuals in the labor force. Within the labor force, the 16 to 19 years age range has the highest percentage of unemployed individuals, with 12.2% or 5 of them being unemployed.
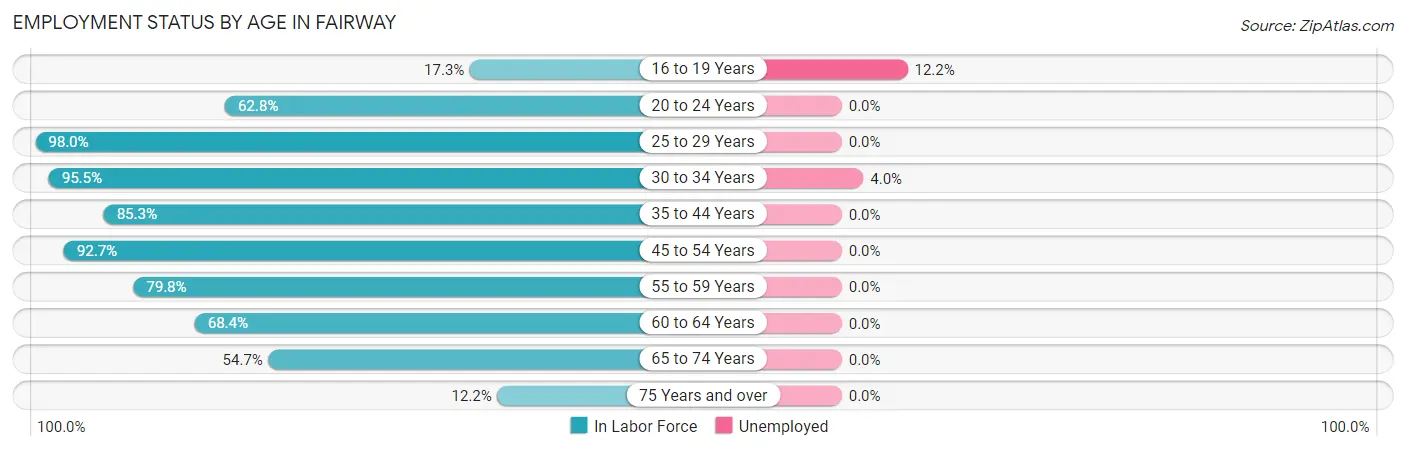
| Age Bracket | In Labor Force | Unemployed |
| 16 to 19 Years | 41 (17.3%) | 5 (12.2%) |
| 20 to 24 Years | 147 (62.8%) | 0 (0.0%) |
| 25 to 29 Years | 100 (98.0%) | 0 (0.0%) |
| 30 to 34 Years | 274 (95.5%) | 11 (4.0%) |
| 35 to 44 Years | 598 (85.3%) | 0 (0.0%) |
| 45 to 54 Years | 569 (92.7%) | 0 (0.0%) |
| 55 to 59 Years | 253 (79.8%) | 0 (0.0%) |
| 60 to 64 Years | 106 (68.4%) | 0 (0.0%) |
| 65 to 74 Years | 181 (54.7%) | 0 (0.0%) |
| 75 Years and over | 28 (12.2%) | 0 (0.0%) |
| Total | 2,297 (71.6%) | 16 (0.7%) |
Employment Status by Educational Attainment in Fairway
According to labor force statistics for Fairway, 87.3% of individuals (1,900) out of the total population between 25 and 64 years of age (2,176) are in the labor force, with 0.6% or 11 of them being unemployed. The group with the highest labor force participation rate are those with the educational attainment of bachelor's degree or higher, with 89.1% or 1,658 individuals in the labor force. Within the labor force, individuals with bachelor's degree or higher education have the highest percentage of unemployment, with 0.7% or 12 of them being unemployed.
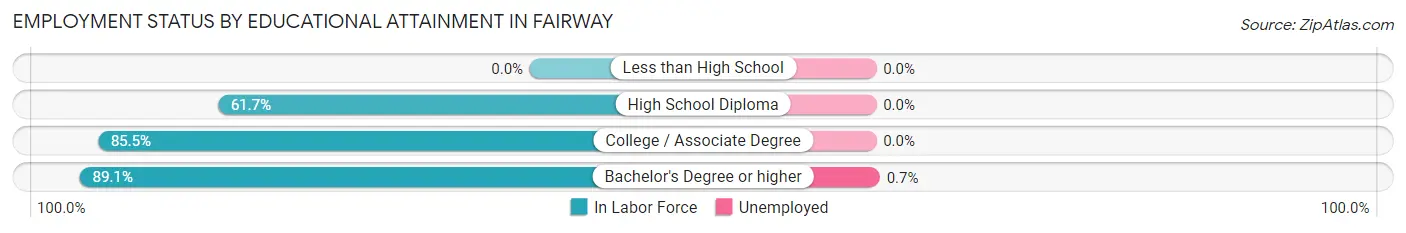
| Educational Attainment | In Labor Force | Unemployed |
| Less than High School | 0 (0.0%) | 0 (0.0%) |
| High School Diploma | 71 (61.7%) | 0 (0.0%) |
| College / Associate Degree | 171 (85.5%) | 0 (0.0%) |
| Bachelor's Degree or higher | 1,658 (89.1%) | 13 (0.7%) |
| Total | 1,900 (87.3%) | 13 (0.6%) |
Employment Occupations by Sex in Fairway
Management, Business, Science and Arts Occupations
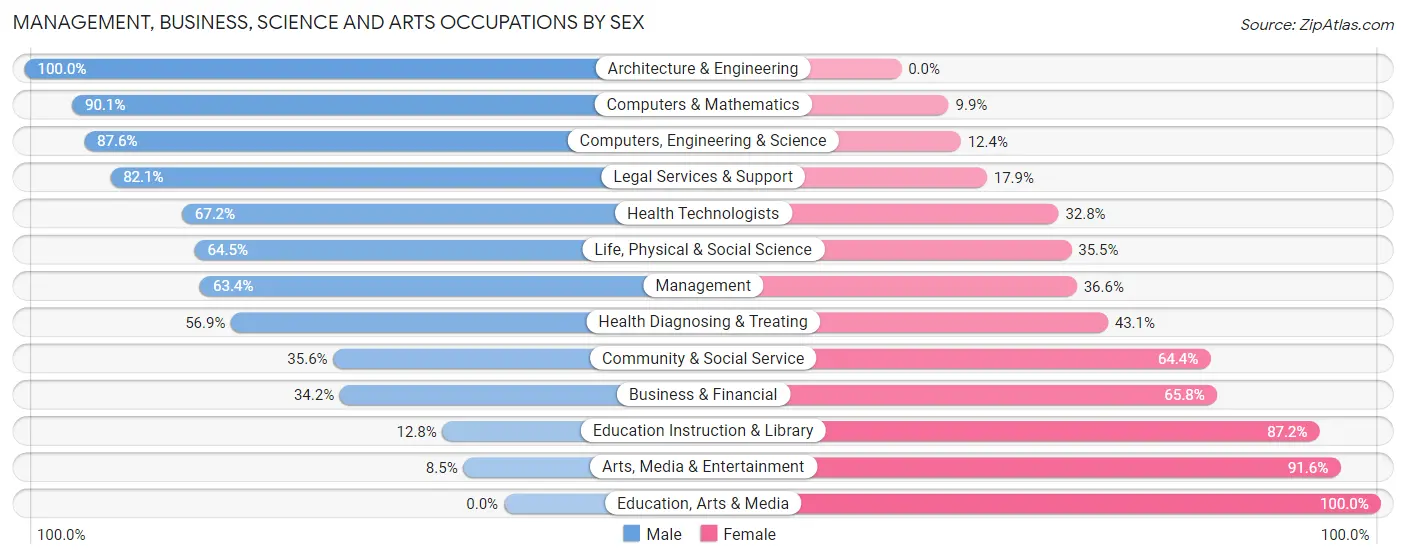
The most common Management, Business, Science and Arts occupations in Fairway are Community & Social Service (385 | 16.9%), Business & Financial (342 | 15.0%), Health Diagnosing & Treating (334 | 14.6%), Management (325 | 14.2%), and Health Technologists (253 | 11.1%).
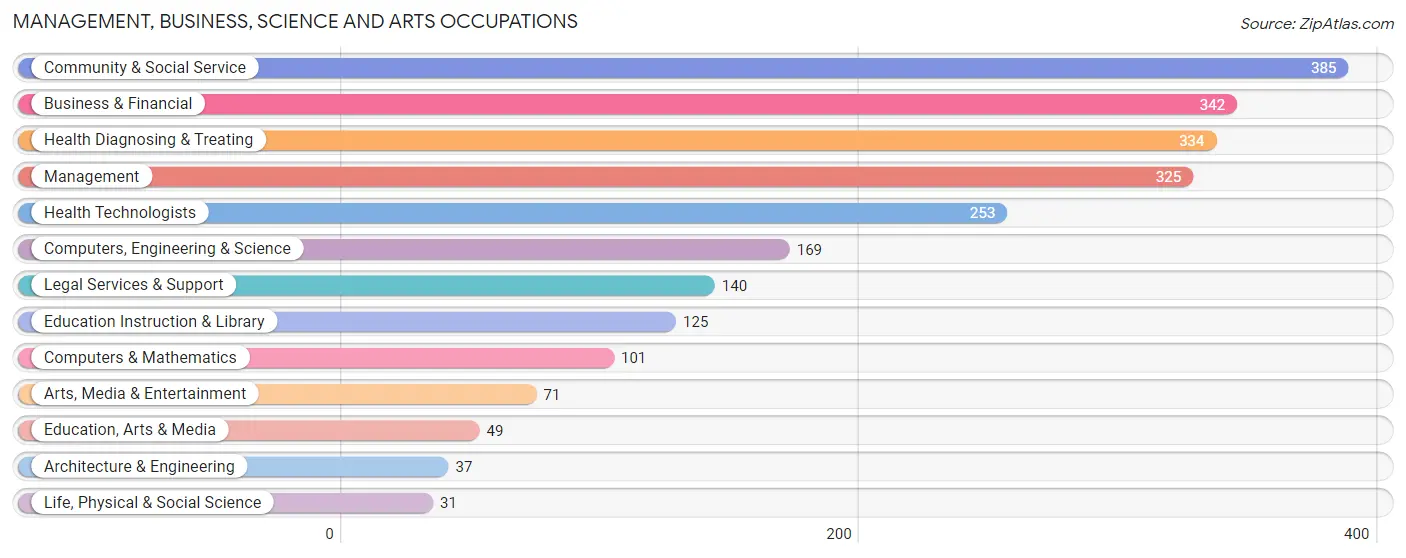
Management, Business, Science and Arts Occupations by Sex
Within the Management, Business, Science and Arts occupations in Fairway, the most male-oriented occupations are Architecture & Engineering (100.0%), Computers & Mathematics (90.1%), and Computers, Engineering & Science (87.6%), while the most female-oriented occupations are Education, Arts & Media (100.0%), Arts, Media & Entertainment (91.5%), and Education Instruction & Library (87.2%).
| Occupation | Male | Female |
| Management | 206 (63.4%) | 119 (36.6%) |
| Business & Financial | 117 (34.2%) | 225 (65.8%) |
| Computers, Engineering & Science | 148 (87.6%) | 21 (12.4%) |
| Computers & Mathematics | 91 (90.1%) | 10 (9.9%) |
| Architecture & Engineering | 37 (100.0%) | 0 (0.0%) |
| Life, Physical & Social Science | 20 (64.5%) | 11 (35.5%) |
| Community & Social Service | 137 (35.6%) | 248 (64.4%) |
| Education, Arts & Media | 0 (0.0%) | 49 (100.0%) |
| Legal Services & Support | 115 (82.1%) | 25 (17.9%) |
| Education Instruction & Library | 16 (12.8%) | 109 (87.2%) |
| Arts, Media & Entertainment | 6 (8.5%) | 65 (91.5%) |
| Health Diagnosing & Treating | 190 (56.9%) | 144 (43.1%) |
| Health Technologists | 170 (67.2%) | 83 (32.8%) |
| Total (Category) | 798 (51.3%) | 757 (48.7%) |
| Total (Overall) | 1,188 (52.1%) | 1,093 (47.9%) |
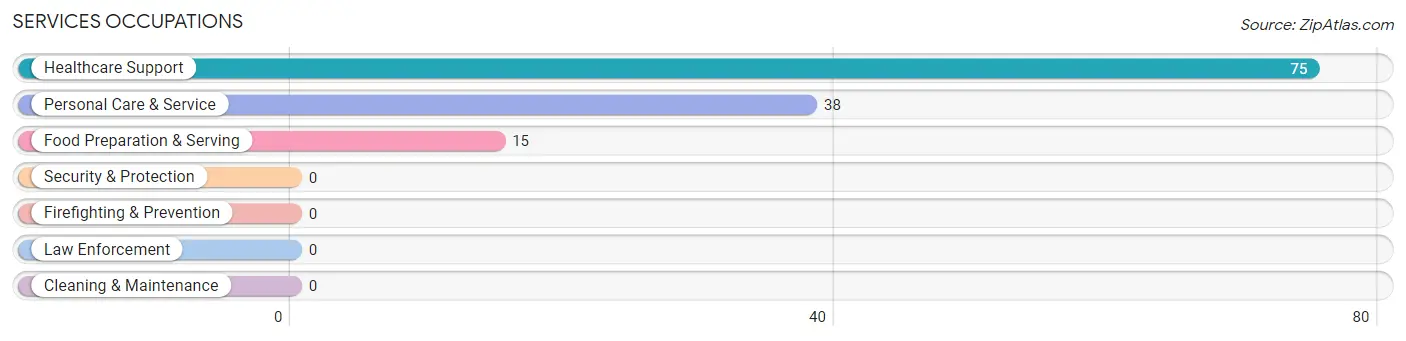
Services Occupations
The most common Services occupations in Fairway are Healthcare Support (75 | 3.3%), Personal Care & Service (38 | 1.7%), and Food Preparation & Serving (15 | 0.7%).
Services Occupations by Sex
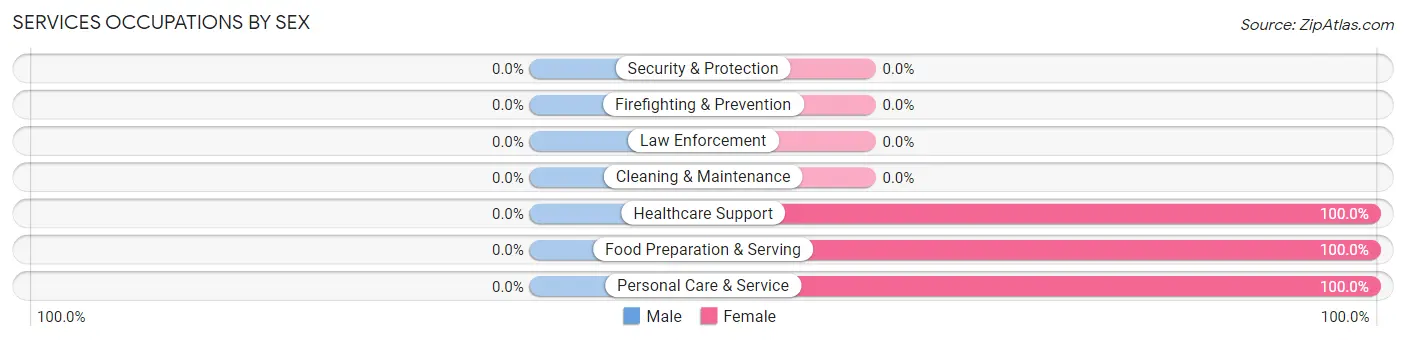
| Occupation | Male | Female |
| Healthcare Support | 0 (0.0%) | 75 (100.0%) |
| Security & Protection | 0 (0.0%) | 0 (0.0%) |
| Firefighting & Prevention | 0 (0.0%) | 0 (0.0%) |
| Law Enforcement | 0 (0.0%) | 0 (0.0%) |
| Food Preparation & Serving | 0 (0.0%) | 15 (100.0%) |
| Cleaning & Maintenance | 0 (0.0%) | 0 (0.0%) |
| Personal Care & Service | 0 (0.0%) | 38 (100.0%) |
| Total (Category) | 0 (0.0%) | 128 (100.0%) |
| Total (Overall) | 1,188 (52.1%) | 1,093 (47.9%) |
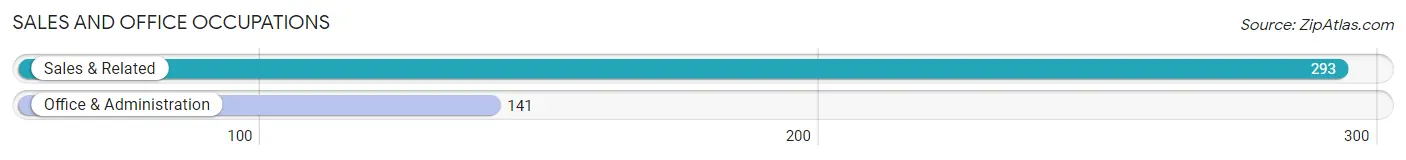
Sales and Office Occupations
The most common Sales and Office occupations in Fairway are Sales & Related (293 | 12.9%), and Office & Administration (141 | 6.2%).
Sales and Office Occupations by Sex
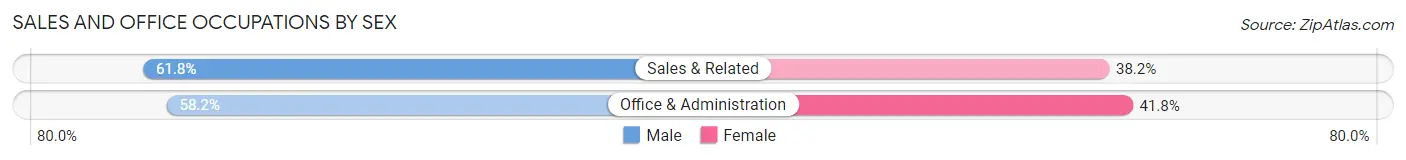
| Occupation | Male | Female |
| Sales & Related | 181 (61.8%) | 112 (38.2%) |
| Office & Administration | 82 (58.2%) | 59 (41.8%) |
| Total (Category) | 263 (60.6%) | 171 (39.4%) |
| Total (Overall) | 1,188 (52.1%) | 1,093 (47.9%) |
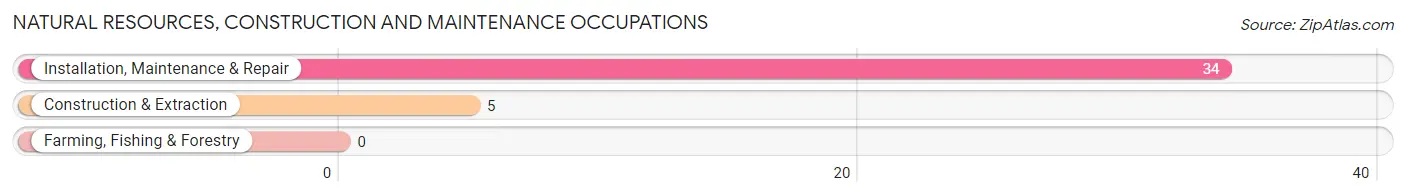
Natural Resources, Construction and Maintenance Occupations
The most common Natural Resources, Construction and Maintenance occupations in Fairway are Installation, Maintenance & Repair (34 | 1.5%), and Construction & Extraction (5 | 0.2%).
Natural Resources, Construction and Maintenance Occupations by Sex
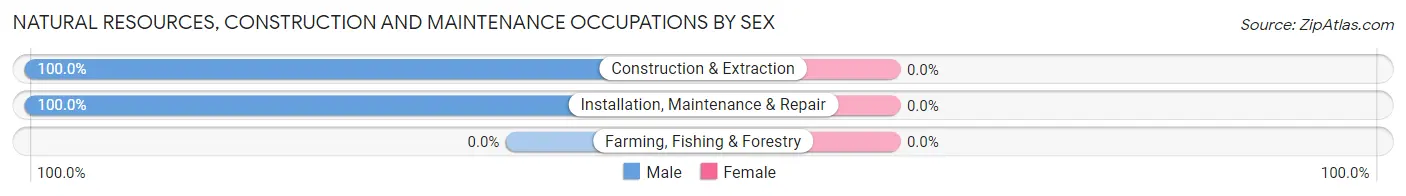
| Occupation | Male | Female |
| Farming, Fishing & Forestry | 0 (0.0%) | 0 (0.0%) |
| Construction & Extraction | 5 (100.0%) | 0 (0.0%) |
| Installation, Maintenance & Repair | 34 (100.0%) | 0 (0.0%) |
| Total (Category) | 39 (100.0%) | 0 (0.0%) |
| Total (Overall) | 1,188 (52.1%) | 1,093 (47.9%) |
Production, Transportation and Moving Occupations
The most common Production, Transportation and Moving occupations in Fairway are Material Moving (84 | 3.7%), Production (22 | 1.0%), and Transportation (19 | 0.8%).
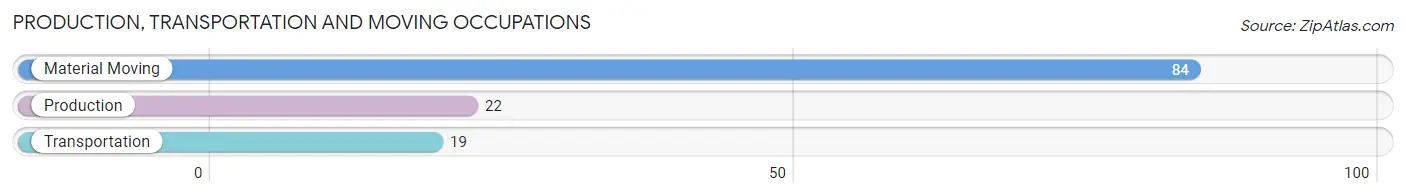
Production, Transportation and Moving Occupations by Sex
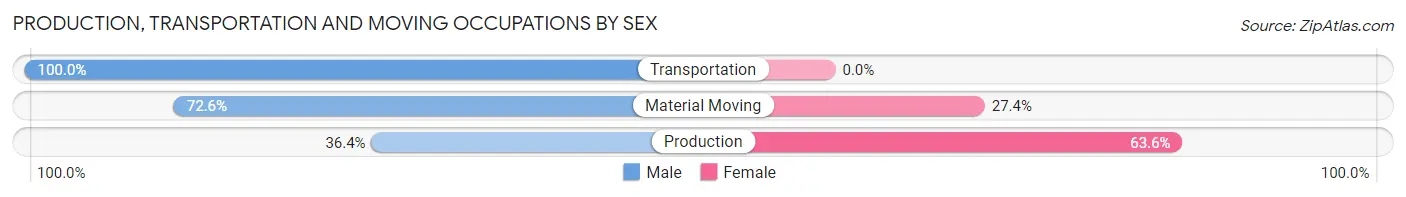
| Occupation | Male | Female |
| Production | 8 (36.4%) | 14 (63.6%) |
| Transportation | 19 (100.0%) | 0 (0.0%) |
| Material Moving | 61 (72.6%) | 23 (27.4%) |
| Total (Category) | 88 (70.4%) | 37 (29.6%) |
| Total (Overall) | 1,188 (52.1%) | 1,093 (47.9%) |
Employment Industries by Sex in Fairway
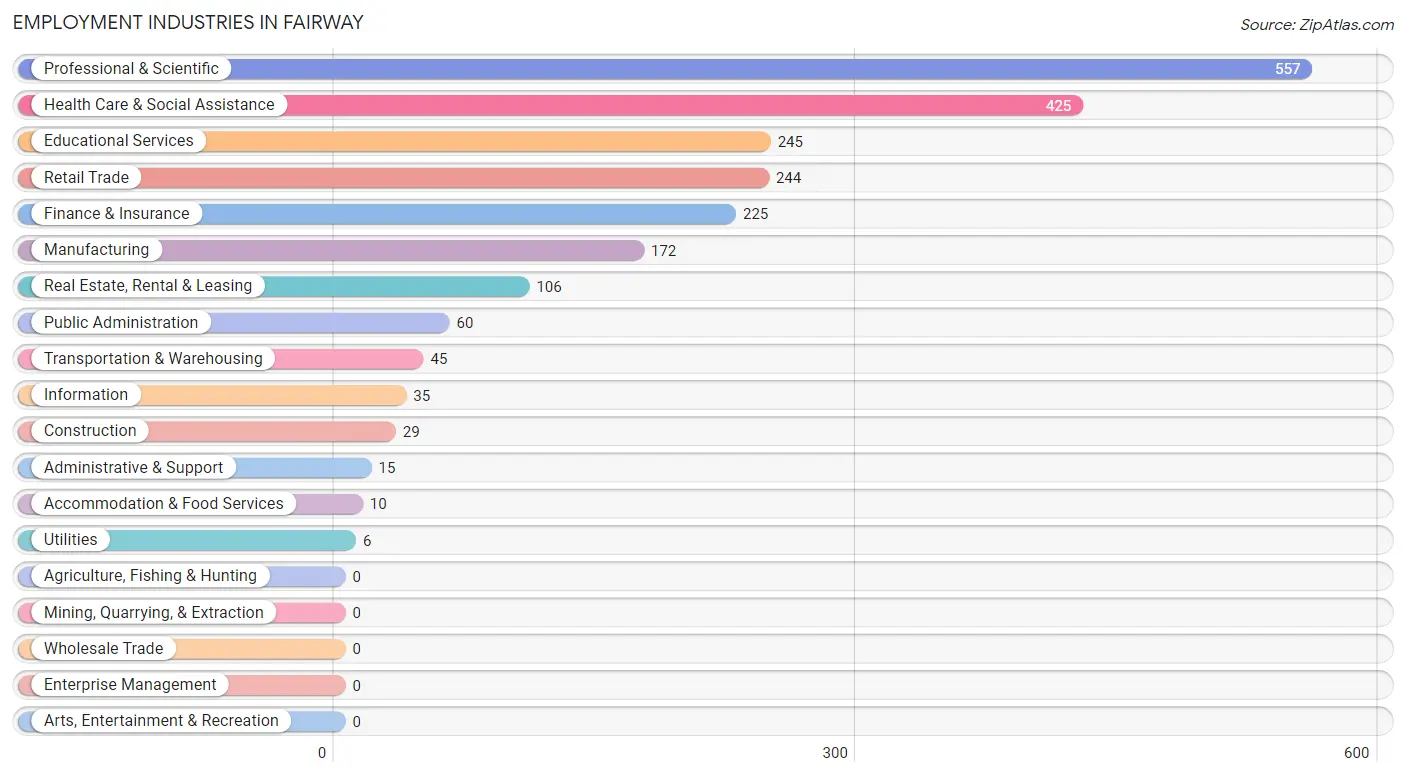
Employment Industries in Fairway
The major employment industries in Fairway include Professional & Scientific (557 | 24.4%), Health Care & Social Assistance (425 | 18.6%), Educational Services (245 | 10.7%), Retail Trade (244 | 10.7%), and Finance & Insurance (225 | 9.9%).
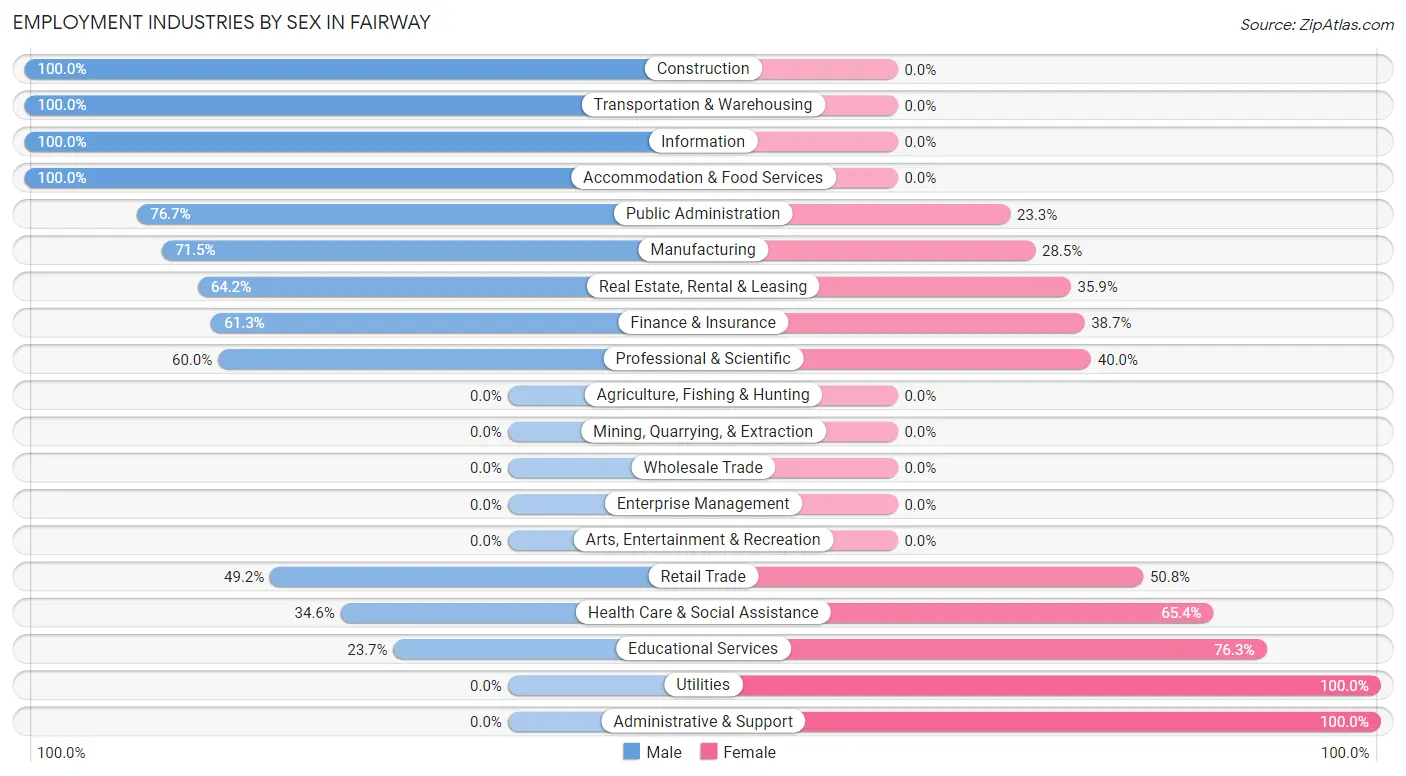
Employment Industries by Sex in Fairway
The Fairway industries that see more men than women are Construction (100.0%), Transportation & Warehousing (100.0%), and Information (100.0%), whereas the industries that tend to have a higher number of women are Utilities (100.0%), Administrative & Support (100.0%), and Educational Services (76.3%).
| Industry | Male | Female |
| Agriculture, Fishing & Hunting | 0 (0.0%) | 0 (0.0%) |
| Mining, Quarrying, & Extraction | 0 (0.0%) | 0 (0.0%) |
| Construction | 29 (100.0%) | 0 (0.0%) |
| Manufacturing | 123 (71.5%) | 49 (28.5%) |
| Wholesale Trade | 0 (0.0%) | 0 (0.0%) |
| Retail Trade | 120 (49.2%) | 124 (50.8%) |
| Transportation & Warehousing | 45 (100.0%) | 0 (0.0%) |
| Utilities | 0 (0.0%) | 6 (100.0%) |
| Information | 35 (100.0%) | 0 (0.0%) |
| Finance & Insurance | 138 (61.3%) | 87 (38.7%) |
| Real Estate, Rental & Leasing | 68 (64.1%) | 38 (35.8%) |
| Professional & Scientific | 334 (60.0%) | 223 (40.0%) |
| Enterprise Management | 0 (0.0%) | 0 (0.0%) |
| Administrative & Support | 0 (0.0%) | 15 (100.0%) |
| Educational Services | 58 (23.7%) | 187 (76.3%) |
| Health Care & Social Assistance | 147 (34.6%) | 278 (65.4%) |
| Arts, Entertainment & Recreation | 0 (0.0%) | 0 (0.0%) |
| Accommodation & Food Services | 10 (100.0%) | 0 (0.0%) |
| Public Administration | 46 (76.7%) | 14 (23.3%) |
| Total | 1,188 (52.1%) | 1,093 (47.9%) |
Education in Fairway
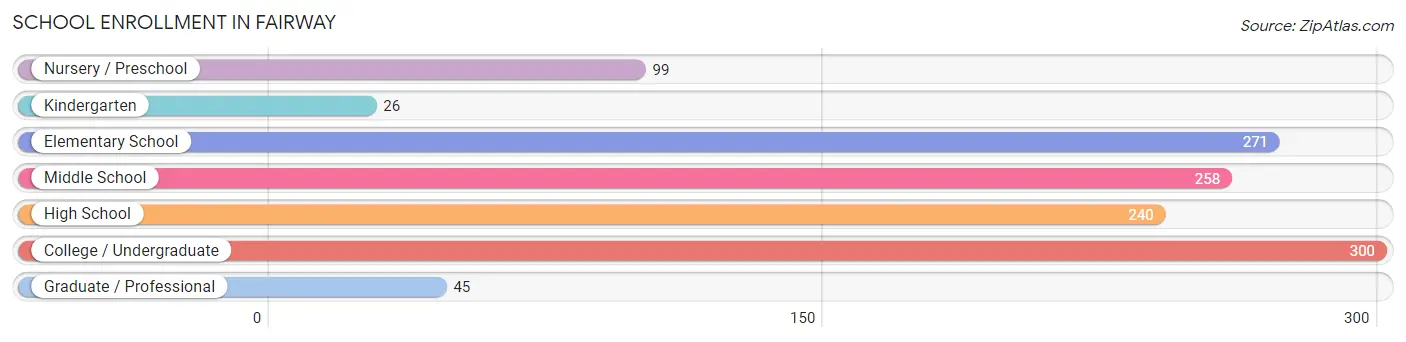
School Enrollment in Fairway
The most common levels of schooling among the 1,239 students in Fairway are college / undergraduate (300 | 24.2%), elementary school (271 | 21.9%), and middle school (258 | 20.8%).
| School Level | # Students | % Students |
| Nursery / Preschool | 99 | 8.0% |
| Kindergarten | 26 | 2.1% |
| Elementary School | 271 | 21.9% |
| Middle School | 258 | 20.8% |
| High School | 240 | 19.4% |
| College / Undergraduate | 300 | 24.2% |
| Graduate / Professional | 45 | 3.6% |
| Total | 1,239 | 100.0% |
School Enrollment by Age by Funding Source in Fairway
Out of a total of 1,239 students who are enrolled in schools in Fairway, 268 (21.6%) attend a private institution, while the remaining 971 (78.4%) are enrolled in public schools. The age group of 3 to 4 year olds has the highest likelihood of being enrolled in private schools, with 73 (94.8% in the age bracket) enrolled. Conversely, the age group of 20 to 24 year olds has the lowest likelihood of being enrolled in a private school, with 181 (100.0% in the age bracket) attending a public institution.
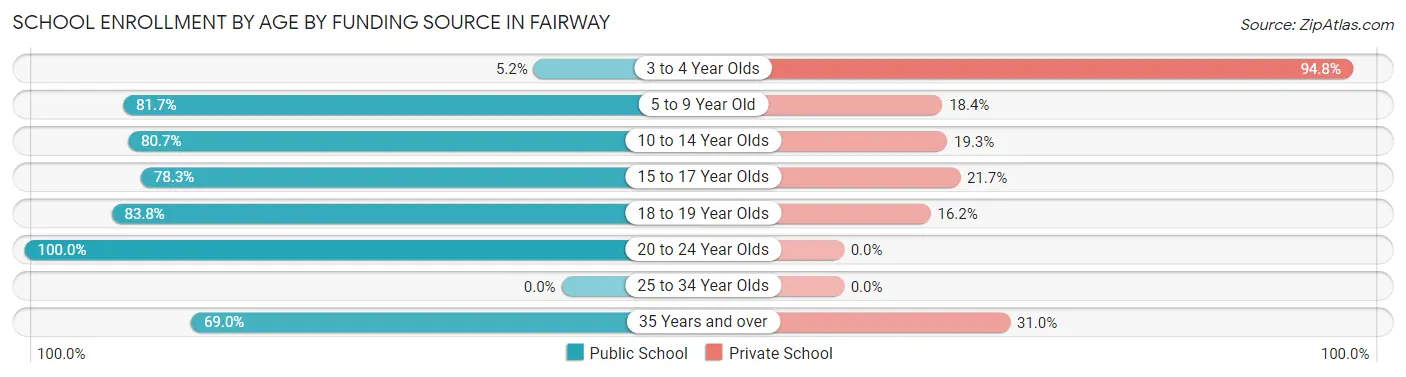
| Age Bracket | Public School | Private School |
| 3 to 4 Year Olds | 4 (5.2%) | 73 (94.8%) |
| 5 to 9 Year Old | 218 (81.7%) | 49 (18.3%) |
| 10 to 14 Year Olds | 264 (80.7%) | 63 (19.3%) |
| 15 to 17 Year Olds | 141 (78.3%) | 39 (21.7%) |
| 18 to 19 Year Olds | 114 (83.8%) | 22 (16.2%) |
| 20 to 24 Year Olds | 181 (100.0%) | 0 (0.0%) |
| 25 to 34 Year Olds | 0 (0.0%) | 0 (0.0%) |
| 35 Years and over | 49 (69.0%) | 22 (31.0%) |
| Total | 971 (78.4%) | 268 (21.6%) |
Educational Attainment by Field of Study in Fairway
Business (642 | 26.8%), bio, nature & agricultural (248 | 10.4%), social sciences (225 | 9.4%), science & technology (207 | 8.6%), and visual & performing arts (188 | 7.9%) are the most common fields of study among 2,394 individuals in Fairway who have obtained a bachelor's degree or higher.
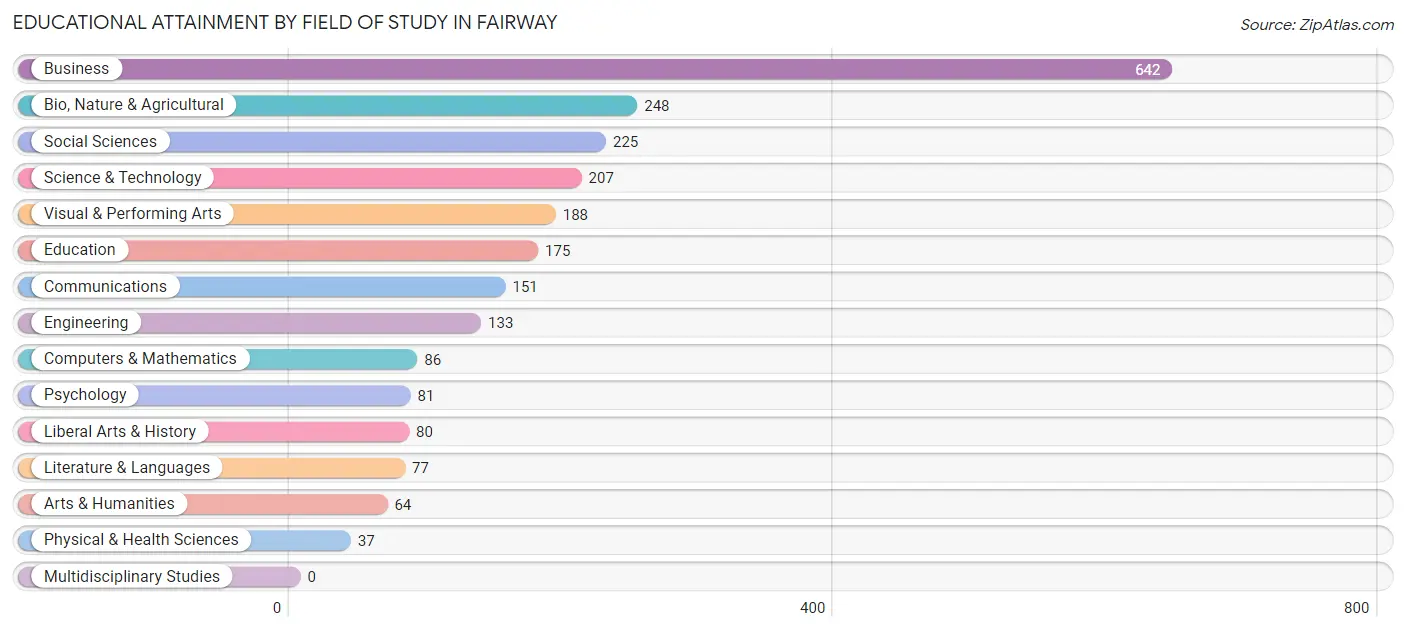
| Field of Study | # Graduates | % Graduates |
| Computers & Mathematics | 86 | 3.6% |
| Bio, Nature & Agricultural | 248 | 10.4% |
| Physical & Health Sciences | 37 | 1.5% |
| Psychology | 81 | 3.4% |
| Social Sciences | 225 | 9.4% |
| Engineering | 133 | 5.6% |
| Multidisciplinary Studies | 0 | 0.0% |
| Science & Technology | 207 | 8.6% |
| Business | 642 | 26.8% |
| Education | 175 | 7.3% |
| Literature & Languages | 77 | 3.2% |
| Liberal Arts & History | 80 | 3.3% |
| Visual & Performing Arts | 188 | 7.9% |
| Communications | 151 | 6.3% |
| Arts & Humanities | 64 | 2.7% |
| Total | 2,394 | 100.0% |
Transportation & Commute in Fairway
Vehicle Availability by Sex in Fairway
The most prevalent vehicle ownership categories in Fairway are males with 2 vehicles (700, accounting for 60.3%) and females with 2 vehicles (555, making up 64.5%).
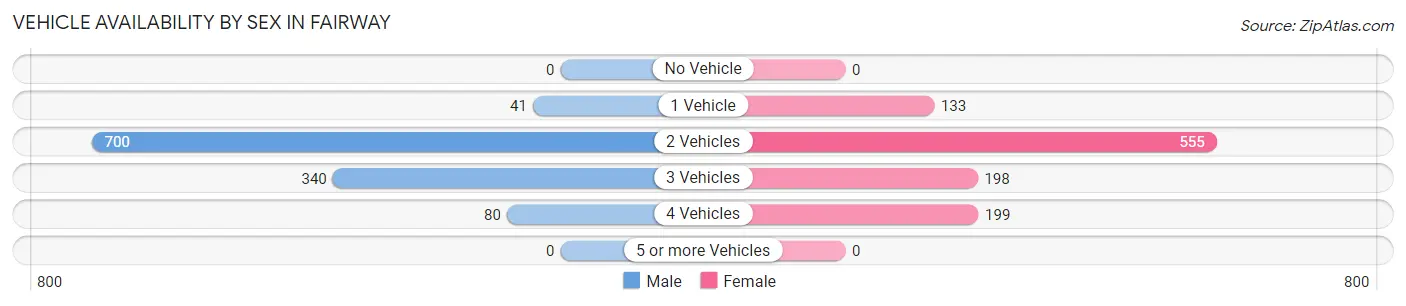
| Vehicles Available | Male | Female |
| No Vehicle | 0 (0.0%) | 0 (0.0%) |
| 1 Vehicle | 41 (3.5%) | 133 (12.3%) |
| 2 Vehicles | 700 (60.3%) | 555 (51.1%) |
| 3 Vehicles | 340 (29.3%) | 198 (18.2%) |
| 4 Vehicles | 80 (6.9%) | 199 (18.3%) |
| 5 or more Vehicles | 0 (0.0%) | 0 (0.0%) |
| Total | 1,161 (100.0%) | 1,085 (100.0%) |
Commute Time in Fairway
The most frequently occuring commute durations in Fairway are 15 to 19 minutes (698 commuters, 35.8%), 20 to 24 minutes (404 commuters, 20.7%), and 10 to 14 minutes (342 commuters, 17.5%).
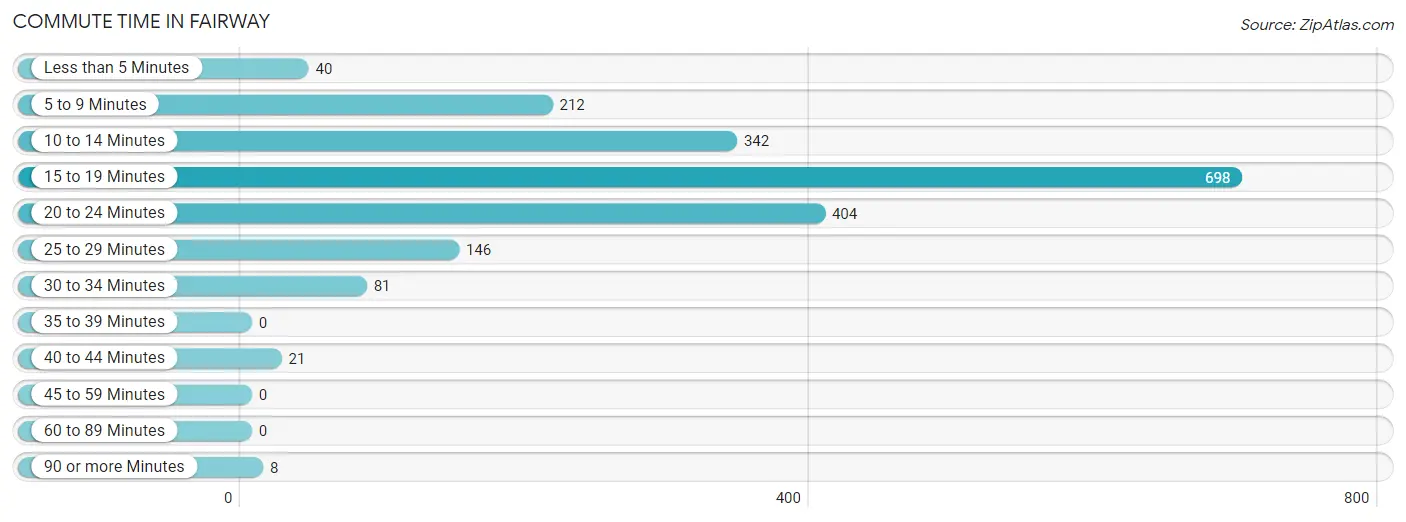
| Commute Time | # Commuters | % Commuters |
| Less than 5 Minutes | 40 | 2.1% |
| 5 to 9 Minutes | 212 | 10.9% |
| 10 to 14 Minutes | 342 | 17.5% |
| 15 to 19 Minutes | 698 | 35.8% |
| 20 to 24 Minutes | 404 | 20.7% |
| 25 to 29 Minutes | 146 | 7.5% |
| 30 to 34 Minutes | 81 | 4.2% |
| 35 to 39 Minutes | 0 | 0.0% |
| 40 to 44 Minutes | 21 | 1.1% |
| 45 to 59 Minutes | 0 | 0.0% |
| 60 to 89 Minutes | 0 | 0.0% |
| 90 or more Minutes | 8 | 0.4% |
Commute Time by Sex in Fairway
The most common commute times in Fairway are 15 to 19 minutes (380 commuters, 37.4%) for males and 15 to 19 minutes (318 commuters, 34.0%) for females.
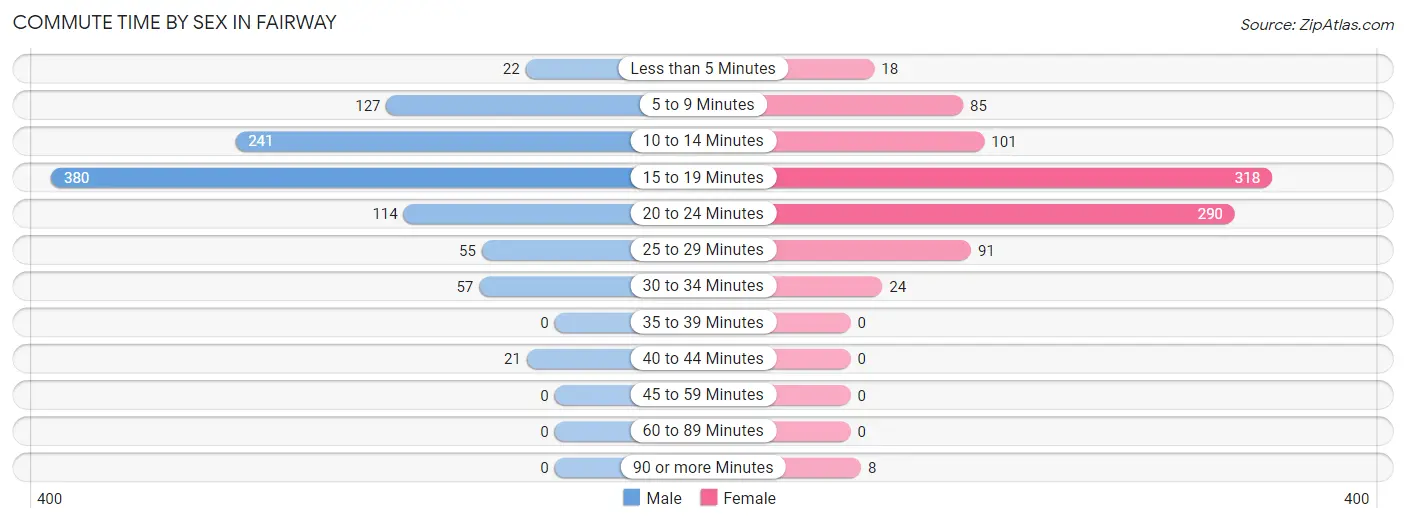
| Commute Time | Male | Female |
| Less than 5 Minutes | 22 (2.2%) | 18 (1.9%) |
| 5 to 9 Minutes | 127 (12.5%) | 85 (9.1%) |
| 10 to 14 Minutes | 241 (23.7%) | 101 (10.8%) |
| 15 to 19 Minutes | 380 (37.4%) | 318 (34.0%) |
| 20 to 24 Minutes | 114 (11.2%) | 290 (31.0%) |
| 25 to 29 Minutes | 55 (5.4%) | 91 (9.7%) |
| 30 to 34 Minutes | 57 (5.6%) | 24 (2.6%) |
| 35 to 39 Minutes | 0 (0.0%) | 0 (0.0%) |
| 40 to 44 Minutes | 21 (2.1%) | 0 (0.0%) |
| 45 to 59 Minutes | 0 (0.0%) | 0 (0.0%) |
| 60 to 89 Minutes | 0 (0.0%) | 0 (0.0%) |
| 90 or more Minutes | 0 (0.0%) | 8 (0.9%) |
Time of Departure to Work by Sex in Fairway
The most frequent times of departure to work in Fairway are 7:30 AM to 7:59 AM (289, 28.4%) for males and 8:00 AM to 8:29 AM (222, 23.7%) for females.
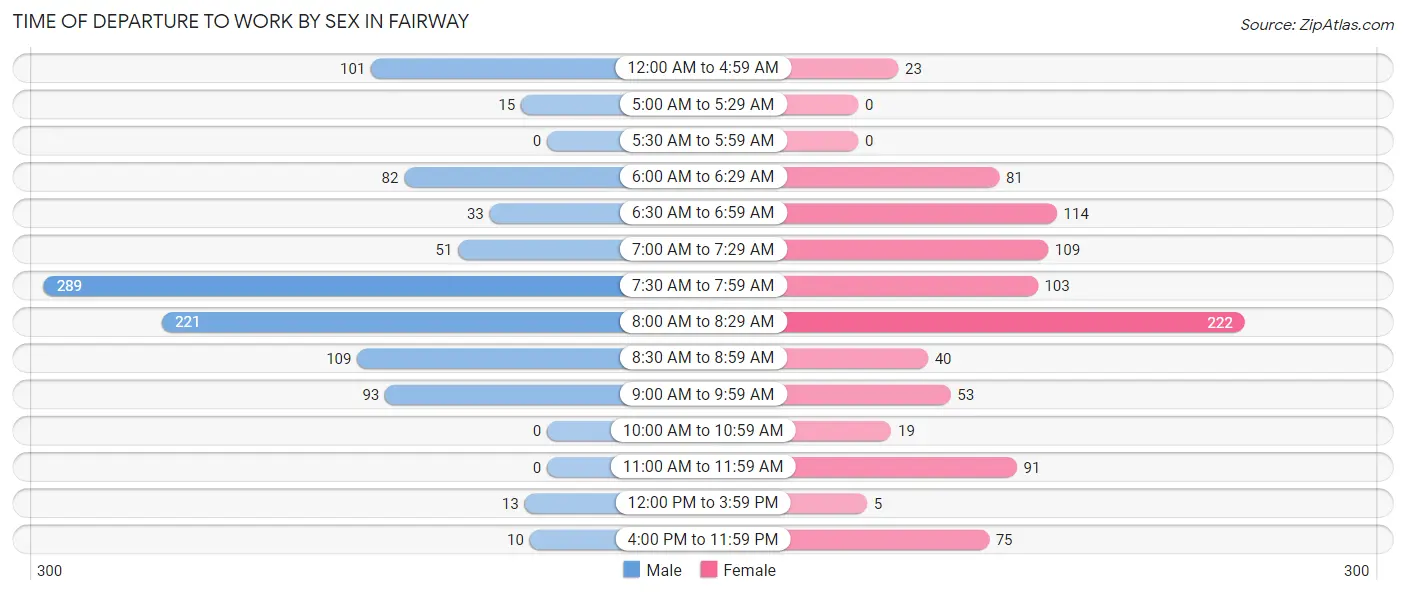
| Time of Departure | Male | Female |
| 12:00 AM to 4:59 AM | 101 (9.9%) | 23 (2.5%) |
| 5:00 AM to 5:29 AM | 15 (1.5%) | 0 (0.0%) |
| 5:30 AM to 5:59 AM | 0 (0.0%) | 0 (0.0%) |
| 6:00 AM to 6:29 AM | 82 (8.1%) | 81 (8.7%) |
| 6:30 AM to 6:59 AM | 33 (3.2%) | 114 (12.2%) |
| 7:00 AM to 7:29 AM | 51 (5.0%) | 109 (11.7%) |
| 7:30 AM to 7:59 AM | 289 (28.4%) | 103 (11.0%) |
| 8:00 AM to 8:29 AM | 221 (21.7%) | 222 (23.7%) |
| 8:30 AM to 8:59 AM | 109 (10.7%) | 40 (4.3%) |
| 9:00 AM to 9:59 AM | 93 (9.1%) | 53 (5.7%) |
| 10:00 AM to 10:59 AM | 0 (0.0%) | 19 (2.0%) |
| 11:00 AM to 11:59 AM | 0 (0.0%) | 91 (9.7%) |
| 12:00 PM to 3:59 PM | 13 (1.3%) | 5 (0.5%) |
| 4:00 PM to 11:59 PM | 10 (1.0%) | 75 (8.0%) |
| Total | 1,017 (100.0%) | 935 (100.0%) |
Housing Occupancy in Fairway
Occupancy by Ownership in Fairway
Of the total 1,559 dwellings in Fairway, owner-occupied units account for 1,349 (86.5%), while renter-occupied units make up 210 (13.5%).
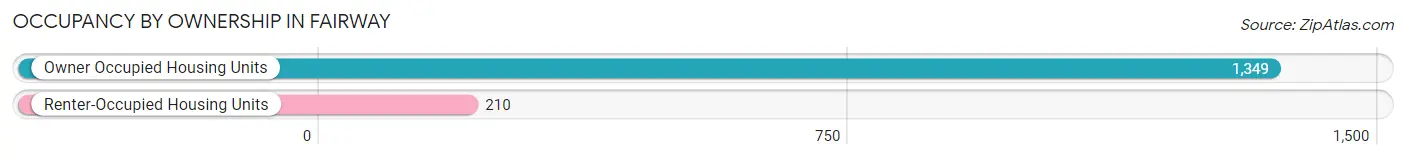
| Occupancy | # Housing Units | % Housing Units |
| Owner Occupied Housing Units | 1,349 | 86.5% |
| Renter-Occupied Housing Units | 210 | 13.5% |
| Total Occupied Housing Units | 1,559 | 100.0% |
Occupancy by Household Size in Fairway
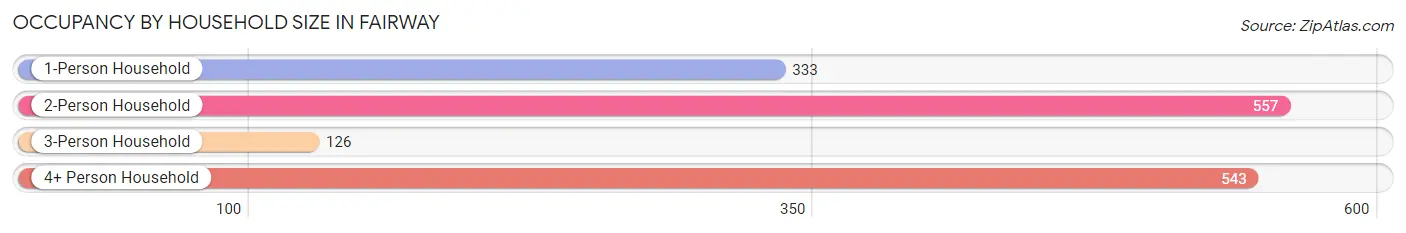
| Household Size | # Housing Units | % Housing Units |
| 1-Person Household | 333 | 21.4% |
| 2-Person Household | 557 | 35.7% |
| 3-Person Household | 126 | 8.1% |
| 4+ Person Household | 543 | 34.8% |
| Total Housing Units | 1,559 | 100.0% |
Occupancy by Ownership by Household Size in Fairway
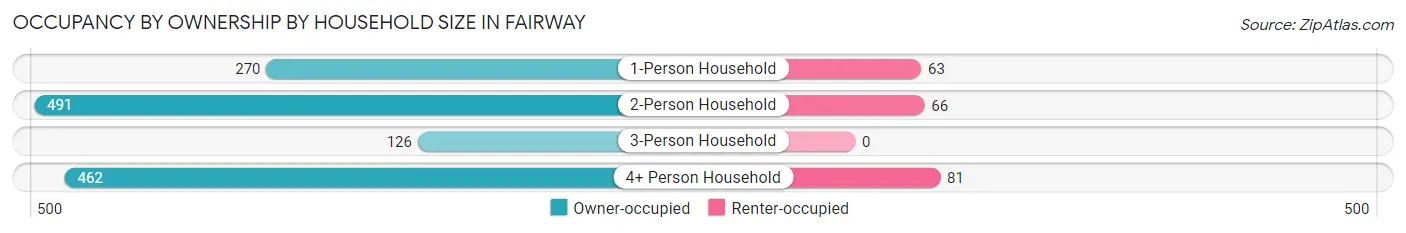
| Household Size | Owner-occupied | Renter-occupied |
| 1-Person Household | 270 (81.1%) | 63 (18.9%) |
| 2-Person Household | 491 (88.1%) | 66 (11.8%) |
| 3-Person Household | 126 (100.0%) | 0 (0.0%) |
| 4+ Person Household | 462 (85.1%) | 81 (14.9%) |
| Total Housing Units | 1,349 (86.5%) | 210 (13.5%) |
Occupancy by Educational Attainment in Fairway
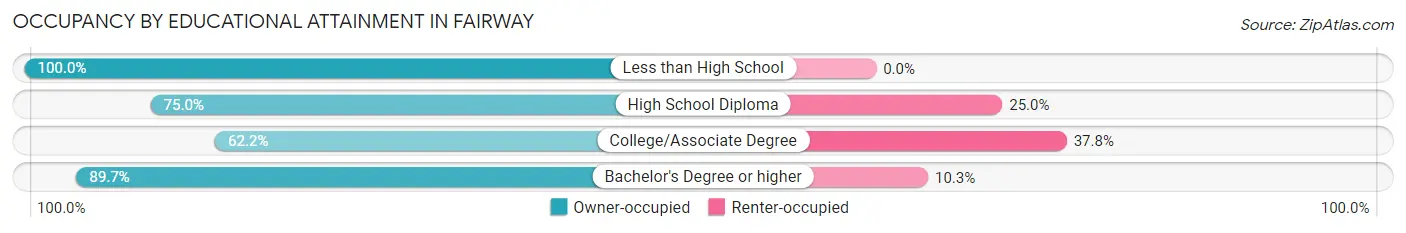
| Household Size | Owner-occupied | Renter-occupied |
| Less than High School | 9 (100.0%) | 0 (0.0%) |
| High School Diploma | 69 (75.0%) | 23 (25.0%) |
| College/Associate Degree | 84 (62.2%) | 51 (37.8%) |
| Bachelor's Degree or higher | 1,187 (89.7%) | 136 (10.3%) |
Occupancy by Age of Householder in Fairway
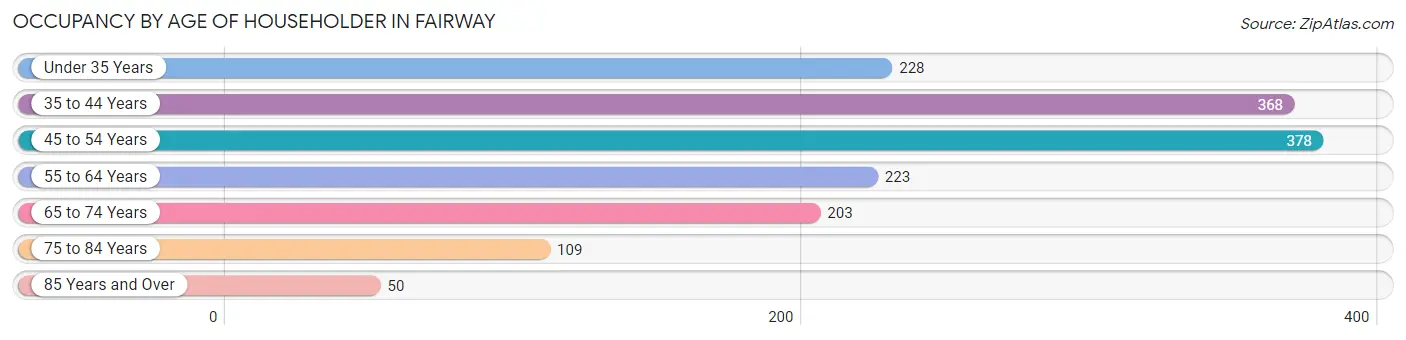
| Age Bracket | # Households | % Households |
| Under 35 Years | 228 | 14.6% |
| 35 to 44 Years | 368 | 23.6% |
| 45 to 54 Years | 378 | 24.2% |
| 55 to 64 Years | 223 | 14.3% |
| 65 to 74 Years | 203 | 13.0% |
| 75 to 84 Years | 109 | 7.0% |
| 85 Years and Over | 50 | 3.2% |
| Total | 1,559 | 100.0% |
Housing Finances in Fairway
Median Income by Occupancy in Fairway
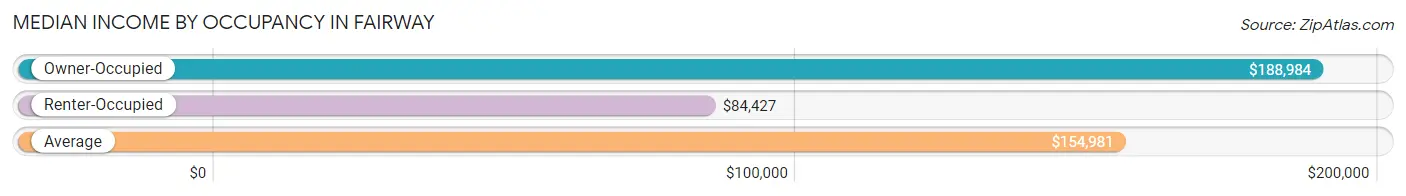
| Occupancy Type | # Households | Median Income |
| Owner-Occupied | 1,349 (86.5%) | $188,984 |
| Renter-Occupied | 210 (13.5%) | $84,427 |
| Average | 1,559 (100.0%) | $154,981 |
Occupancy by Householder Income Bracket in Fairway
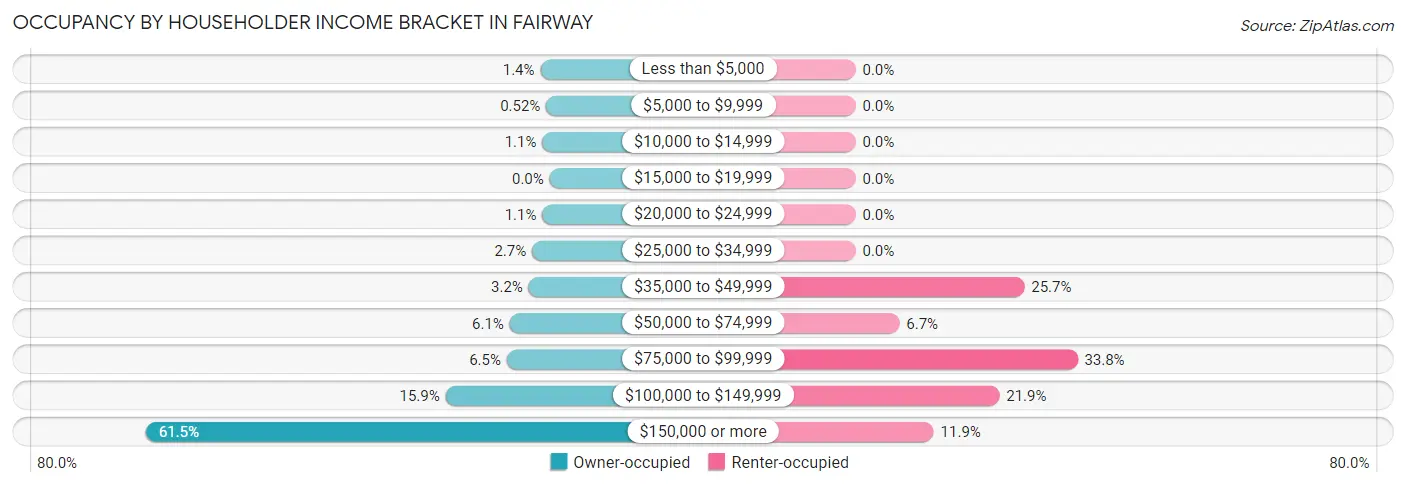
| Income Bracket | Owner-occupied | Renter-occupied |
| Less than $5,000 | 19 (1.4%) | 0 (0.0%) |
| $5,000 to $9,999 | 7 (0.5%) | 0 (0.0%) |
| $10,000 to $14,999 | 15 (1.1%) | 0 (0.0%) |
| $15,000 to $19,999 | 0 (0.0%) | 0 (0.0%) |
| $20,000 to $24,999 | 15 (1.1%) | 0 (0.0%) |
| $25,000 to $34,999 | 36 (2.7%) | 0 (0.0%) |
| $35,000 to $49,999 | 43 (3.2%) | 54 (25.7%) |
| $50,000 to $74,999 | 82 (6.1%) | 14 (6.7%) |
| $75,000 to $99,999 | 88 (6.5%) | 71 (33.8%) |
| $100,000 to $149,999 | 214 (15.9%) | 46 (21.9%) |
| $150,000 or more | 830 (61.5%) | 25 (11.9%) |
| Total | 1,349 (100.0%) | 210 (100.0%) |
Monthly Housing Cost Tiers in Fairway
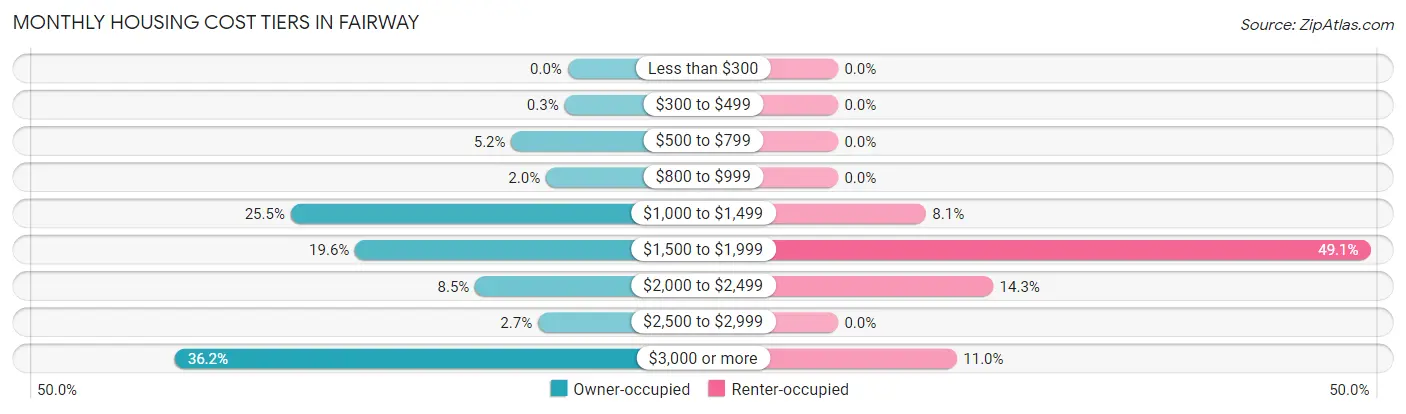
| Monthly Cost | Owner-occupied | Renter-occupied |
| Less than $300 | 0 (0.0%) | 0 (0.0%) |
| $300 to $499 | 4 (0.3%) | 0 (0.0%) |
| $500 to $799 | 70 (5.2%) | 0 (0.0%) |
| $800 to $999 | 27 (2.0%) | 0 (0.0%) |
| $1,000 to $1,499 | 344 (25.5%) | 17 (8.1%) |
| $1,500 to $1,999 | 264 (19.6%) | 103 (49.0%) |
| $2,000 to $2,499 | 115 (8.5%) | 30 (14.3%) |
| $2,500 to $2,999 | 37 (2.7%) | 0 (0.0%) |
| $3,000 or more | 488 (36.2%) | 23 (11.0%) |
| Total | 1,349 (100.0%) | 210 (100.0%) |
Physical Housing Characteristics in Fairway
Housing Structures in Fairway
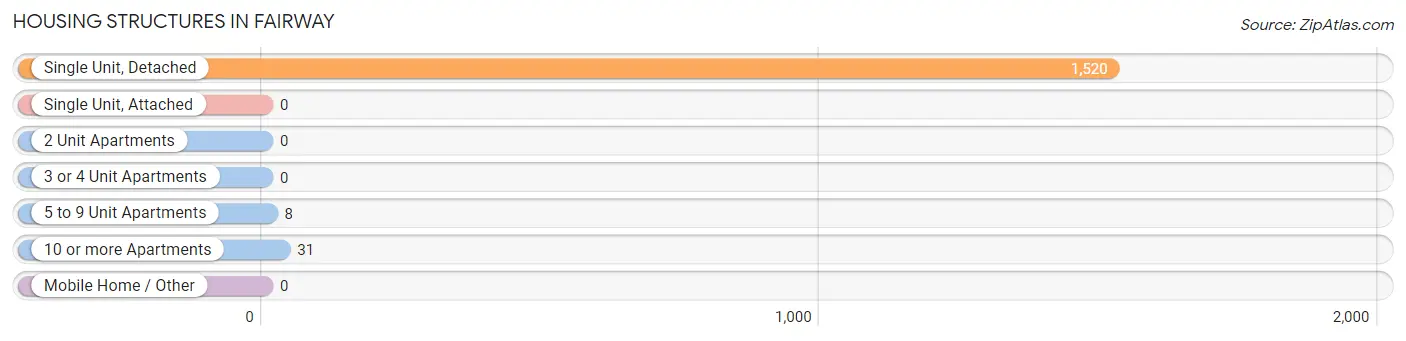
| Structure Type | # Housing Units | % Housing Units |
| Single Unit, Detached | 1,520 | 97.5% |
| Single Unit, Attached | 0 | 0.0% |
| 2 Unit Apartments | 0 | 0.0% |
| 3 or 4 Unit Apartments | 0 | 0.0% |
| 5 to 9 Unit Apartments | 8 | 0.5% |
| 10 or more Apartments | 31 | 2.0% |
| Mobile Home / Other | 0 | 0.0% |
| Total | 1,559 | 100.0% |
Housing Structures by Occupancy in Fairway
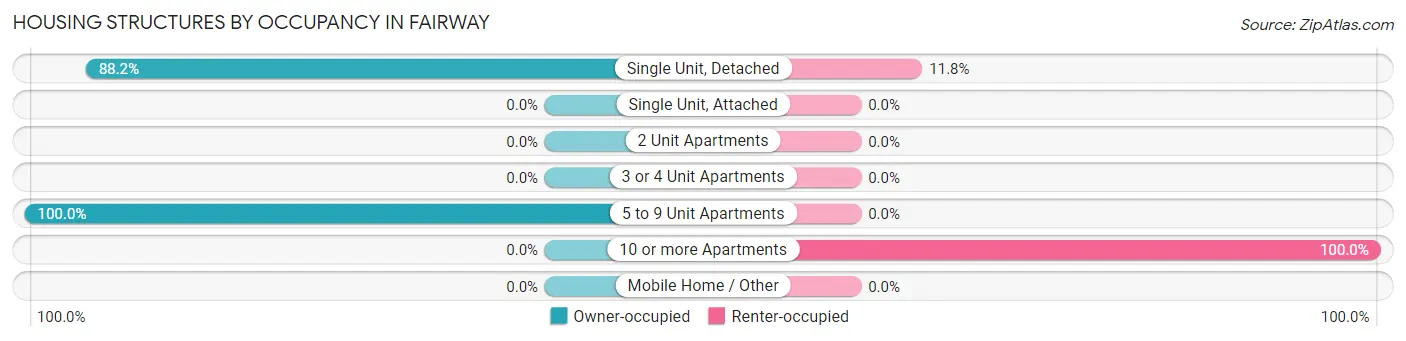
| Structure Type | Owner-occupied | Renter-occupied |
| Single Unit, Detached | 1,341 (88.2%) | 179 (11.8%) |
| Single Unit, Attached | 0 (0.0%) | 0 (0.0%) |
| 2 Unit Apartments | 0 (0.0%) | 0 (0.0%) |
| 3 or 4 Unit Apartments | 0 (0.0%) | 0 (0.0%) |
| 5 to 9 Unit Apartments | 8 (100.0%) | 0 (0.0%) |
| 10 or more Apartments | 0 (0.0%) | 31 (100.0%) |
| Mobile Home / Other | 0 (0.0%) | 0 (0.0%) |
| Total | 1,349 (86.5%) | 210 (13.5%) |
Housing Structures by Number of Rooms in Fairway
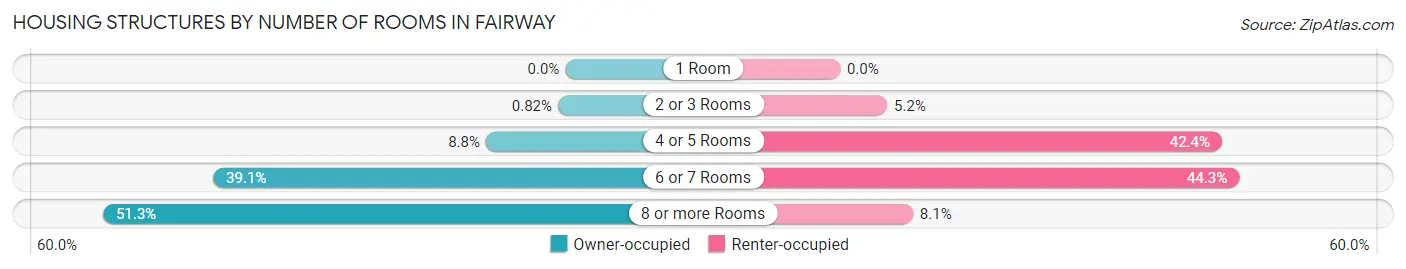
| Number of Rooms | Owner-occupied | Renter-occupied |
| 1 Room | 0 (0.0%) | 0 (0.0%) |
| 2 or 3 Rooms | 11 (0.8%) | 11 (5.2%) |
| 4 or 5 Rooms | 119 (8.8%) | 89 (42.4%) |
| 6 or 7 Rooms | 527 (39.1%) | 93 (44.3%) |
| 8 or more Rooms | 692 (51.3%) | 17 (8.1%) |
| Total | 1,349 (100.0%) | 210 (100.0%) |
Housing Structure by Heating Type in Fairway
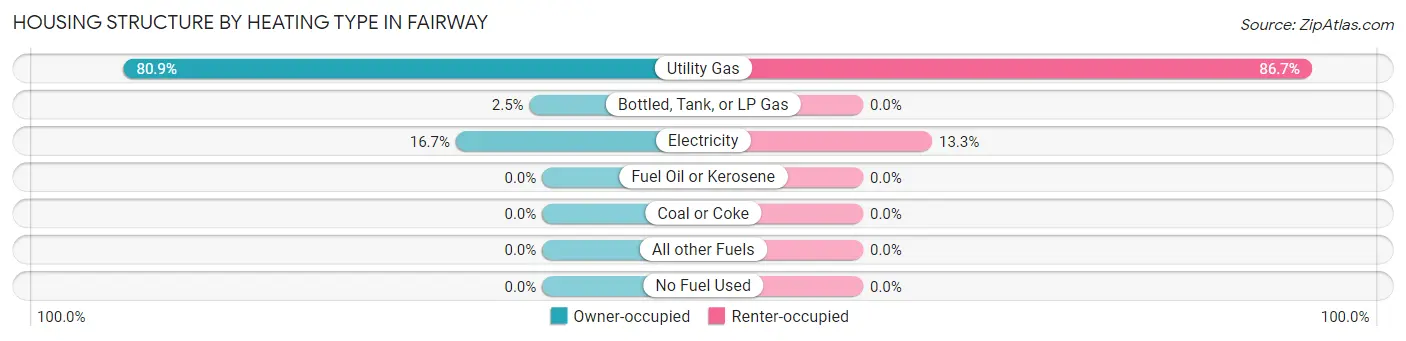
| Heating Type | Owner-occupied | Renter-occupied |
| Utility Gas | 1,091 (80.9%) | 182 (86.7%) |
| Bottled, Tank, or LP Gas | 33 (2.5%) | 0 (0.0%) |
| Electricity | 225 (16.7%) | 28 (13.3%) |
| Fuel Oil or Kerosene | 0 (0.0%) | 0 (0.0%) |
| Coal or Coke | 0 (0.0%) | 0 (0.0%) |
| All other Fuels | 0 (0.0%) | 0 (0.0%) |
| No Fuel Used | 0 (0.0%) | 0 (0.0%) |
| Total | 1,349 (100.0%) | 210 (100.0%) |
Household Vehicle Usage in Fairway
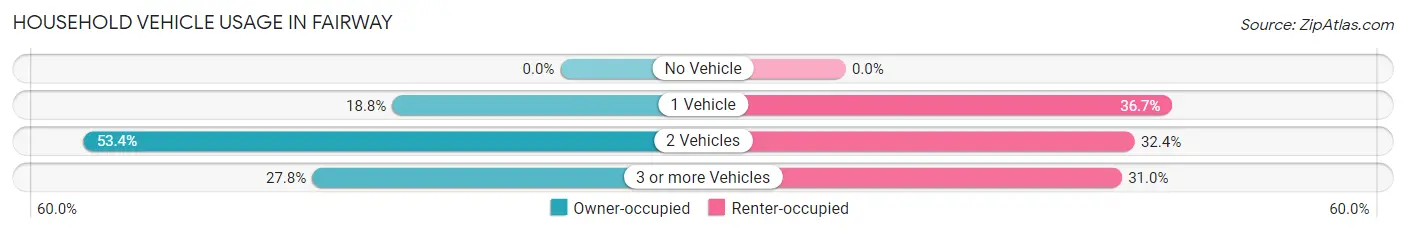
| Vehicles per Household | Owner-occupied | Renter-occupied |
| No Vehicle | 0 (0.0%) | 0 (0.0%) |
| 1 Vehicle | 254 (18.8%) | 77 (36.7%) |
| 2 Vehicles | 720 (53.4%) | 68 (32.4%) |
| 3 or more Vehicles | 375 (27.8%) | 65 (30.9%) |
| Total | 1,349 (100.0%) | 210 (100.0%) |
Real Estate & Mortgages in Fairway
Real Estate and Mortgage Overview in Fairway
| Characteristic | Without Mortgage | With Mortgage |
| Housing Units | 372 | 977 |
| Median Property Value | $555,600 | $568,300 |
| Median Household Income | - | - |
| Monthly Housing Costs | $1,257 | $478 |
| Real Estate Taxes | $7,675 | $0 |
Property Value by Mortgage Status in Fairway
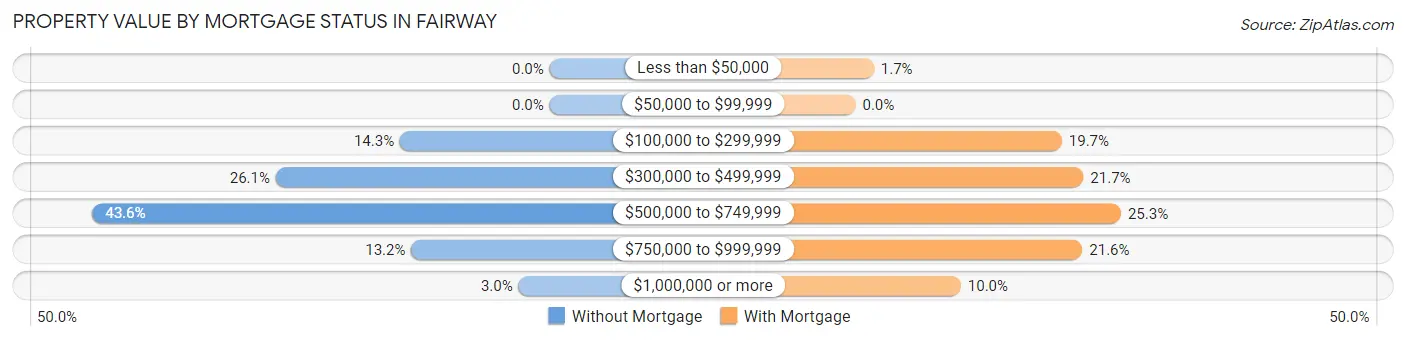
| Property Value | Without Mortgage | With Mortgage |
| Less than $50,000 | 0 (0.0%) | 17 (1.7%) |
| $50,000 to $99,999 | 0 (0.0%) | 0 (0.0%) |
| $100,000 to $299,999 | 53 (14.2%) | 192 (19.7%) |
| $300,000 to $499,999 | 97 (26.1%) | 212 (21.7%) |
| $500,000 to $749,999 | 162 (43.5%) | 247 (25.3%) |
| $750,000 to $999,999 | 49 (13.2%) | 211 (21.6%) |
| $1,000,000 or more | 11 (3.0%) | 98 (10.0%) |
| Total | 372 (100.0%) | 977 (100.0%) |
Household Income by Mortgage Status in Fairway
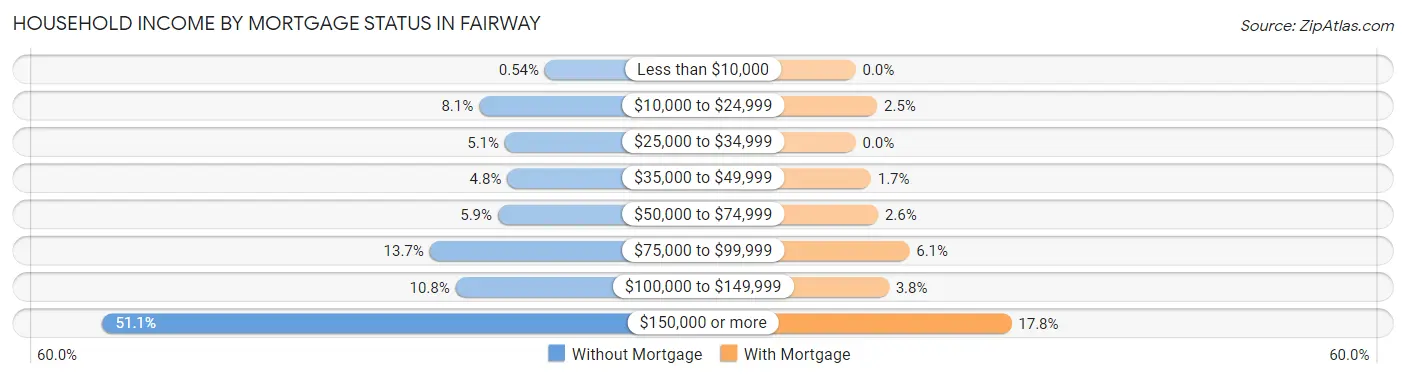
| Household Income | Without Mortgage | With Mortgage |
| Less than $10,000 | 2 (0.5%) | 0 (0.0%) |
| $10,000 to $24,999 | 30 (8.1%) | 24 (2.5%) |
| $25,000 to $34,999 | 19 (5.1%) | 0 (0.0%) |
| $35,000 to $49,999 | 18 (4.8%) | 17 (1.7%) |
| $50,000 to $74,999 | 22 (5.9%) | 25 (2.6%) |
| $75,000 to $99,999 | 51 (13.7%) | 60 (6.1%) |
| $100,000 to $149,999 | 40 (10.7%) | 37 (3.8%) |
| $150,000 or more | 190 (51.1%) | 174 (17.8%) |
| Total | 372 (100.0%) | 977 (100.0%) |
Property Value to Household Income Ratio in Fairway
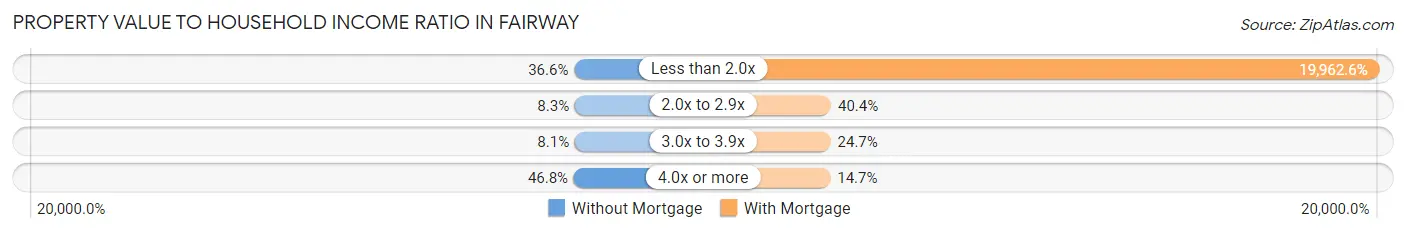
| Value-to-Income Ratio | Without Mortgage | With Mortgage |
| Less than 2.0x | 136 (36.6%) | 195,035 (19,962.6%) |
| 2.0x to 2.9x | 31 (8.3%) | 395 (40.4%) |
| 3.0x to 3.9x | 30 (8.1%) | 241 (24.7%) |
| 4.0x or more | 174 (46.8%) | 144 (14.7%) |
| Total | 372 (100.0%) | 977 (100.0%) |
Real Estate Taxes by Mortgage Status in Fairway
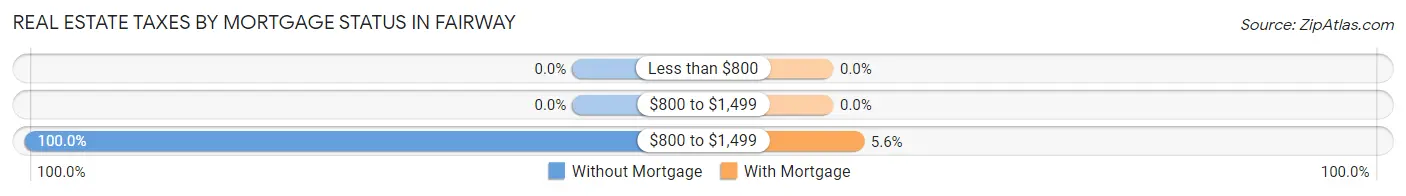
| Property Taxes | Without Mortgage | With Mortgage |
| Less than $800 | 0 (0.0%) | 0 (0.0%) |
| $800 to $1,499 | 0 (0.0%) | 0 (0.0%) |
| $800 to $1,499 | 372 (100.0%) | 55 (5.6%) |
| Total | 372 (100.0%) | 977 (100.0%) |
Health & Disability in Fairway
Health Insurance Coverage by Age in Fairway
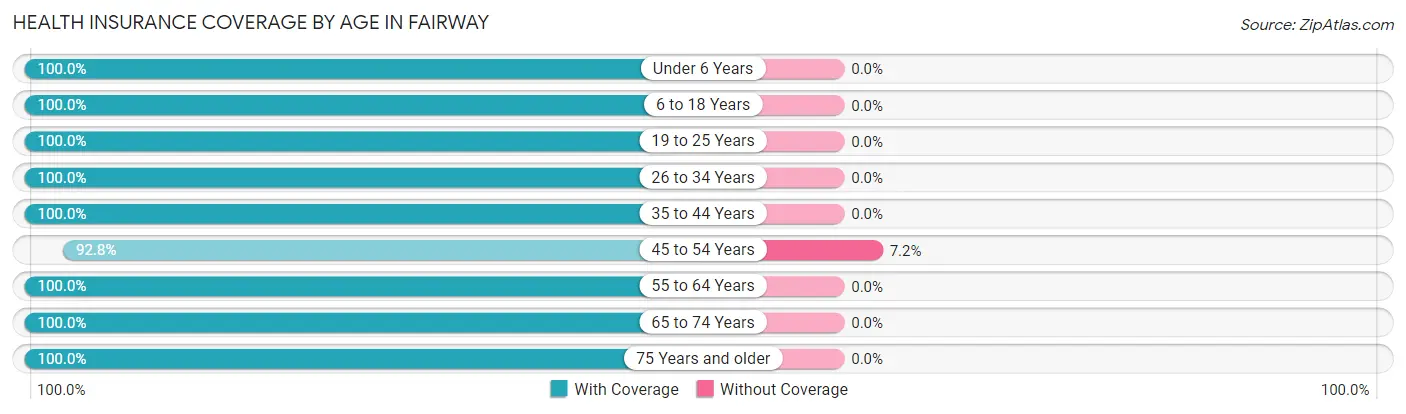
| Age Bracket | With Coverage | Without Coverage |
| Under 6 Years | 291 (100.0%) | 0 (0.0%) |
| 6 to 18 Years | 773 (100.0%) | 0 (0.0%) |
| 19 to 25 Years | 379 (100.0%) | 0 (0.0%) |
| 26 to 34 Years | 371 (100.0%) | 0 (0.0%) |
| 35 to 44 Years | 701 (100.0%) | 0 (0.0%) |
| 45 to 54 Years | 570 (92.8%) | 44 (7.2%) |
| 55 to 64 Years | 472 (100.0%) | 0 (0.0%) |
| 65 to 74 Years | 331 (100.0%) | 0 (0.0%) |
| 75 Years and older | 230 (100.0%) | 0 (0.0%) |
| Total | 4,118 (98.9%) | 44 (1.1%) |
Health Insurance Coverage by Citizenship Status in Fairway
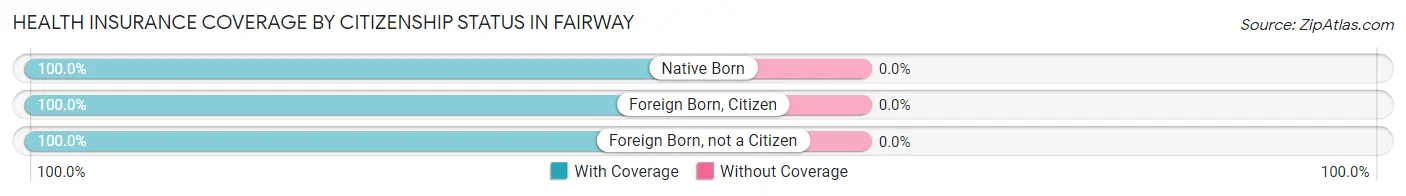
| Citizenship Status | With Coverage | Without Coverage |
| Native Born | 291 (100.0%) | 0 (0.0%) |
| Foreign Born, Citizen | 773 (100.0%) | 0 (0.0%) |
| Foreign Born, not a Citizen | 379 (100.0%) | 0 (0.0%) |
Health Insurance Coverage by Household Income in Fairway
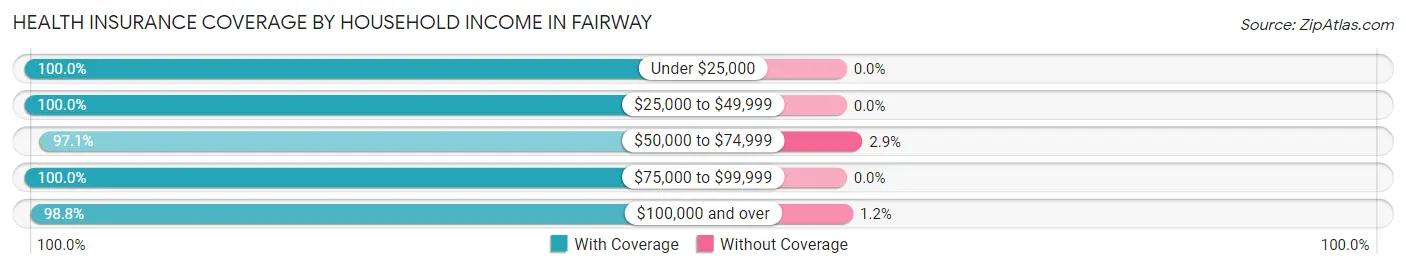
| Household Income | With Coverage | Without Coverage |
| Under $25,000 | 89 (100.0%) | 0 (0.0%) |
| $25,000 to $49,999 | 223 (100.0%) | 0 (0.0%) |
| $50,000 to $74,999 | 166 (97.1%) | 5 (2.9%) |
| $75,000 to $99,999 | 360 (100.0%) | 0 (0.0%) |
| $100,000 and over | 3,272 (98.8%) | 39 (1.2%) |
Public vs Private Health Insurance Coverage by Age in Fairway
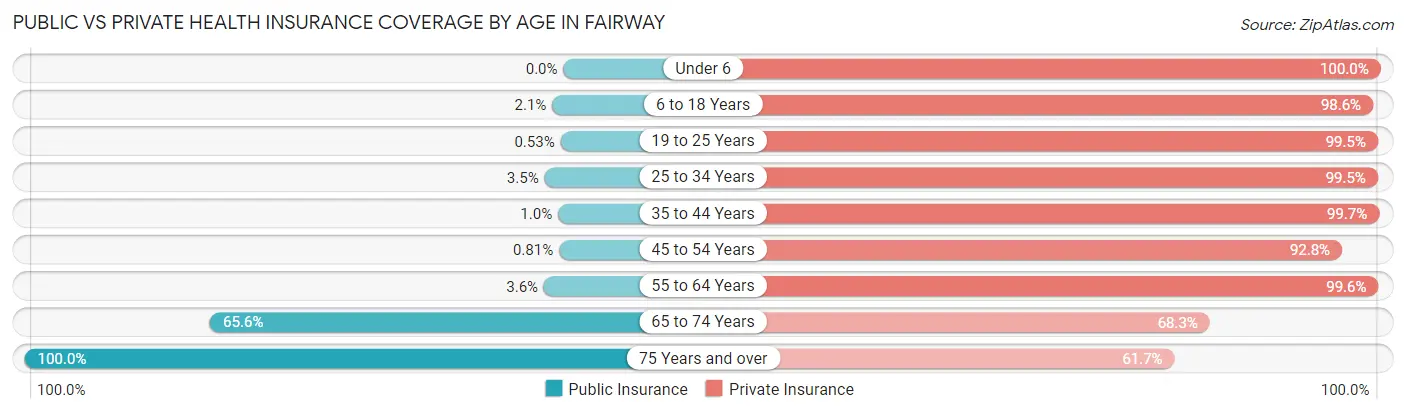
| Age Bracket | Public Insurance | Private Insurance |
| Under 6 | 0 (0.0%) | 291 (100.0%) |
| 6 to 18 Years | 16 (2.1%) | 762 (98.6%) |
| 19 to 25 Years | 2 (0.5%) | 377 (99.5%) |
| 25 to 34 Years | 13 (3.5%) | 369 (99.5%) |
| 35 to 44 Years | 7 (1.0%) | 699 (99.7%) |
| 45 to 54 Years | 5 (0.8%) | 570 (92.8%) |
| 55 to 64 Years | 17 (3.6%) | 470 (99.6%) |
| 65 to 74 Years | 217 (65.6%) | 226 (68.3%) |
| 75 Years and over | 230 (100.0%) | 142 (61.7%) |
| Total | 507 (12.2%) | 3,906 (93.9%) |
Disability Status by Sex by Age in Fairway
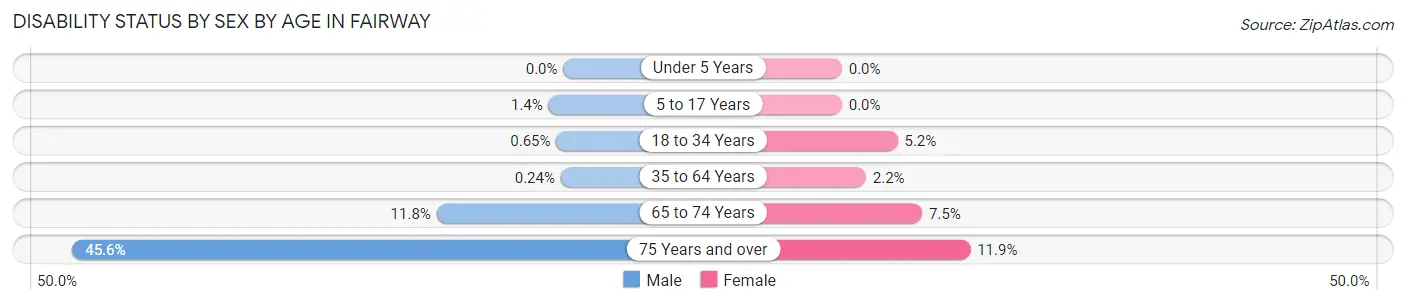
| Age Bracket | Male | Female |
| Under 5 Years | 0 (0.0%) | 0 (0.0%) |
| 5 to 17 Years | 5 (1.4%) | 0 (0.0%) |
| 18 to 34 Years | 2 (0.6%) | 24 (5.2%) |
| 35 to 64 Years | 2 (0.2%) | 21 (2.2%) |
| 65 to 74 Years | 20 (11.8%) | 12 (7.4%) |
| 75 Years and over | 36 (45.6%) | 18 (11.9%) |
Disability Class by Sex by Age in Fairway
Disability Class: Hearing Difficulty
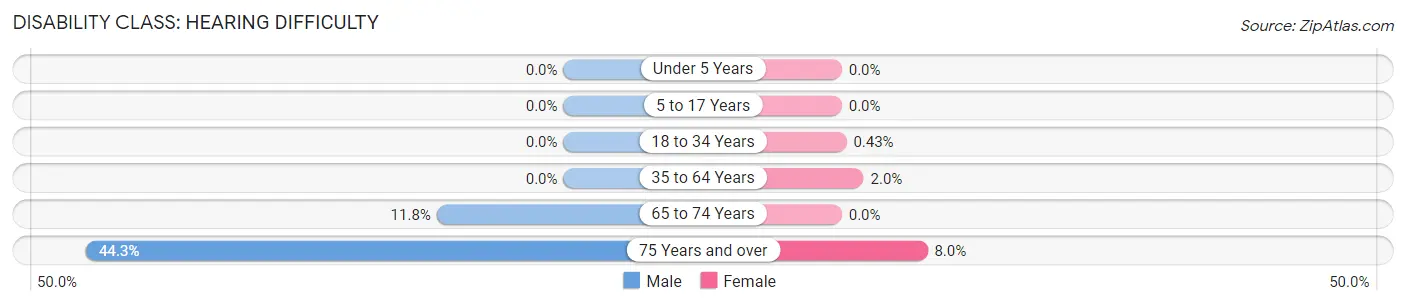
| Age Bracket | Male | Female |
| Under 5 Years | 0 (0.0%) | 0 (0.0%) |
| 5 to 17 Years | 0 (0.0%) | 0 (0.0%) |
| 18 to 34 Years | 0 (0.0%) | 2 (0.4%) |
| 35 to 64 Years | 0 (0.0%) | 19 (2.0%) |
| 65 to 74 Years | 20 (11.8%) | 0 (0.0%) |
| 75 Years and over | 35 (44.3%) | 12 (8.0%) |
Disability Class: Vision Difficulty
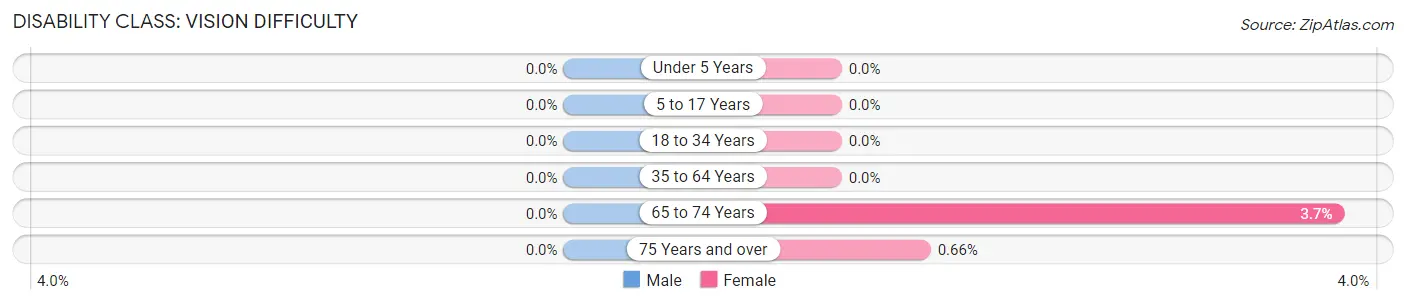
| Age Bracket | Male | Female |
| Under 5 Years | 0 (0.0%) | 0 (0.0%) |
| 5 to 17 Years | 0 (0.0%) | 0 (0.0%) |
| 18 to 34 Years | 0 (0.0%) | 0 (0.0%) |
| 35 to 64 Years | 0 (0.0%) | 0 (0.0%) |
| 65 to 74 Years | 0 (0.0%) | 6 (3.7%) |
| 75 Years and over | 0 (0.0%) | 1 (0.7%) |
Disability Class: Cognitive Difficulty
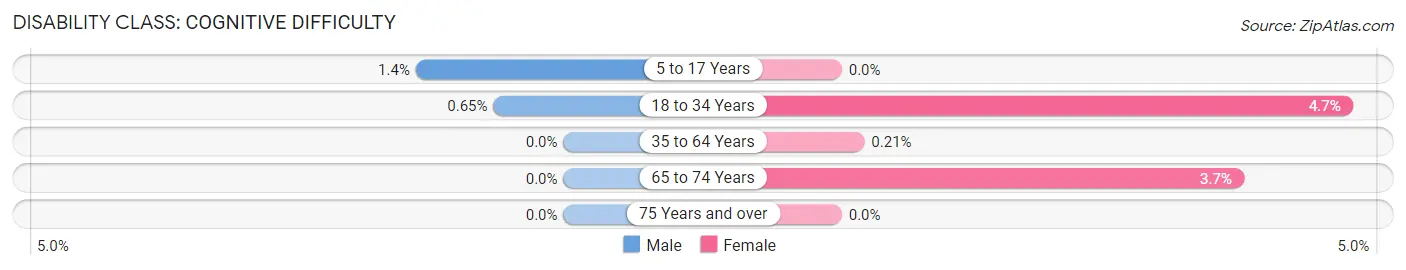
| Age Bracket | Male | Female |
| 5 to 17 Years | 5 (1.4%) | 0 (0.0%) |
| 18 to 34 Years | 2 (0.6%) | 22 (4.7%) |
| 35 to 64 Years | 0 (0.0%) | 2 (0.2%) |
| 65 to 74 Years | 0 (0.0%) | 6 (3.7%) |
| 75 Years and over | 0 (0.0%) | 0 (0.0%) |
Disability Class: Ambulatory Difficulty
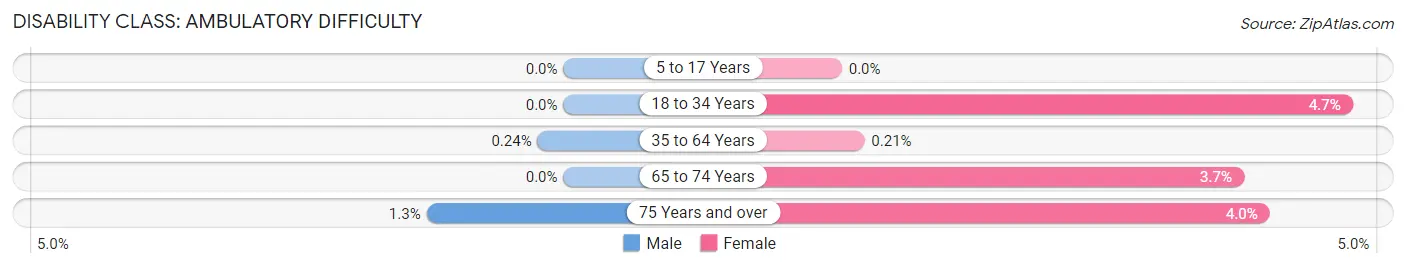
| Age Bracket | Male | Female |
| 5 to 17 Years | 0 (0.0%) | 0 (0.0%) |
| 18 to 34 Years | 0 (0.0%) | 22 (4.7%) |
| 35 to 64 Years | 2 (0.2%) | 2 (0.2%) |
| 65 to 74 Years | 0 (0.0%) | 6 (3.7%) |
| 75 Years and over | 1 (1.3%) | 6 (4.0%) |
Disability Class: Self-Care Difficulty
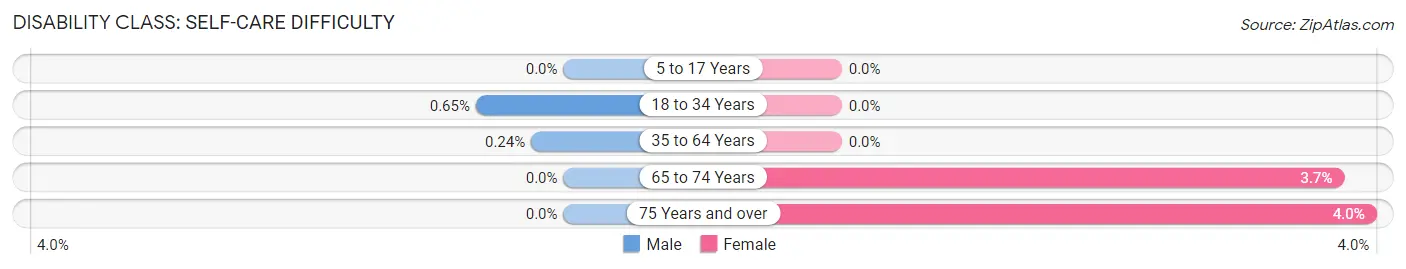
| Age Bracket | Male | Female |
| 5 to 17 Years | 0 (0.0%) | 0 (0.0%) |
| 18 to 34 Years | 2 (0.6%) | 0 (0.0%) |
| 35 to 64 Years | 2 (0.2%) | 0 (0.0%) |
| 65 to 74 Years | 0 (0.0%) | 6 (3.7%) |
| 75 Years and over | 0 (0.0%) | 6 (4.0%) |
Technology Access in Fairway
Computing Device Access in Fairway
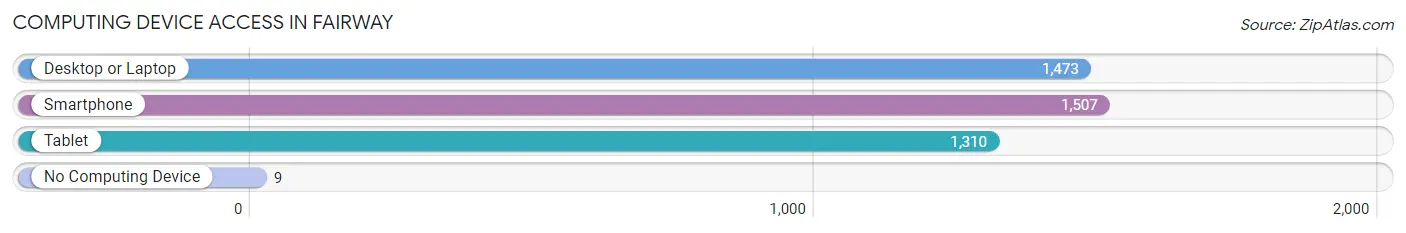
| Device Type | # Households | % Households |
| Desktop or Laptop | 1,473 | 94.5% |
| Smartphone | 1,507 | 96.7% |
| Tablet | 1,310 | 84.0% |
| No Computing Device | 9 | 0.6% |
| Total | 1,559 | 100.0% |
Internet Access in Fairway
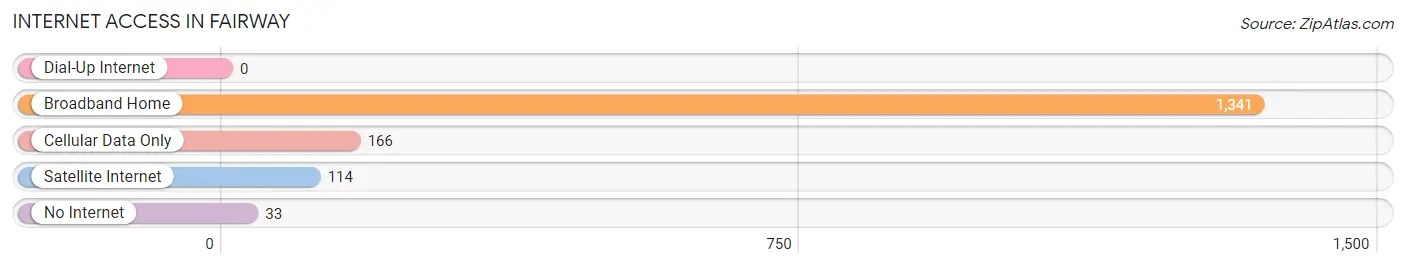
| Internet Type | # Households | % Households |
| Dial-Up Internet | 0 | 0.0% |
| Broadband Home | 1,341 | 86.0% |
| Cellular Data Only | 166 | 10.6% |
| Satellite Internet | 114 | 7.3% |
| No Internet | 33 | 2.1% |
| Total | 1,559 | 100.0% |
Fairway Summary
Fairway, Kansas is a small city located in Johnson County, Kansas, United States. It is part of the Kansas City metropolitan area and is located just south of the Missouri border. The city was founded in the late 19th century and has a population of around 3,000 people.
Geography
Fairway is located at 39°02'00" North, 94°35'00" West (39.033333, -94.583333). It is situated on the south bank of the Kansas River, just south of the Missouri border. The city has a total area of 1.2 square miles, all of which is land.
Climate
Fairway has a humid continental climate, with hot summers and cold winters. The average annual temperature is around 54°F, with an average high of around 86°F in the summer and an average low of around 32°F in the winter. The average annual precipitation is around 37 inches.
Demographics
As of the 2010 census, there were 3,082 people, 1,093 households, and 817 families residing in the city. The population density was 2,567.2 people per square mile. The racial makeup of the city was 87.3% White, 5.2% African American, 0.3% Native American, 2.2% Asian, 0.1% Pacific Islander, 1.7% from other races, and 3.3% from two or more races. Hispanic or Latino of any race were 5.2% of the population.
Economy
Fairway is a small city with a diverse economy. The city is home to a variety of businesses, including retail stores, restaurants, and professional services. The city is also home to several corporate headquarters, including the headquarters of the Kansas City Chiefs football team. The city is also home to several educational institutions, including the University of Kansas Medical Center and the University of Missouri-Kansas City.
The city's economy is largely driven by the service sector, which accounts for around 70% of the city's total employment. The city is also home to several manufacturing companies, including the Johnson County Manufacturing Company, which produces a variety of products, including automotive parts and medical equipment.
Conclusion
Fairway, Kansas is a small city located in Johnson County, Kansas, United States. It is part of the Kansas City metropolitan area and is located just south of the Missouri border. The city was founded in the late 19th century and has a population of around 3,000 people. The city has a humid continental climate, with hot summers and cold winters. The city's economy is largely driven by the service sector, which accounts for around 70% of the city's total employment. The city is also home to several corporate headquarters, educational institutions, and manufacturing companies.
Common Questions
What is the Total Population of Fairway?
Total Population of Fairway is 4,162.
What is the Total Male Population of Fairway?
Total Male Population of Fairway is 1,832.
What is the Total Female Population of Fairway?
Total Female Population of Fairway is 2,330.
What is the Ratio of Males per 100 Females in Fairway?
There are 78.63 Males per 100 Females in Fairway.
What is the Ratio of Females per 100 Males in Fairway?
There are 127.18 Females per 100 Males in Fairway.
What is the Median Population Age in Fairway?
Median Population Age in Fairway is 37.9 Years.
What is the Average Family Size in Fairway
Average Family Size in Fairway is 3.2 People.
What is the Average Household Size in Fairway
Average Household Size in Fairway is 2.7 People.
What is Per Capita Income in Fairway?
Per Capita income in Fairway is $97,722.
What is the Median Family Income in Fairway?
Median Family Income in Fairway is $223,690.
What is the Median Household income in Fairway?
Median Household Income in Fairway is $154,981.
What is Income or Wage Gap in Fairway?
Income or Wage Gap in Fairway is 33.3%.
Women in Fairway earn 66.7 cents for every dollar earned by a man.
What is Family Income Deficit in Fairway?
Family Income Deficit in Fairway is $10,646.
Families that are below poverty line in Fairway earn $10,646 less on average than the poverty threshold level.
What is Inequality or Gini Index in Fairway?
Inequality or Gini Index in Fairway is 0.48.
How Large is the Labor Force in Fairway?
There are 2,297 People in the Labor Forcein in Fairway.
What is the Percentage of People in the Labor Force in Fairway?
71.6% of People are in the Labor Force in Fairway.
What is the Unemployment Rate in Fairway?
Unemployment Rate in Fairway is 0.7%.