Castle Dale, UT
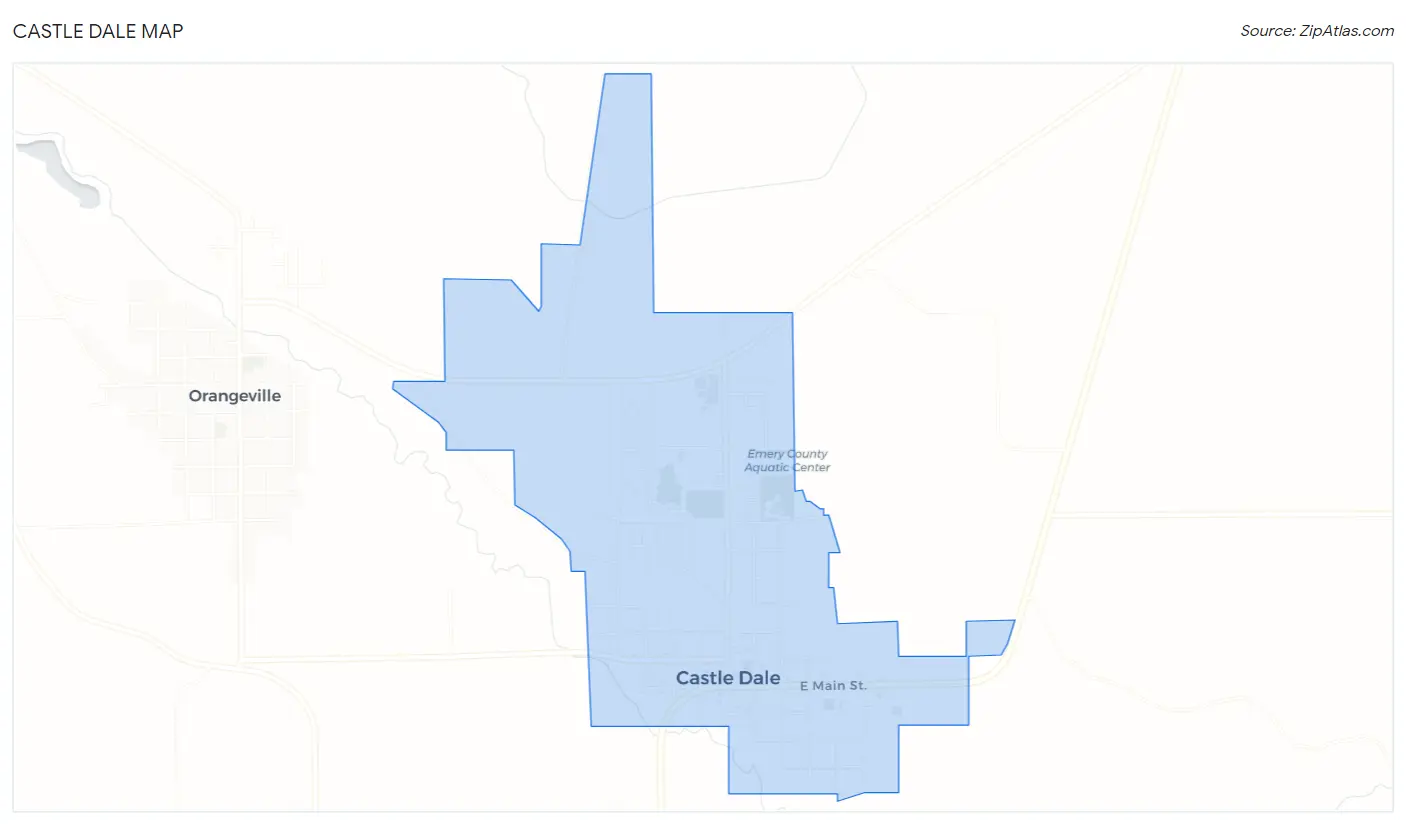
Castle Dale Map
Castle Dale Overview
1,347
TOTAL POPULATION
701
MALE POPULATION
646
FEMALE POPULATION
108.51
MALES / 100 FEMALES
92.15
FEMALES / 100 MALES
36.4
MEDIAN AGE
3.5
AVG FAMILY SIZE
2.9
AVG HOUSEHOLD SIZE
$25,690
PER CAPITA INCOME
$64,712
AVG FAMILY INCOME
$62,500
AVG HOUSEHOLD INCOME
74.9%
WAGE / INCOME GAP [ % ]
25.1¢/ $1
WAGE / INCOME GAP [ $ ]
$8,656
FAMILY INCOME DEFICIT
0.34
INEQUALITY / GINI INDEX
435
LABOR FORCE [ PEOPLE ]
45.0%
PERCENT IN LABOR FORCE
3.9%
UNEMPLOYMENT RATE
Castle Dale Zip Codes
Castle Dale Area Codes
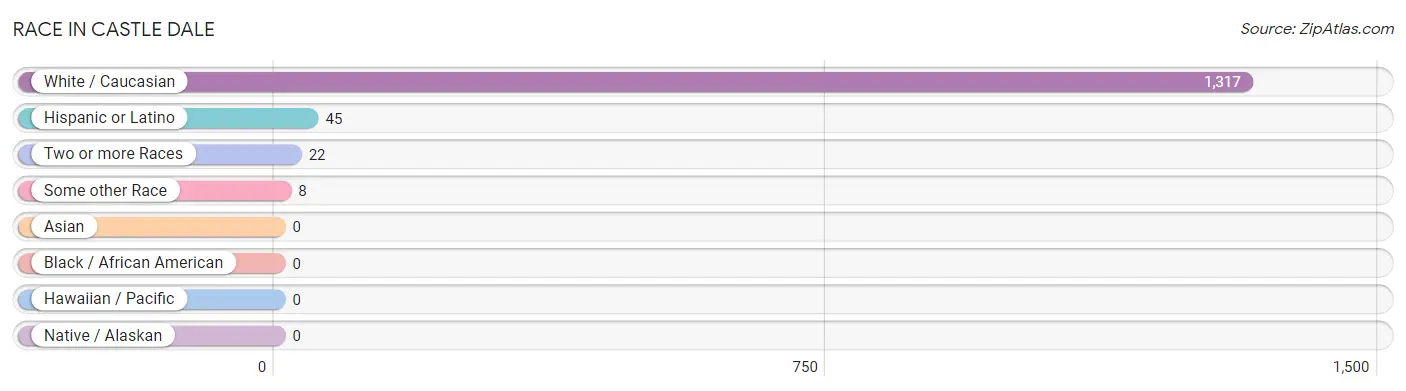
Race in Castle Dale
The most populous races in Castle Dale are White / Caucasian (1,317 | 97.8%), Hispanic or Latino (45 | 3.3%), and Two or more Races (22 | 1.6%).
| Race | # Population | % Population |
| Asian | 0 | 0.0% |
| Black / African American | 0 | 0.0% |
| Hawaiian / Pacific | 0 | 0.0% |
| Hispanic or Latino | 45 | 3.3% |
| Native / Alaskan | 0 | 0.0% |
| White / Caucasian | 1,317 | 97.8% |
| Two or more Races | 22 | 1.6% |
| Some other Race | 8 | 0.6% |
| Total | 1,347 | 100.0% |
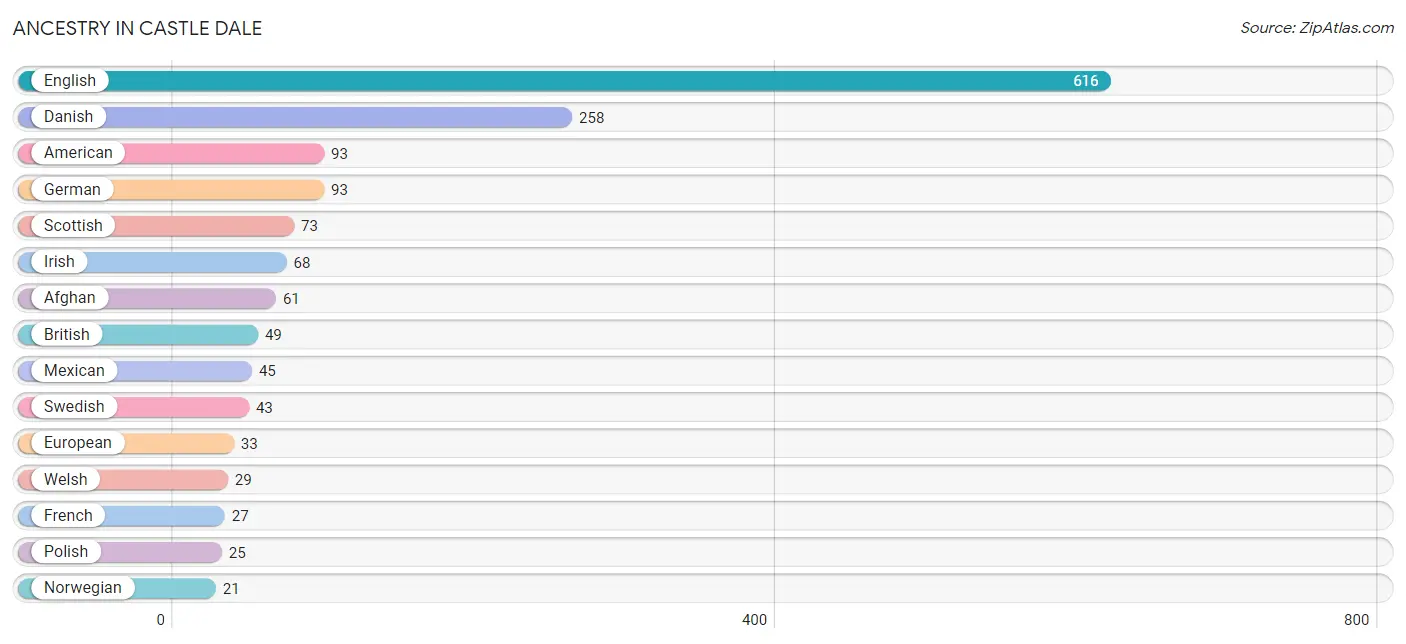
Ancestry in Castle Dale
The most populous ancestries reported in Castle Dale are English (616 | 45.7%), Danish (258 | 19.2%), American (93 | 6.9%), German (93 | 6.9%), and Scottish (73 | 5.4%), together accounting for 84.1% of all Castle Dale residents.
| Ancestry | # Population | % Population |
| Afghan | 61 | 4.5% |
| American | 93 | 6.9% |
| British | 49 | 3.6% |
| Danish | 258 | 19.2% |
| Dutch | 17 | 1.3% |
| English | 616 | 45.7% |
| European | 33 | 2.5% |
| French | 27 | 2.0% |
| German | 93 | 6.9% |
| Irish | 68 | 5.1% |
| Italian | 11 | 0.8% |
| Mexican | 45 | 3.3% |
| Norwegian | 21 | 1.6% |
| Polish | 25 | 1.9% |
| Russian | 5 | 0.4% |
| Scotch-Irish | 9 | 0.7% |
| Scottish | 73 | 5.4% |
| Swedish | 43 | 3.2% |
| Swiss | 6 | 0.4% |
| Welsh | 29 | 2.1% | View All 20 Rows |
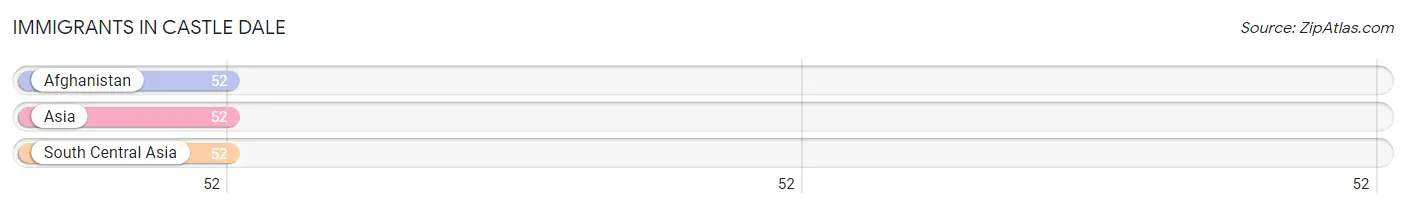
Immigrants in Castle Dale
The most numerous immigrant groups reported in Castle Dale came from Afghanistan (52 | 3.9%), Asia (52 | 3.9%), and South Central Asia (52 | 3.9%), together accounting for 11.6% of all Castle Dale residents.
| Immigration Origin | # Population | % Population |
| Afghanistan | 52 | 3.9% |
| Asia | 52 | 3.9% |
| South Central Asia | 52 | 3.9% | View All 3 Rows |
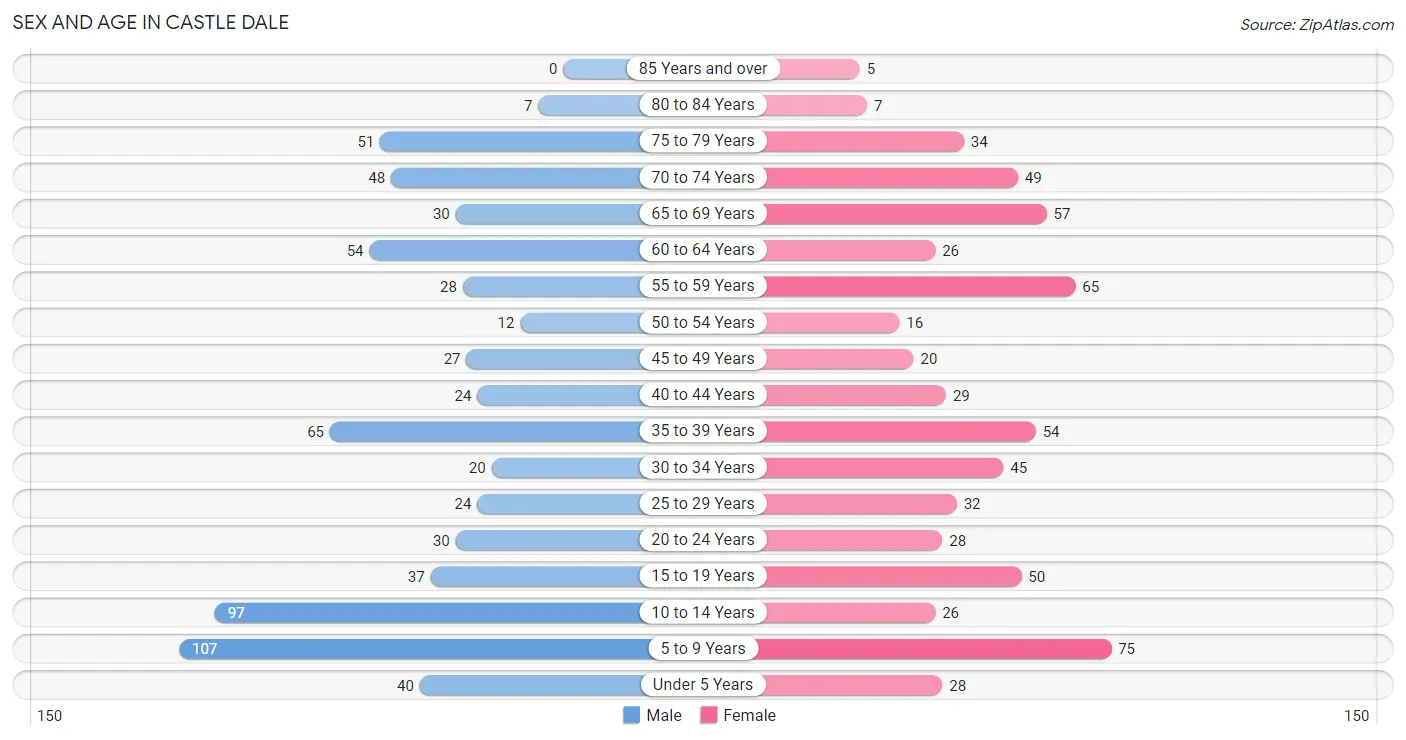
Sex and Age in Castle Dale
Sex and Age in Castle Dale
The most populous age groups in Castle Dale are 5 to 9 Years (107 | 15.3%) for men and 5 to 9 Years (75 | 11.6%) for women.
| Age Bracket | Male | Female |
| Under 5 Years | 40 (5.7%) | 28 (4.3%) |
| 5 to 9 Years | 107 (15.3%) | 75 (11.6%) |
| 10 to 14 Years | 97 (13.8%) | 26 (4.0%) |
| 15 to 19 Years | 37 (5.3%) | 50 (7.7%) |
| 20 to 24 Years | 30 (4.3%) | 28 (4.3%) |
| 25 to 29 Years | 24 (3.4%) | 32 (5.0%) |
| 30 to 34 Years | 20 (2.9%) | 45 (7.0%) |
| 35 to 39 Years | 65 (9.3%) | 54 (8.4%) |
| 40 to 44 Years | 24 (3.4%) | 29 (4.5%) |
| 45 to 49 Years | 27 (3.8%) | 20 (3.1%) |
| 50 to 54 Years | 12 (1.7%) | 16 (2.5%) |
| 55 to 59 Years | 28 (4.0%) | 65 (10.1%) |
| 60 to 64 Years | 54 (7.7%) | 26 (4.0%) |
| 65 to 69 Years | 30 (4.3%) | 57 (8.8%) |
| 70 to 74 Years | 48 (6.9%) | 49 (7.6%) |
| 75 to 79 Years | 51 (7.3%) | 34 (5.3%) |
| 80 to 84 Years | 7 (1.0%) | 7 (1.1%) |
| 85 Years and over | 0 (0.0%) | 5 (0.8%) |
| Total | 701 (100.0%) | 646 (100.0%) |
Families and Households in Castle Dale
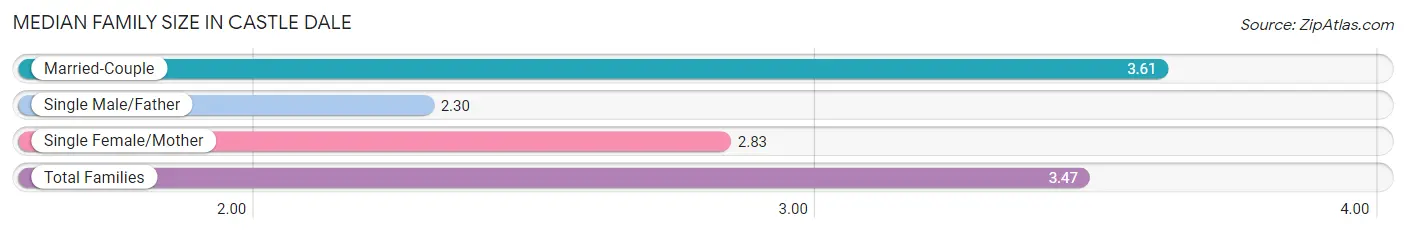
Median Family Size in Castle Dale
The median family size in Castle Dale is 3.47 persons per family, with married-couple families (300 | 86.0%) accounting for the largest median family size of 3.61 persons per family. On the other hand, single male/father families (20 | 5.7%) represent the smallest median family size with 2.30 persons per family.
| Family Type | # Families | Family Size |
| Married-Couple | 300 (86.0%) | 3.61 |
| Single Male/Father | 20 (5.7%) | 2.30 |
| Single Female/Mother | 29 (8.3%) | 2.83 |
| Total Families | 349 (100.0%) | 3.47 |
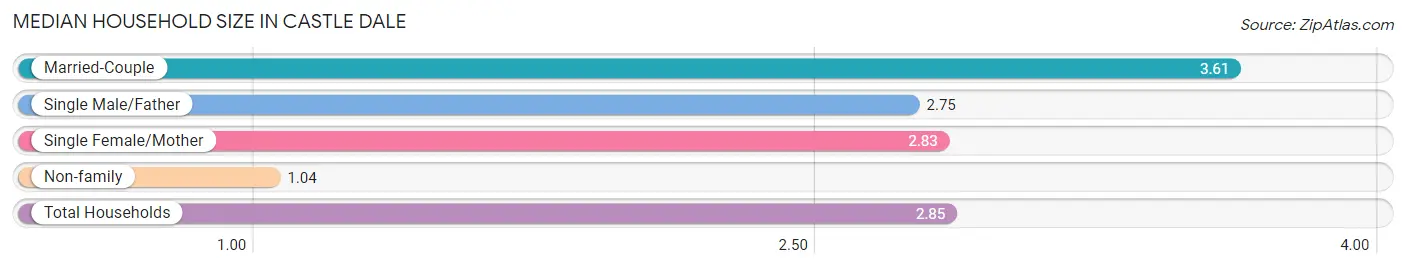
Median Household Size in Castle Dale
The median household size in Castle Dale is 2.85 persons per household, with married-couple households (300 | 63.6%) accounting for the largest median household size of 3.61 persons per household. non-family households (123 | 26.1%) represent the smallest median household size with 1.04 persons per household.
| Household Type | # Households | Household Size |
| Married-Couple | 300 (63.6%) | 3.61 |
| Single Male/Father | 20 (4.2%) | 2.75 |
| Single Female/Mother | 29 (6.1%) | 2.83 |
| Non-family | 123 (26.1%) | 1.04 |
| Total Households | 472 (100.0%) | 2.85 |
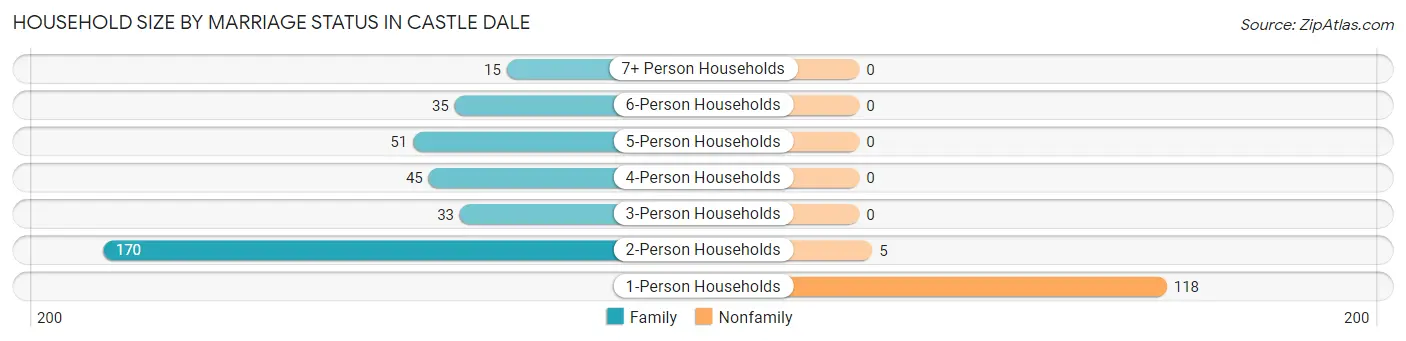
Household Size by Marriage Status in Castle Dale
Out of a total of 472 households in Castle Dale, 349 (73.9%) are family households, while 123 (26.1%) are nonfamily households. The most numerous type of family households are 2-person households, comprising 170, and the most common type of nonfamily households are 1-person households, comprising 118.
| Household Size | Family Households | Nonfamily Households |
| 1-Person Households | - | 118 (25.0%) |
| 2-Person Households | 170 (36.0%) | 5 (1.1%) |
| 3-Person Households | 33 (7.0%) | 0 (0.0%) |
| 4-Person Households | 45 (9.5%) | 0 (0.0%) |
| 5-Person Households | 51 (10.8%) | 0 (0.0%) |
| 6-Person Households | 35 (7.4%) | 0 (0.0%) |
| 7+ Person Households | 15 (3.2%) | 0 (0.0%) |
| Total | 349 (73.9%) | 123 (26.1%) |
Female Fertility in Castle Dale
Fertility by Age in Castle Dale
| Age Bracket | Women with Births | Births / 1,000 Women |
| 15 to 19 years | 0 (0.0%) | 0.0 |
| 20 to 34 years | 0 (0.0%) | 0.0 |
| 35 to 50 years | 0 (0.0%) | 0.0 |
| Total | 0 (0.0%) | 0.0 |
Fertility by Age by Marriage Status in Castle Dale
| Age Bracket | Married | Unmarried |
| 15 to 19 years | 0 (0.0%) | 0 (0.0%) |
| 20 to 34 years | 0 (0.0%) | 0 (0.0%) |
| 35 to 50 years | 0 (0.0%) | 0 (0.0%) |
| Total | 0 (0.0%) | 0 (0.0%) |
Fertility by Education in Castle Dale
| Educational Attainment | Women with Births | Births / 1,000 Women |
| Less than High School | 0 (0.0%) | 0.0 |
| High School Diploma | 0 (0.0%) | 0.0 |
| College or Associate's Degree | 0 (0.0%) | 0.0 |
| Bachelor's Degree | 0 (0.0%) | 0.0 |
| Graduate Degree | 0 (0.0%) | 0.0 |
| Total | 0 (0.0%) | 0.0 |
Fertility by Education by Marriage Status in Castle Dale
| Educational Attainment | Married | Unmarried |
| Less than High School | 0 (0.0%) | 0 (0.0%) |
| High School Diploma | 0 (0.0%) | 0 (0.0%) |
| College or Associate's Degree | 0 (0.0%) | 0 (0.0%) |
| Bachelor's Degree | 0 (0.0%) | 0 (0.0%) |
| Graduate Degree | 0 (0.0%) | 0 (0.0%) |
| Total | 0 (0.0%) | 0 (0.0%) |
Income in Castle Dale
Income Overview in Castle Dale
Per Capita Income in Castle Dale is $25,690, while median incomes of families and households are $64,712 and $62,500 respectively.
| Characteristic | Number | Measure |
| Per Capita Income | 1,347 | $25,690 |
| Median Family Income | 349 | $64,712 |
| Mean Family Income | 349 | $81,148 |
| Median Household Income | 472 | $62,500 |
| Mean Household Income | 472 | $73,386 |
| Income Deficit | 349 | $8,656 |
| Wage / Income Gap (%) | 1,347 | 74.87% |
| Wage / Income Gap ($) | 1,347 | 25.13¢ per $1 |
| Gini / Inequality Index | 1,347 | 0.34 |
Earnings by Sex in Castle Dale
Average Earnings in Castle Dale are $30,556, $65,066 for men and $16,354 for women, a difference of 74.9%.
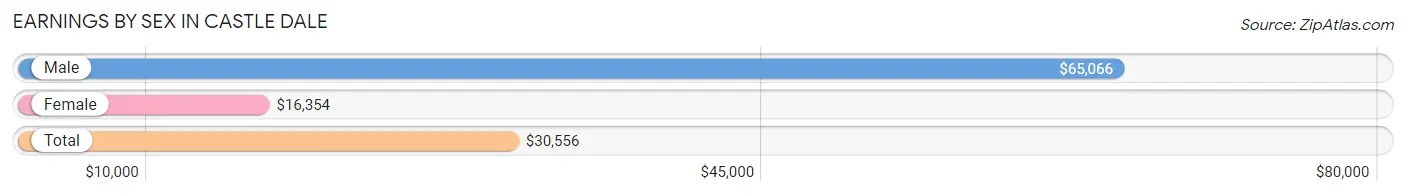
| Sex | Number | Average Earnings |
| Male | 253 (52.1%) | $65,066 |
| Female | 233 (47.9%) | $16,354 |
| Total | 486 (100.0%) | $30,556 |
Earnings by Sex by Income Bracket in Castle Dale
The most common earnings brackets in Castle Dale are $100,000+ for men (67 | 26.5%) and $12,500 to $14,999 for women (38 | 16.3%).
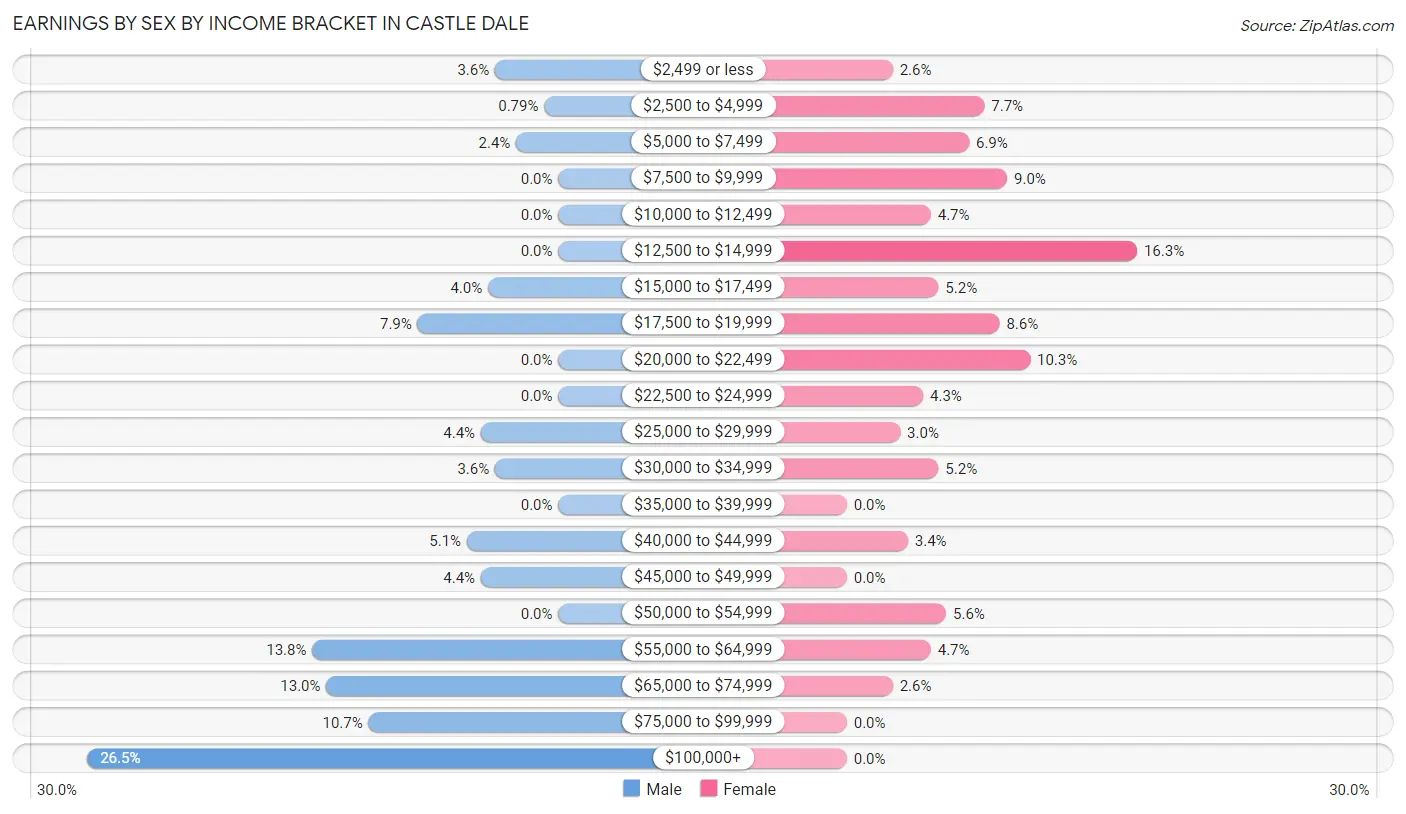
| Income | Male | Female |
| $2,499 or less | 9 (3.6%) | 6 (2.6%) |
| $2,500 to $4,999 | 2 (0.8%) | 18 (7.7%) |
| $5,000 to $7,499 | 6 (2.4%) | 16 (6.9%) |
| $7,500 to $9,999 | 0 (0.0%) | 21 (9.0%) |
| $10,000 to $12,499 | 0 (0.0%) | 11 (4.7%) |
| $12,500 to $14,999 | 0 (0.0%) | 38 (16.3%) |
| $15,000 to $17,499 | 10 (4.0%) | 12 (5.1%) |
| $17,500 to $19,999 | 20 (7.9%) | 20 (8.6%) |
| $20,000 to $22,499 | 0 (0.0%) | 24 (10.3%) |
| $22,500 to $24,999 | 0 (0.0%) | 10 (4.3%) |
| $25,000 to $29,999 | 11 (4.3%) | 7 (3.0%) |
| $30,000 to $34,999 | 9 (3.6%) | 12 (5.1%) |
| $35,000 to $39,999 | 0 (0.0%) | 0 (0.0%) |
| $40,000 to $44,999 | 13 (5.1%) | 8 (3.4%) |
| $45,000 to $49,999 | 11 (4.3%) | 0 (0.0%) |
| $50,000 to $54,999 | 0 (0.0%) | 13 (5.6%) |
| $55,000 to $64,999 | 35 (13.8%) | 11 (4.7%) |
| $65,000 to $74,999 | 33 (13.0%) | 6 (2.6%) |
| $75,000 to $99,999 | 27 (10.7%) | 0 (0.0%) |
| $100,000+ | 67 (26.5%) | 0 (0.0%) |
| Total | 253 (100.0%) | 233 (100.0%) |
Earnings by Sex by Educational Attainment in Castle Dale
Average earnings in Castle Dale are $67,039 for men and $18,938 for women, a difference of 71.8%. Men with an educational attainment of high school diploma enjoy the highest average annual earnings of $96,146, while those with graduate degree education earn the least with $61,125. Women with an educational attainment of high school diploma earn the most with the average annual earnings of $19,464, while those with college or associate's degree education have the smallest earnings of $18,558.
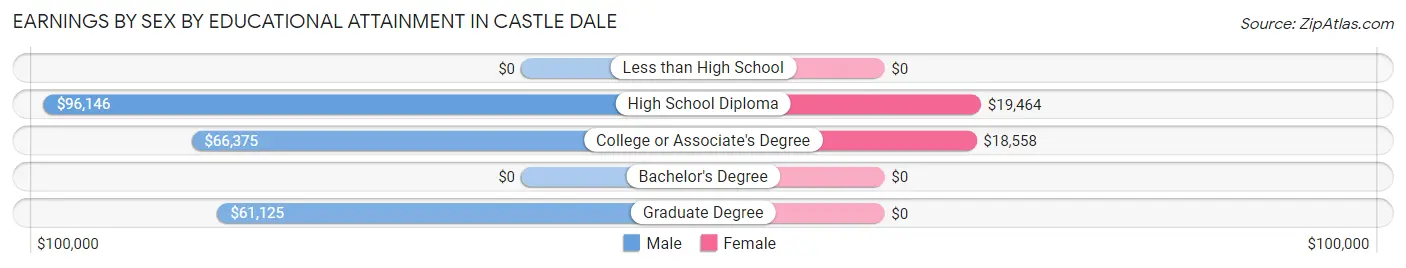
| Educational Attainment | Male Income | Female Income |
| Less than High School | - | - |
| High School Diploma | $96,146 | $19,464 |
| College or Associate's Degree | $66,375 | $18,558 |
| Bachelor's Degree | - | - |
| Graduate Degree | $61,125 | $0 |
| Total | $67,039 | $18,938 |
Family Income in Castle Dale
Family Income Brackets in Castle Dale
According to the Castle Dale family income data, there are 76 families falling into the $50,000 to $74,999 income range, which is the most common income bracket and makes up 21.8% of all families.
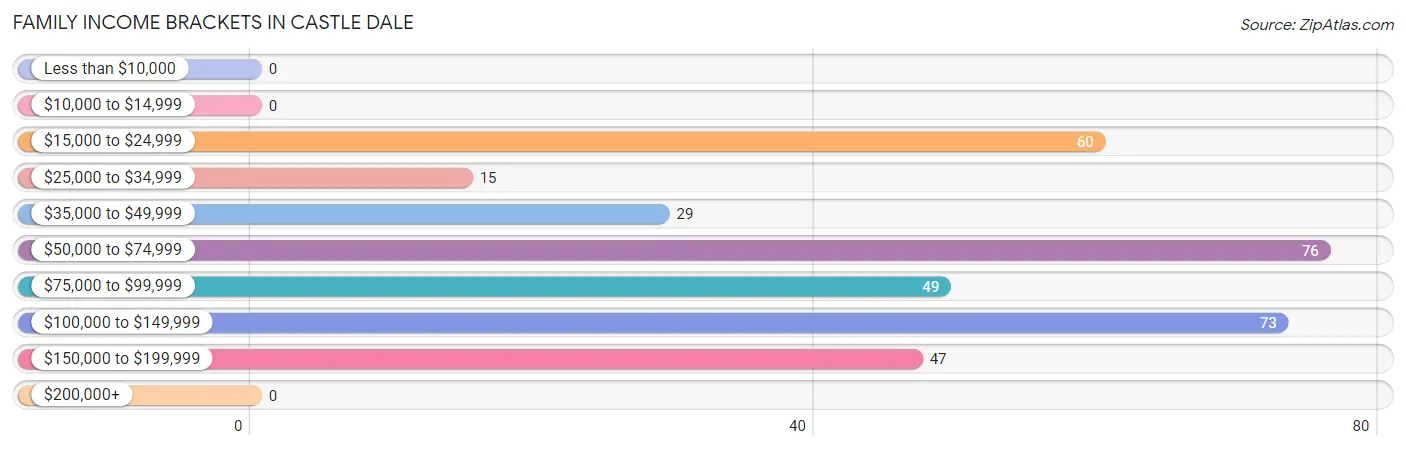
| Income Bracket | # Families | % Families |
| Less than $10,000 | 0 | 0.0% |
| $10,000 to $14,999 | 0 | 0.0% |
| $15,000 to $24,999 | 60 | 17.2% |
| $25,000 to $34,999 | 15 | 4.3% |
| $35,000 to $49,999 | 29 | 8.3% |
| $50,000 to $74,999 | 76 | 21.8% |
| $75,000 to $99,999 | 49 | 14.0% |
| $100,000 to $149,999 | 73 | 20.9% |
| $150,000 to $199,999 | 47 | 13.5% |
| $200,000+ | 0 | 0.0% |
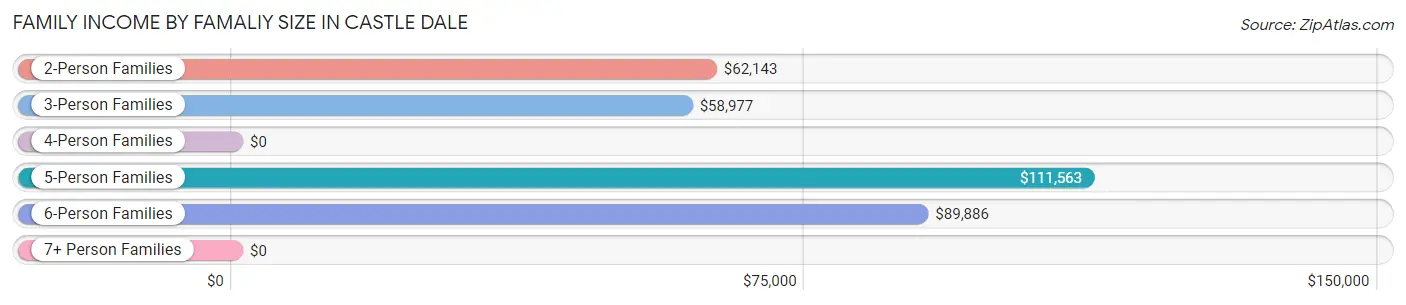
Family Income by Famaliy Size in Castle Dale
5-person families (51 | 14.6%) account for the highest median family income in Castle Dale with $111,563 per family, while 2-person families (170 | 48.7%) have the highest median income of $31,072 per family member.
| Income Bracket | # Families | Median Income |
| 2-Person Families | 170 (48.7%) | $62,143 |
| 3-Person Families | 53 (15.2%) | $58,977 |
| 4-Person Families | 25 (7.2%) | $0 |
| 5-Person Families | 51 (14.6%) | $111,563 |
| 6-Person Families | 35 (10.0%) | $89,886 |
| 7+ Person Families | 15 (4.3%) | $0 |
| Total | 349 (100.0%) | $64,712 |
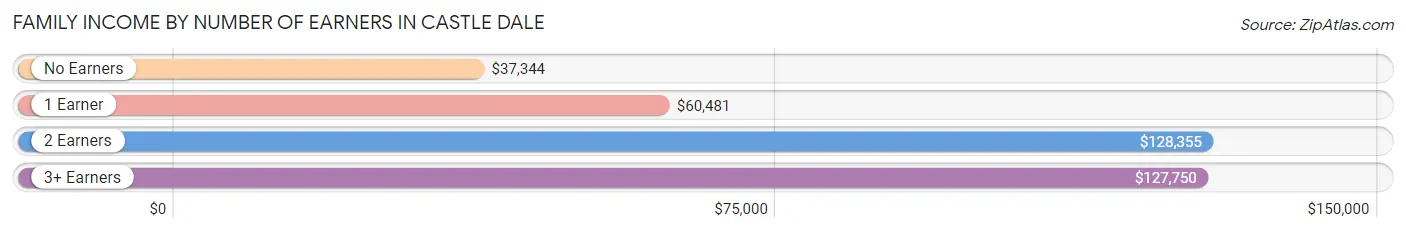
Family Income by Number of Earners in Castle Dale
The median family income in Castle Dale is $64,712, with families comprising 2 earners (77) having the highest median family income of $128,355, while families with no earners (61) have the lowest median family income of $37,344, accounting for 22.1% and 17.5% of families, respectively.
| Number of Earners | # Families | Median Income |
| No Earners | 61 (17.5%) | $37,344 |
| 1 Earner | 183 (52.4%) | $60,481 |
| 2 Earners | 77 (22.1%) | $128,355 |
| 3+ Earners | 28 (8.0%) | $127,750 |
| Total | 349 (100.0%) | $64,712 |
Household Income in Castle Dale
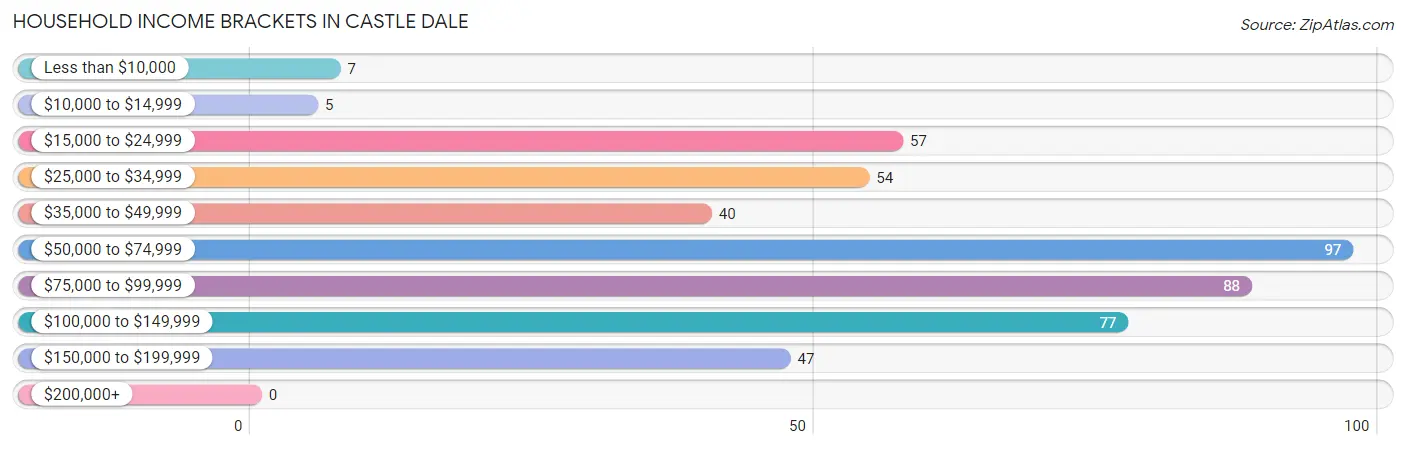
Household Income Brackets in Castle Dale
With 97 households falling in the category, the $50,000 to $74,999 income range is the most frequent in Castle Dale, accounting for 20.5% of all households.
| Income Bracket | # Households | % Households |
| Less than $10,000 | 7 | 1.5% |
| $10,000 to $14,999 | 5 | 1.1% |
| $15,000 to $24,999 | 57 | 12.1% |
| $25,000 to $34,999 | 54 | 11.4% |
| $35,000 to $49,999 | 40 | 8.5% |
| $50,000 to $74,999 | 97 | 20.6% |
| $75,000 to $99,999 | 88 | 18.6% |
| $100,000 to $149,999 | 77 | 16.3% |
| $150,000 to $199,999 | 47 | 10.0% |
| $200,000+ | 0 | 0.0% |
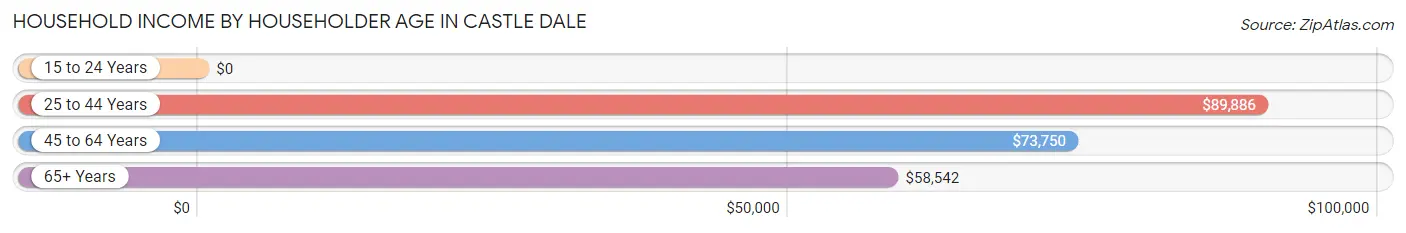
Household Income by Householder Age in Castle Dale
The median household income in Castle Dale is $62,500, with the highest median household income of $89,886 found in the 25 to 44 years age bracket for the primary householder. A total of 135 households (28.6%) fall into this category. Meanwhile, the 15 to 24 years age bracket for the primary householder has the lowest median household income of $0, with 20 households (4.2%) in this group.
| Income Bracket | # Households | Median Income |
| 15 to 24 Years | 20 (4.2%) | $0 |
| 25 to 44 Years | 135 (28.6%) | $89,886 |
| 45 to 64 Years | 142 (30.1%) | $73,750 |
| 65+ Years | 175 (37.1%) | $58,542 |
| Total | 472 (100.0%) | $62,500 |
Poverty in Castle Dale
Income Below Poverty by Sex and Age in Castle Dale
With 17.7% poverty level for males and 15.0% for females among the residents of Castle Dale, 25 to 34 year old males and 6 to 11 year old females are the most vulnerable to poverty, with 26 males (59.1%) and 29 females (40.8%) in their respective age groups living below the poverty level.
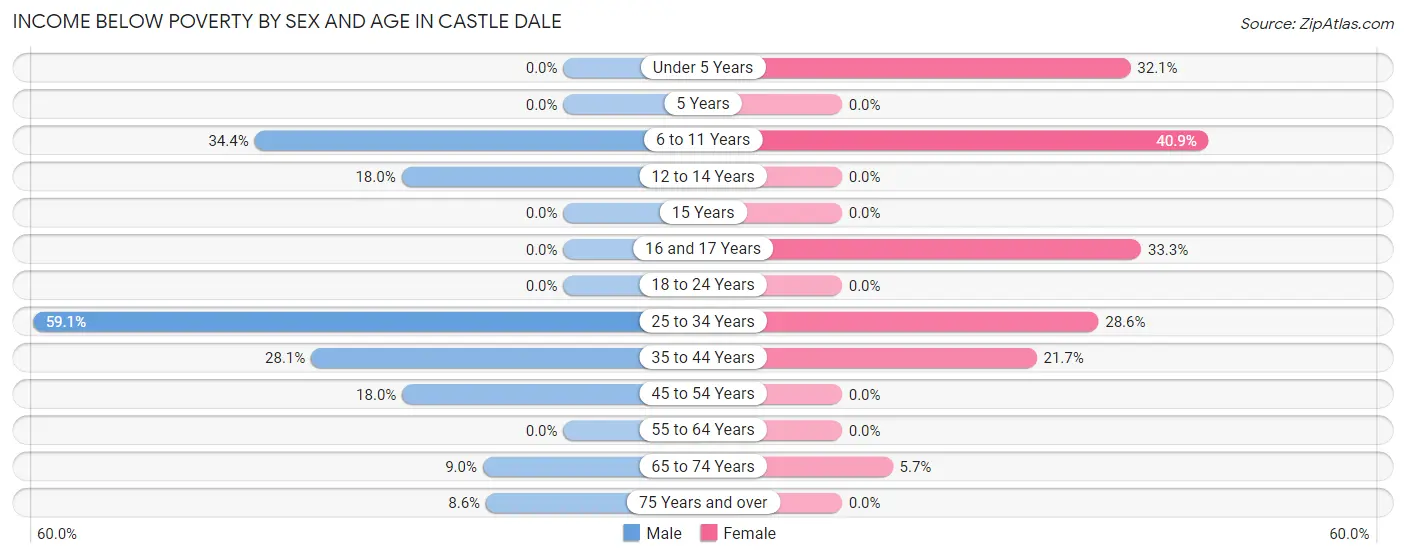
| Age Bracket | Male | Female |
| Under 5 Years | 0 (0.0%) | 9 (32.1%) |
| 5 Years | 0 (0.0%) | 0 (0.0%) |
| 6 to 11 Years | 43 (34.4%) | 29 (40.8%) |
| 12 to 14 Years | 11 (18.0%) | 0 (0.0%) |
| 15 Years | 0 (0.0%) | 0 (0.0%) |
| 16 and 17 Years | 0 (0.0%) | 13 (33.3%) |
| 18 to 24 Years | 0 (0.0%) | 0 (0.0%) |
| 25 to 34 Years | 26 (59.1%) | 22 (28.6%) |
| 35 to 44 Years | 25 (28.1%) | 18 (21.7%) |
| 45 to 54 Years | 7 (17.9%) | 0 (0.0%) |
| 55 to 64 Years | 0 (0.0%) | 0 (0.0%) |
| 65 to 74 Years | 7 (9.0%) | 6 (5.7%) |
| 75 Years and over | 5 (8.6%) | 0 (0.0%) |
| Total | 124 (17.7%) | 97 (15.0%) |
Income Above Poverty by Sex and Age in Castle Dale
According to the poverty statistics in Castle Dale, males aged under 5 years and females aged 5 years are the age groups that are most secure financially, with 100.0% of males and 100.0% of females in these age groups living above the poverty line.
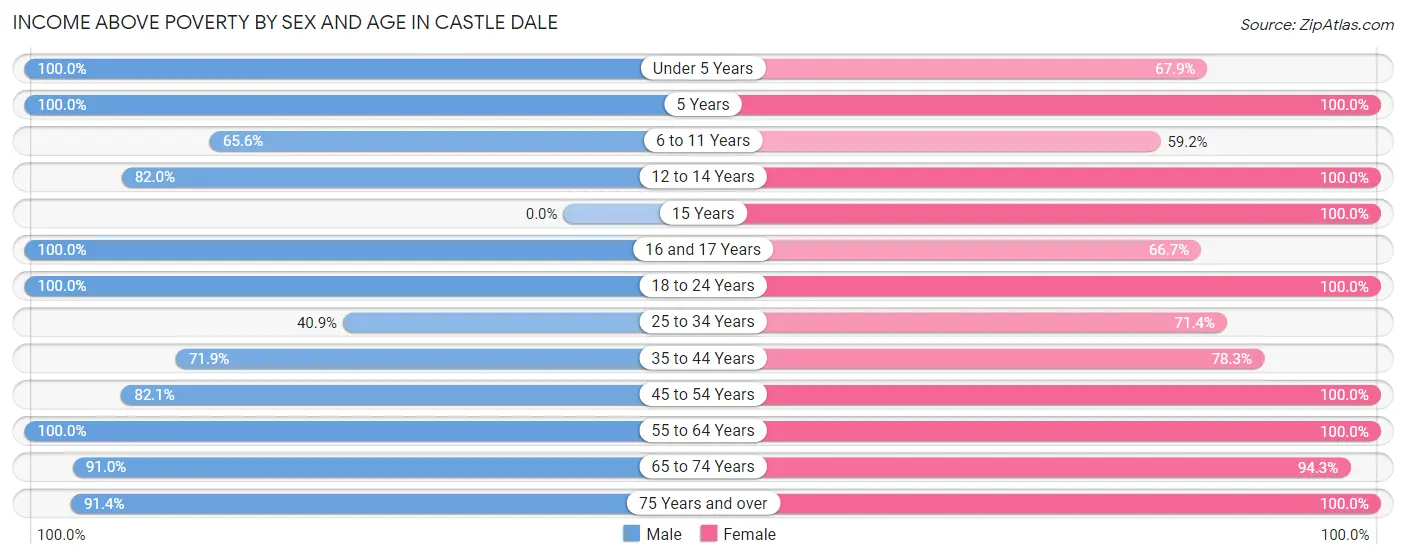
| Age Bracket | Male | Female |
| Under 5 Years | 40 (100.0%) | 19 (67.9%) |
| 5 Years | 18 (100.0%) | 10 (100.0%) |
| 6 to 11 Years | 82 (65.6%) | 42 (59.2%) |
| 12 to 14 Years | 50 (82.0%) | 20 (100.0%) |
| 15 Years | 0 (0.0%) | 8 (100.0%) |
| 16 and 17 Years | 22 (100.0%) | 26 (66.7%) |
| 18 to 24 Years | 45 (100.0%) | 31 (100.0%) |
| 25 to 34 Years | 18 (40.9%) | 55 (71.4%) |
| 35 to 44 Years | 64 (71.9%) | 65 (78.3%) |
| 45 to 54 Years | 32 (82.1%) | 36 (100.0%) |
| 55 to 64 Years | 82 (100.0%) | 91 (100.0%) |
| 65 to 74 Years | 71 (91.0%) | 100 (94.3%) |
| 75 Years and over | 53 (91.4%) | 46 (100.0%) |
| Total | 577 (82.3%) | 549 (85.0%) |
Income Below Poverty Among Married-Couple Families in Castle Dale
The poverty statistics for married-couple families in Castle Dale show that 10.7% or 32 of the total 300 families live below the poverty line. Families with 5 or more children have the highest poverty rate of 40.0%, comprising of 6 families. On the other hand, families with no children have the lowest poverty rate of 0.0%, which includes 0 families.
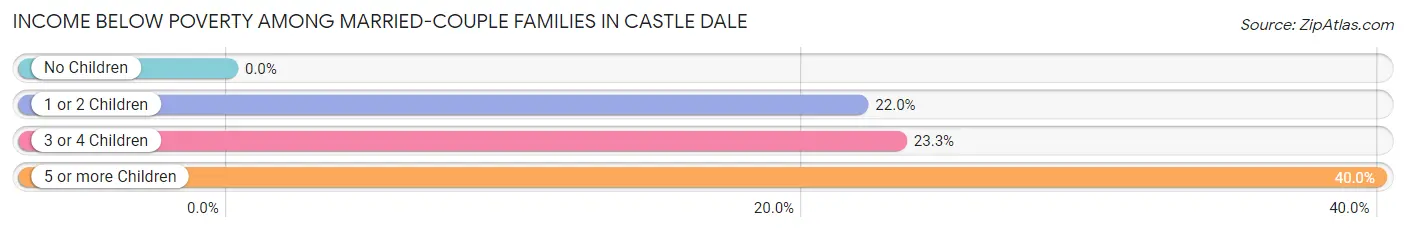
| Children | Above Poverty | Below Poverty |
| No Children | 171 (100.0%) | 0 (0.0%) |
| 1 or 2 Children | 32 (78.0%) | 9 (22.0%) |
| 3 or 4 Children | 56 (76.7%) | 17 (23.3%) |
| 5 or more Children | 9 (60.0%) | 6 (40.0%) |
| Total | 268 (89.3%) | 32 (10.7%) |
Income Below Poverty Among Single-Parent Households in Castle Dale
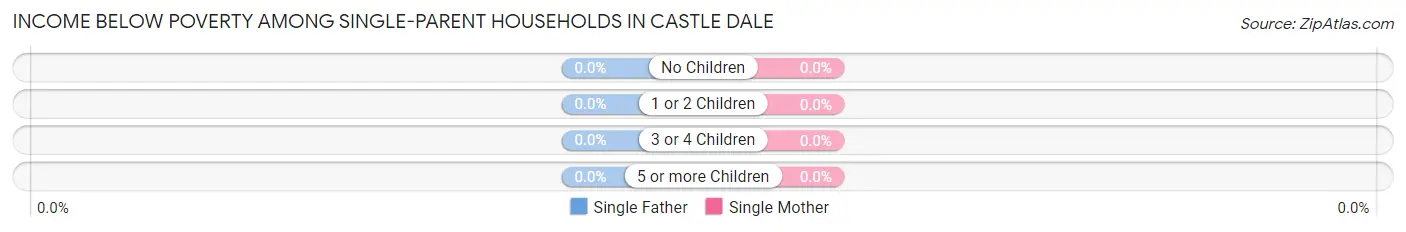
| Children | Single Father | Single Mother |
| No Children | 0 (0.0%) | 0 (0.0%) |
| 1 or 2 Children | 0 (0.0%) | 0 (0.0%) |
| 3 or 4 Children | 0 (0.0%) | 0 (0.0%) |
| 5 or more Children | 0 (0.0%) | 0 (0.0%) |
| Total | 0 (0.0%) | 0 (0.0%) |
Income Below Poverty Among Married-Couple vs Single-Parent Households in Castle Dale
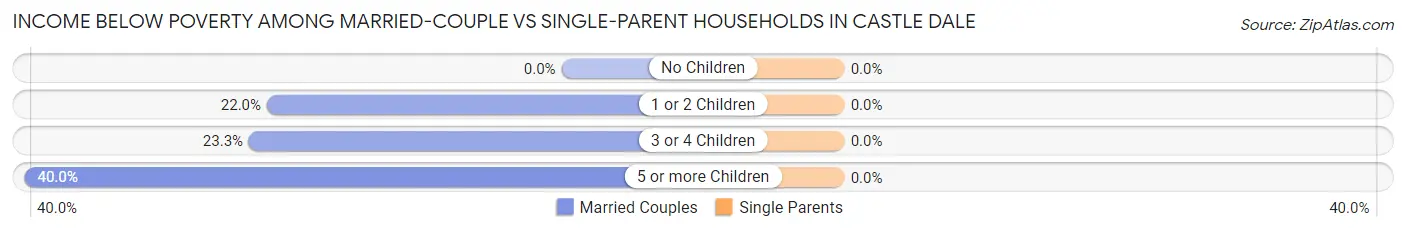
| Children | Married-Couple Families | Single-Parent Households |
| No Children | 0 (0.0%) | 0 (0.0%) |
| 1 or 2 Children | 9 (22.0%) | 0 (0.0%) |
| 3 or 4 Children | 17 (23.3%) | 0 (0.0%) |
| 5 or more Children | 6 (40.0%) | 0 (0.0%) |
| Total | 32 (10.7%) | 0 (0.0%) |
Employment Characteristics in Castle Dale
Employment by Class of Employer in Castle Dale
Among the 418 employed individuals in Castle Dale, private company employees (239 | 57.2%), local government employees (99 | 23.7%), and state government employees (37 | 8.8%) make up the most common classes of employment.

| Employer Class | # Employees | % Employees |
| Private Company Employees | 239 | 57.2% |
| Self-Employed (Incorporated) | 10 | 2.4% |
| Self-Employed (Not Incorporated) | 27 | 6.5% |
| Not-for-profit Organizations | 0 | 0.0% |
| Local Government Employees | 99 | 23.7% |
| State Government Employees | 37 | 8.8% |
| Federal Government Employees | 6 | 1.4% |
| Unpaid Family Workers | 0 | 0.0% |
| Total | 418 | 100.0% |
Employment Status by Age in Castle Dale
According to the labor force statistics for Castle Dale, out of the total population over 16 years of age (966), 45.0% or 435 individuals are in the labor force, with 3.9% or 17 of them unemployed. The age group with the highest labor force participation rate is 45 to 54 years, with 100.0% or 75 individuals in the labor force. Within the labor force, the 45 to 54 years age range has the highest percentage of unemployed individuals, with 9.3% or 7 of them being unemployed.
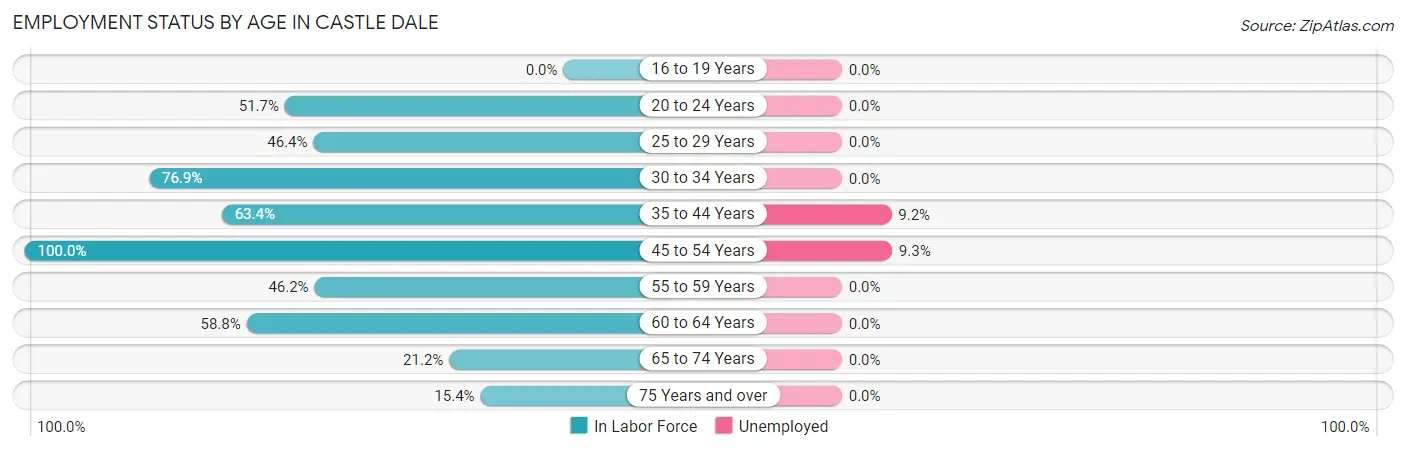
| Age Bracket | In Labor Force | Unemployed |
| 16 to 19 Years | 0 (0.0%) | 0 (0.0%) |
| 20 to 24 Years | 30 (51.7%) | 0 (0.0%) |
| 25 to 29 Years | 26 (46.4%) | 0 (0.0%) |
| 30 to 34 Years | 50 (76.9%) | 0 (0.0%) |
| 35 to 44 Years | 109 (63.4%) | 10 (9.2%) |
| 45 to 54 Years | 75 (100.0%) | 7 (9.3%) |
| 55 to 59 Years | 43 (46.2%) | 0 (0.0%) |
| 60 to 64 Years | 47 (58.8%) | 0 (0.0%) |
| 65 to 74 Years | 39 (21.2%) | 0 (0.0%) |
| 75 Years and over | 16 (15.4%) | 0 (0.0%) |
| Total | 435 (45.0%) | 17 (3.9%) |
Employment Status by Educational Attainment in Castle Dale
According to labor force statistics for Castle Dale, 64.7% of individuals (350) out of the total population between 25 and 64 years of age (541) are in the labor force, with 4.9% or 17 of them being unemployed. The group with the highest labor force participation rate are those with the educational attainment of college / associate degree, with 72.3% or 136 individuals in the labor force. Within the labor force, individuals with bachelor's degree or higher education have the highest percentage of unemployment, with 10.3% or 10 of them being unemployed.
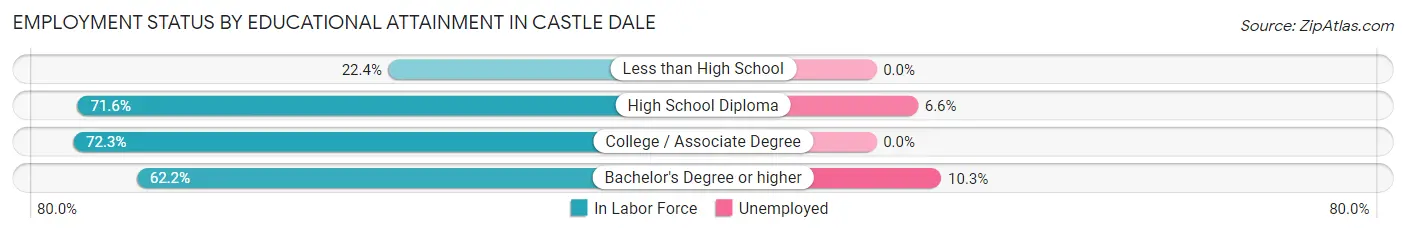
| Educational Attainment | In Labor Force | Unemployed |
| Less than High School | 11 (22.4%) | 0 (0.0%) |
| High School Diploma | 106 (71.6%) | 10 (6.6%) |
| College / Associate Degree | 136 (72.3%) | 0 (0.0%) |
| Bachelor's Degree or higher | 97 (62.2%) | 16 (10.3%) |
| Total | 350 (64.7%) | 27 (4.9%) |
Employment Occupations by Sex in Castle Dale
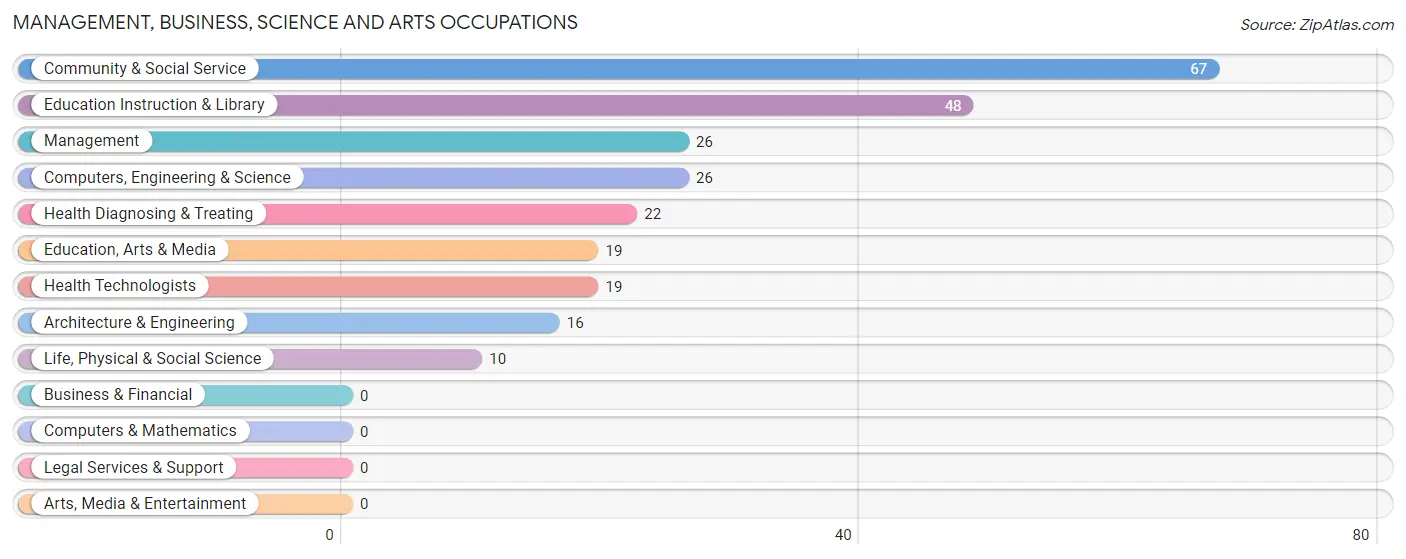
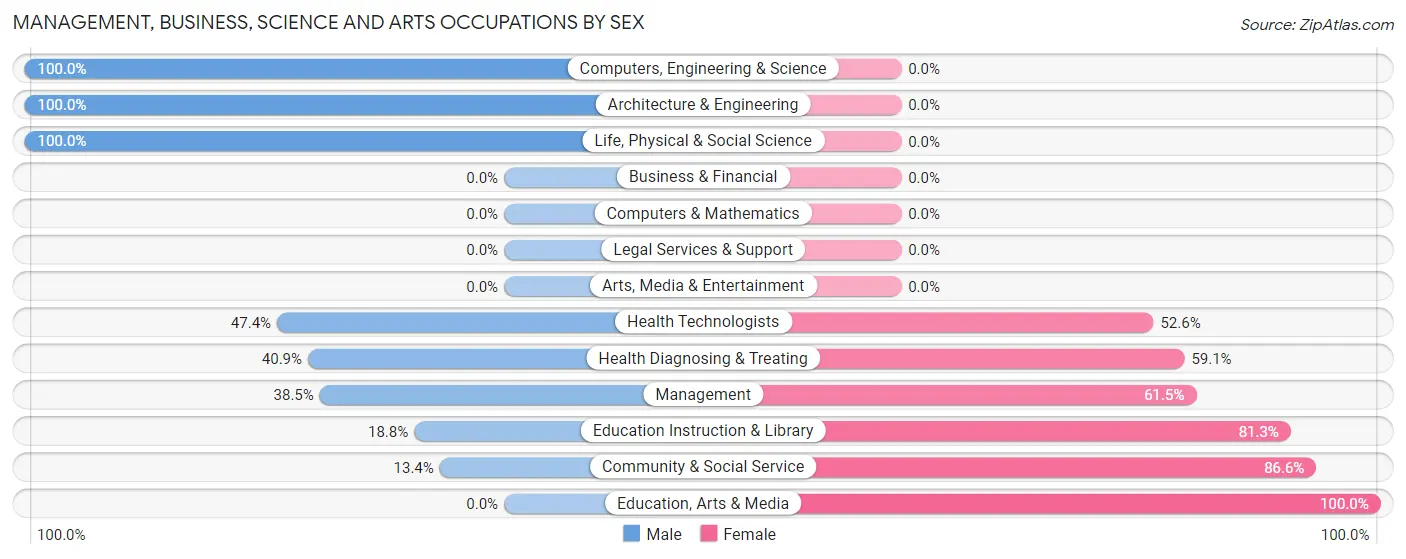
Management, Business, Science and Arts Occupations
The most common Management, Business, Science and Arts occupations in Castle Dale are Community & Social Service (67 | 16.0%), Education Instruction & Library (48 | 11.5%), Management (26 | 6.2%), Computers, Engineering & Science (26 | 6.2%), and Health Diagnosing & Treating (22 | 5.3%).
Management, Business, Science and Arts Occupations by Sex
Within the Management, Business, Science and Arts occupations in Castle Dale, the most male-oriented occupations are Computers, Engineering & Science (100.0%), Architecture & Engineering (100.0%), and Life, Physical & Social Science (100.0%), while the most female-oriented occupations are Education, Arts & Media (100.0%), Community & Social Service (86.6%), and Education Instruction & Library (81.2%).
| Occupation | Male | Female |
| Management | 10 (38.5%) | 16 (61.5%) |
| Business & Financial | 0 (0.0%) | 0 (0.0%) |
| Computers, Engineering & Science | 26 (100.0%) | 0 (0.0%) |
| Computers & Mathematics | 0 (0.0%) | 0 (0.0%) |
| Architecture & Engineering | 16 (100.0%) | 0 (0.0%) |
| Life, Physical & Social Science | 10 (100.0%) | 0 (0.0%) |
| Community & Social Service | 9 (13.4%) | 58 (86.6%) |
| Education, Arts & Media | 0 (0.0%) | 19 (100.0%) |
| Legal Services & Support | 0 (0.0%) | 0 (0.0%) |
| Education Instruction & Library | 9 (18.8%) | 39 (81.2%) |
| Arts, Media & Entertainment | 0 (0.0%) | 0 (0.0%) |
| Health Diagnosing & Treating | 9 (40.9%) | 13 (59.1%) |
| Health Technologists | 9 (47.4%) | 10 (52.6%) |
| Total (Category) | 54 (38.3%) | 87 (61.7%) |
| Total (Overall) | 234 (56.0%) | 184 (44.0%) |
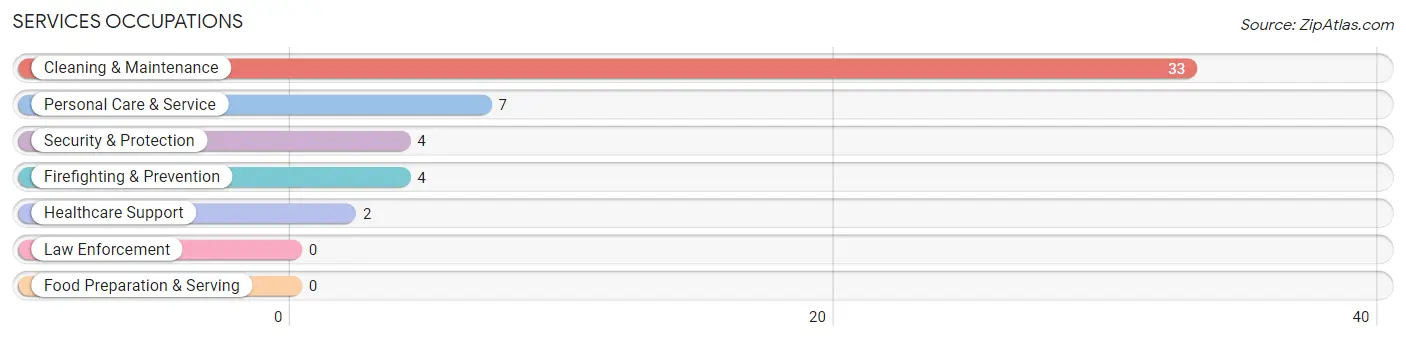
Services Occupations
The most common Services occupations in Castle Dale are Cleaning & Maintenance (33 | 7.9%), Personal Care & Service (7 | 1.7%), Security & Protection (4 | 1.0%), Firefighting & Prevention (4 | 1.0%), and Healthcare Support (2 | 0.5%).
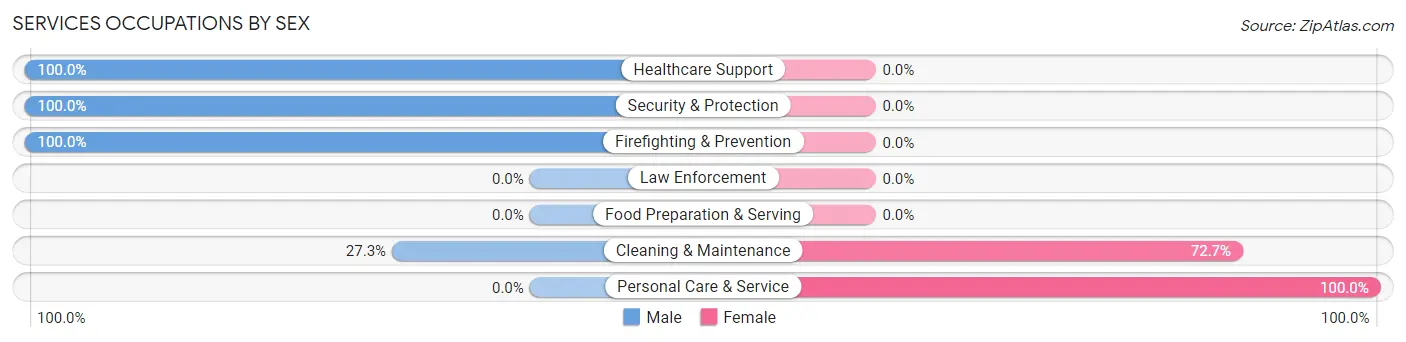
Services Occupations by Sex
Within the Services occupations in Castle Dale, the most male-oriented occupations are Healthcare Support (100.0%), Security & Protection (100.0%), and Firefighting & Prevention (100.0%), while the most female-oriented occupations are Personal Care & Service (100.0%), and Cleaning & Maintenance (72.7%).
| Occupation | Male | Female |
| Healthcare Support | 2 (100.0%) | 0 (0.0%) |
| Security & Protection | 4 (100.0%) | 0 (0.0%) |
| Firefighting & Prevention | 4 (100.0%) | 0 (0.0%) |
| Law Enforcement | 0 (0.0%) | 0 (0.0%) |
| Food Preparation & Serving | 0 (0.0%) | 0 (0.0%) |
| Cleaning & Maintenance | 9 (27.3%) | 24 (72.7%) |
| Personal Care & Service | 0 (0.0%) | 7 (100.0%) |
| Total (Category) | 15 (32.6%) | 31 (67.4%) |
| Total (Overall) | 234 (56.0%) | 184 (44.0%) |
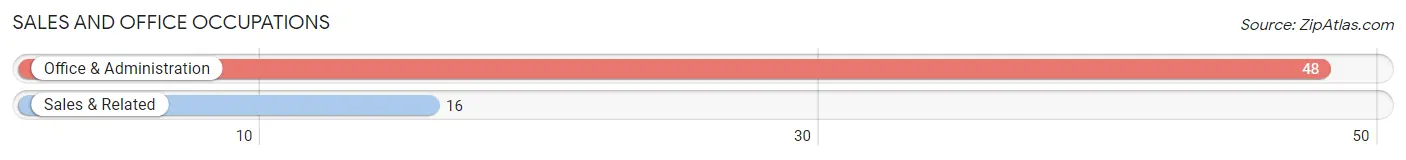
Sales and Office Occupations
The most common Sales and Office occupations in Castle Dale are Office & Administration (48 | 11.5%), and Sales & Related (16 | 3.8%).
Sales and Office Occupations by Sex
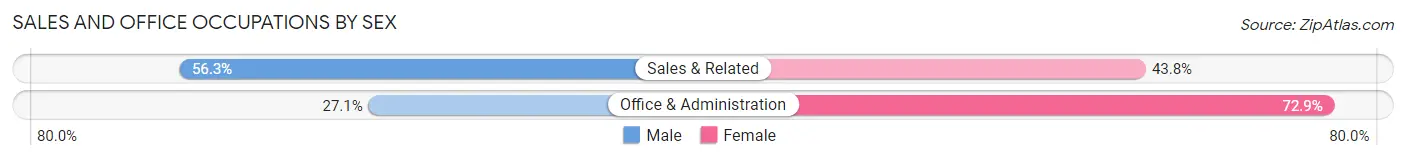
| Occupation | Male | Female |
| Sales & Related | 9 (56.2%) | 7 (43.8%) |
| Office & Administration | 13 (27.1%) | 35 (72.9%) |
| Total (Category) | 22 (34.4%) | 42 (65.6%) |
| Total (Overall) | 234 (56.0%) | 184 (44.0%) |
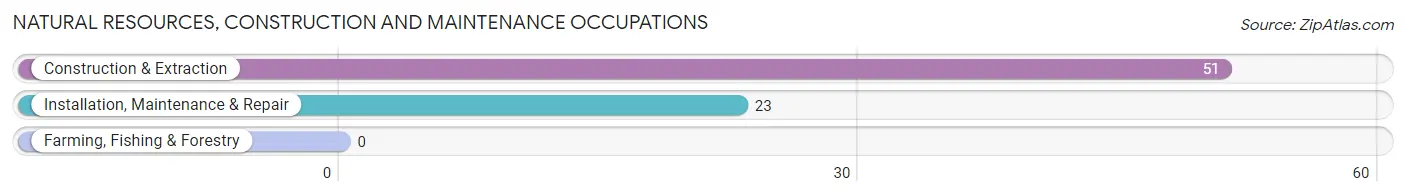
Natural Resources, Construction and Maintenance Occupations
The most common Natural Resources, Construction and Maintenance occupations in Castle Dale are Construction & Extraction (51 | 12.2%), and Installation, Maintenance & Repair (23 | 5.5%).
Natural Resources, Construction and Maintenance Occupations by Sex
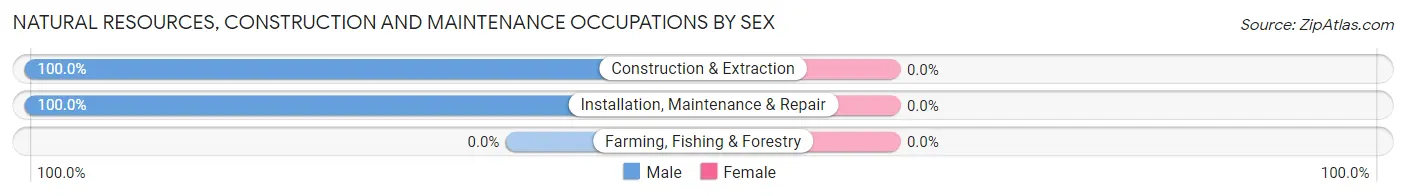
| Occupation | Male | Female |
| Farming, Fishing & Forestry | 0 (0.0%) | 0 (0.0%) |
| Construction & Extraction | 51 (100.0%) | 0 (0.0%) |
| Installation, Maintenance & Repair | 23 (100.0%) | 0 (0.0%) |
| Total (Category) | 74 (100.0%) | 0 (0.0%) |
| Total (Overall) | 234 (56.0%) | 184 (44.0%) |
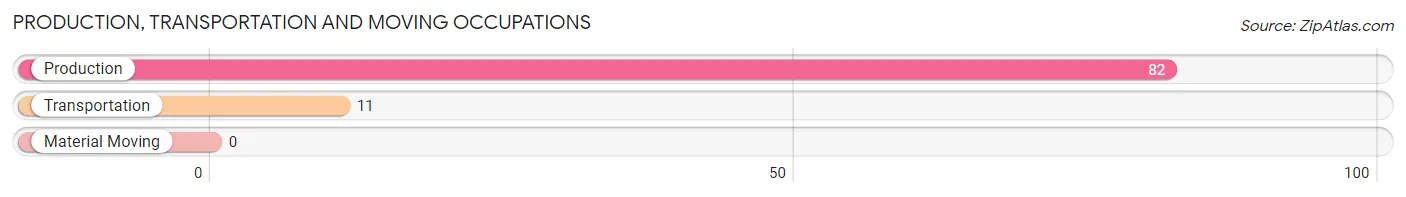
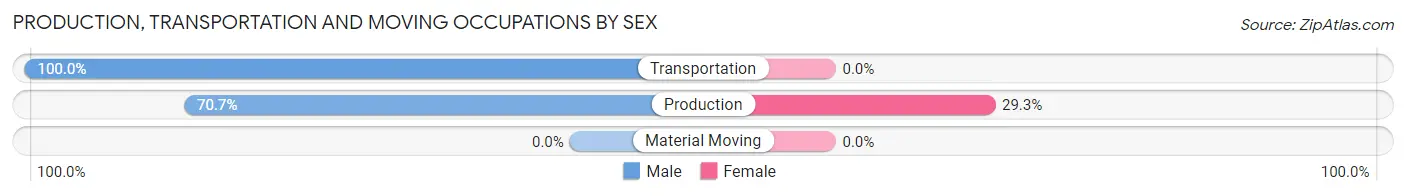
Production, Transportation and Moving Occupations
The most common Production, Transportation and Moving occupations in Castle Dale are Production (82 | 19.6%), and Transportation (11 | 2.6%).
Production, Transportation and Moving Occupations by Sex
| Occupation | Male | Female |
| Production | 58 (70.7%) | 24 (29.3%) |
| Transportation | 11 (100.0%) | 0 (0.0%) |
| Material Moving | 0 (0.0%) | 0 (0.0%) |
| Total (Category) | 69 (74.2%) | 24 (25.8%) |
| Total (Overall) | 234 (56.0%) | 184 (44.0%) |
Employment Industries by Sex in Castle Dale
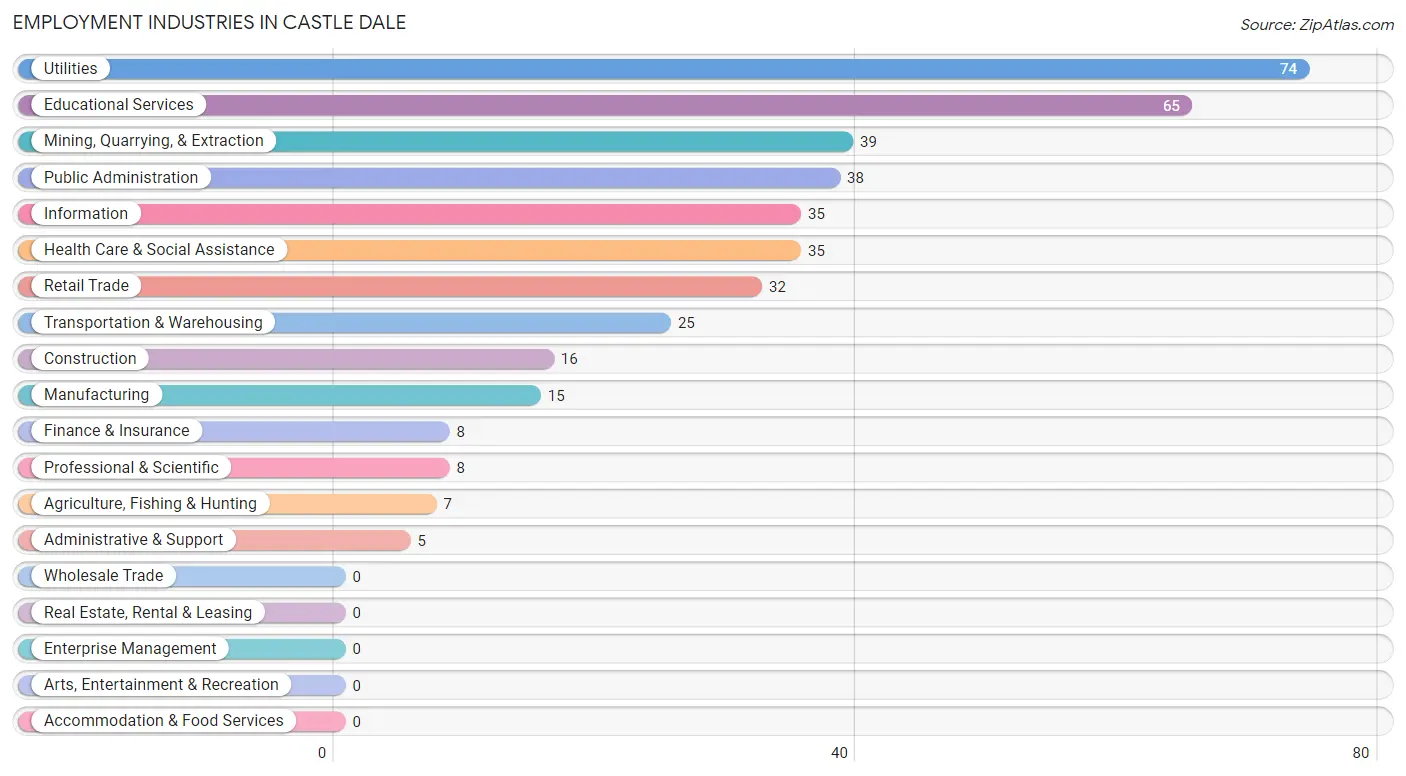
Employment Industries in Castle Dale
The major employment industries in Castle Dale include Utilities (74 | 17.7%), Educational Services (65 | 15.5%), Mining, Quarrying, & Extraction (39 | 9.3%), Public Administration (38 | 9.1%), and Information (35 | 8.4%).
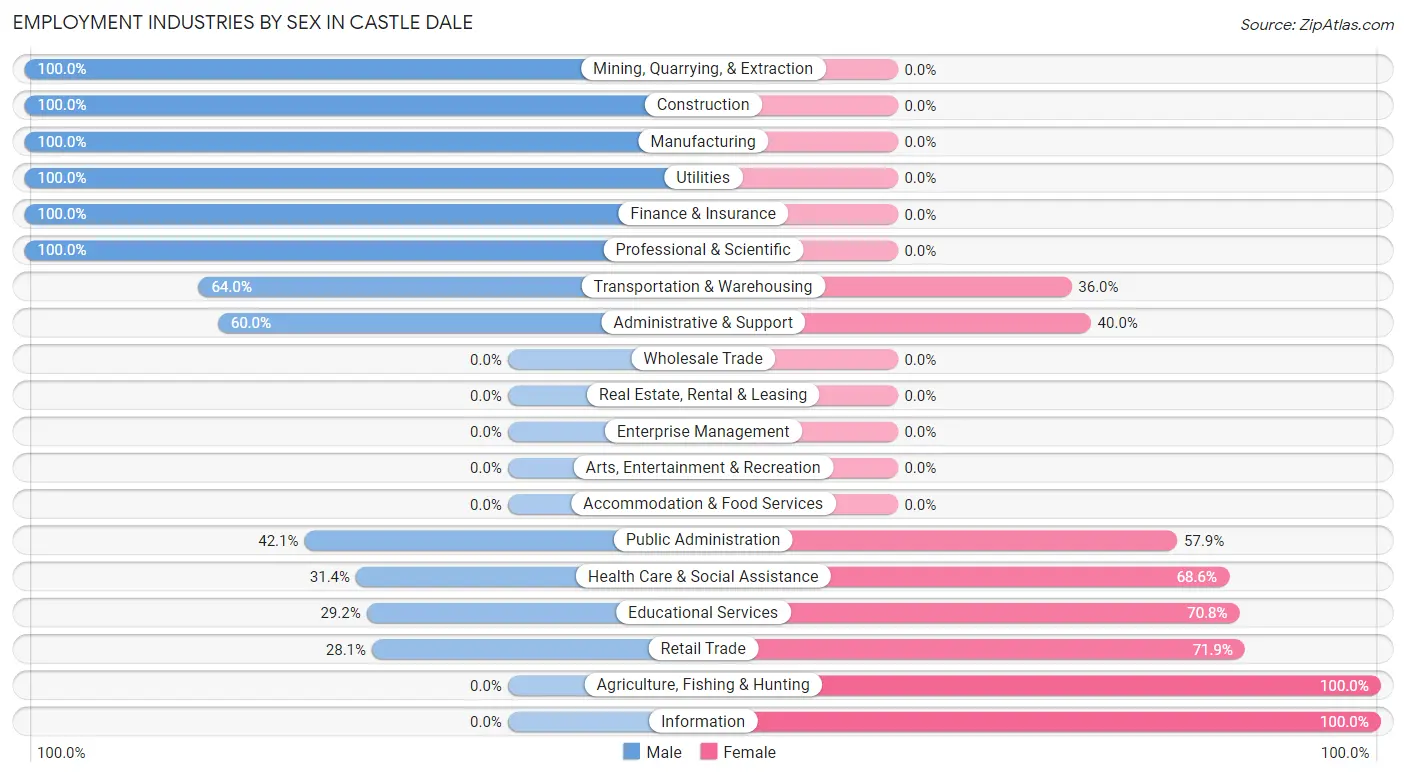
Employment Industries by Sex in Castle Dale
The Castle Dale industries that see more men than women are Mining, Quarrying, & Extraction (100.0%), Construction (100.0%), and Manufacturing (100.0%), whereas the industries that tend to have a higher number of women are Agriculture, Fishing & Hunting (100.0%), Information (100.0%), and Retail Trade (71.9%).
| Industry | Male | Female |
| Agriculture, Fishing & Hunting | 0 (0.0%) | 7 (100.0%) |
| Mining, Quarrying, & Extraction | 39 (100.0%) | 0 (0.0%) |
| Construction | 16 (100.0%) | 0 (0.0%) |
| Manufacturing | 15 (100.0%) | 0 (0.0%) |
| Wholesale Trade | 0 (0.0%) | 0 (0.0%) |
| Retail Trade | 9 (28.1%) | 23 (71.9%) |
| Transportation & Warehousing | 16 (64.0%) | 9 (36.0%) |
| Utilities | 74 (100.0%) | 0 (0.0%) |
| Information | 0 (0.0%) | 35 (100.0%) |
| Finance & Insurance | 8 (100.0%) | 0 (0.0%) |
| Real Estate, Rental & Leasing | 0 (0.0%) | 0 (0.0%) |
| Professional & Scientific | 8 (100.0%) | 0 (0.0%) |
| Enterprise Management | 0 (0.0%) | 0 (0.0%) |
| Administrative & Support | 3 (60.0%) | 2 (40.0%) |
| Educational Services | 19 (29.2%) | 46 (70.8%) |
| Health Care & Social Assistance | 11 (31.4%) | 24 (68.6%) |
| Arts, Entertainment & Recreation | 0 (0.0%) | 0 (0.0%) |
| Accommodation & Food Services | 0 (0.0%) | 0 (0.0%) |
| Public Administration | 16 (42.1%) | 22 (57.9%) |
| Total | 234 (56.0%) | 184 (44.0%) |
Education in Castle Dale
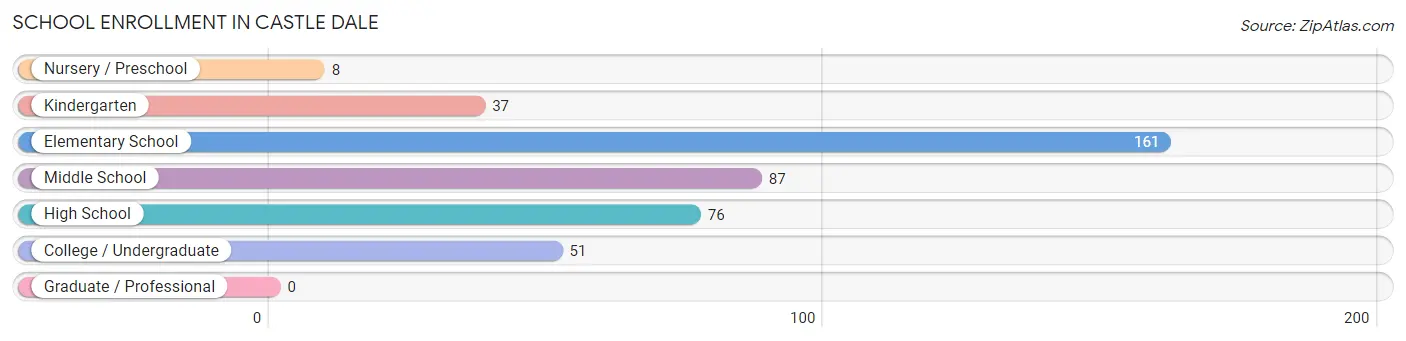
School Enrollment in Castle Dale
The most common levels of schooling among the 420 students in Castle Dale are elementary school (161 | 38.3%), middle school (87 | 20.7%), and high school (76 | 18.1%).
| School Level | # Students | % Students |
| Nursery / Preschool | 8 | 1.9% |
| Kindergarten | 37 | 8.8% |
| Elementary School | 161 | 38.3% |
| Middle School | 87 | 20.7% |
| High School | 76 | 18.1% |
| College / Undergraduate | 51 | 12.1% |
| Graduate / Professional | 0 | 0.0% |
| Total | 420 | 100.0% |
School Enrollment by Age by Funding Source in Castle Dale
Out of a total of 420 students who are enrolled in schools in Castle Dale, 11 (2.6%) attend a private institution, while the remaining 409 (97.4%) are enrolled in public schools. The age group of 35 years and over has the highest likelihood of being enrolled in private schools, with 11 (42.3% in the age bracket) enrolled. Conversely, the age group of 3 to 4 year olds has the lowest likelihood of being enrolled in a private school, with 6 (100.0% in the age bracket) attending a public institution.
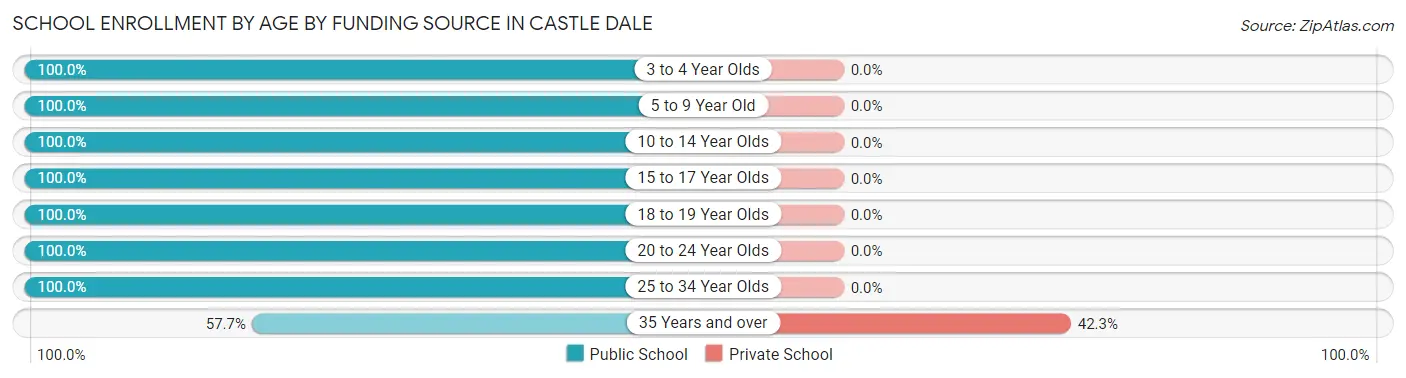
| Age Bracket | Public School | Private School |
| 3 to 4 Year Olds | 6 (100.0%) | 0 (0.0%) |
| 5 to 9 Year Old | 164 (100.0%) | 0 (0.0%) |
| 10 to 14 Year Olds | 123 (100.0%) | 0 (0.0%) |
| 15 to 17 Year Olds | 69 (100.0%) | 0 (0.0%) |
| 18 to 19 Year Olds | 13 (100.0%) | 0 (0.0%) |
| 20 to 24 Year Olds | 8 (100.0%) | 0 (0.0%) |
| 25 to 34 Year Olds | 11 (100.0%) | 0 (0.0%) |
| 35 Years and over | 15 (57.7%) | 11 (42.3%) |
| Total | 409 (97.4%) | 11 (2.6%) |
Educational Attainment by Field of Study in Castle Dale
Education (73 | 29.7%), arts & humanities (35 | 14.2%), literature & languages (28 | 11.4%), social sciences (22 | 8.9%), and bio, nature & agricultural (18 | 7.3%) are the most common fields of study among 246 individuals in Castle Dale who have obtained a bachelor's degree or higher.
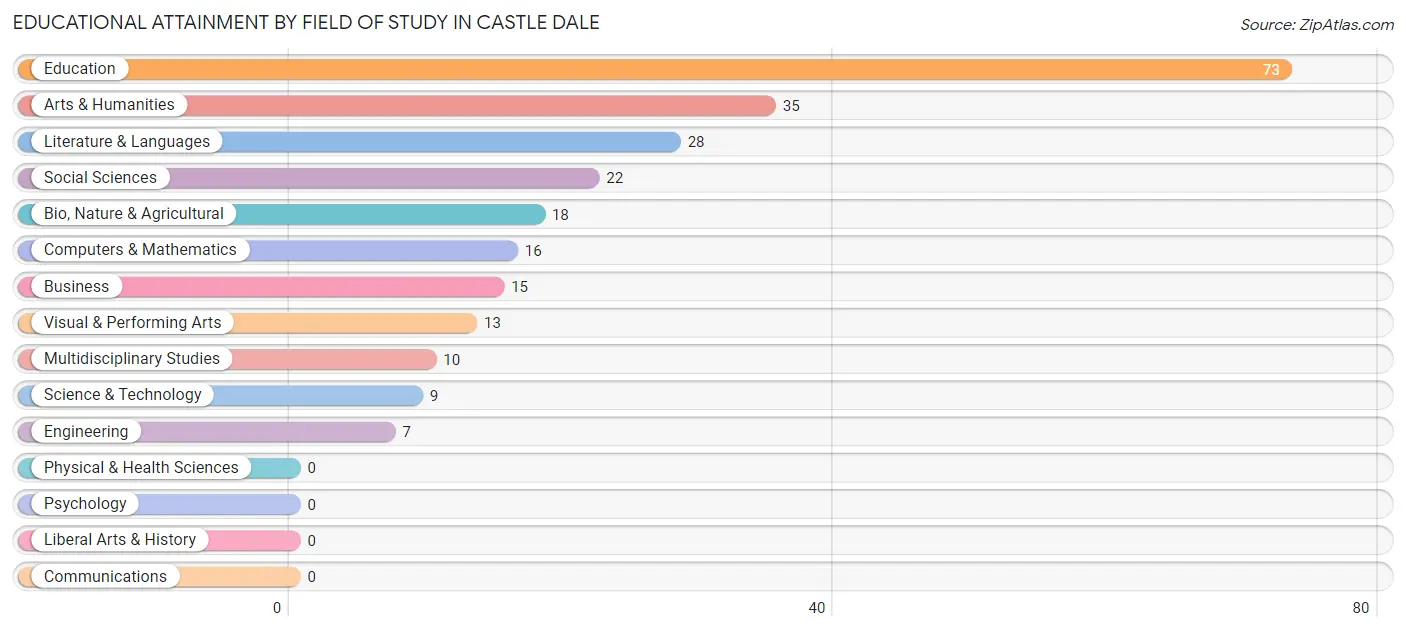
| Field of Study | # Graduates | % Graduates |
| Computers & Mathematics | 16 | 6.5% |
| Bio, Nature & Agricultural | 18 | 7.3% |
| Physical & Health Sciences | 0 | 0.0% |
| Psychology | 0 | 0.0% |
| Social Sciences | 22 | 8.9% |
| Engineering | 7 | 2.9% |
| Multidisciplinary Studies | 10 | 4.1% |
| Science & Technology | 9 | 3.7% |
| Business | 15 | 6.1% |
| Education | 73 | 29.7% |
| Literature & Languages | 28 | 11.4% |
| Liberal Arts & History | 0 | 0.0% |
| Visual & Performing Arts | 13 | 5.3% |
| Communications | 0 | 0.0% |
| Arts & Humanities | 35 | 14.2% |
| Total | 246 | 100.0% |
Transportation & Commute in Castle Dale
Vehicle Availability by Sex in Castle Dale
The most prevalent vehicle ownership categories in Castle Dale are males with 3 vehicles (98, accounting for 41.9%) and females with 3 vehicles (51, making up 53.3%).
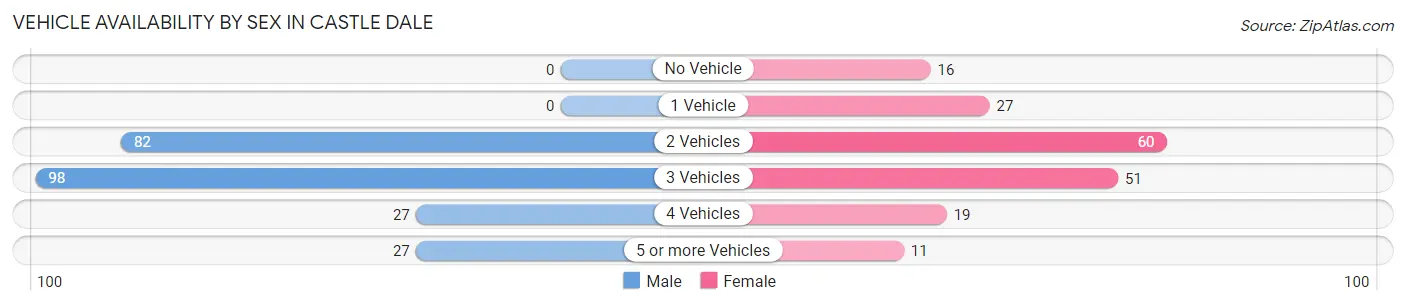
| Vehicles Available | Male | Female |
| No Vehicle | 0 (0.0%) | 16 (8.7%) |
| 1 Vehicle | 0 (0.0%) | 27 (14.7%) |
| 2 Vehicles | 82 (35.0%) | 60 (32.6%) |
| 3 Vehicles | 98 (41.9%) | 51 (27.7%) |
| 4 Vehicles | 27 (11.5%) | 19 (10.3%) |
| 5 or more Vehicles | 27 (11.5%) | 11 (6.0%) |
| Total | 234 (100.0%) | 184 (100.0%) |
Commute Time in Castle Dale
The most frequently occuring commute durations in Castle Dale are 5 to 9 minutes (133 commuters, 34.4%), 20 to 24 minutes (54 commuters, 14.0%), and 10 to 14 minutes (48 commuters, 12.4%).
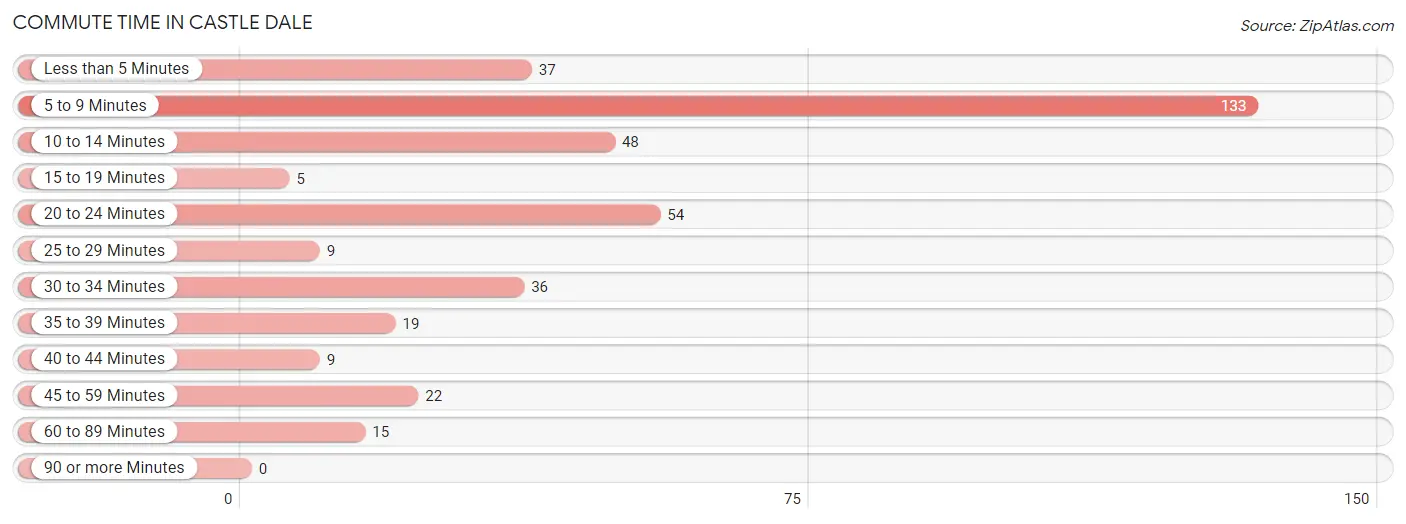
| Commute Time | # Commuters | % Commuters |
| Less than 5 Minutes | 37 | 9.6% |
| 5 to 9 Minutes | 133 | 34.4% |
| 10 to 14 Minutes | 48 | 12.4% |
| 15 to 19 Minutes | 5 | 1.3% |
| 20 to 24 Minutes | 54 | 14.0% |
| 25 to 29 Minutes | 9 | 2.3% |
| 30 to 34 Minutes | 36 | 9.3% |
| 35 to 39 Minutes | 19 | 4.9% |
| 40 to 44 Minutes | 9 | 2.3% |
| 45 to 59 Minutes | 22 | 5.7% |
| 60 to 89 Minutes | 15 | 3.9% |
| 90 or more Minutes | 0 | 0.0% |
Commute Time by Sex in Castle Dale
The most common commute times in Castle Dale are 5 to 9 minutes (74 commuters, 33.6%) for males and 5 to 9 minutes (59 commuters, 35.3%) for females.
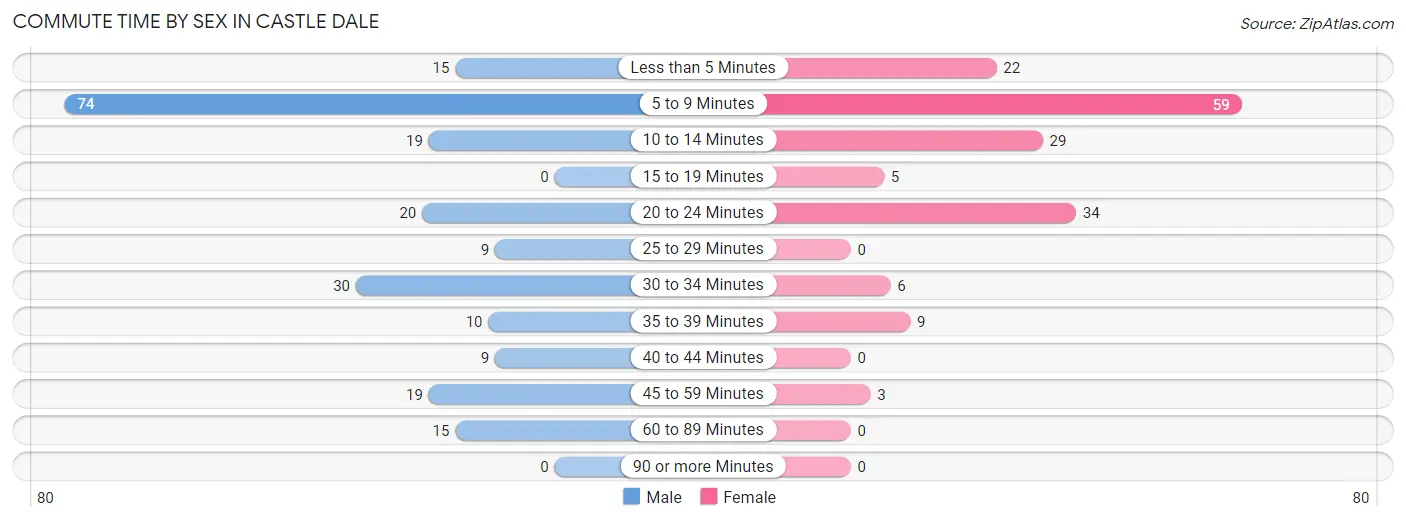
| Commute Time | Male | Female |
| Less than 5 Minutes | 15 (6.8%) | 22 (13.2%) |
| 5 to 9 Minutes | 74 (33.6%) | 59 (35.3%) |
| 10 to 14 Minutes | 19 (8.6%) | 29 (17.4%) |
| 15 to 19 Minutes | 0 (0.0%) | 5 (3.0%) |
| 20 to 24 Minutes | 20 (9.1%) | 34 (20.4%) |
| 25 to 29 Minutes | 9 (4.1%) | 0 (0.0%) |
| 30 to 34 Minutes | 30 (13.6%) | 6 (3.6%) |
| 35 to 39 Minutes | 10 (4.5%) | 9 (5.4%) |
| 40 to 44 Minutes | 9 (4.1%) | 0 (0.0%) |
| 45 to 59 Minutes | 19 (8.6%) | 3 (1.8%) |
| 60 to 89 Minutes | 15 (6.8%) | 0 (0.0%) |
| 90 or more Minutes | 0 (0.0%) | 0 (0.0%) |
Time of Departure to Work by Sex in Castle Dale
The most frequent times of departure to work in Castle Dale are 6:00 AM to 6:29 AM (32, 14.5%) for males and 6:30 AM to 6:59 AM (33, 19.8%) for females.
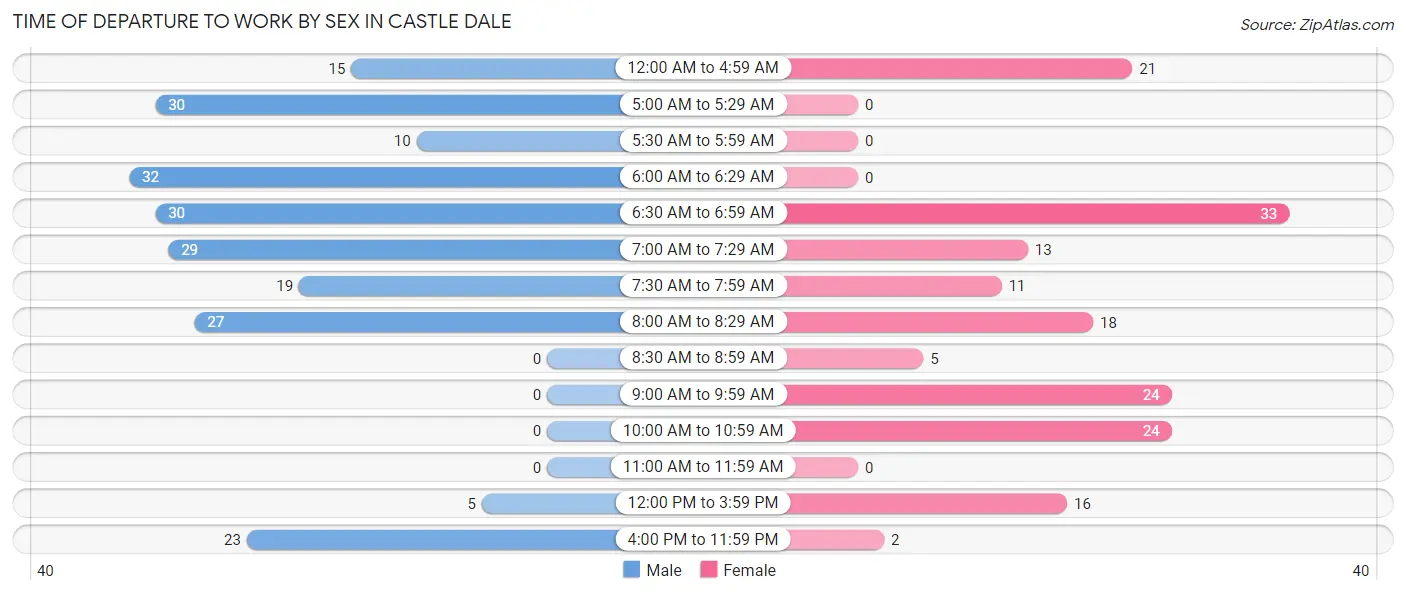
| Time of Departure | Male | Female |
| 12:00 AM to 4:59 AM | 15 (6.8%) | 21 (12.6%) |
| 5:00 AM to 5:29 AM | 30 (13.6%) | 0 (0.0%) |
| 5:30 AM to 5:59 AM | 10 (4.5%) | 0 (0.0%) |
| 6:00 AM to 6:29 AM | 32 (14.5%) | 0 (0.0%) |
| 6:30 AM to 6:59 AM | 30 (13.6%) | 33 (19.8%) |
| 7:00 AM to 7:29 AM | 29 (13.2%) | 13 (7.8%) |
| 7:30 AM to 7:59 AM | 19 (8.6%) | 11 (6.6%) |
| 8:00 AM to 8:29 AM | 27 (12.3%) | 18 (10.8%) |
| 8:30 AM to 8:59 AM | 0 (0.0%) | 5 (3.0%) |
| 9:00 AM to 9:59 AM | 0 (0.0%) | 24 (14.4%) |
| 10:00 AM to 10:59 AM | 0 (0.0%) | 24 (14.4%) |
| 11:00 AM to 11:59 AM | 0 (0.0%) | 0 (0.0%) |
| 12:00 PM to 3:59 PM | 5 (2.3%) | 16 (9.6%) |
| 4:00 PM to 11:59 PM | 23 (10.4%) | 2 (1.2%) |
| Total | 220 (100.0%) | 167 (100.0%) |
Housing Occupancy in Castle Dale
Occupancy by Ownership in Castle Dale
Of the total 472 dwellings in Castle Dale, owner-occupied units account for 387 (82.0%), while renter-occupied units make up 85 (18.0%).
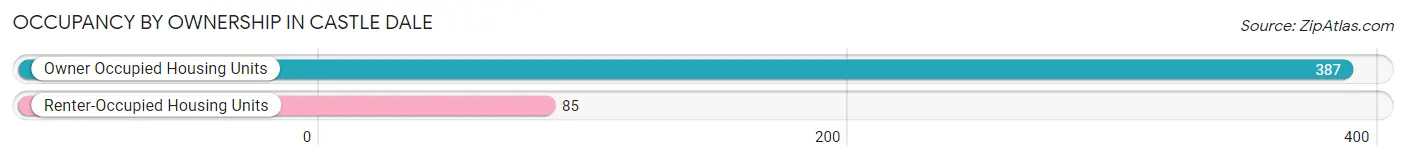
| Occupancy | # Housing Units | % Housing Units |
| Owner Occupied Housing Units | 387 | 82.0% |
| Renter-Occupied Housing Units | 85 | 18.0% |
| Total Occupied Housing Units | 472 | 100.0% |
Occupancy by Household Size in Castle Dale
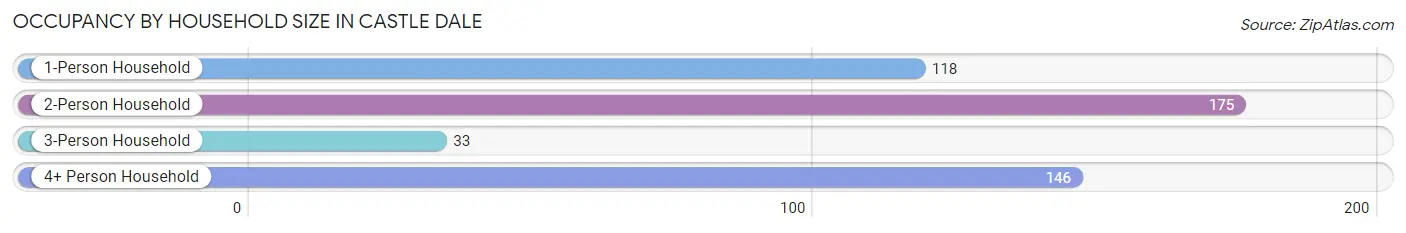
| Household Size | # Housing Units | % Housing Units |
| 1-Person Household | 118 | 25.0% |
| 2-Person Household | 175 | 37.1% |
| 3-Person Household | 33 | 7.0% |
| 4+ Person Household | 146 | 30.9% |
| Total Housing Units | 472 | 100.0% |
Occupancy by Ownership by Household Size in Castle Dale
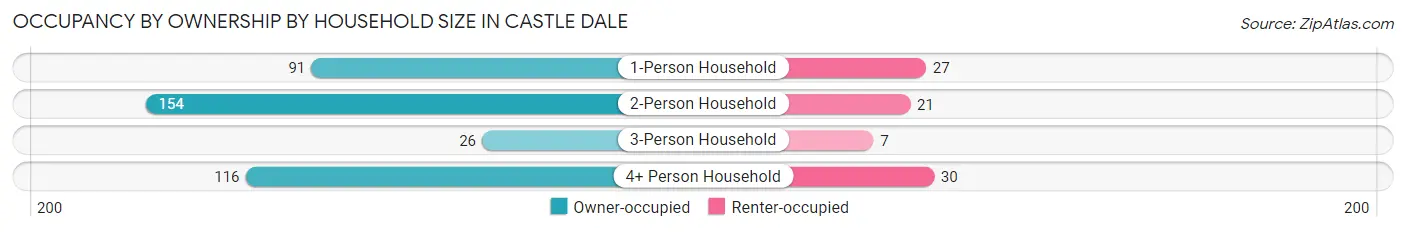
| Household Size | Owner-occupied | Renter-occupied |
| 1-Person Household | 91 (77.1%) | 27 (22.9%) |
| 2-Person Household | 154 (88.0%) | 21 (12.0%) |
| 3-Person Household | 26 (78.8%) | 7 (21.2%) |
| 4+ Person Household | 116 (79.4%) | 30 (20.5%) |
| Total Housing Units | 387 (82.0%) | 85 (18.0%) |
Occupancy by Educational Attainment in Castle Dale
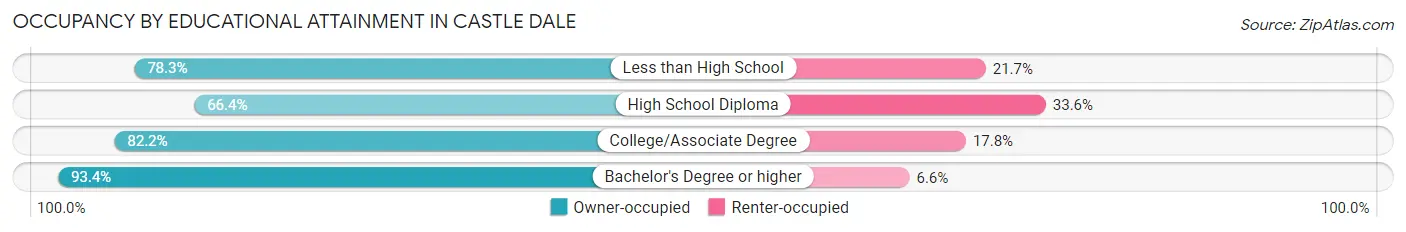
| Household Size | Owner-occupied | Renter-occupied |
| Less than High School | 18 (78.3%) | 5 (21.7%) |
| High School Diploma | 71 (66.4%) | 36 (33.6%) |
| College/Associate Degree | 157 (82.2%) | 34 (17.8%) |
| Bachelor's Degree or higher | 141 (93.4%) | 10 (6.6%) |
Occupancy by Age of Householder in Castle Dale
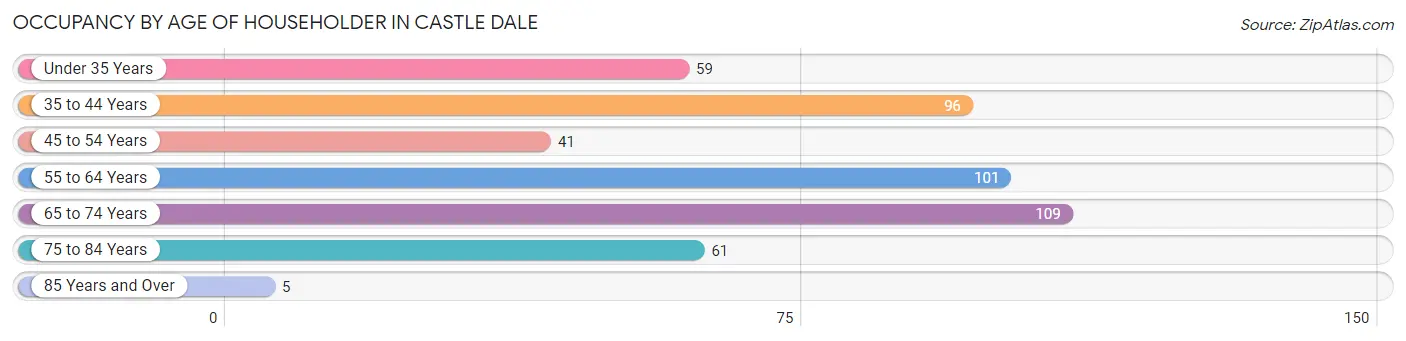
| Age Bracket | # Households | % Households |
| Under 35 Years | 59 | 12.5% |
| 35 to 44 Years | 96 | 20.3% |
| 45 to 54 Years | 41 | 8.7% |
| 55 to 64 Years | 101 | 21.4% |
| 65 to 74 Years | 109 | 23.1% |
| 75 to 84 Years | 61 | 12.9% |
| 85 Years and Over | 5 | 1.1% |
| Total | 472 | 100.0% |
Housing Finances in Castle Dale
Median Income by Occupancy in Castle Dale
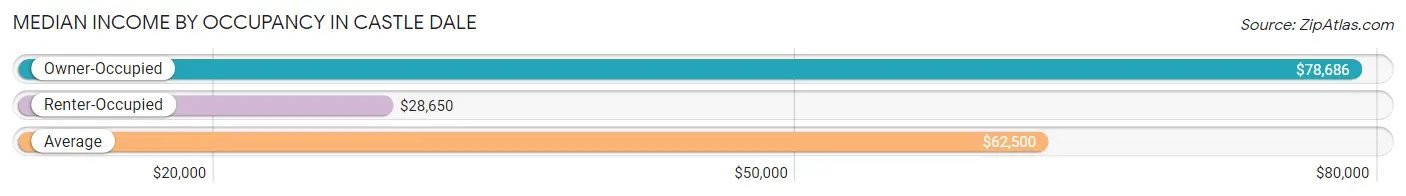
| Occupancy Type | # Households | Median Income |
| Owner-Occupied | 387 (82.0%) | $78,686 |
| Renter-Occupied | 85 (18.0%) | $28,650 |
| Average | 472 (100.0%) | $62,500 |
Occupancy by Householder Income Bracket in Castle Dale
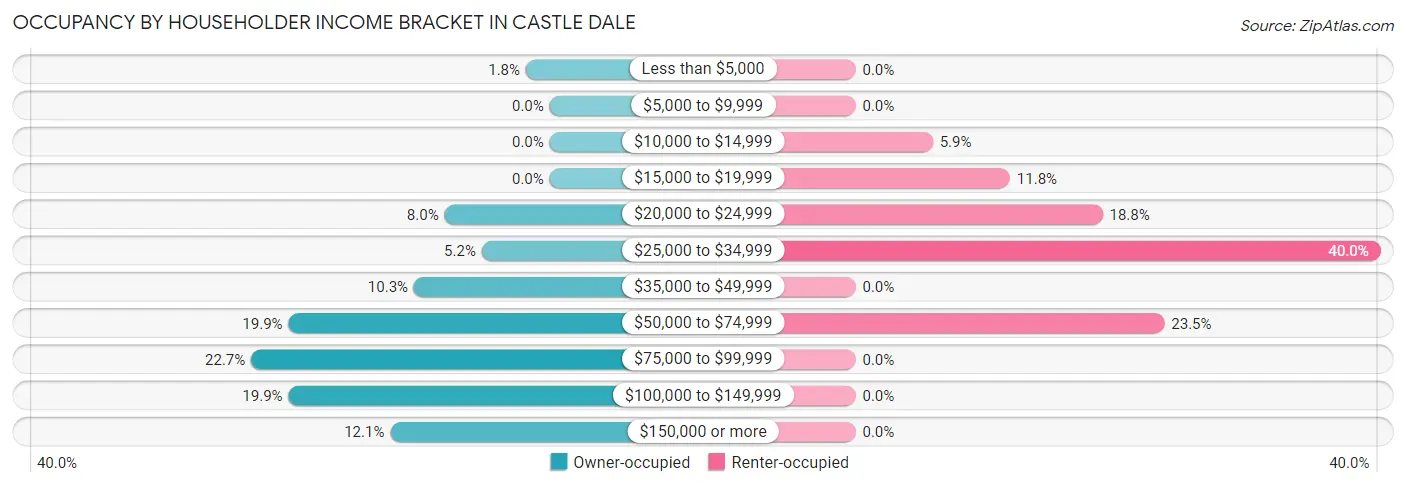
| Income Bracket | Owner-occupied | Renter-occupied |
| Less than $5,000 | 7 (1.8%) | 0 (0.0%) |
| $5,000 to $9,999 | 0 (0.0%) | 0 (0.0%) |
| $10,000 to $14,999 | 0 (0.0%) | 5 (5.9%) |
| $15,000 to $19,999 | 0 (0.0%) | 10 (11.8%) |
| $20,000 to $24,999 | 31 (8.0%) | 16 (18.8%) |
| $25,000 to $34,999 | 20 (5.2%) | 34 (40.0%) |
| $35,000 to $49,999 | 40 (10.3%) | 0 (0.0%) |
| $50,000 to $74,999 | 77 (19.9%) | 20 (23.5%) |
| $75,000 to $99,999 | 88 (22.7%) | 0 (0.0%) |
| $100,000 to $149,999 | 77 (19.9%) | 0 (0.0%) |
| $150,000 or more | 47 (12.1%) | 0 (0.0%) |
| Total | 387 (100.0%) | 85 (100.0%) |
Monthly Housing Cost Tiers in Castle Dale
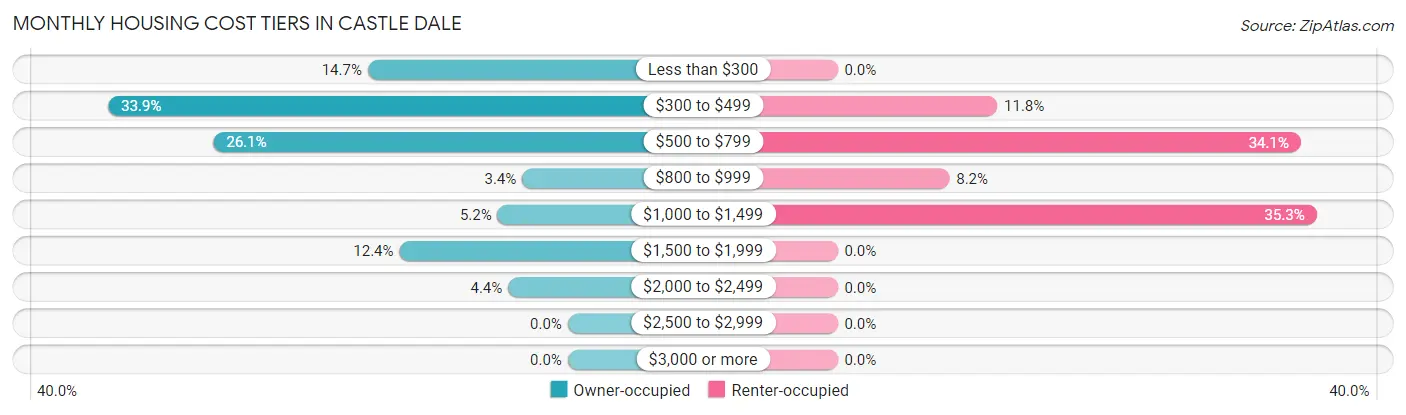
| Monthly Cost | Owner-occupied | Renter-occupied |
| Less than $300 | 57 (14.7%) | 0 (0.0%) |
| $300 to $499 | 131 (33.9%) | 10 (11.8%) |
| $500 to $799 | 101 (26.1%) | 29 (34.1%) |
| $800 to $999 | 13 (3.4%) | 7 (8.2%) |
| $1,000 to $1,499 | 20 (5.2%) | 30 (35.3%) |
| $1,500 to $1,999 | 48 (12.4%) | 0 (0.0%) |
| $2,000 to $2,499 | 17 (4.4%) | 0 (0.0%) |
| $2,500 to $2,999 | 0 (0.0%) | 0 (0.0%) |
| $3,000 or more | 0 (0.0%) | 0 (0.0%) |
| Total | 387 (100.0%) | 85 (100.0%) |
Physical Housing Characteristics in Castle Dale
Housing Structures in Castle Dale
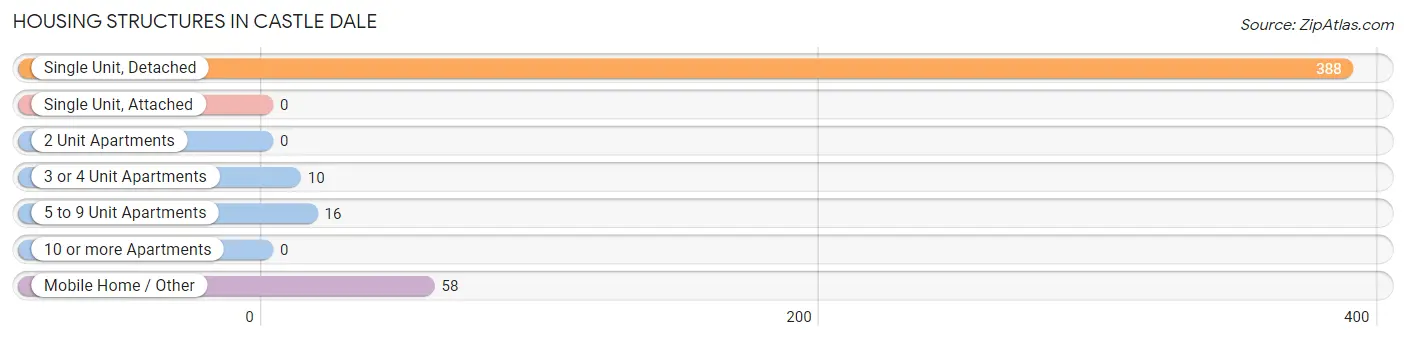
| Structure Type | # Housing Units | % Housing Units |
| Single Unit, Detached | 388 | 82.2% |
| Single Unit, Attached | 0 | 0.0% |
| 2 Unit Apartments | 0 | 0.0% |
| 3 or 4 Unit Apartments | 10 | 2.1% |
| 5 to 9 Unit Apartments | 16 | 3.4% |
| 10 or more Apartments | 0 | 0.0% |
| Mobile Home / Other | 58 | 12.3% |
| Total | 472 | 100.0% |
Housing Structures by Occupancy in Castle Dale
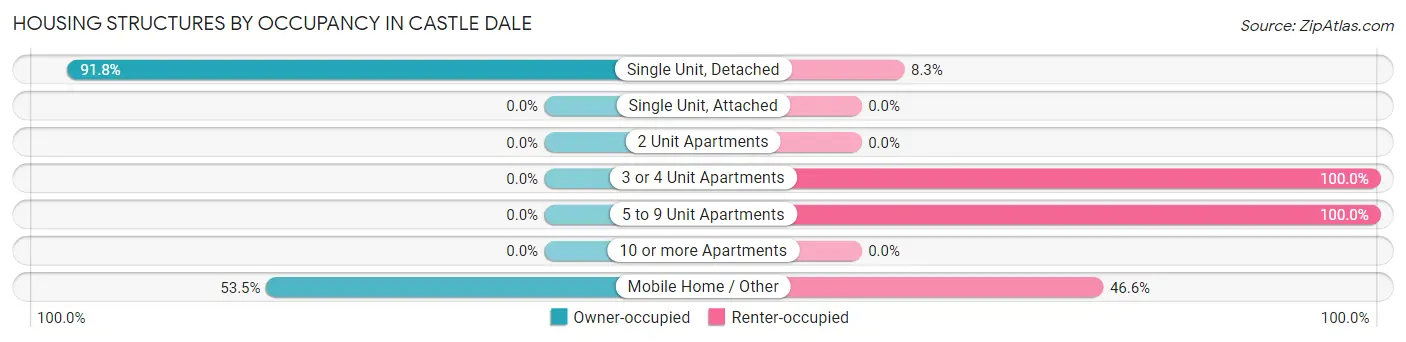
| Structure Type | Owner-occupied | Renter-occupied |
| Single Unit, Detached | 356 (91.7%) | 32 (8.3%) |
| Single Unit, Attached | 0 (0.0%) | 0 (0.0%) |
| 2 Unit Apartments | 0 (0.0%) | 0 (0.0%) |
| 3 or 4 Unit Apartments | 0 (0.0%) | 10 (100.0%) |
| 5 to 9 Unit Apartments | 0 (0.0%) | 16 (100.0%) |
| 10 or more Apartments | 0 (0.0%) | 0 (0.0%) |
| Mobile Home / Other | 31 (53.4%) | 27 (46.6%) |
| Total | 387 (82.0%) | 85 (18.0%) |
Housing Structures by Number of Rooms in Castle Dale
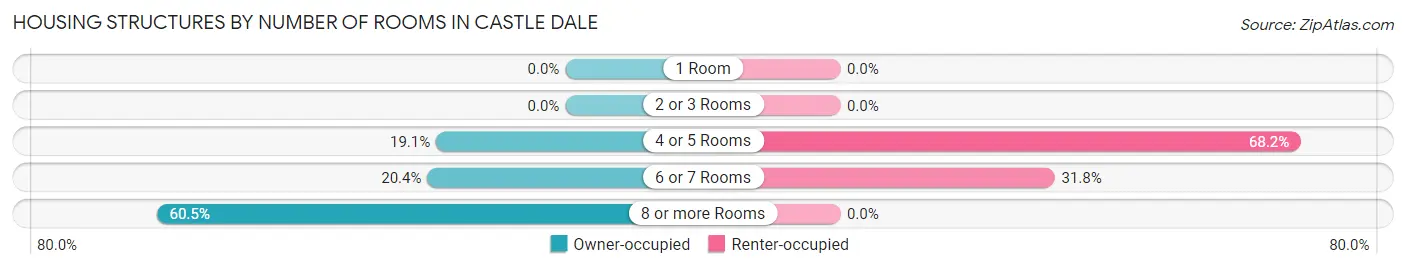
| Number of Rooms | Owner-occupied | Renter-occupied |
| 1 Room | 0 (0.0%) | 0 (0.0%) |
| 2 or 3 Rooms | 0 (0.0%) | 0 (0.0%) |
| 4 or 5 Rooms | 74 (19.1%) | 58 (68.2%) |
| 6 or 7 Rooms | 79 (20.4%) | 27 (31.8%) |
| 8 or more Rooms | 234 (60.5%) | 0 (0.0%) |
| Total | 387 (100.0%) | 85 (100.0%) |
Housing Structure by Heating Type in Castle Dale
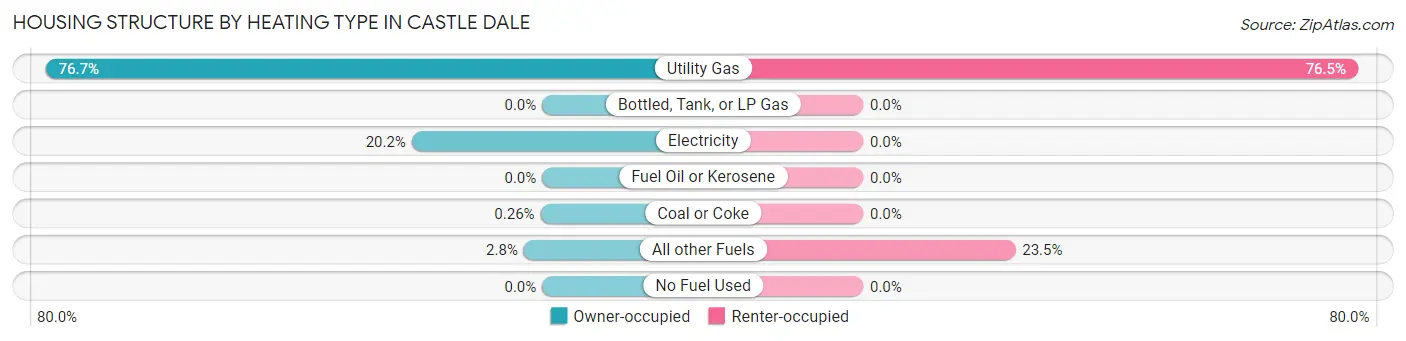
| Heating Type | Owner-occupied | Renter-occupied |
| Utility Gas | 297 (76.7%) | 65 (76.5%) |
| Bottled, Tank, or LP Gas | 0 (0.0%) | 0 (0.0%) |
| Electricity | 78 (20.2%) | 0 (0.0%) |
| Fuel Oil or Kerosene | 0 (0.0%) | 0 (0.0%) |
| Coal or Coke | 1 (0.3%) | 0 (0.0%) |
| All other Fuels | 11 (2.8%) | 20 (23.5%) |
| No Fuel Used | 0 (0.0%) | 0 (0.0%) |
| Total | 387 (100.0%) | 85 (100.0%) |
Household Vehicle Usage in Castle Dale
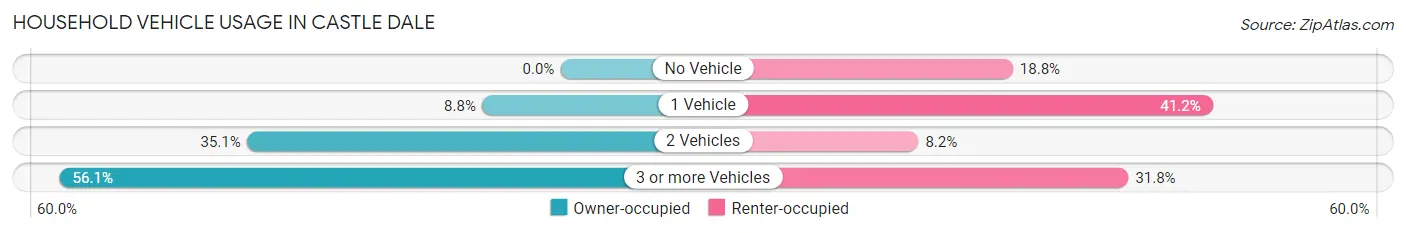
| Vehicles per Household | Owner-occupied | Renter-occupied |
| No Vehicle | 0 (0.0%) | 16 (18.8%) |
| 1 Vehicle | 34 (8.8%) | 35 (41.2%) |
| 2 Vehicles | 136 (35.1%) | 7 (8.2%) |
| 3 or more Vehicles | 217 (56.1%) | 27 (31.8%) |
| Total | 387 (100.0%) | 85 (100.0%) |
Real Estate & Mortgages in Castle Dale
Real Estate and Mortgage Overview in Castle Dale
| Characteristic | Without Mortgage | With Mortgage |
| Housing Units | 271 | 116 |
| Median Property Value | $146,800 | $219,400 |
| Median Household Income | $77,917 | $16 |
| Monthly Housing Costs | $403 | $0 |
| Real Estate Taxes | $1,215 | $0 |
Property Value by Mortgage Status in Castle Dale
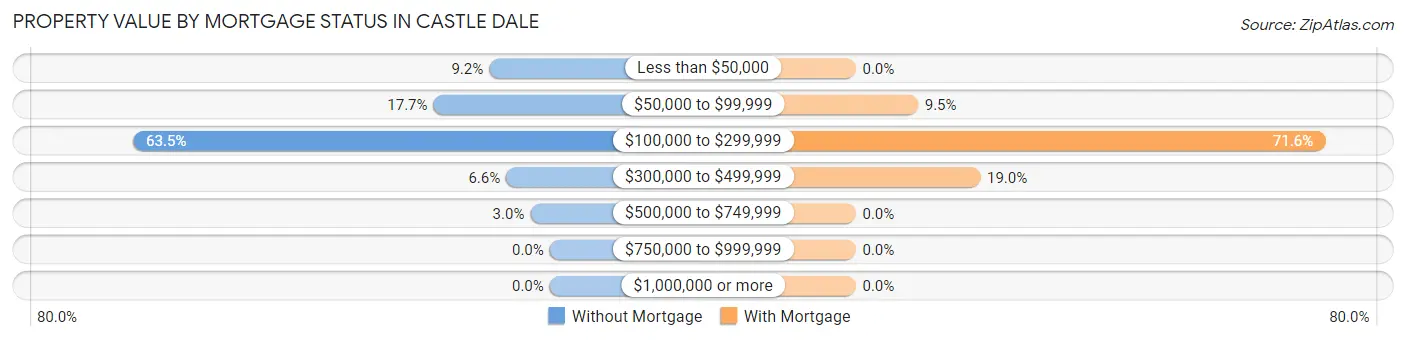
| Property Value | Without Mortgage | With Mortgage |
| Less than $50,000 | 25 (9.2%) | 0 (0.0%) |
| $50,000 to $99,999 | 48 (17.7%) | 11 (9.5%) |
| $100,000 to $299,999 | 172 (63.5%) | 83 (71.6%) |
| $300,000 to $499,999 | 18 (6.6%) | 22 (19.0%) |
| $500,000 to $749,999 | 8 (2.9%) | 0 (0.0%) |
| $750,000 to $999,999 | 0 (0.0%) | 0 (0.0%) |
| $1,000,000 or more | 0 (0.0%) | 0 (0.0%) |
| Total | 271 (100.0%) | 116 (100.0%) |
Household Income by Mortgage Status in Castle Dale
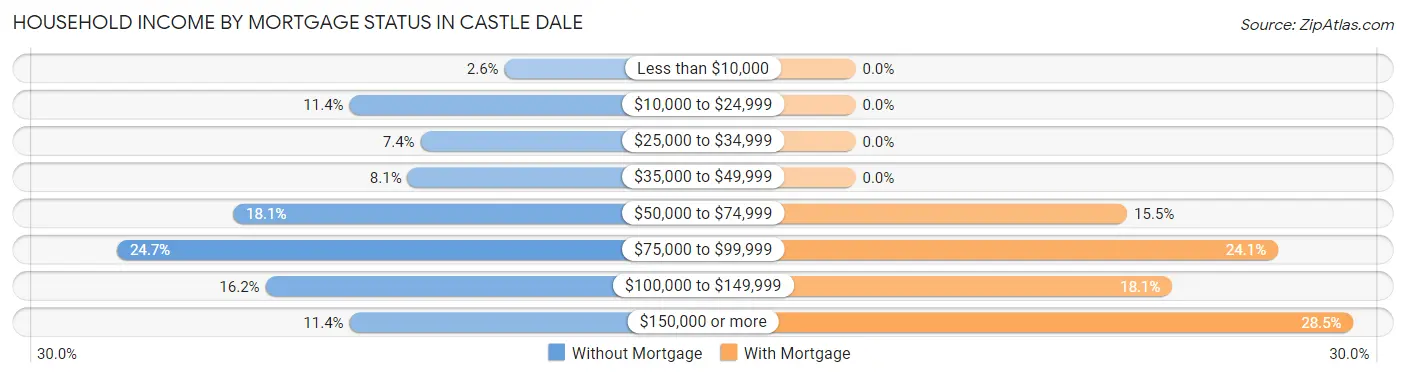
| Household Income | Without Mortgage | With Mortgage |
| Less than $10,000 | 7 (2.6%) | 0 (0.0%) |
| $10,000 to $24,999 | 31 (11.4%) | 0 (0.0%) |
| $25,000 to $34,999 | 20 (7.4%) | 0 (0.0%) |
| $35,000 to $49,999 | 22 (8.1%) | 0 (0.0%) |
| $50,000 to $74,999 | 49 (18.1%) | 18 (15.5%) |
| $75,000 to $99,999 | 67 (24.7%) | 28 (24.1%) |
| $100,000 to $149,999 | 44 (16.2%) | 21 (18.1%) |
| $150,000 or more | 31 (11.4%) | 33 (28.4%) |
| Total | 271 (100.0%) | 116 (100.0%) |
Property Value to Household Income Ratio in Castle Dale
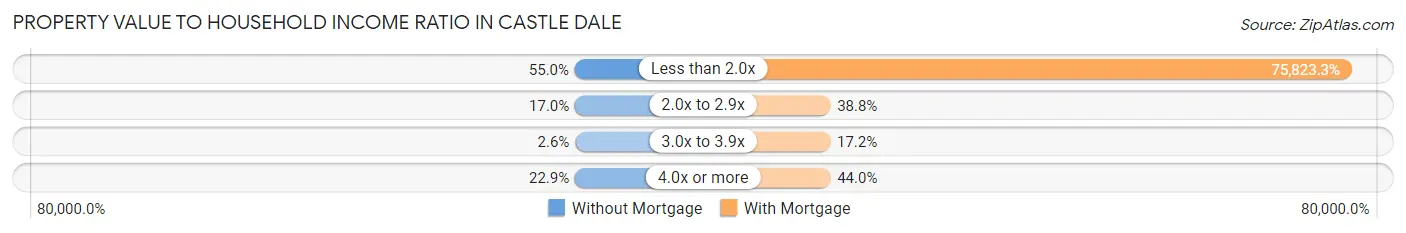
| Value-to-Income Ratio | Without Mortgage | With Mortgage |
| Less than 2.0x | 149 (55.0%) | 87,955 (75,823.3%) |
| 2.0x to 2.9x | 46 (17.0%) | 45 (38.8%) |
| 3.0x to 3.9x | 7 (2.6%) | 20 (17.2%) |
| 4.0x or more | 62 (22.9%) | 51 (44.0%) |
| Total | 271 (100.0%) | 116 (100.0%) |
Real Estate Taxes by Mortgage Status in Castle Dale
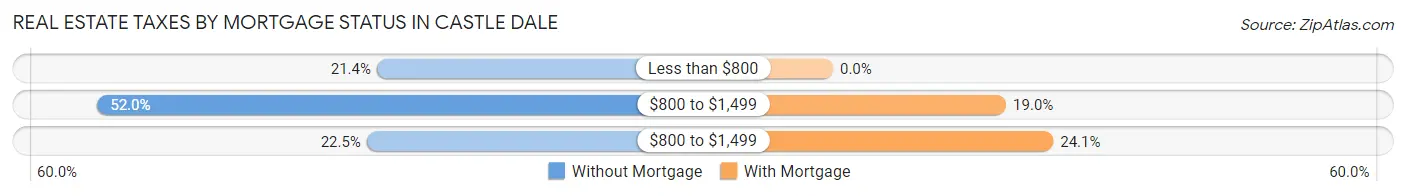
| Property Taxes | Without Mortgage | With Mortgage |
| Less than $800 | 58 (21.4%) | 0 (0.0%) |
| $800 to $1,499 | 141 (52.0%) | 22 (19.0%) |
| $800 to $1,499 | 61 (22.5%) | 28 (24.1%) |
| Total | 271 (100.0%) | 116 (100.0%) |
Health & Disability in Castle Dale
Health Insurance Coverage by Age in Castle Dale
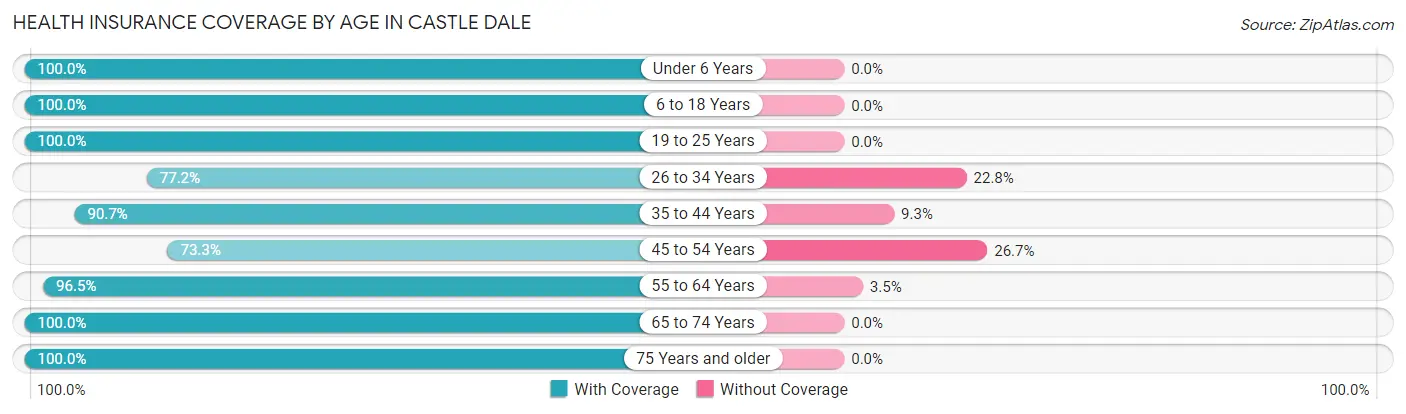
| Age Bracket | With Coverage | Without Coverage |
| Under 6 Years | 96 (100.0%) | 0 (0.0%) |
| 6 to 18 Years | 359 (100.0%) | 0 (0.0%) |
| 19 to 25 Years | 70 (100.0%) | 0 (0.0%) |
| 26 to 34 Years | 88 (77.2%) | 26 (22.8%) |
| 35 to 44 Years | 156 (90.7%) | 16 (9.3%) |
| 45 to 54 Years | 55 (73.3%) | 20 (26.7%) |
| 55 to 64 Years | 167 (96.5%) | 6 (3.5%) |
| 65 to 74 Years | 184 (100.0%) | 0 (0.0%) |
| 75 Years and older | 104 (100.0%) | 0 (0.0%) |
| Total | 1,279 (95.0%) | 68 (5.1%) |
Health Insurance Coverage by Citizenship Status in Castle Dale
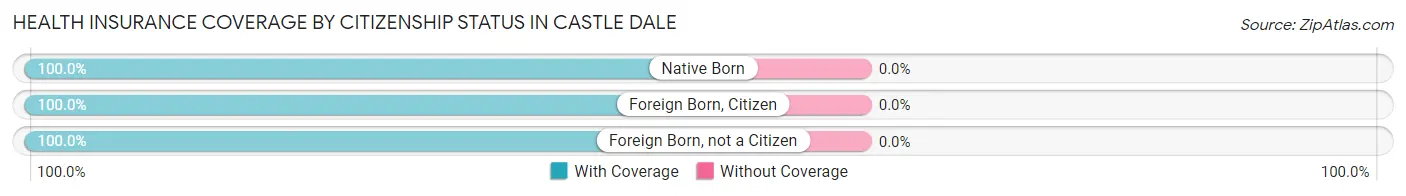
| Citizenship Status | With Coverage | Without Coverage |
| Native Born | 96 (100.0%) | 0 (0.0%) |
| Foreign Born, Citizen | 359 (100.0%) | 0 (0.0%) |
| Foreign Born, not a Citizen | 70 (100.0%) | 0 (0.0%) |
Health Insurance Coverage by Household Income in Castle Dale
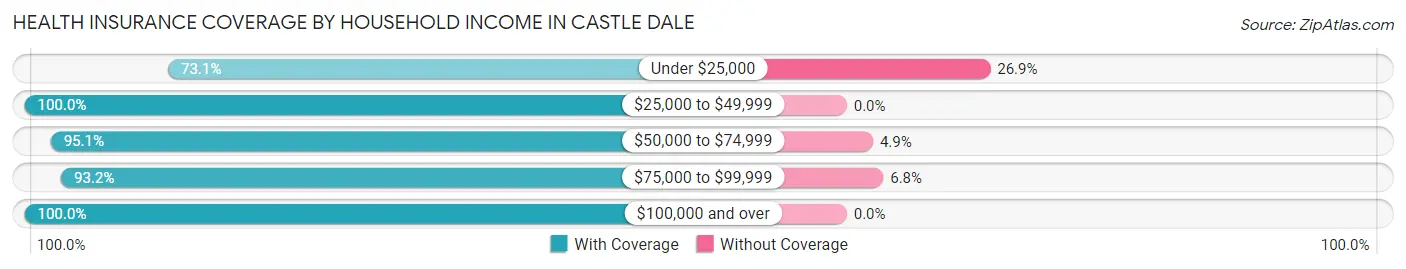
| Household Income | With Coverage | Without Coverage |
| Under $25,000 | 117 (73.1%) | 43 (26.9%) |
| $25,000 to $49,999 | 270 (100.0%) | 0 (0.0%) |
| $50,000 to $74,999 | 233 (95.1%) | 12 (4.9%) |
| $75,000 to $99,999 | 177 (93.2%) | 13 (6.8%) |
| $100,000 and over | 482 (100.0%) | 0 (0.0%) |
Public vs Private Health Insurance Coverage by Age in Castle Dale
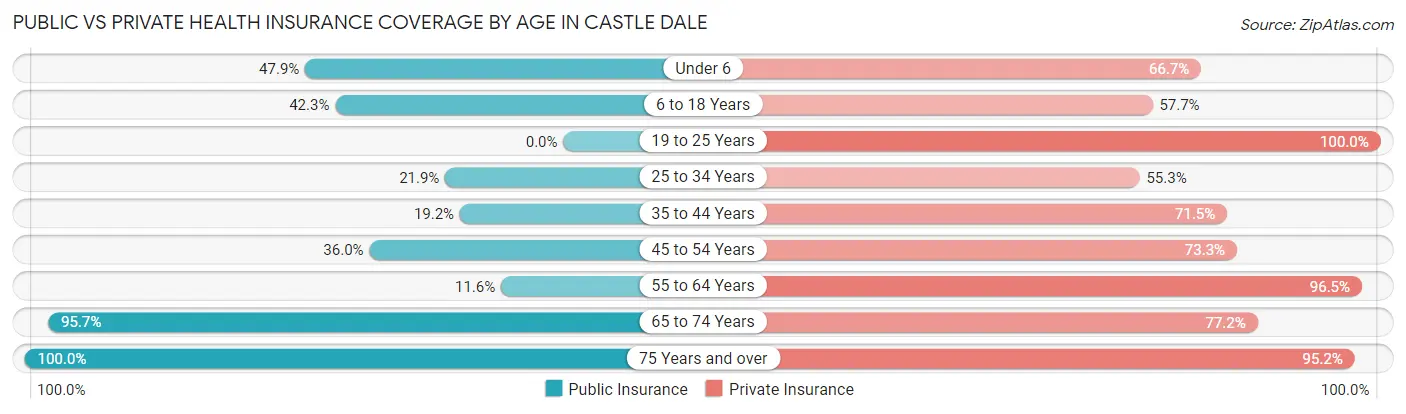
| Age Bracket | Public Insurance | Private Insurance |
| Under 6 | 46 (47.9%) | 64 (66.7%) |
| 6 to 18 Years | 152 (42.3%) | 207 (57.7%) |
| 19 to 25 Years | 0 (0.0%) | 70 (100.0%) |
| 25 to 34 Years | 25 (21.9%) | 63 (55.3%) |
| 35 to 44 Years | 33 (19.2%) | 123 (71.5%) |
| 45 to 54 Years | 27 (36.0%) | 55 (73.3%) |
| 55 to 64 Years | 20 (11.6%) | 167 (96.5%) |
| 65 to 74 Years | 176 (95.7%) | 142 (77.2%) |
| 75 Years and over | 104 (100.0%) | 99 (95.2%) |
| Total | 583 (43.3%) | 990 (73.5%) |
Disability Status by Sex by Age in Castle Dale
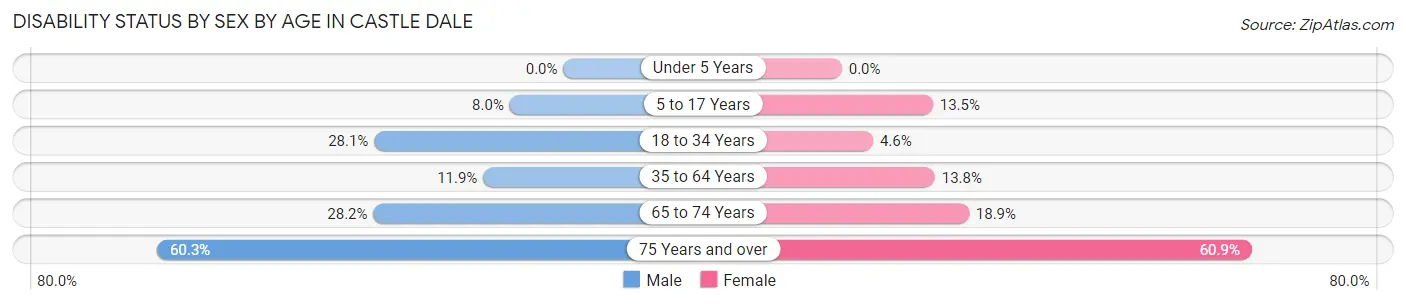
| Age Bracket | Male | Female |
| Under 5 Years | 0 (0.0%) | 0 (0.0%) |
| 5 to 17 Years | 18 (8.0%) | 20 (13.5%) |
| 18 to 34 Years | 25 (28.1%) | 5 (4.6%) |
| 35 to 64 Years | 25 (11.9%) | 29 (13.8%) |
| 65 to 74 Years | 22 (28.2%) | 20 (18.9%) |
| 75 Years and over | 35 (60.3%) | 28 (60.9%) |
Disability Class by Sex by Age in Castle Dale
Disability Class: Hearing Difficulty
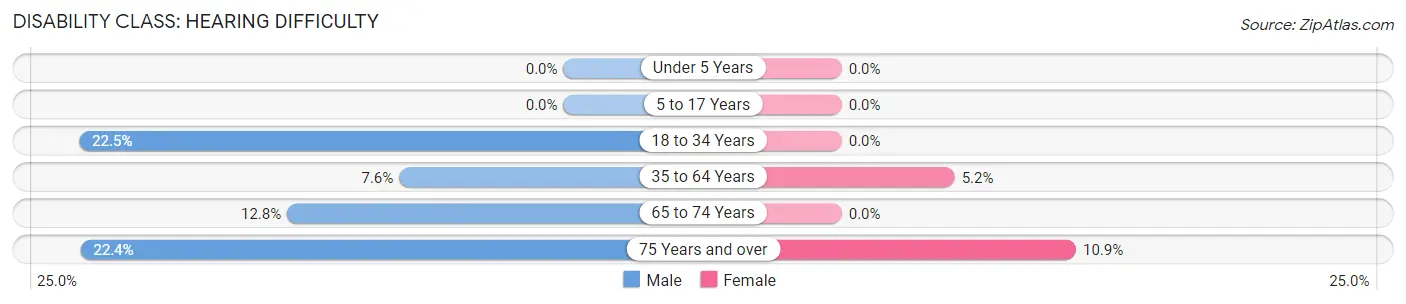
| Age Bracket | Male | Female |
| Under 5 Years | 0 (0.0%) | 0 (0.0%) |
| 5 to 17 Years | 0 (0.0%) | 0 (0.0%) |
| 18 to 34 Years | 20 (22.5%) | 0 (0.0%) |
| 35 to 64 Years | 16 (7.6%) | 11 (5.2%) |
| 65 to 74 Years | 10 (12.8%) | 0 (0.0%) |
| 75 Years and over | 13 (22.4%) | 5 (10.9%) |
Disability Class: Vision Difficulty
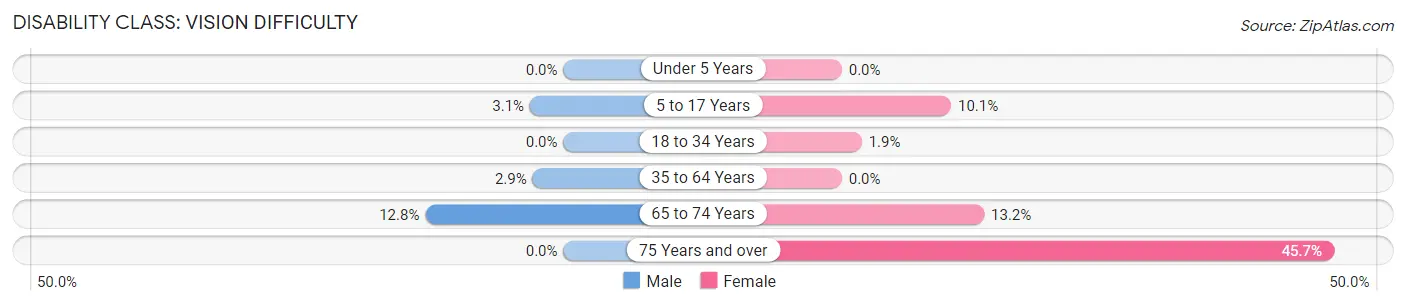
| Age Bracket | Male | Female |
| Under 5 Years | 0 (0.0%) | 0 (0.0%) |
| 5 to 17 Years | 7 (3.1%) | 15 (10.1%) |
| 18 to 34 Years | 0 (0.0%) | 2 (1.8%) |
| 35 to 64 Years | 6 (2.9%) | 0 (0.0%) |
| 65 to 74 Years | 10 (12.8%) | 14 (13.2%) |
| 75 Years and over | 0 (0.0%) | 21 (45.7%) |
Disability Class: Cognitive Difficulty
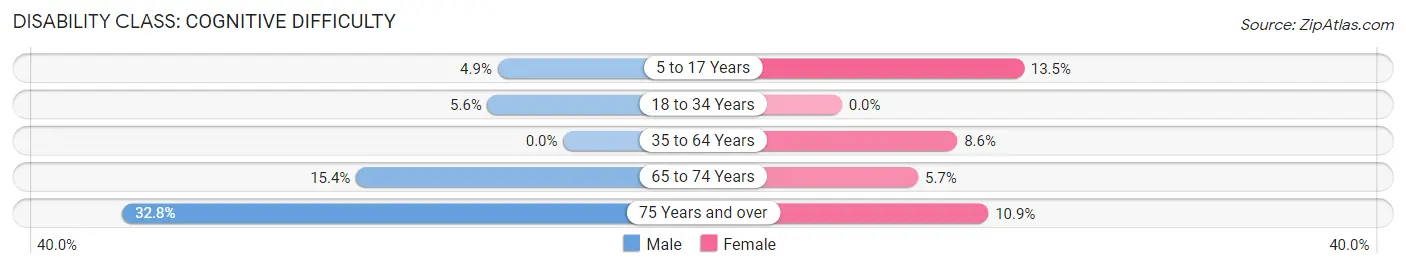
| Age Bracket | Male | Female |
| 5 to 17 Years | 11 (4.9%) | 20 (13.5%) |
| 18 to 34 Years | 5 (5.6%) | 0 (0.0%) |
| 35 to 64 Years | 0 (0.0%) | 18 (8.6%) |
| 65 to 74 Years | 12 (15.4%) | 6 (5.7%) |
| 75 Years and over | 19 (32.8%) | 5 (10.9%) |
Disability Class: Ambulatory Difficulty
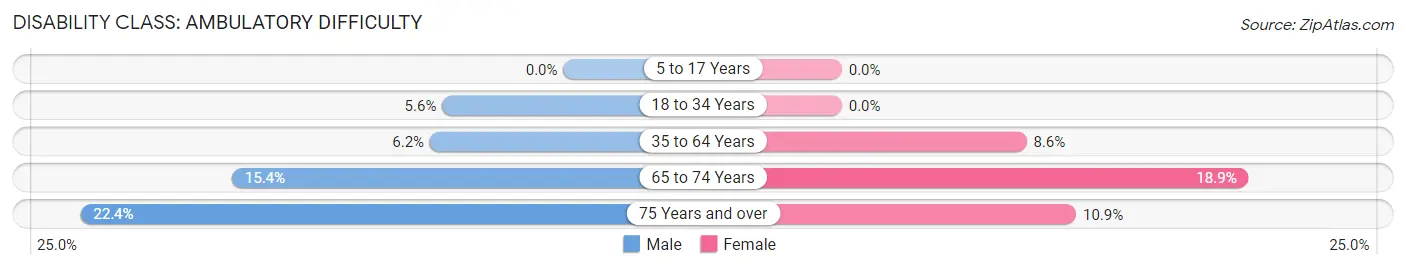
| Age Bracket | Male | Female |
| 5 to 17 Years | 0 (0.0%) | 0 (0.0%) |
| 18 to 34 Years | 5 (5.6%) | 0 (0.0%) |
| 35 to 64 Years | 13 (6.2%) | 18 (8.6%) |
| 65 to 74 Years | 12 (15.4%) | 20 (18.9%) |
| 75 Years and over | 13 (22.4%) | 5 (10.9%) |
Disability Class: Self-Care Difficulty
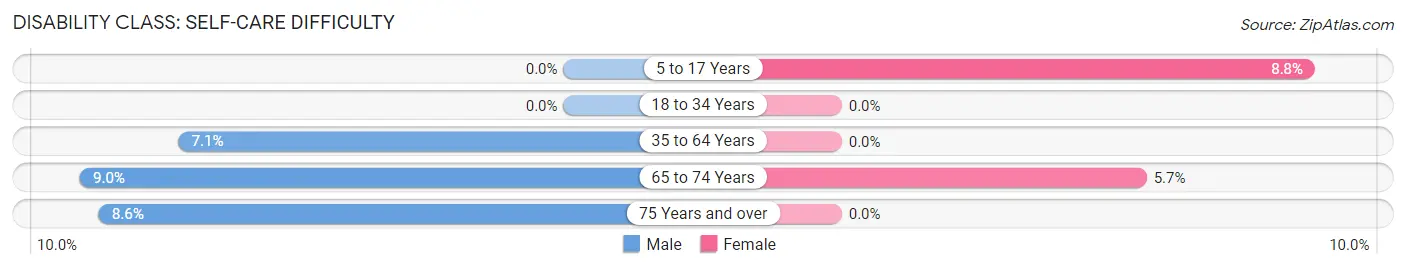
| Age Bracket | Male | Female |
| 5 to 17 Years | 0 (0.0%) | 13 (8.8%) |
| 18 to 34 Years | 0 (0.0%) | 0 (0.0%) |
| 35 to 64 Years | 15 (7.1%) | 0 (0.0%) |
| 65 to 74 Years | 7 (9.0%) | 6 (5.7%) |
| 75 Years and over | 5 (8.6%) | 0 (0.0%) |
Technology Access in Castle Dale
Computing Device Access in Castle Dale
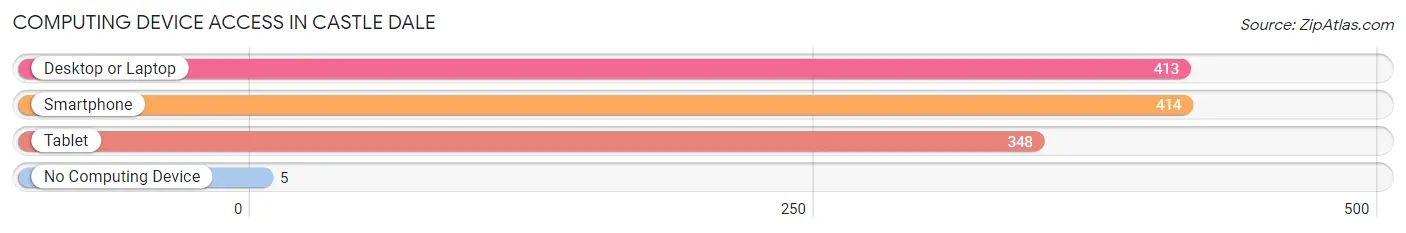
| Device Type | # Households | % Households |
| Desktop or Laptop | 413 | 87.5% |
| Smartphone | 414 | 87.7% |
| Tablet | 348 | 73.7% |
| No Computing Device | 5 | 1.1% |
| Total | 472 | 100.0% |
Internet Access in Castle Dale
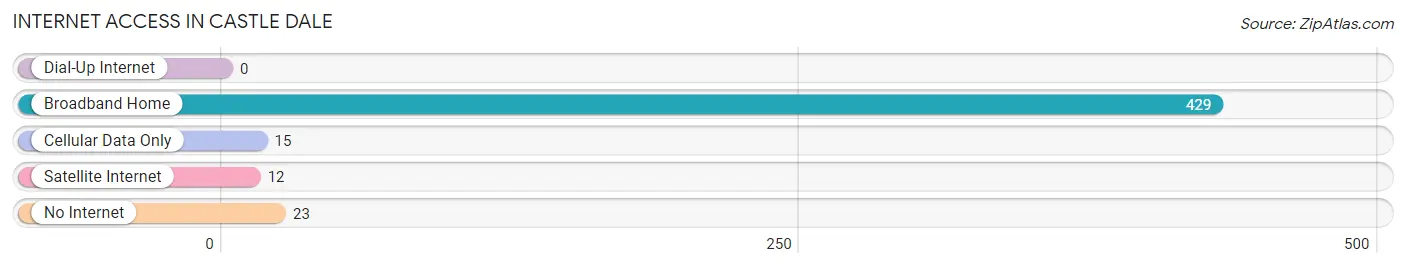
| Internet Type | # Households | % Households |
| Dial-Up Internet | 0 | 0.0% |
| Broadband Home | 429 | 90.9% |
| Cellular Data Only | 15 | 3.2% |
| Satellite Internet | 12 | 2.5% |
| No Internet | 23 | 4.9% |
| Total | 472 | 100.0% |
Castle Dale Summary
Castle Dale is a small city located in Emery County, Utah, United States. It is the county seat of Emery County and is located in the San Rafael Swell region of the state. The population of Castle Dale was 1,630 at the 2010 census.
History
The area that is now Castle Dale was first settled in 1877 by a group of Mormon pioneers led by John W. Van Cott. The settlement was originally known as Castle Valley, and the town was later renamed Castle Dale in honor of Dale LeBaron, a prominent local rancher.
The town was incorporated in 1891 and has since grown to become the largest city in Emery County. Castle Dale is the county seat of Emery County and is home to the Emery County Courthouse.
Geography
Castle Dale is located in the San Rafael Swell region of Utah, at the intersection of State Route 29 and State Route 10. The city is situated at an elevation of 5,890 feet (1,795 m) and is surrounded by the Manti-La Sal National Forest.
The city is located approximately 75 miles (121 km) south of Price, Utah, and approximately 150 miles (241 km) southeast of Salt Lake City.
Economy
The economy of Castle Dale is largely based on agriculture and mining. The city is home to several large coal mines, including the Deseret Power Plant, which is the largest coal-fired power plant in the United States.
The city is also home to several large agricultural operations, including the Castle Dale Dairy, which produces milk, cheese, and other dairy products.
Demographics
As of the 2010 census, there were 1,630 people, 602 households, and 437 families residing in the city. The population density was 1,092.3 people per square mile (422.2/km2). There were 667 housing units at an average density of 441.3 per square mile (170.2/km2). The racial makeup of the city was 94.2% White, 0.2% African American, 0.7% Native American, 0.2% Asian, 0.1% Pacific Islander, 2.7% from other races, and 1.9% from two or more races. Hispanic or Latino of any race were 5.2% of the population.
There were 602 households, out of which 33.2% had children under the age of 18 living with them, 54.3% were married couples living together, 10.3% had a female householder with no husband present, and 30.3% were non-families. 25.1% of all households were made up of individuals, and 11.3% had someone living alone who was 65 years of age or older. The average household size was 2.68 and the average family size was 3.20.
In the city, the population was spread out, with 28.2% under the age of 18, 8.2% from 18 to 24, 24.2% from 25 to 44, 24.2% from 45 to 64, and 15.2% who were 65 years of age or older. The median age was 37 years. For every 100 females, there were 97.2 males. For every 100 females age 18 and over, there were 94.2 males.
The median income for a household in the city was $37,500, and the median income for a family was $41,250. Males had a median income of $35,000 versus $20,000 for females. The per capita income for the city was $15,945. About 8.2% of families and 10.2% of the population were below the poverty line, including 11.3% of those under age 18 and 8.2% of those age 65 or over.
Common Questions
What is the Total Population of Castle Dale?
Total Population of Castle Dale is 1,347.
What is the Total Male Population of Castle Dale?
Total Male Population of Castle Dale is 701.
What is the Total Female Population of Castle Dale?
Total Female Population of Castle Dale is 646.
What is the Ratio of Males per 100 Females in Castle Dale?
There are 108.51 Males per 100 Females in Castle Dale.
What is the Ratio of Females per 100 Males in Castle Dale?
There are 92.15 Females per 100 Males in Castle Dale.
What is the Median Population Age in Castle Dale?
Median Population Age in Castle Dale is 36.4 Years.
What is the Average Family Size in Castle Dale
Average Family Size in Castle Dale is 3.5 People.
What is the Average Household Size in Castle Dale
Average Household Size in Castle Dale is 2.9 People.
What is Per Capita Income in Castle Dale?
Per Capita income in Castle Dale is $25,690.
What is the Median Family Income in Castle Dale?
Median Family Income in Castle Dale is $64,712.
What is the Median Household income in Castle Dale?
Median Household Income in Castle Dale is $62,500.
What is Income or Wage Gap in Castle Dale?
Income or Wage Gap in Castle Dale is 74.9%.
Women in Castle Dale earn 25.1 cents for every dollar earned by a man.
What is Family Income Deficit in Castle Dale?
Family Income Deficit in Castle Dale is $8,656.
Families that are below poverty line in Castle Dale earn $8,656 less on average than the poverty threshold level.
What is Inequality or Gini Index in Castle Dale?
Inequality or Gini Index in Castle Dale is 0.34.
How Large is the Labor Force in Castle Dale?
There are 435 People in the Labor Forcein in Castle Dale.
What is the Percentage of People in the Labor Force in Castle Dale?
45.0% of People are in the Labor Force in Castle Dale.
What is the Unemployment Rate in Castle Dale?
Unemployment Rate in Castle Dale is 3.9%.