Ballard, UT
Ballard Map
Ballard Overview
1,700
TOTAL POPULATION
871
MALE POPULATION
829
FEMALE POPULATION
105.07
MALES / 100 FEMALES
95.18
FEMALES / 100 MALES
33.7
MEDIAN AGE
4.0
AVG FAMILY SIZE
3.7
AVG HOUSEHOLD SIZE
$22,633
PER CAPITA INCOME
$77,500
AVG FAMILY INCOME
$73,833
AVG HOUSEHOLD INCOME
81.5%
WAGE / INCOME GAP [ % ]
18.5¢/ $1
WAGE / INCOME GAP [ $ ]
0.34
INEQUALITY / GINI INDEX
791
LABOR FORCE [ PEOPLE ]
63.9%
PERCENT IN LABOR FORCE
10.1%
UNEMPLOYMENT RATE
Ballard Area Codes
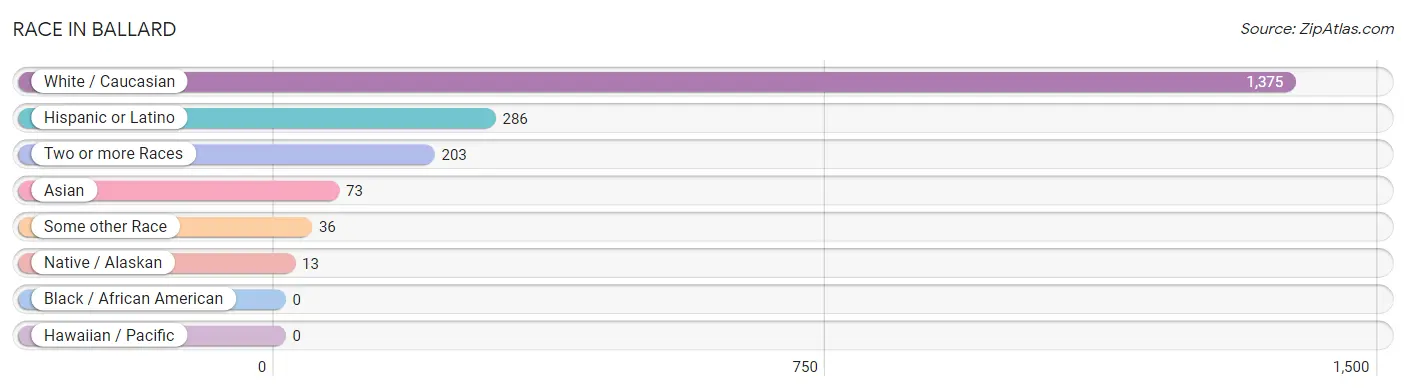
Race in Ballard
The most populous races in Ballard are White / Caucasian (1,375 | 80.9%), Hispanic or Latino (286 | 16.8%), and Two or more Races (203 | 11.9%).
| Race | # Population | % Population |
| Asian | 73 | 4.3% |
| Black / African American | 0 | 0.0% |
| Hawaiian / Pacific | 0 | 0.0% |
| Hispanic or Latino | 286 | 16.8% |
| Native / Alaskan | 13 | 0.8% |
| White / Caucasian | 1,375 | 80.9% |
| Two or more Races | 203 | 11.9% |
| Some other Race | 36 | 2.1% |
| Total | 1,700 | 100.0% |
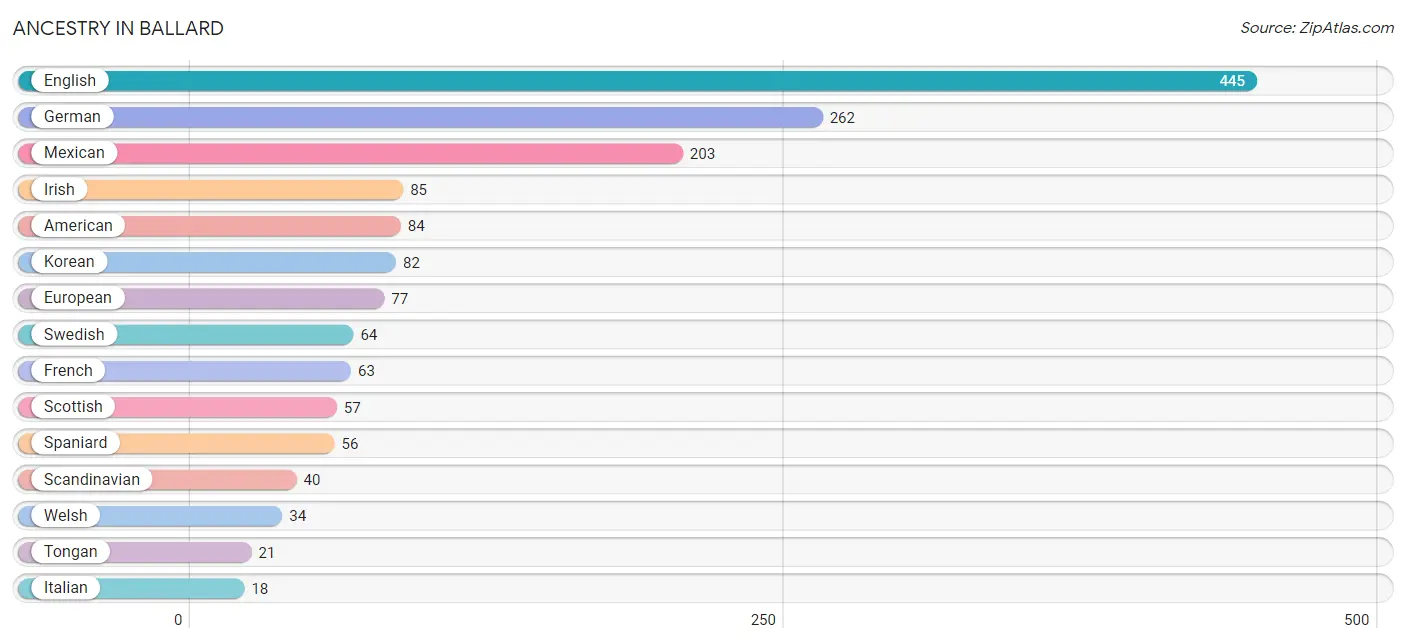
Ancestry in Ballard
The most populous ancestries reported in Ballard are English (445 | 26.2%), German (262 | 15.4%), Mexican (203 | 11.9%), Irish (85 | 5.0%), and American (84 | 4.9%), together accounting for 63.5% of all Ballard residents.
| Ancestry | # Population | % Population |
| American | 84 | 4.9% |
| Belgian | 2 | 0.1% |
| British | 12 | 0.7% |
| Central American | 17 | 1.0% |
| Cherokee | 3 | 0.2% |
| Danish | 15 | 0.9% |
| Dutch | 11 | 0.6% |
| English | 445 | 26.2% |
| European | 77 | 4.5% |
| French | 63 | 3.7% |
| German | 262 | 15.4% |
| Irish | 85 | 5.0% |
| Italian | 18 | 1.1% |
| Korean | 82 | 4.8% |
| Mexican | 203 | 11.9% |
| Nicaraguan | 17 | 1.0% |
| Norwegian | 7 | 0.4% |
| Paiute | 12 | 0.7% |
| Peruvian | 10 | 0.6% |
| Portuguese | 12 | 0.7% |
| Scandinavian | 40 | 2.4% |
| Scotch-Irish | 8 | 0.5% |
| Scottish | 57 | 3.4% |
| Shoshone | 4 | 0.2% |
| South American | 10 | 0.6% |
| Spaniard | 56 | 3.3% |
| Swedish | 64 | 3.8% |
| Swiss | 6 | 0.4% |
| Tongan | 21 | 1.2% |
| Ute | 9 | 0.5% |
| Welsh | 34 | 2.0% | View All 31 Rows |
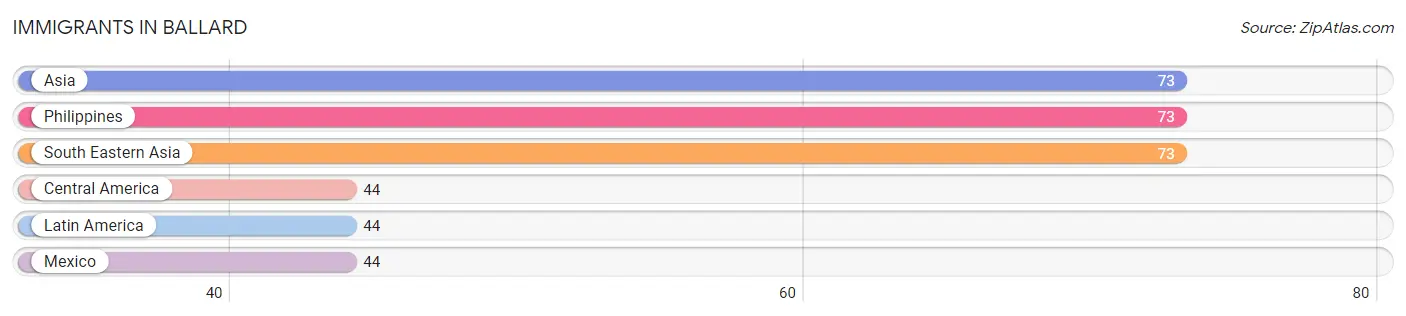
Immigrants in Ballard
The most numerous immigrant groups reported in Ballard came from Asia (73 | 4.3%), Philippines (73 | 4.3%), South Eastern Asia (73 | 4.3%), Central America (44 | 2.6%), and Latin America (44 | 2.6%), together accounting for 18.1% of all Ballard residents.
| Immigration Origin | # Population | % Population |
| Asia | 73 | 4.3% |
| Central America | 44 | 2.6% |
| Latin America | 44 | 2.6% |
| Mexico | 44 | 2.6% |
| Philippines | 73 | 4.3% |
| South Eastern Asia | 73 | 4.3% | View All 6 Rows |
Sex and Age in Ballard
Sex and Age in Ballard
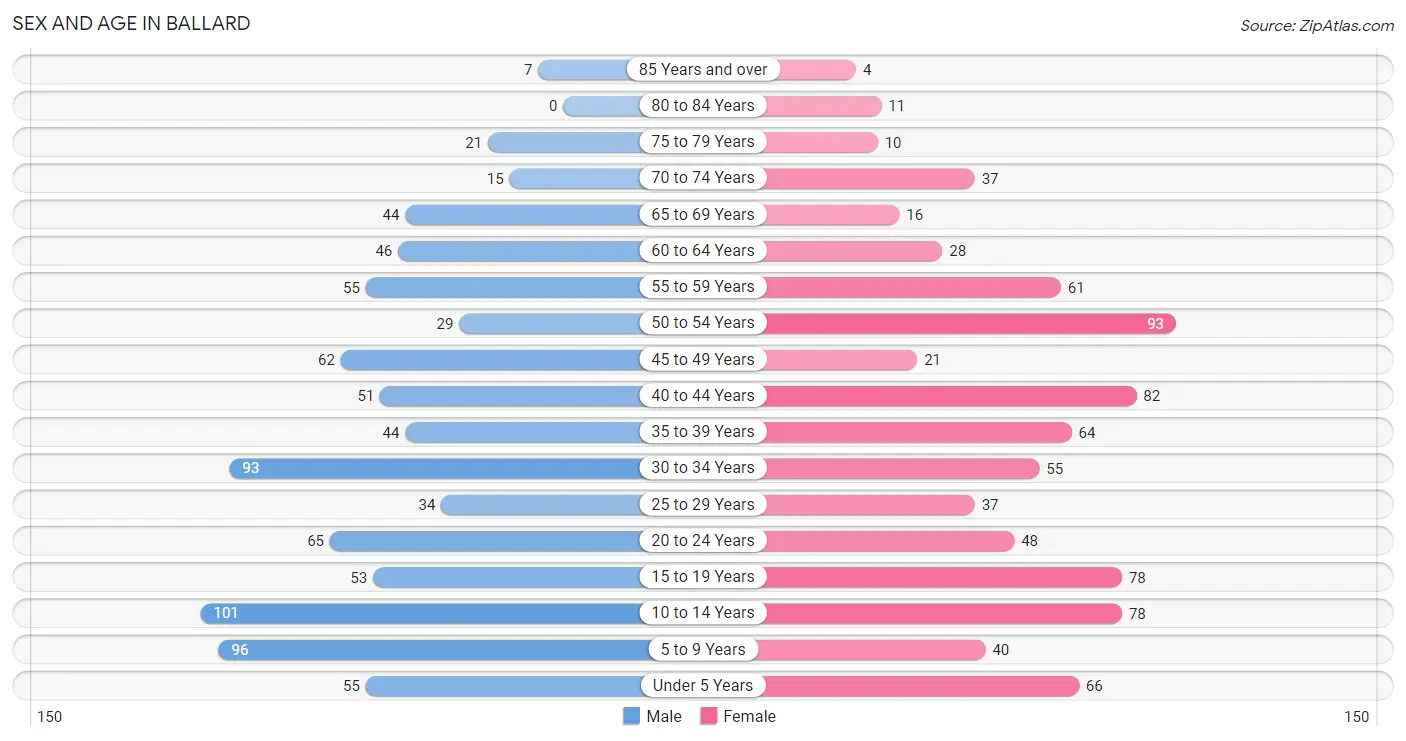
The most populous age groups in Ballard are 10 to 14 Years (101 | 11.6%) for men and 50 to 54 Years (93 | 11.2%) for women.
| Age Bracket | Male | Female |
| Under 5 Years | 55 (6.3%) | 66 (8.0%) |
| 5 to 9 Years | 96 (11.0%) | 40 (4.8%) |
| 10 to 14 Years | 101 (11.6%) | 78 (9.4%) |
| 15 to 19 Years | 53 (6.1%) | 78 (9.4%) |
| 20 to 24 Years | 65 (7.5%) | 48 (5.8%) |
| 25 to 29 Years | 34 (3.9%) | 37 (4.5%) |
| 30 to 34 Years | 93 (10.7%) | 55 (6.6%) |
| 35 to 39 Years | 44 (5.1%) | 64 (7.7%) |
| 40 to 44 Years | 51 (5.9%) | 82 (9.9%) |
| 45 to 49 Years | 62 (7.1%) | 21 (2.5%) |
| 50 to 54 Years | 29 (3.3%) | 93 (11.2%) |
| 55 to 59 Years | 55 (6.3%) | 61 (7.4%) |
| 60 to 64 Years | 46 (5.3%) | 28 (3.4%) |
| 65 to 69 Years | 44 (5.1%) | 16 (1.9%) |
| 70 to 74 Years | 15 (1.7%) | 37 (4.5%) |
| 75 to 79 Years | 21 (2.4%) | 10 (1.2%) |
| 80 to 84 Years | 0 (0.0%) | 11 (1.3%) |
| 85 Years and over | 7 (0.8%) | 4 (0.5%) |
| Total | 871 (100.0%) | 829 (100.0%) |
Families and Households in Ballard
Median Family Size in Ballard
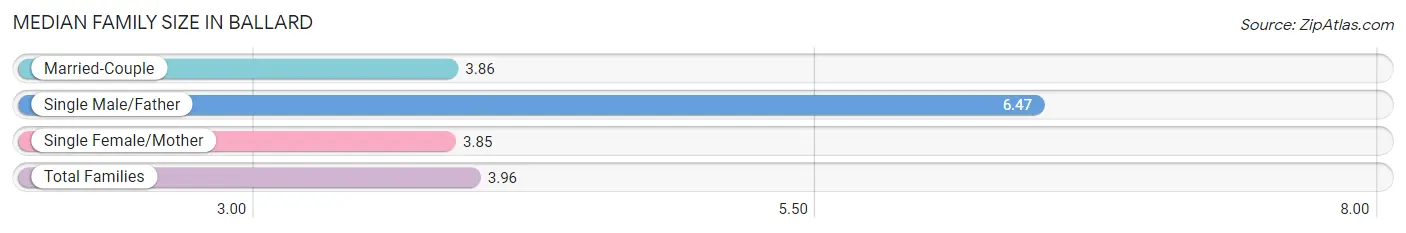
The median family size in Ballard is 3.96 persons per family, with single male/father families (15 | 4.0%) accounting for the largest median family size of 6.47 persons per family. On the other hand, single female/mother families (34 | 9.1%) represent the smallest median family size with 3.85 persons per family.
| Family Type | # Families | Family Size |
| Married-Couple | 325 (86.9%) | 3.86 |
| Single Male/Father | 15 (4.0%) | 6.47 |
| Single Female/Mother | 34 (9.1%) | 3.85 |
| Total Families | 374 (100.0%) | 3.96 |
Median Household Size in Ballard
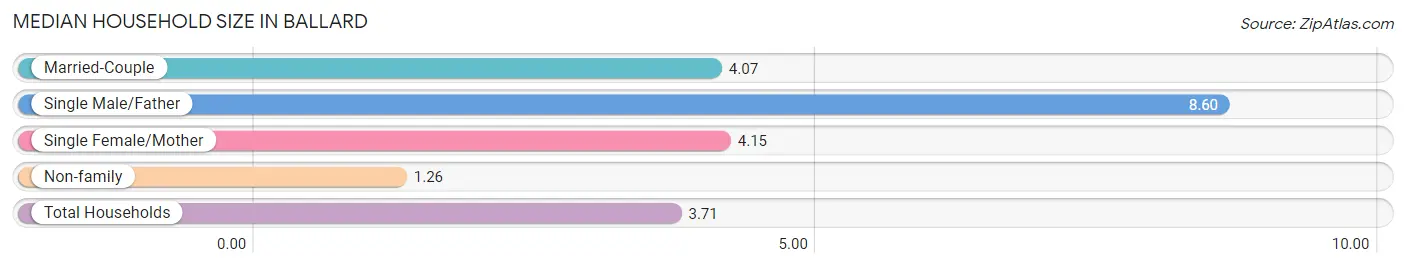
The median household size in Ballard is 3.71 persons per household, with single male/father households (15 | 3.3%) accounting for the largest median household size of 8.6 persons per household. non-family households (84 | 18.3%) represent the smallest median household size with 1.26 persons per household.
| Household Type | # Households | Household Size |
| Married-Couple | 325 (71.0%) | 4.07 |
| Single Male/Father | 15 (3.3%) | 8.60 |
| Single Female/Mother | 34 (7.4%) | 4.15 |
| Non-family | 84 (18.3%) | 1.26 |
| Total Households | 458 (100.0%) | 3.71 |
Household Size by Marriage Status in Ballard
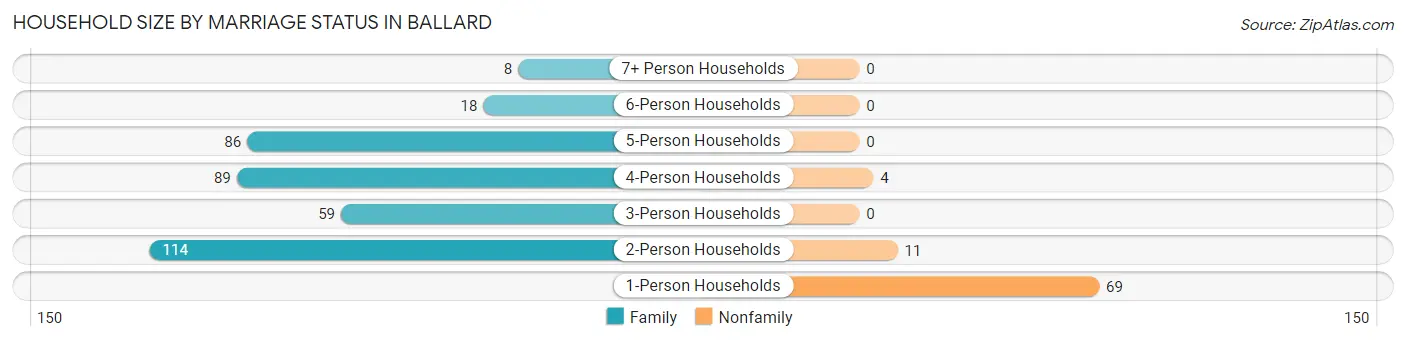
Out of a total of 458 households in Ballard, 374 (81.7%) are family households, while 84 (18.3%) are nonfamily households. The most numerous type of family households are 2-person households, comprising 114, and the most common type of nonfamily households are 1-person households, comprising 69.
| Household Size | Family Households | Nonfamily Households |
| 1-Person Households | - | 69 (15.1%) |
| 2-Person Households | 114 (24.9%) | 11 (2.4%) |
| 3-Person Households | 59 (12.9%) | 0 (0.0%) |
| 4-Person Households | 89 (19.4%) | 4 (0.9%) |
| 5-Person Households | 86 (18.8%) | 0 (0.0%) |
| 6-Person Households | 18 (3.9%) | 0 (0.0%) |
| 7+ Person Households | 8 (1.8%) | 0 (0.0%) |
| Total | 374 (81.7%) | 84 (18.3%) |
Female Fertility in Ballard
Fertility by Age in Ballard
Average fertility rate in Ballard is 72.0 births per 1,000 women. Women in the age bracket of 20 to 34 years have the highest fertility rate with 200.0 births per 1,000 women. Women in the age bracket of 20 to 34 years acount for 100.0% of all women with births.
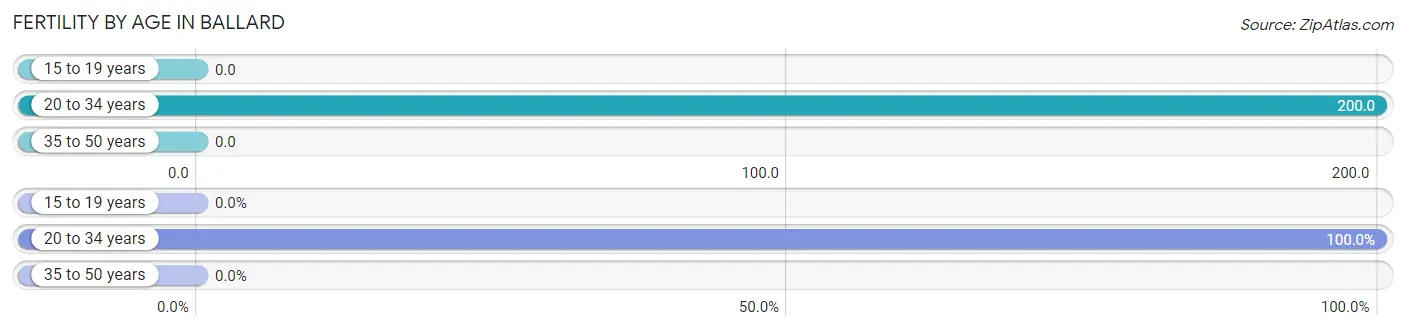
| Age Bracket | Women with Births | Births / 1,000 Women |
| 15 to 19 years | 0 (0.0%) | 0.0 |
| 20 to 34 years | 28 (100.0%) | 200.0 |
| 35 to 50 years | 0 (0.0%) | 0.0 |
| Total | 28 (100.0%) | 72.0 |
Fertility by Age by Marriage Status in Ballard
85.7% of women with births (28) in Ballard are married. The highest percentage of unmarried women with births falls into 20 to 34 years age bracket with 14.3% of them unmarried at the time of birth, while the lowest percentage of unmarried women with births belong to 20 to 34 years age bracket with 14.3% of them unmarried.
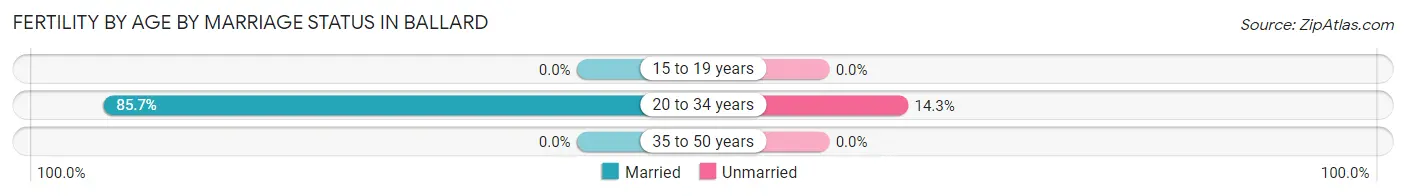
| Age Bracket | Married | Unmarried |
| 15 to 19 years | 0 (0.0%) | 0 (0.0%) |
| 20 to 34 years | 24 (85.7%) | 4 (14.3%) |
| 35 to 50 years | 0 (0.0%) | 0 (0.0%) |
| Total | 24 (85.7%) | 4 (14.3%) |
Fertility by Education in Ballard
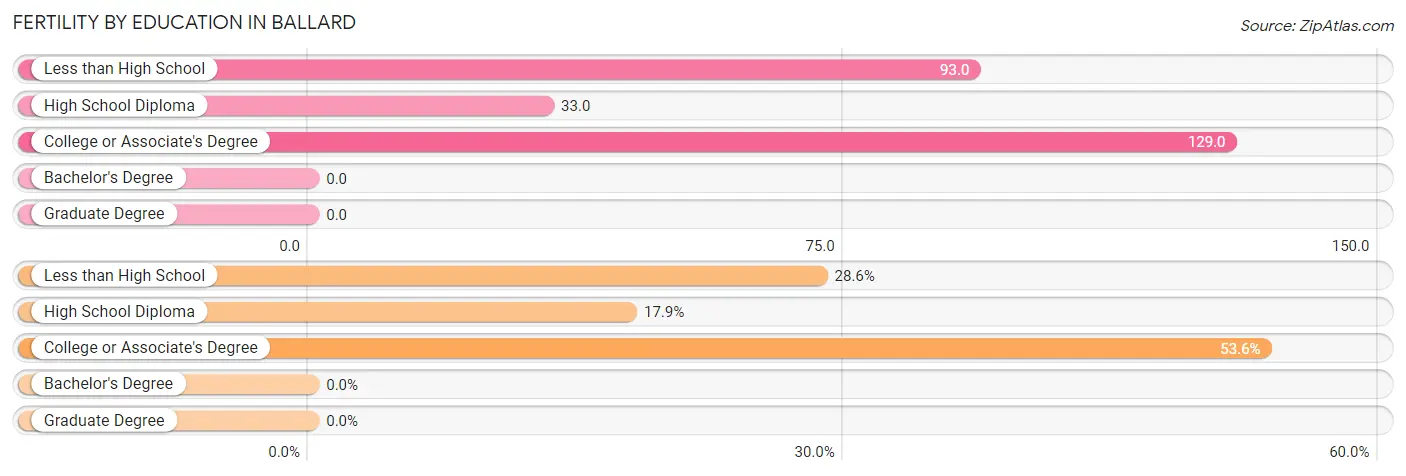
| Educational Attainment | Women with Births | Births / 1,000 Women |
| Less than High School | 8 (28.6%) | 93.0 |
| High School Diploma | 5 (17.9%) | 33.0 |
| College or Associate's Degree | 15 (53.6%) | 129.0 |
| Bachelor's Degree | 0 (0.0%) | 0.0 |
| Graduate Degree | 0 (0.0%) | 0.0 |
| Total | 28 (100.0%) | 72.0 |
Fertility by Education by Marriage Status in Ballard
14.3% of women with births in Ballard are unmarried. Women with the educational attainment of less than high school are most likely to be married with 100.0% of them married at childbirth, while women with the educational attainment of college or associate's degree are least likely to be married with 26.7% of them unmarried at childbirth.
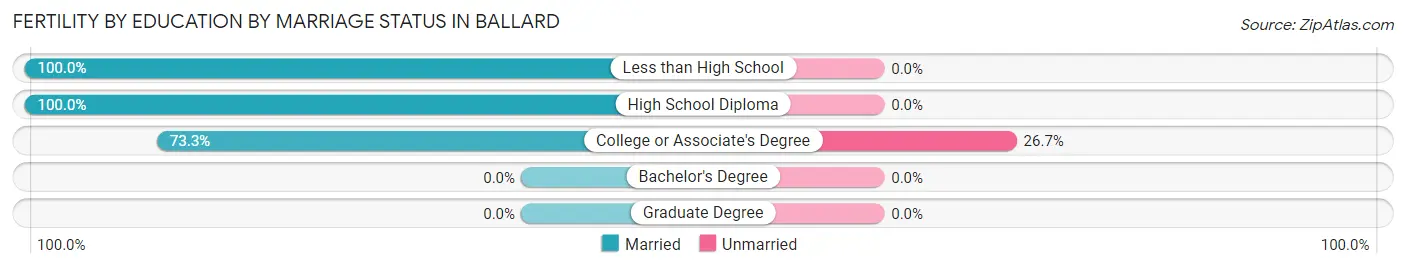
| Educational Attainment | Married | Unmarried |
| Less than High School | 8 (100.0%) | 0 (0.0%) |
| High School Diploma | 5 (100.0%) | 0 (0.0%) |
| College or Associate's Degree | 11 (73.3%) | 4 (26.7%) |
| Bachelor's Degree | 0 (0.0%) | 0 (0.0%) |
| Graduate Degree | 0 (0.0%) | 0 (0.0%) |
| Total | 24 (85.7%) | 4 (14.3%) |
Income in Ballard
Income Overview in Ballard
Per Capita Income in Ballard is $22,633, while median incomes of families and households are $77,500 and $73,833 respectively.
| Characteristic | Number | Measure |
| Per Capita Income | 1,700 | $22,633 |
| Median Family Income | 374 | $77,500 |
| Mean Family Income | 374 | $82,821 |
| Median Household Income | 458 | $73,833 |
| Mean Household Income | 458 | $80,847 |
| Income Deficit | 374 | $0 |
| Wage / Income Gap (%) | 1,700 | 81.51% |
| Wage / Income Gap ($) | 1,700 | 18.49¢ per $1 |
| Gini / Inequality Index | 1,700 | 0.34 |
Earnings by Sex in Ballard
Average Earnings in Ballard are $29,050, $50,250 for men and $9,293 for women, a difference of 81.5%.

| Sex | Number | Average Earnings |
| Male | 400 (49.1%) | $50,250 |
| Female | 415 (50.9%) | $9,293 |
| Total | 815 (100.0%) | $29,050 |
Earnings by Sex by Income Bracket in Ballard
The most common earnings brackets in Ballard are $65,000 to $74,999 for men (50 | 12.5%) and $2,499 or less for women (109 | 26.3%).
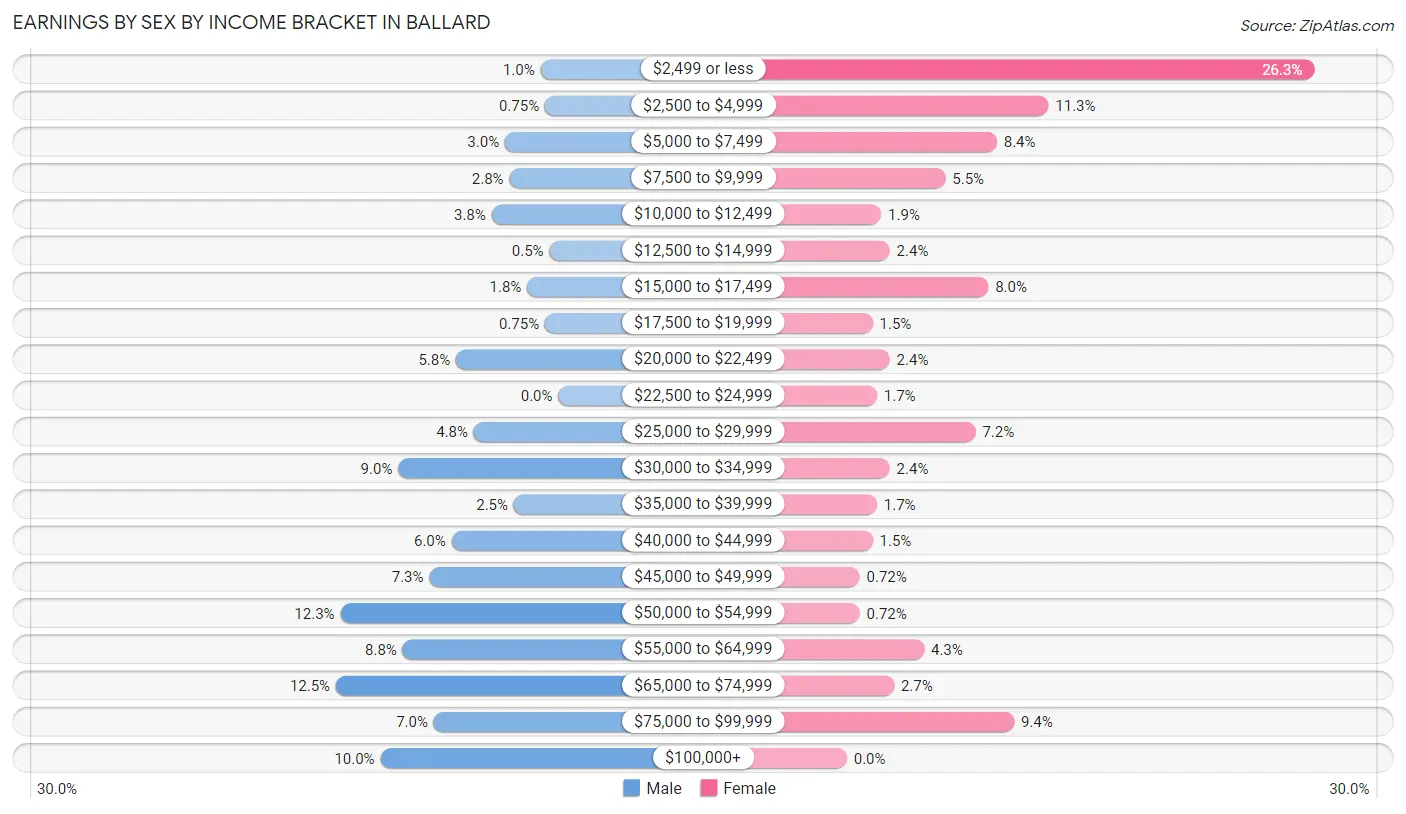
| Income | Male | Female |
| $2,499 or less | 4 (1.0%) | 109 (26.3%) |
| $2,500 to $4,999 | 3 (0.7%) | 47 (11.3%) |
| $5,000 to $7,499 | 12 (3.0%) | 35 (8.4%) |
| $7,500 to $9,999 | 11 (2.8%) | 23 (5.5%) |
| $10,000 to $12,499 | 15 (3.7%) | 8 (1.9%) |
| $12,500 to $14,999 | 2 (0.5%) | 10 (2.4%) |
| $15,000 to $17,499 | 7 (1.8%) | 33 (8.0%) |
| $17,500 to $19,999 | 3 (0.7%) | 6 (1.5%) |
| $20,000 to $22,499 | 23 (5.8%) | 10 (2.4%) |
| $22,500 to $24,999 | 0 (0.0%) | 7 (1.7%) |
| $25,000 to $29,999 | 19 (4.8%) | 30 (7.2%) |
| $30,000 to $34,999 | 36 (9.0%) | 10 (2.4%) |
| $35,000 to $39,999 | 10 (2.5%) | 7 (1.7%) |
| $40,000 to $44,999 | 24 (6.0%) | 6 (1.5%) |
| $45,000 to $49,999 | 29 (7.2%) | 3 (0.7%) |
| $50,000 to $54,999 | 49 (12.2%) | 3 (0.7%) |
| $55,000 to $64,999 | 35 (8.7%) | 18 (4.3%) |
| $65,000 to $74,999 | 50 (12.5%) | 11 (2.6%) |
| $75,000 to $99,999 | 28 (7.0%) | 39 (9.4%) |
| $100,000+ | 40 (10.0%) | 0 (0.0%) |
| Total | 400 (100.0%) | 415 (100.0%) |
Earnings by Sex by Educational Attainment in Ballard
Average earnings in Ballard are $50,250 for men and $12,188 for women, a difference of 75.7%. Men with an educational attainment of bachelor's degree enjoy the highest average annual earnings of $58,611, while those with less than high school education earn the least with $46,875. Women with an educational attainment of graduate degree earn the most with the average annual earnings of $90,885, while those with college or associate's degree education have the smallest earnings of $20,313.
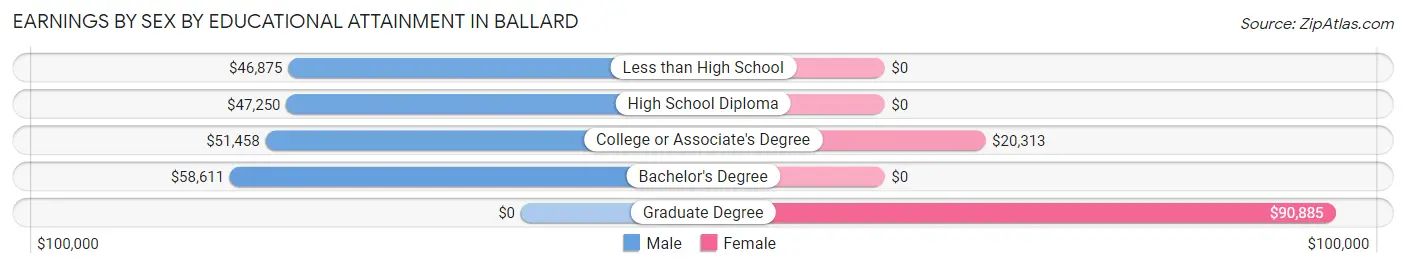
| Educational Attainment | Male Income | Female Income |
| Less than High School | $46,875 | $0 |
| High School Diploma | $47,250 | $0 |
| College or Associate's Degree | $51,458 | $20,313 |
| Bachelor's Degree | $58,611 | $0 |
| Graduate Degree | - | - |
| Total | $50,250 | $12,188 |
Family Income in Ballard
Family Income Brackets in Ballard
According to the Ballard family income data, there are 94 families falling into the $50,000 to $74,999 income range, which is the most common income bracket and makes up 25.1% of all families. Conversely, the $200,000+ income bracket is the least frequent group with only 7 families (1.9%) belonging to this category.
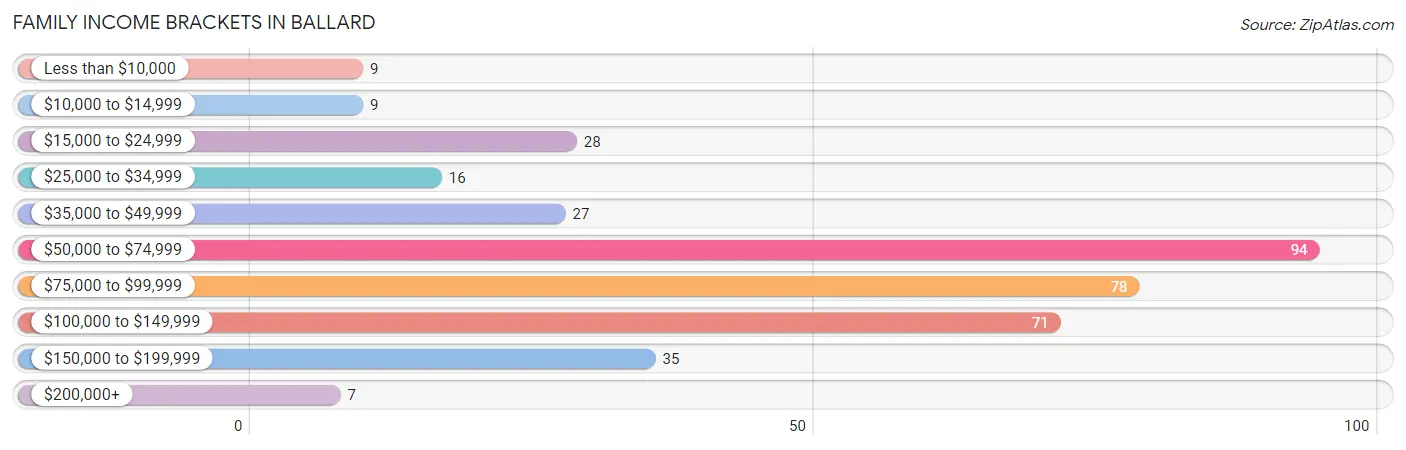
| Income Bracket | # Families | % Families |
| Less than $10,000 | 9 | 2.4% |
| $10,000 to $14,999 | 9 | 2.4% |
| $15,000 to $24,999 | 28 | 7.5% |
| $25,000 to $34,999 | 16 | 4.3% |
| $35,000 to $49,999 | 27 | 7.2% |
| $50,000 to $74,999 | 94 | 25.1% |
| $75,000 to $99,999 | 78 | 20.9% |
| $100,000 to $149,999 | 71 | 19.0% |
| $150,000 to $199,999 | 35 | 9.4% |
| $200,000+ | 7 | 1.9% |
Family Income by Famaliy Size in Ballard
4-person families (77 | 20.6%) account for the highest median family income in Ballard with $117,639 per family, while 2-person families (119 | 31.8%) have the highest median income of $36,042 per family member.
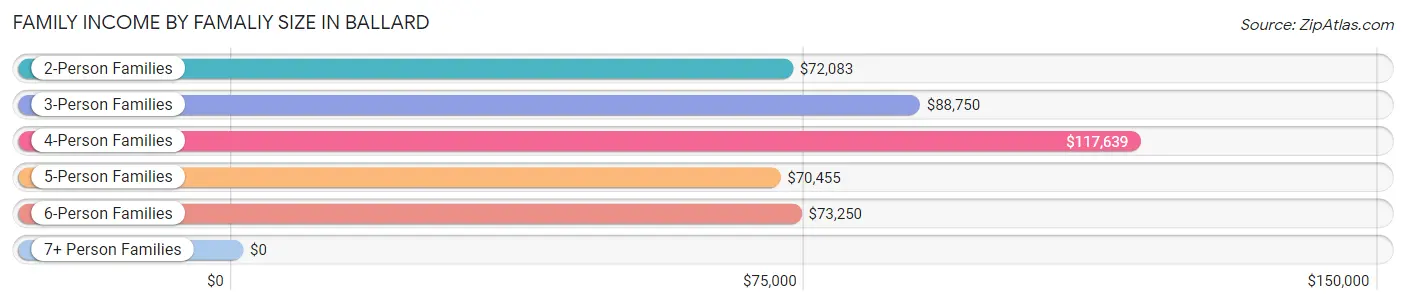
| Income Bracket | # Families | Median Income |
| 2-Person Families | 119 (31.8%) | $72,083 |
| 3-Person Families | 71 (19.0%) | $88,750 |
| 4-Person Families | 77 (20.6%) | $117,639 |
| 5-Person Families | 84 (22.5%) | $70,455 |
| 6-Person Families | 15 (4.0%) | $73,250 |
| 7+ Person Families | 8 (2.1%) | $0 |
| Total | 374 (100.0%) | $77,500 |
Family Income by Number of Earners in Ballard
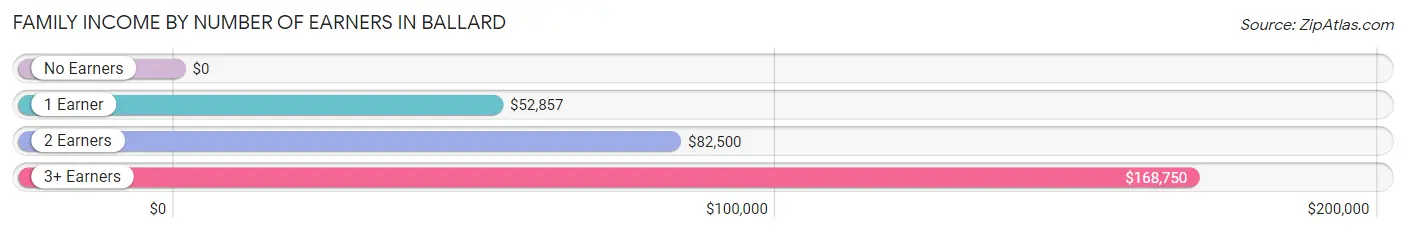
| Number of Earners | # Families | Median Income |
| No Earners | 50 (13.4%) | $0 |
| 1 Earner | 136 (36.4%) | $52,857 |
| 2 Earners | 124 (33.2%) | $82,500 |
| 3+ Earners | 64 (17.1%) | $168,750 |
| Total | 374 (100.0%) | $77,500 |
Household Income in Ballard
Household Income Brackets in Ballard
With 108 households falling in the category, the $50,000 to $74,999 income range is the most frequent in Ballard, accounting for 23.6% of all households. In contrast, only 4 households (0.9%) fall into the $10,000 to $14,999 income bracket, making it the least populous group.
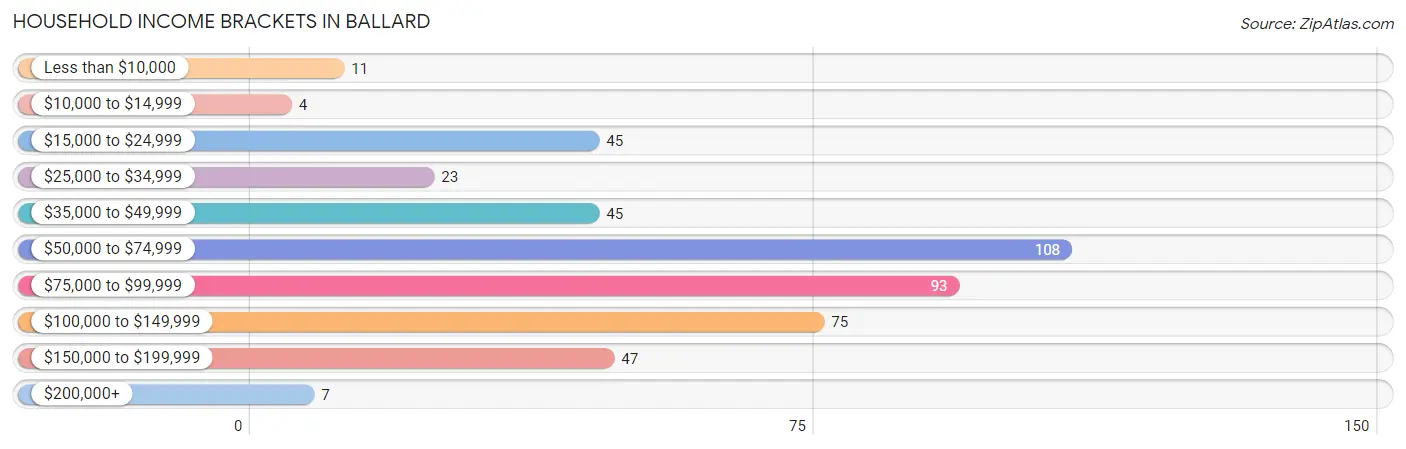
| Income Bracket | # Households | % Households |
| Less than $10,000 | 11 | 2.4% |
| $10,000 to $14,999 | 4 | 0.9% |
| $15,000 to $24,999 | 45 | 9.8% |
| $25,000 to $34,999 | 23 | 5.0% |
| $35,000 to $49,999 | 45 | 9.8% |
| $50,000 to $74,999 | 108 | 23.6% |
| $75,000 to $99,999 | 93 | 20.3% |
| $100,000 to $149,999 | 75 | 16.4% |
| $150,000 to $199,999 | 47 | 10.3% |
| $200,000+ | 7 | 1.5% |
Household Income by Householder Age in Ballard
The median household income in Ballard is $73,833, with the highest median household income of $88,333 found in the 45 to 64 years age bracket for the primary householder. A total of 132 households (28.8%) fall into this category. Meanwhile, the 65+ years age bracket for the primary householder has the lowest median household income of $50,179, with 113 households (24.7%) in this group.
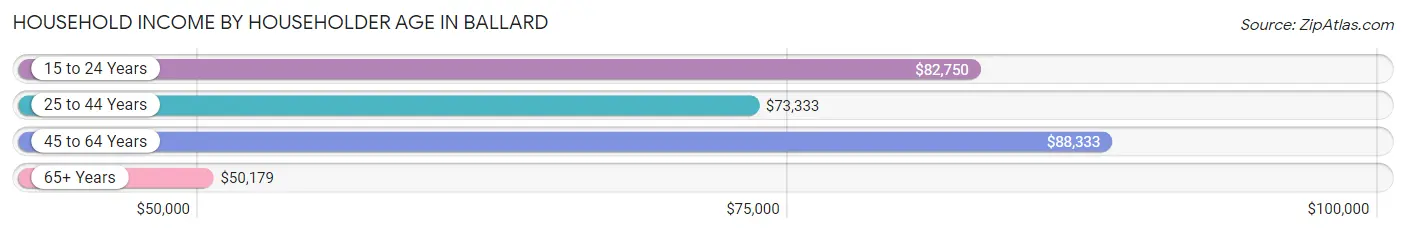
| Income Bracket | # Households | Median Income |
| 15 to 24 Years | 17 (3.7%) | $82,750 |
| 25 to 44 Years | 196 (42.8%) | $73,333 |
| 45 to 64 Years | 132 (28.8%) | $88,333 |
| 65+ Years | 113 (24.7%) | $50,179 |
| Total | 458 (100.0%) | $73,833 |
Poverty in Ballard
Income Below Poverty by Sex and Age in Ballard
With 10.9% poverty level for males and 19.5% for females among the residents of Ballard, 15 year old males and 45 to 54 year old females are the most vulnerable to poverty, with 4 males (40.0%) and 72 females (63.2%) in their respective age groups living below the poverty level.
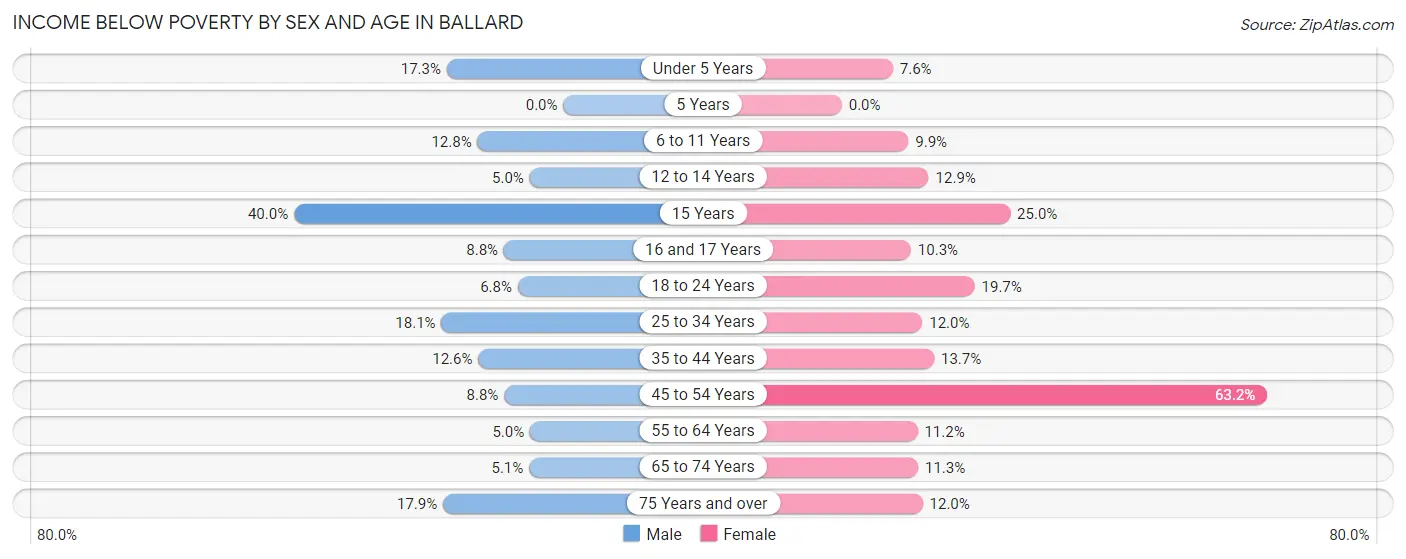
| Age Bracket | Male | Female |
| Under 5 Years | 9 (17.3%) | 5 (7.6%) |
| 5 Years | 0 (0.0%) | 0 (0.0%) |
| 6 to 11 Years | 13 (12.8%) | 8 (9.9%) |
| 12 to 14 Years | 3 (5.0%) | 4 (12.9%) |
| 15 Years | 4 (40.0%) | 4 (25.0%) |
| 16 and 17 Years | 3 (8.8%) | 4 (10.3%) |
| 18 to 24 Years | 5 (6.8%) | 14 (19.7%) |
| 25 to 34 Years | 23 (18.1%) | 11 (12.0%) |
| 35 to 44 Years | 12 (12.6%) | 20 (13.7%) |
| 45 to 54 Years | 8 (8.8%) | 72 (63.2%) |
| 55 to 64 Years | 5 (5.0%) | 10 (11.2%) |
| 65 to 74 Years | 3 (5.1%) | 6 (11.3%) |
| 75 Years and over | 5 (17.9%) | 3 (12.0%) |
| Total | 93 (10.9%) | 161 (19.5%) |
Income Above Poverty by Sex and Age in Ballard
According to the poverty statistics in Ballard, males aged 5 years and females aged 5 years are the age groups that are most secure financially, with 100.0% of males and 100.0% of females in these age groups living above the poverty line.
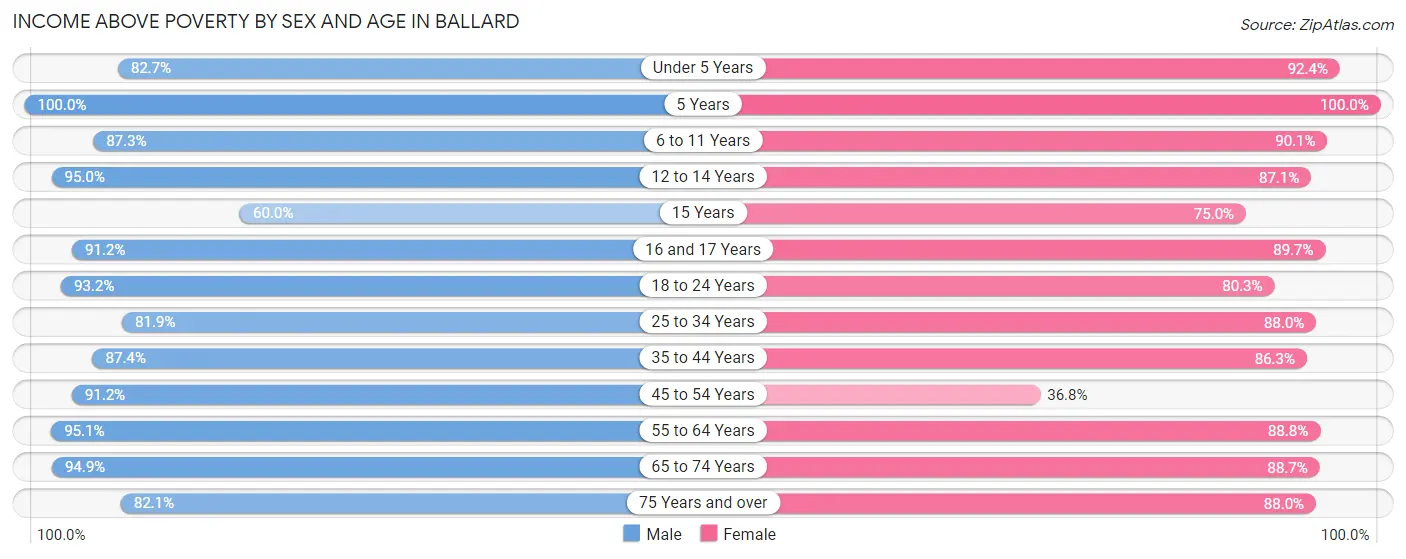
| Age Bracket | Male | Female |
| Under 5 Years | 43 (82.7%) | 61 (92.4%) |
| 5 Years | 23 (100.0%) | 2 (100.0%) |
| 6 to 11 Years | 89 (87.3%) | 73 (90.1%) |
| 12 to 14 Years | 57 (95.0%) | 27 (87.1%) |
| 15 Years | 6 (60.0%) | 12 (75.0%) |
| 16 and 17 Years | 31 (91.2%) | 35 (89.7%) |
| 18 to 24 Years | 69 (93.2%) | 57 (80.3%) |
| 25 to 34 Years | 104 (81.9%) | 81 (88.0%) |
| 35 to 44 Years | 83 (87.4%) | 126 (86.3%) |
| 45 to 54 Years | 83 (91.2%) | 42 (36.8%) |
| 55 to 64 Years | 96 (95.1%) | 79 (88.8%) |
| 65 to 74 Years | 56 (94.9%) | 47 (88.7%) |
| 75 Years and over | 23 (82.1%) | 22 (88.0%) |
| Total | 763 (89.1%) | 664 (80.5%) |
Income Below Poverty Among Married-Couple Families in Ballard
The poverty statistics for married-couple families in Ballard show that 9.2% or 30 of the total 325 families live below the poverty line. Families with 5 or more children have the highest poverty rate of 100.0%, comprising of 4 families. On the other hand, families with 3 or 4 children have the lowest poverty rate of 2.8%, which includes 2 families.
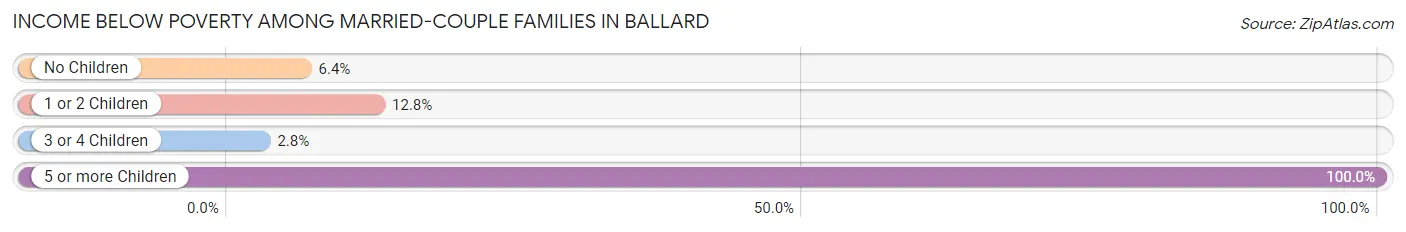
| Children | Above Poverty | Below Poverty |
| No Children | 117 (93.6%) | 8 (6.4%) |
| 1 or 2 Children | 109 (87.2%) | 16 (12.8%) |
| 3 or 4 Children | 69 (97.2%) | 2 (2.8%) |
| 5 or more Children | 0 (0.0%) | 4 (100.0%) |
| Total | 295 (90.8%) | 30 (9.2%) |
Income Below Poverty Among Single-Parent Households in Ballard
According to the poverty data in Ballard, 13.3% or 2 single-father households and 38.2% or 13 single-mother households are living below the poverty line. Among single-father households, those with 1 or 2 children have the highest poverty rate, with 2 households (25.0%) experiencing poverty. Likewise, among single-mother households, those with 1 or 2 children have the highest poverty rate, with 7 households (38.9%) falling below the poverty line.
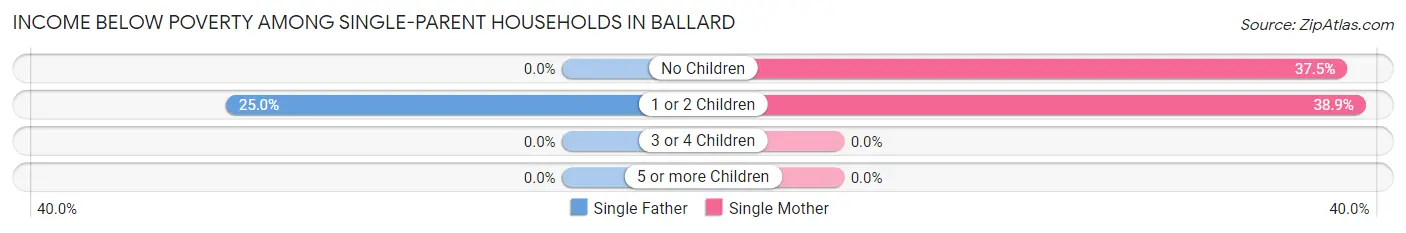
| Children | Single Father | Single Mother |
| No Children | 0 (0.0%) | 6 (37.5%) |
| 1 or 2 Children | 2 (25.0%) | 7 (38.9%) |
| 3 or 4 Children | 0 (0.0%) | 0 (0.0%) |
| 5 or more Children | 0 (0.0%) | 0 (0.0%) |
| Total | 2 (13.3%) | 13 (38.2%) |
Income Below Poverty Among Married-Couple vs Single-Parent Households in Ballard
The poverty data for Ballard shows that 30 of the married-couple family households (9.2%) and 15 of the single-parent households (30.6%) are living below the poverty level. Within the married-couple family households, those with 5 or more children have the highest poverty rate, with 4 households (100.0%) falling below the poverty line. Among the single-parent households, those with 1 or 2 children have the highest poverty rate, with 9 household (34.6%) living below poverty.
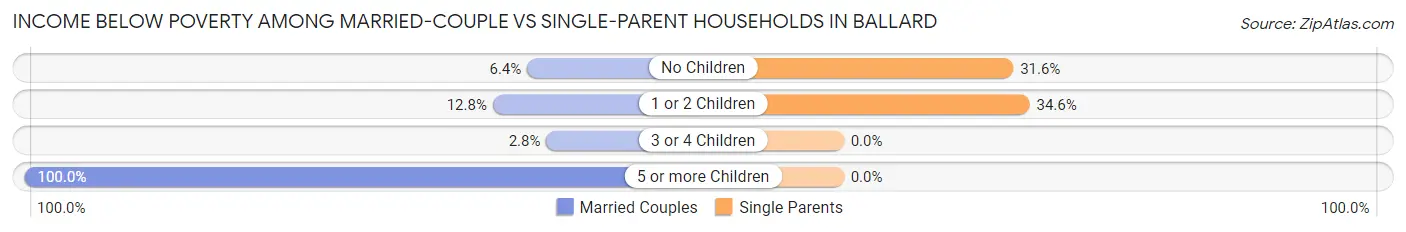
| Children | Married-Couple Families | Single-Parent Households |
| No Children | 8 (6.4%) | 6 (31.6%) |
| 1 or 2 Children | 16 (12.8%) | 9 (34.6%) |
| 3 or 4 Children | 2 (2.8%) | 0 (0.0%) |
| 5 or more Children | 4 (100.0%) | 0 (0.0%) |
| Total | 30 (9.2%) | 15 (30.6%) |
Employment Characteristics in Ballard
Employment by Class of Employer in Ballard
Among the 698 employed individuals in Ballard, private company employees (494 | 70.8%), local government employees (70 | 10.0%), and self-employed (incorporated) (58 | 8.3%) make up the most common classes of employment.
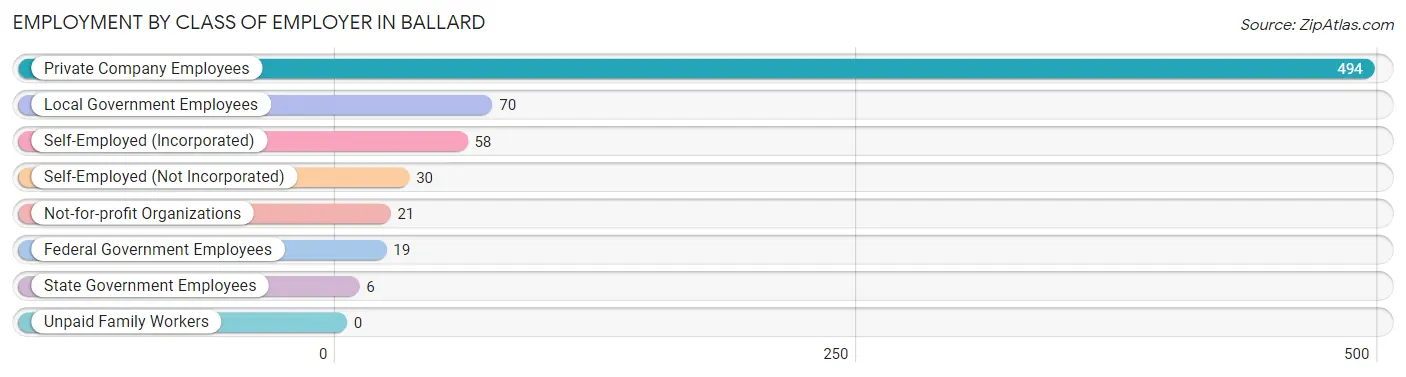
| Employer Class | # Employees | % Employees |
| Private Company Employees | 494 | 70.8% |
| Self-Employed (Incorporated) | 58 | 8.3% |
| Self-Employed (Not Incorporated) | 30 | 4.3% |
| Not-for-profit Organizations | 21 | 3.0% |
| Local Government Employees | 70 | 10.0% |
| State Government Employees | 6 | 0.9% |
| Federal Government Employees | 19 | 2.7% |
| Unpaid Family Workers | 0 | 0.0% |
| Total | 698 | 100.0% |
Employment Status by Age in Ballard
According to the labor force statistics for Ballard, out of the total population over 16 years of age (1,238), 63.9% or 791 individuals are in the labor force, with 10.1% or 80 of them unemployed. The age group with the highest labor force participation rate is 20 to 24 years, with 84.1% or 95 individuals in the labor force. Within the labor force, the 20 to 24 years age range has the highest percentage of unemployed individuals, with 30.5% or 29 of them being unemployed.
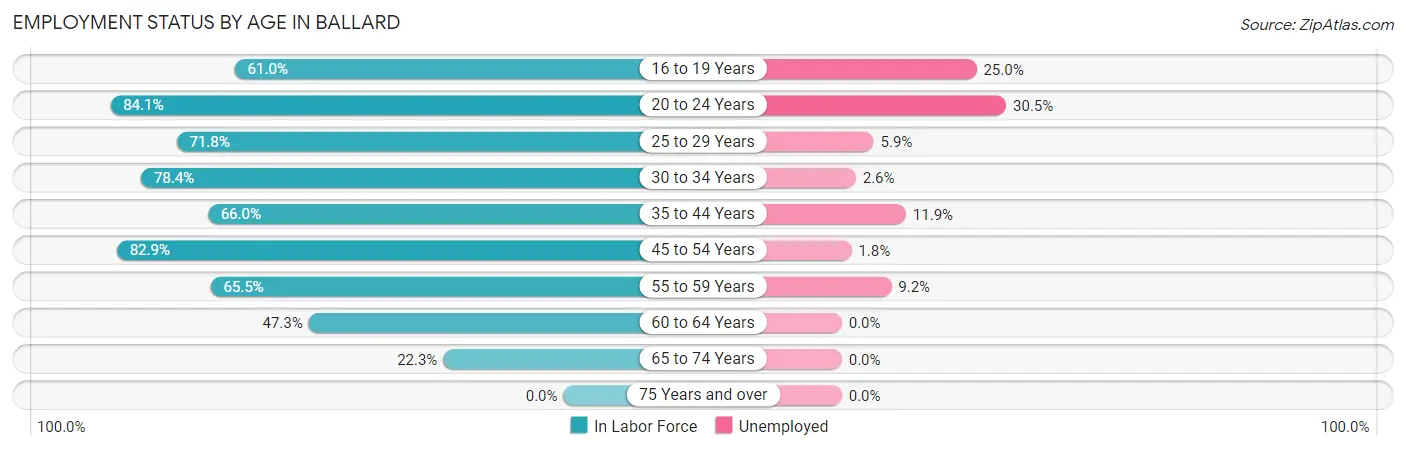
| Age Bracket | In Labor Force | Unemployed |
| 16 to 19 Years | 64 (61.0%) | 16 (25.0%) |
| 20 to 24 Years | 95 (84.1%) | 29 (30.5%) |
| 25 to 29 Years | 51 (71.8%) | 3 (5.9%) |
| 30 to 34 Years | 116 (78.4%) | 3 (2.6%) |
| 35 to 44 Years | 159 (66.0%) | 19 (11.9%) |
| 45 to 54 Years | 170 (82.9%) | 3 (1.8%) |
| 55 to 59 Years | 76 (65.5%) | 7 (9.2%) |
| 60 to 64 Years | 35 (47.3%) | 0 (0.0%) |
| 65 to 74 Years | 25 (22.3%) | 0 (0.0%) |
| 75 Years and over | 0 (0.0%) | 0 (0.0%) |
| Total | 791 (63.9%) | 80 (10.1%) |
Employment Status by Educational Attainment in Ballard
According to labor force statistics for Ballard, 71.0% of individuals (607) out of the total population between 25 and 64 years of age (855) are in the labor force, with 5.8% or 35 of them being unemployed. The group with the highest labor force participation rate are those with the educational attainment of bachelor's degree or higher, with 84.5% or 82 individuals in the labor force. Within the labor force, individuals with college / associate degree education have the highest percentage of unemployment, with 7.7% or 13 of them being unemployed.
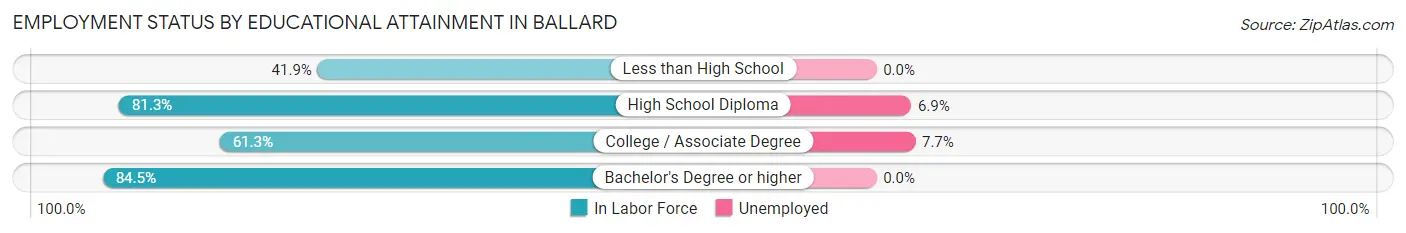
| Educational Attainment | In Labor Force | Unemployed |
| Less than High School | 39 (41.9%) | 0 (0.0%) |
| High School Diploma | 318 (81.3%) | 27 (6.9%) |
| College / Associate Degree | 168 (61.3%) | 21 (7.7%) |
| Bachelor's Degree or higher | 82 (84.5%) | 0 (0.0%) |
| Total | 607 (71.0%) | 50 (5.8%) |
Employment Occupations by Sex in Ballard
Management, Business, Science and Arts Occupations
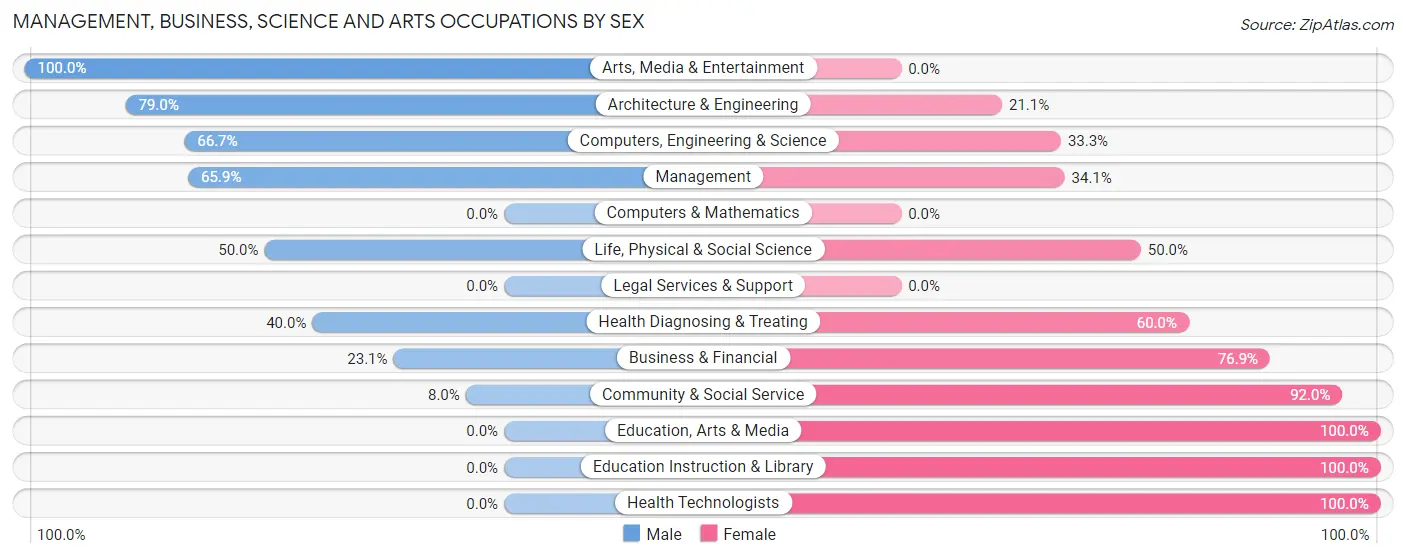
The most common Management, Business, Science and Arts occupations in Ballard are Community & Social Service (50 | 7.0%), Management (44 | 6.2%), Education Instruction & Library (40 | 5.6%), Business & Financial (39 | 5.5%), and Computers, Engineering & Science (33 | 4.6%).
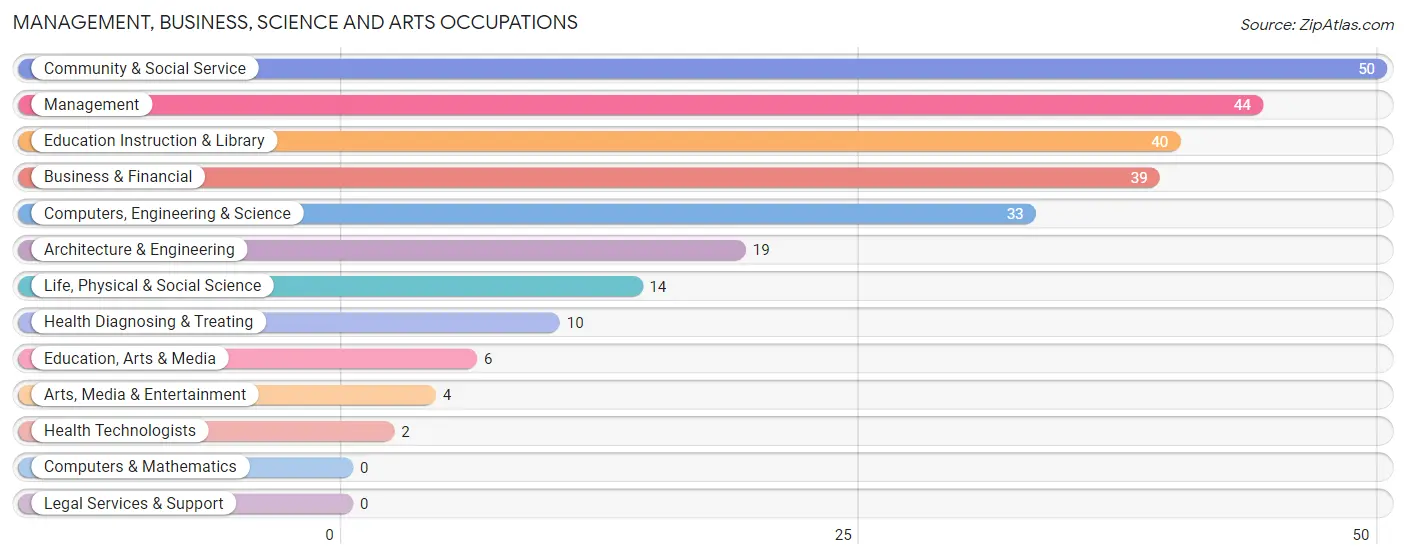
Management, Business, Science and Arts Occupations by Sex
Within the Management, Business, Science and Arts occupations in Ballard, the most male-oriented occupations are Arts, Media & Entertainment (100.0%), Architecture & Engineering (78.9%), and Computers, Engineering & Science (66.7%), while the most female-oriented occupations are Education, Arts & Media (100.0%), Education Instruction & Library (100.0%), and Health Technologists (100.0%).
| Occupation | Male | Female |
| Management | 29 (65.9%) | 15 (34.1%) |
| Business & Financial | 9 (23.1%) | 30 (76.9%) |
| Computers, Engineering & Science | 22 (66.7%) | 11 (33.3%) |
| Computers & Mathematics | 0 (0.0%) | 0 (0.0%) |
| Architecture & Engineering | 15 (78.9%) | 4 (21.0%) |
| Life, Physical & Social Science | 7 (50.0%) | 7 (50.0%) |
| Community & Social Service | 4 (8.0%) | 46 (92.0%) |
| Education, Arts & Media | 0 (0.0%) | 6 (100.0%) |
| Legal Services & Support | 0 (0.0%) | 0 (0.0%) |
| Education Instruction & Library | 0 (0.0%) | 40 (100.0%) |
| Arts, Media & Entertainment | 4 (100.0%) | 0 (0.0%) |
| Health Diagnosing & Treating | 4 (40.0%) | 6 (60.0%) |
| Health Technologists | 0 (0.0%) | 2 (100.0%) |
| Total (Category) | 68 (38.6%) | 108 (61.4%) |
| Total (Overall) | 354 (49.8%) | 357 (50.2%) |
Services Occupations
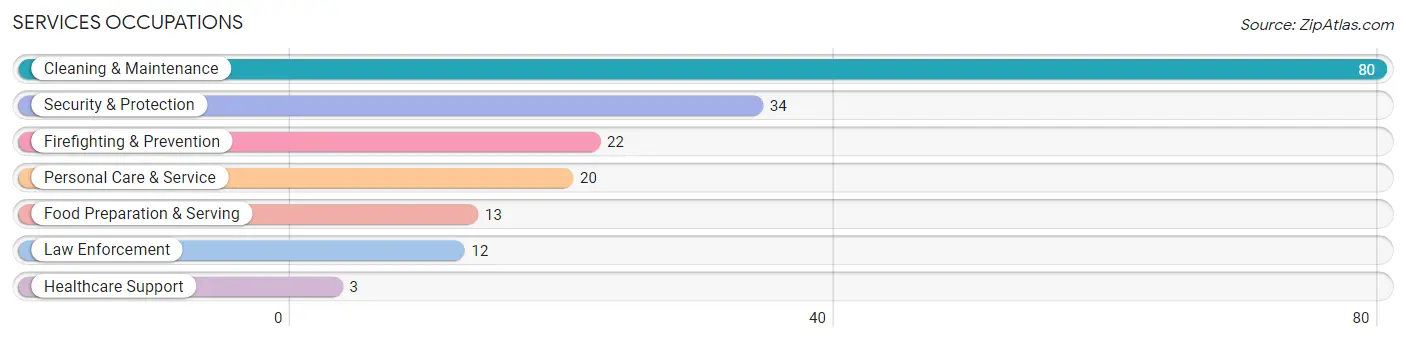
The most common Services occupations in Ballard are Cleaning & Maintenance (80 | 11.3%), Security & Protection (34 | 4.8%), Firefighting & Prevention (22 | 3.1%), Personal Care & Service (20 | 2.8%), and Food Preparation & Serving (13 | 1.8%).
Services Occupations by Sex
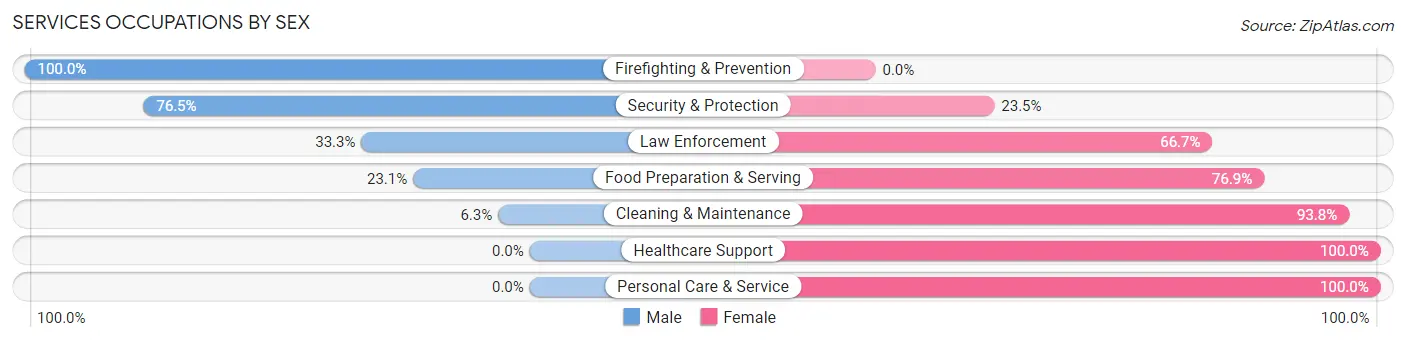
Within the Services occupations in Ballard, the most male-oriented occupations are Firefighting & Prevention (100.0%), Security & Protection (76.5%), and Law Enforcement (33.3%), while the most female-oriented occupations are Healthcare Support (100.0%), Personal Care & Service (100.0%), and Cleaning & Maintenance (93.8%).
| Occupation | Male | Female |
| Healthcare Support | 0 (0.0%) | 3 (100.0%) |
| Security & Protection | 26 (76.5%) | 8 (23.5%) |
| Firefighting & Prevention | 22 (100.0%) | 0 (0.0%) |
| Law Enforcement | 4 (33.3%) | 8 (66.7%) |
| Food Preparation & Serving | 3 (23.1%) | 10 (76.9%) |
| Cleaning & Maintenance | 5 (6.2%) | 75 (93.8%) |
| Personal Care & Service | 0 (0.0%) | 20 (100.0%) |
| Total (Category) | 34 (22.7%) | 116 (77.3%) |
| Total (Overall) | 354 (49.8%) | 357 (50.2%) |
Sales and Office Occupations
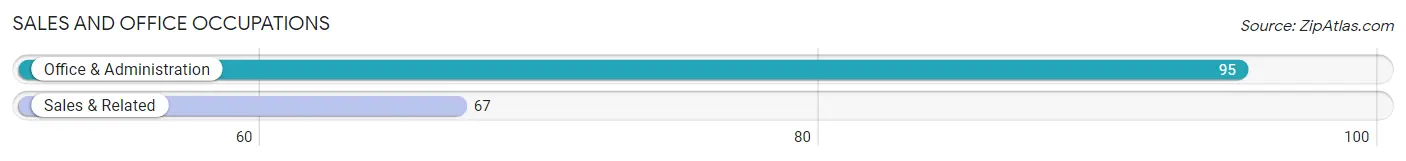
The most common Sales and Office occupations in Ballard are Office & Administration (95 | 13.4%), and Sales & Related (67 | 9.4%).
Sales and Office Occupations by Sex
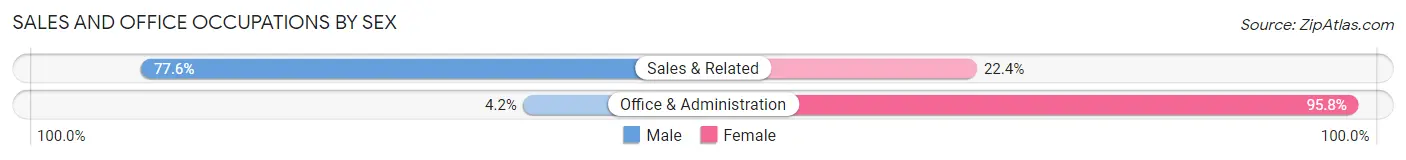
| Occupation | Male | Female |
| Sales & Related | 52 (77.6%) | 15 (22.4%) |
| Office & Administration | 4 (4.2%) | 91 (95.8%) |
| Total (Category) | 56 (34.6%) | 106 (65.4%) |
| Total (Overall) | 354 (49.8%) | 357 (50.2%) |
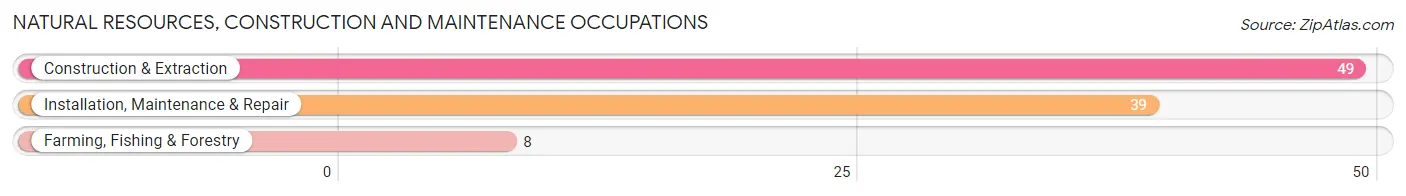
Natural Resources, Construction and Maintenance Occupations
The most common Natural Resources, Construction and Maintenance occupations in Ballard are Construction & Extraction (49 | 6.9%), Installation, Maintenance & Repair (39 | 5.5%), and Farming, Fishing & Forestry (8 | 1.1%).
Natural Resources, Construction and Maintenance Occupations by Sex
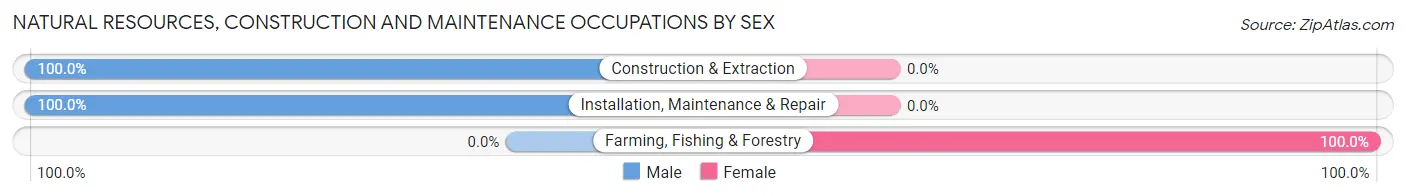
| Occupation | Male | Female |
| Farming, Fishing & Forestry | 0 (0.0%) | 8 (100.0%) |
| Construction & Extraction | 49 (100.0%) | 0 (0.0%) |
| Installation, Maintenance & Repair | 39 (100.0%) | 0 (0.0%) |
| Total (Category) | 88 (91.7%) | 8 (8.3%) |
| Total (Overall) | 354 (49.8%) | 357 (50.2%) |
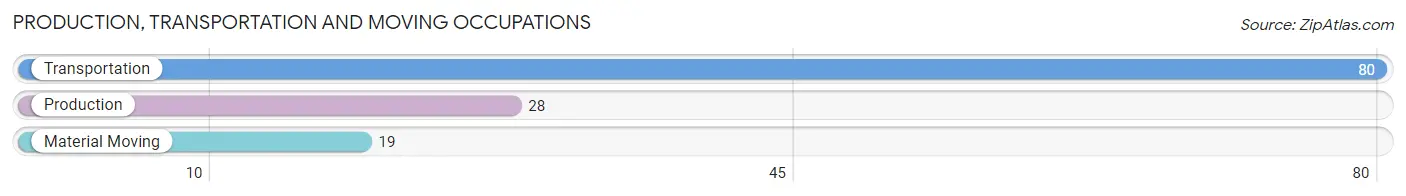
Production, Transportation and Moving Occupations
The most common Production, Transportation and Moving occupations in Ballard are Transportation (80 | 11.3%), Production (28 | 3.9%), and Material Moving (19 | 2.7%).
Production, Transportation and Moving Occupations by Sex
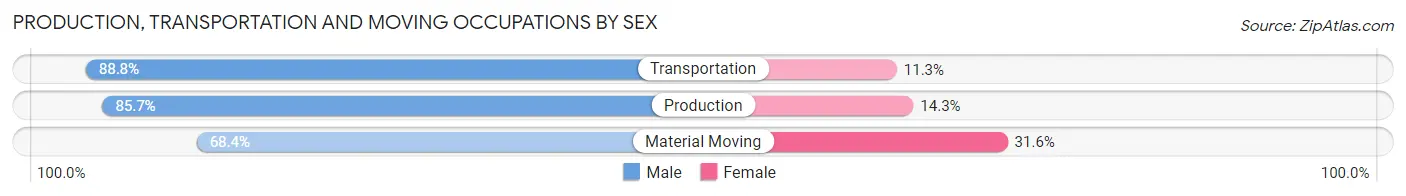
| Occupation | Male | Female |
| Production | 24 (85.7%) | 4 (14.3%) |
| Transportation | 71 (88.7%) | 9 (11.3%) |
| Material Moving | 13 (68.4%) | 6 (31.6%) |
| Total (Category) | 108 (85.0%) | 19 (15.0%) |
| Total (Overall) | 354 (49.8%) | 357 (50.2%) |
Employment Industries by Sex in Ballard
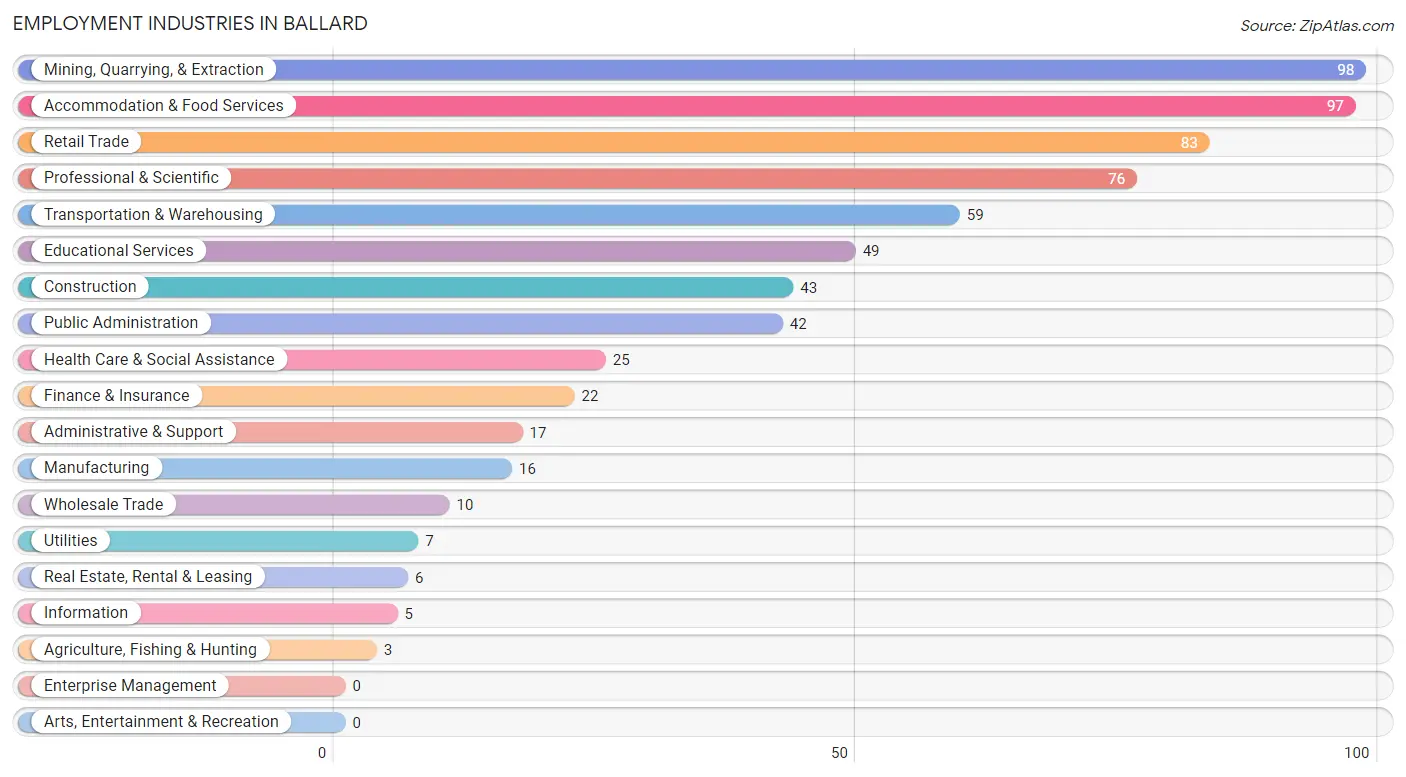
Employment Industries in Ballard
The major employment industries in Ballard include Mining, Quarrying, & Extraction (98 | 13.8%), Accommodation & Food Services (97 | 13.6%), Retail Trade (83 | 11.7%), Professional & Scientific (76 | 10.7%), and Transportation & Warehousing (59 | 8.3%).
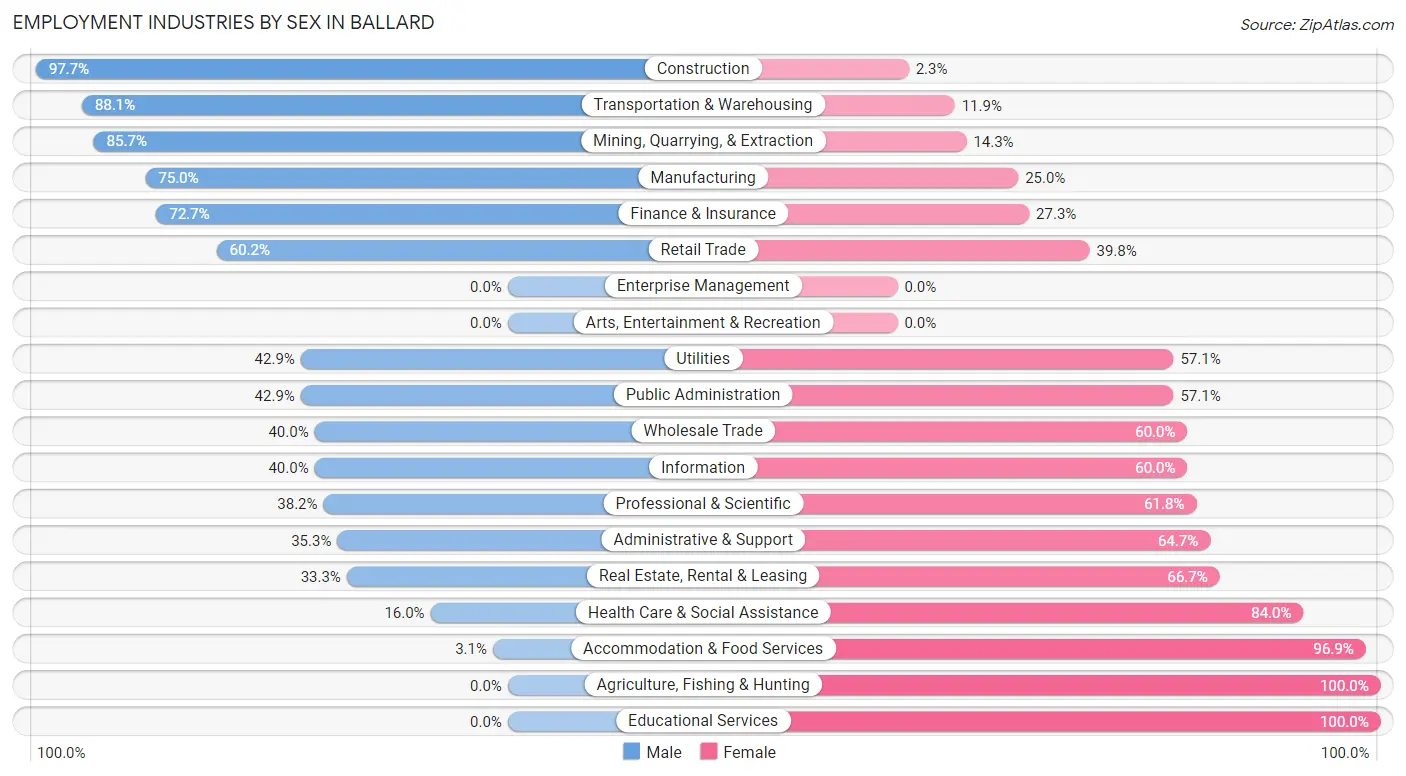
Employment Industries by Sex in Ballard
The Ballard industries that see more men than women are Construction (97.7%), Transportation & Warehousing (88.1%), and Mining, Quarrying, & Extraction (85.7%), whereas the industries that tend to have a higher number of women are Agriculture, Fishing & Hunting (100.0%), Educational Services (100.0%), and Accommodation & Food Services (96.9%).
| Industry | Male | Female |
| Agriculture, Fishing & Hunting | 0 (0.0%) | 3 (100.0%) |
| Mining, Quarrying, & Extraction | 84 (85.7%) | 14 (14.3%) |
| Construction | 42 (97.7%) | 1 (2.3%) |
| Manufacturing | 12 (75.0%) | 4 (25.0%) |
| Wholesale Trade | 4 (40.0%) | 6 (60.0%) |
| Retail Trade | 50 (60.2%) | 33 (39.8%) |
| Transportation & Warehousing | 52 (88.1%) | 7 (11.9%) |
| Utilities | 3 (42.9%) | 4 (57.1%) |
| Information | 2 (40.0%) | 3 (60.0%) |
| Finance & Insurance | 16 (72.7%) | 6 (27.3%) |
| Real Estate, Rental & Leasing | 2 (33.3%) | 4 (66.7%) |
| Professional & Scientific | 29 (38.2%) | 47 (61.8%) |
| Enterprise Management | 0 (0.0%) | 0 (0.0%) |
| Administrative & Support | 6 (35.3%) | 11 (64.7%) |
| Educational Services | 0 (0.0%) | 49 (100.0%) |
| Health Care & Social Assistance | 4 (16.0%) | 21 (84.0%) |
| Arts, Entertainment & Recreation | 0 (0.0%) | 0 (0.0%) |
| Accommodation & Food Services | 3 (3.1%) | 94 (96.9%) |
| Public Administration | 18 (42.9%) | 24 (57.1%) |
| Total | 354 (49.8%) | 357 (50.2%) |
Education in Ballard
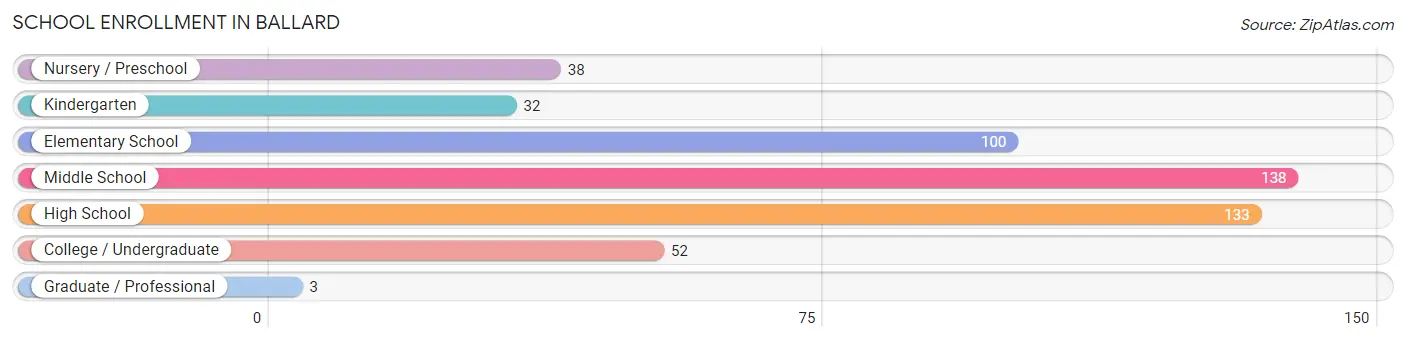
School Enrollment in Ballard
The most common levels of schooling among the 496 students in Ballard are middle school (138 | 27.8%), high school (133 | 26.8%), and elementary school (100 | 20.2%).
| School Level | # Students | % Students |
| Nursery / Preschool | 38 | 7.7% |
| Kindergarten | 32 | 6.5% |
| Elementary School | 100 | 20.2% |
| Middle School | 138 | 27.8% |
| High School | 133 | 26.8% |
| College / Undergraduate | 52 | 10.5% |
| Graduate / Professional | 3 | 0.6% |
| Total | 496 | 100.0% |
School Enrollment by Age by Funding Source in Ballard
Out of a total of 496 students who are enrolled in schools in Ballard, 46 (9.3%) attend a private institution, while the remaining 450 (90.7%) are enrolled in public schools. The age group of 35 years and over has the highest likelihood of being enrolled in private schools, with 4 (57.1% in the age bracket) enrolled. Conversely, the age group of 18 to 19 year olds has the lowest likelihood of being enrolled in a private school, with 22 (100.0% in the age bracket) attending a public institution.
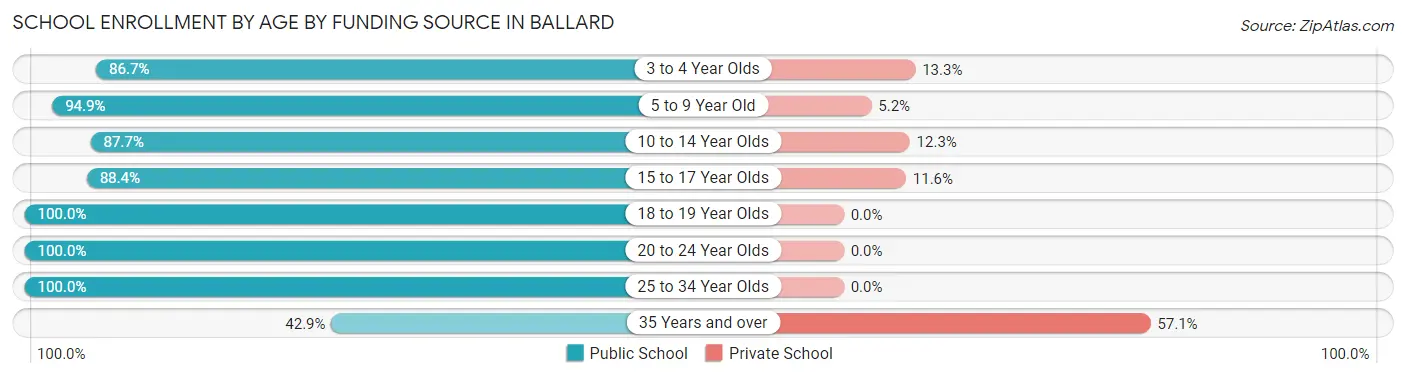
| Age Bracket | Public School | Private School |
| 3 to 4 Year Olds | 13 (86.7%) | 2 (13.3%) |
| 5 to 9 Year Old | 129 (94.9%) | 7 (5.1%) |
| 10 to 14 Year Olds | 157 (87.7%) | 22 (12.3%) |
| 15 to 17 Year Olds | 84 (88.4%) | 11 (11.6%) |
| 18 to 19 Year Olds | 22 (100.0%) | 0 (0.0%) |
| 20 to 24 Year Olds | 23 (100.0%) | 0 (0.0%) |
| 25 to 34 Year Olds | 19 (100.0%) | 0 (0.0%) |
| 35 Years and over | 3 (42.9%) | 4 (57.1%) |
| Total | 450 (90.7%) | 46 (9.3%) |
Educational Attainment by Field of Study in Ballard
Education (36 | 30.0%), science & technology (24 | 20.0%), business (18 | 15.0%), bio, nature & agricultural (16 | 13.3%), and psychology (8 | 6.7%) are the most common fields of study among 120 individuals in Ballard who have obtained a bachelor's degree or higher.
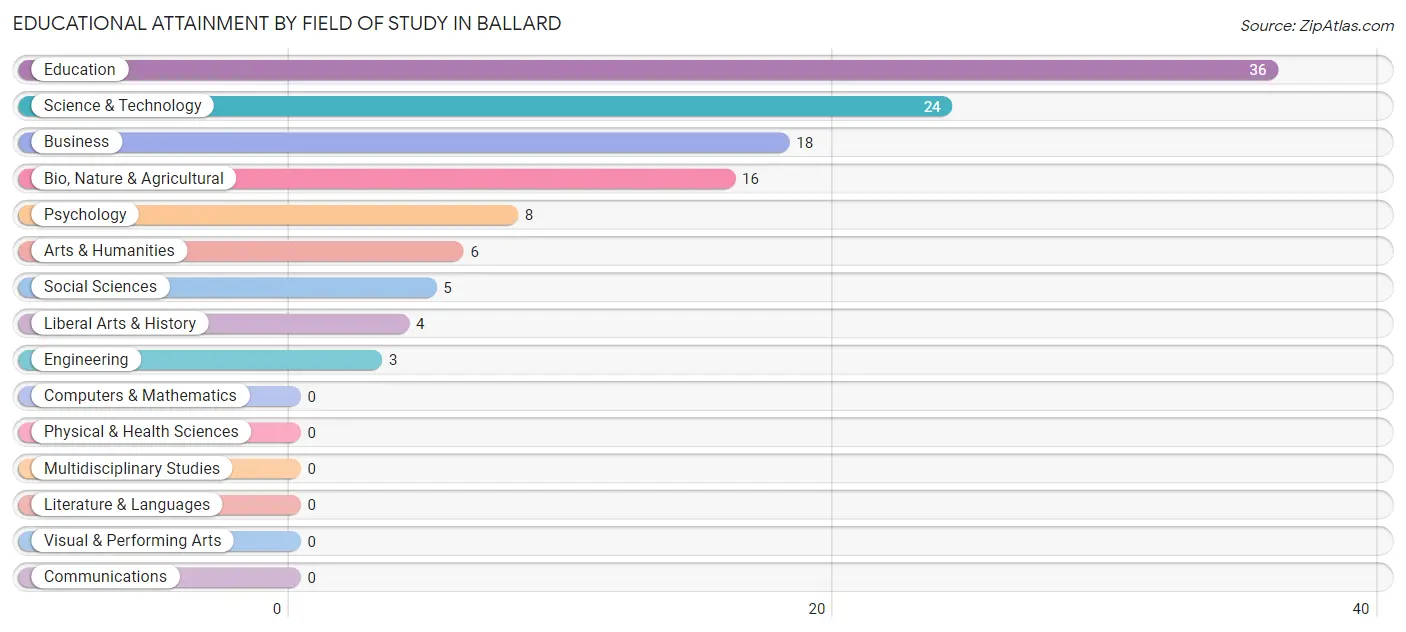
| Field of Study | # Graduates | % Graduates |
| Computers & Mathematics | 0 | 0.0% |
| Bio, Nature & Agricultural | 16 | 13.3% |
| Physical & Health Sciences | 0 | 0.0% |
| Psychology | 8 | 6.7% |
| Social Sciences | 5 | 4.2% |
| Engineering | 3 | 2.5% |
| Multidisciplinary Studies | 0 | 0.0% |
| Science & Technology | 24 | 20.0% |
| Business | 18 | 15.0% |
| Education | 36 | 30.0% |
| Literature & Languages | 0 | 0.0% |
| Liberal Arts & History | 4 | 3.3% |
| Visual & Performing Arts | 0 | 0.0% |
| Communications | 0 | 0.0% |
| Arts & Humanities | 6 | 5.0% |
| Total | 120 | 100.0% |
Transportation & Commute in Ballard
Vehicle Availability by Sex in Ballard
The most prevalent vehicle ownership categories in Ballard are males with 2 vehicles (111, accounting for 31.4%) and females with 2 vehicles (57, making up 32.3%).
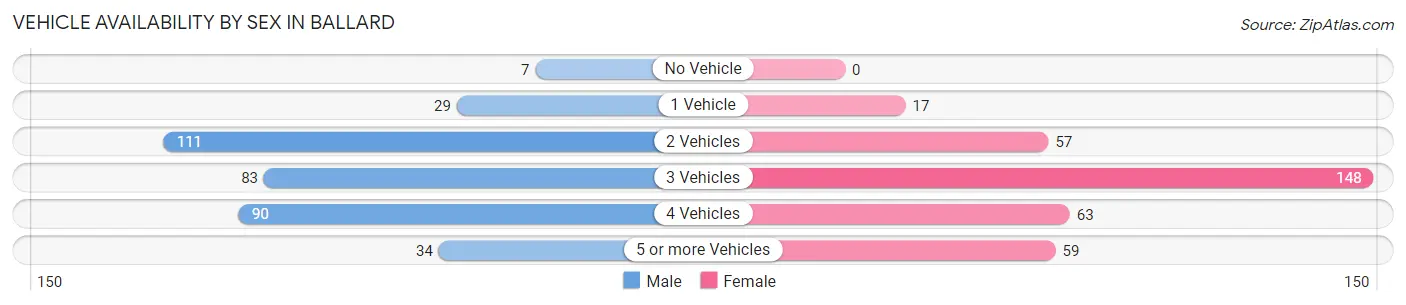
| Vehicles Available | Male | Female |
| No Vehicle | 7 (2.0%) | 0 (0.0%) |
| 1 Vehicle | 29 (8.2%) | 17 (4.9%) |
| 2 Vehicles | 111 (31.4%) | 57 (16.6%) |
| 3 Vehicles | 83 (23.4%) | 148 (43.0%) |
| 4 Vehicles | 90 (25.4%) | 63 (18.3%) |
| 5 or more Vehicles | 34 (9.6%) | 59 (17.2%) |
| Total | 354 (100.0%) | 344 (100.0%) |
Commute Time in Ballard
The most frequently occuring commute durations in Ballard are 10 to 14 minutes (193 commuters, 31.1%), 5 to 9 minutes (144 commuters, 23.2%), and 30 to 34 minutes (73 commuters, 11.8%).
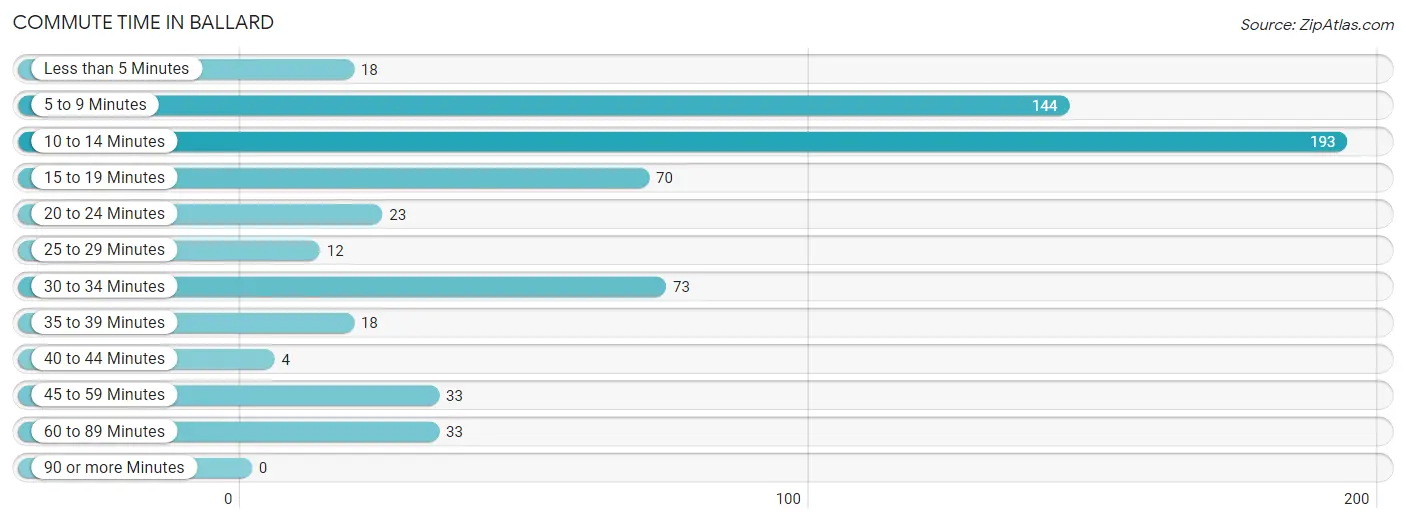
| Commute Time | # Commuters | % Commuters |
| Less than 5 Minutes | 18 | 2.9% |
| 5 to 9 Minutes | 144 | 23.2% |
| 10 to 14 Minutes | 193 | 31.1% |
| 15 to 19 Minutes | 70 | 11.3% |
| 20 to 24 Minutes | 23 | 3.7% |
| 25 to 29 Minutes | 12 | 1.9% |
| 30 to 34 Minutes | 73 | 11.8% |
| 35 to 39 Minutes | 18 | 2.9% |
| 40 to 44 Minutes | 4 | 0.6% |
| 45 to 59 Minutes | 33 | 5.3% |
| 60 to 89 Minutes | 33 | 5.3% |
| 90 or more Minutes | 0 | 0.0% |
Commute Time by Sex in Ballard
The most common commute times in Ballard are 30 to 34 minutes (63 commuters, 19.3%) for males and 10 to 14 minutes (137 commuters, 46.6%) for females.
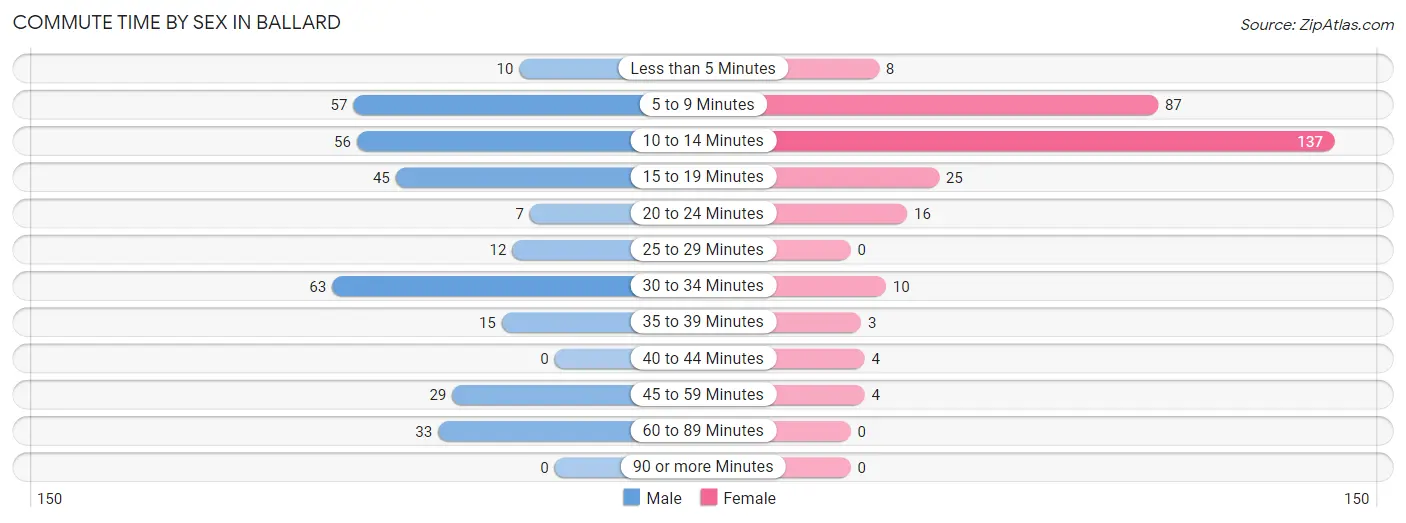
| Commute Time | Male | Female |
| Less than 5 Minutes | 10 (3.1%) | 8 (2.7%) |
| 5 to 9 Minutes | 57 (17.4%) | 87 (29.6%) |
| 10 to 14 Minutes | 56 (17.1%) | 137 (46.6%) |
| 15 to 19 Minutes | 45 (13.8%) | 25 (8.5%) |
| 20 to 24 Minutes | 7 (2.1%) | 16 (5.4%) |
| 25 to 29 Minutes | 12 (3.7%) | 0 (0.0%) |
| 30 to 34 Minutes | 63 (19.3%) | 10 (3.4%) |
| 35 to 39 Minutes | 15 (4.6%) | 3 (1.0%) |
| 40 to 44 Minutes | 0 (0.0%) | 4 (1.4%) |
| 45 to 59 Minutes | 29 (8.9%) | 4 (1.4%) |
| 60 to 89 Minutes | 33 (10.1%) | 0 (0.0%) |
| 90 or more Minutes | 0 (0.0%) | 0 (0.0%) |
Time of Departure to Work by Sex in Ballard
The most frequent times of departure to work in Ballard are 6:30 AM to 6:59 AM (74, 22.6%) for males and 7:30 AM to 7:59 AM (87, 29.6%) for females.
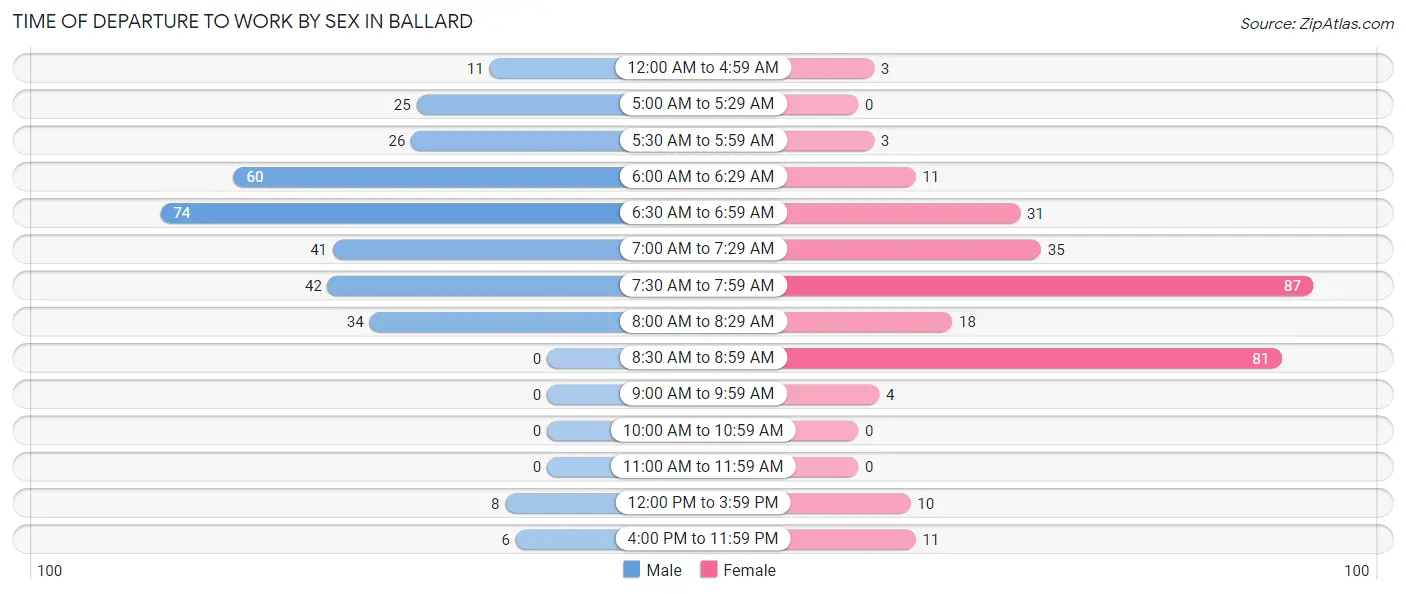
| Time of Departure | Male | Female |
| 12:00 AM to 4:59 AM | 11 (3.4%) | 3 (1.0%) |
| 5:00 AM to 5:29 AM | 25 (7.6%) | 0 (0.0%) |
| 5:30 AM to 5:59 AM | 26 (8.0%) | 3 (1.0%) |
| 6:00 AM to 6:29 AM | 60 (18.3%) | 11 (3.7%) |
| 6:30 AM to 6:59 AM | 74 (22.6%) | 31 (10.5%) |
| 7:00 AM to 7:29 AM | 41 (12.5%) | 35 (11.9%) |
| 7:30 AM to 7:59 AM | 42 (12.8%) | 87 (29.6%) |
| 8:00 AM to 8:29 AM | 34 (10.4%) | 18 (6.1%) |
| 8:30 AM to 8:59 AM | 0 (0.0%) | 81 (27.6%) |
| 9:00 AM to 9:59 AM | 0 (0.0%) | 4 (1.4%) |
| 10:00 AM to 10:59 AM | 0 (0.0%) | 0 (0.0%) |
| 11:00 AM to 11:59 AM | 0 (0.0%) | 0 (0.0%) |
| 12:00 PM to 3:59 PM | 8 (2.5%) | 10 (3.4%) |
| 4:00 PM to 11:59 PM | 6 (1.8%) | 11 (3.7%) |
| Total | 327 (100.0%) | 294 (100.0%) |
Housing Occupancy in Ballard
Occupancy by Ownership in Ballard
Of the total 458 dwellings in Ballard, owner-occupied units account for 406 (88.6%), while renter-occupied units make up 52 (11.4%).
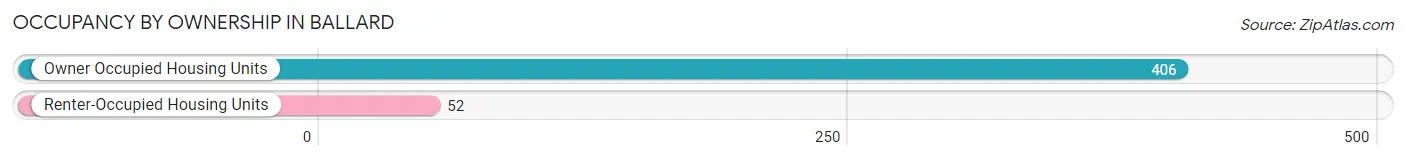
| Occupancy | # Housing Units | % Housing Units |
| Owner Occupied Housing Units | 406 | 88.6% |
| Renter-Occupied Housing Units | 52 | 11.4% |
| Total Occupied Housing Units | 458 | 100.0% |
Occupancy by Household Size in Ballard
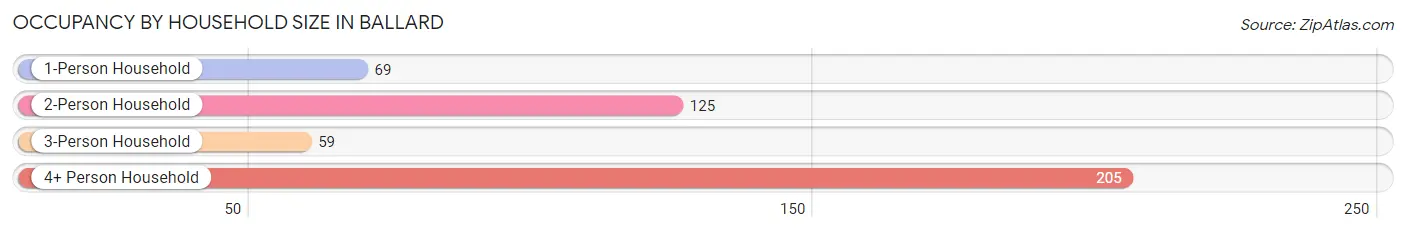
| Household Size | # Housing Units | % Housing Units |
| 1-Person Household | 69 | 15.1% |
| 2-Person Household | 125 | 27.3% |
| 3-Person Household | 59 | 12.9% |
| 4+ Person Household | 205 | 44.8% |
| Total Housing Units | 458 | 100.0% |
Occupancy by Ownership by Household Size in Ballard
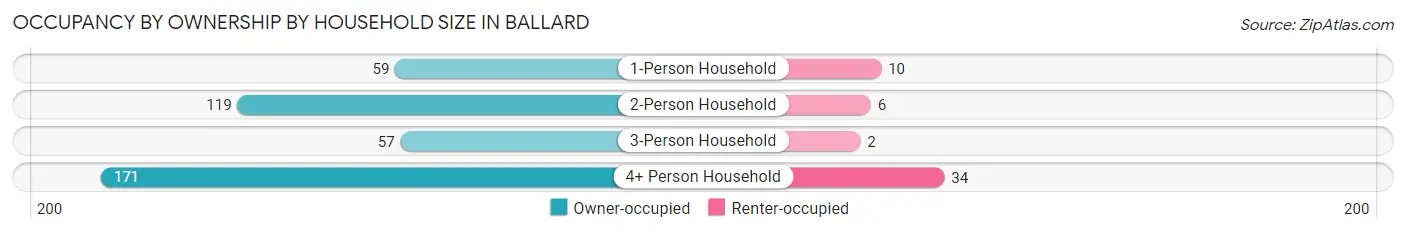
| Household Size | Owner-occupied | Renter-occupied |
| 1-Person Household | 59 (85.5%) | 10 (14.5%) |
| 2-Person Household | 119 (95.2%) | 6 (4.8%) |
| 3-Person Household | 57 (96.6%) | 2 (3.4%) |
| 4+ Person Household | 171 (83.4%) | 34 (16.6%) |
| Total Housing Units | 406 (88.6%) | 52 (11.4%) |
Occupancy by Educational Attainment in Ballard
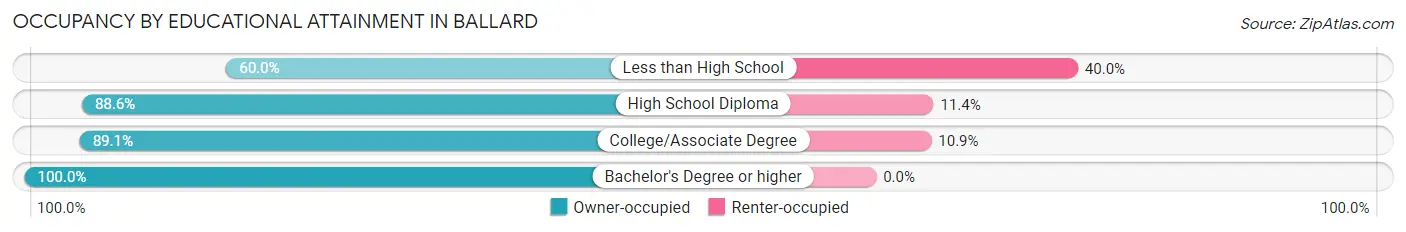
| Household Size | Owner-occupied | Renter-occupied |
| Less than High School | 18 (60.0%) | 12 (40.0%) |
| High School Diploma | 148 (88.6%) | 19 (11.4%) |
| College/Associate Degree | 171 (89.1%) | 21 (10.9%) |
| Bachelor's Degree or higher | 69 (100.0%) | 0 (0.0%) |
Occupancy by Age of Householder in Ballard
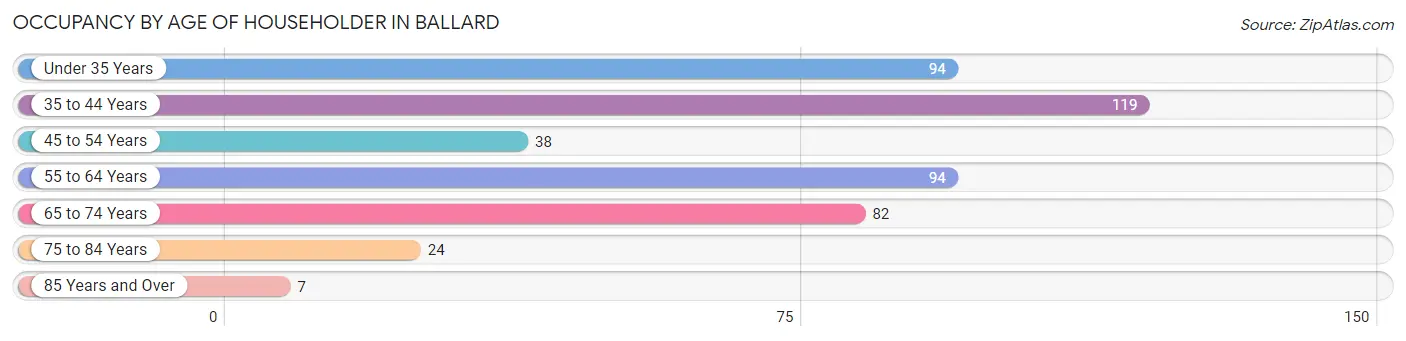
| Age Bracket | # Households | % Households |
| Under 35 Years | 94 | 20.5% |
| 35 to 44 Years | 119 | 26.0% |
| 45 to 54 Years | 38 | 8.3% |
| 55 to 64 Years | 94 | 20.5% |
| 65 to 74 Years | 82 | 17.9% |
| 75 to 84 Years | 24 | 5.2% |
| 85 Years and Over | 7 | 1.5% |
| Total | 458 | 100.0% |
Housing Finances in Ballard
Median Income by Occupancy in Ballard
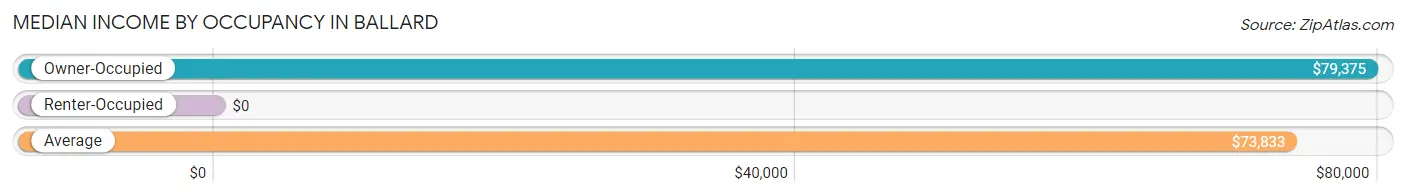
| Occupancy Type | # Households | Median Income |
| Owner-Occupied | 406 (88.6%) | $79,375 |
| Renter-Occupied | 52 (11.4%) | $0 |
| Average | 458 (100.0%) | $73,833 |
Occupancy by Householder Income Bracket in Ballard
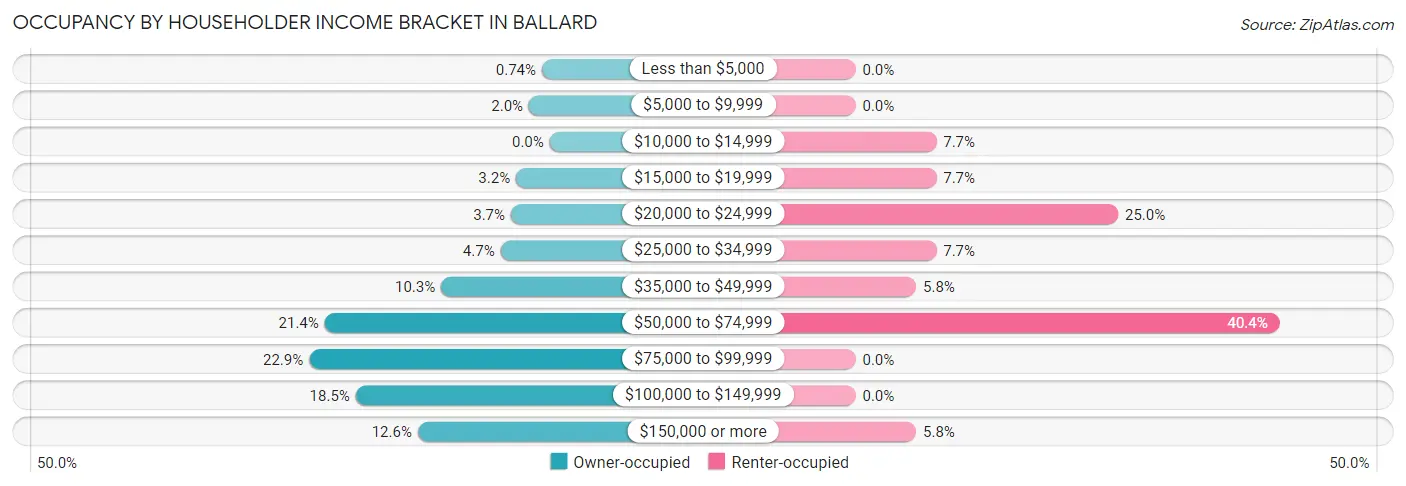
| Income Bracket | Owner-occupied | Renter-occupied |
| Less than $5,000 | 3 (0.7%) | 0 (0.0%) |
| $5,000 to $9,999 | 8 (2.0%) | 0 (0.0%) |
| $10,000 to $14,999 | 0 (0.0%) | 4 (7.7%) |
| $15,000 to $19,999 | 13 (3.2%) | 4 (7.7%) |
| $20,000 to $24,999 | 15 (3.7%) | 13 (25.0%) |
| $25,000 to $34,999 | 19 (4.7%) | 4 (7.7%) |
| $35,000 to $49,999 | 42 (10.3%) | 3 (5.8%) |
| $50,000 to $74,999 | 87 (21.4%) | 21 (40.4%) |
| $75,000 to $99,999 | 93 (22.9%) | 0 (0.0%) |
| $100,000 to $149,999 | 75 (18.5%) | 0 (0.0%) |
| $150,000 or more | 51 (12.6%) | 3 (5.8%) |
| Total | 406 (100.0%) | 52 (100.0%) |
Monthly Housing Cost Tiers in Ballard
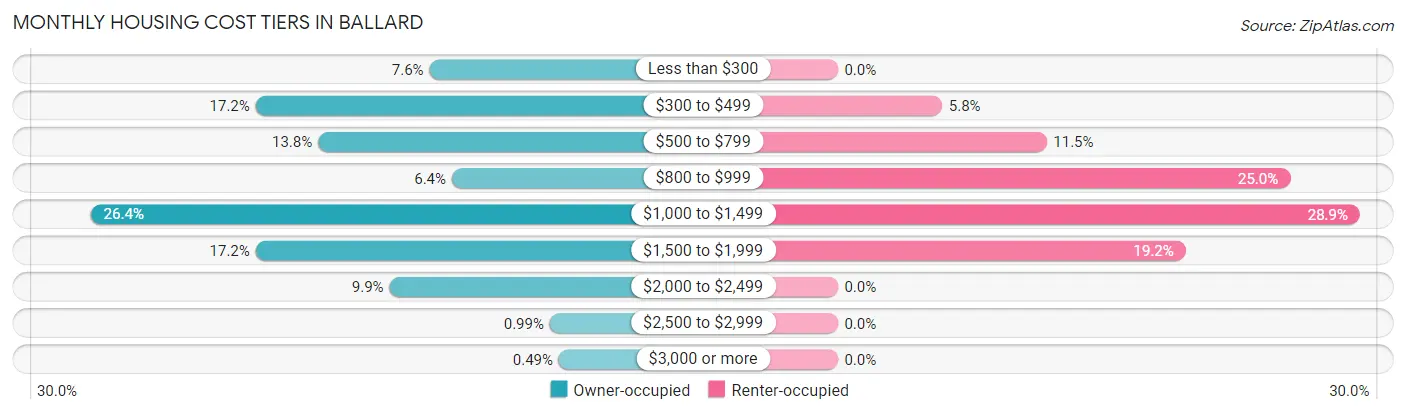
| Monthly Cost | Owner-occupied | Renter-occupied |
| Less than $300 | 31 (7.6%) | 0 (0.0%) |
| $300 to $499 | 70 (17.2%) | 3 (5.8%) |
| $500 to $799 | 56 (13.8%) | 6 (11.5%) |
| $800 to $999 | 26 (6.4%) | 13 (25.0%) |
| $1,000 to $1,499 | 107 (26.4%) | 15 (28.8%) |
| $1,500 to $1,999 | 70 (17.2%) | 10 (19.2%) |
| $2,000 to $2,499 | 40 (9.9%) | 0 (0.0%) |
| $2,500 to $2,999 | 4 (1.0%) | 0 (0.0%) |
| $3,000 or more | 2 (0.5%) | 0 (0.0%) |
| Total | 406 (100.0%) | 52 (100.0%) |
Physical Housing Characteristics in Ballard
Housing Structures in Ballard
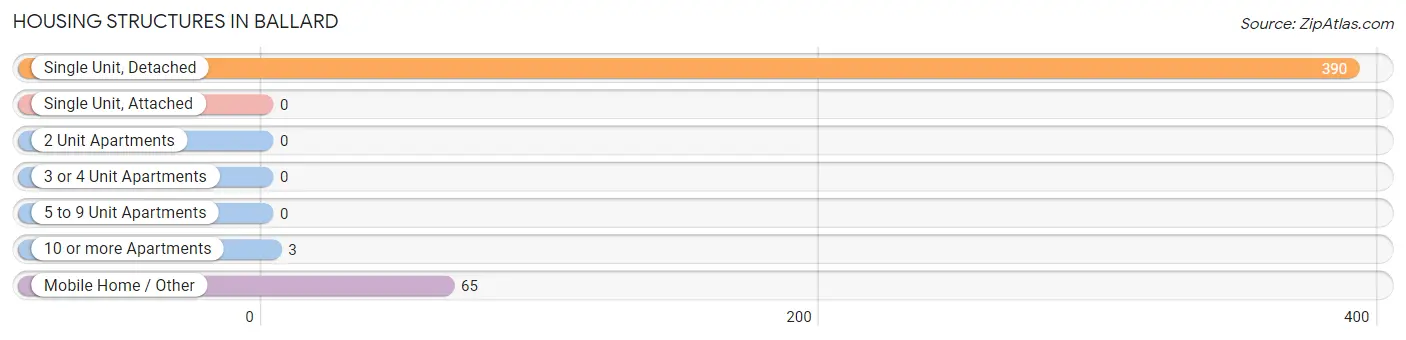
| Structure Type | # Housing Units | % Housing Units |
| Single Unit, Detached | 390 | 85.2% |
| Single Unit, Attached | 0 | 0.0% |
| 2 Unit Apartments | 0 | 0.0% |
| 3 or 4 Unit Apartments | 0 | 0.0% |
| 5 to 9 Unit Apartments | 0 | 0.0% |
| 10 or more Apartments | 3 | 0.7% |
| Mobile Home / Other | 65 | 14.2% |
| Total | 458 | 100.0% |
Housing Structures by Occupancy in Ballard
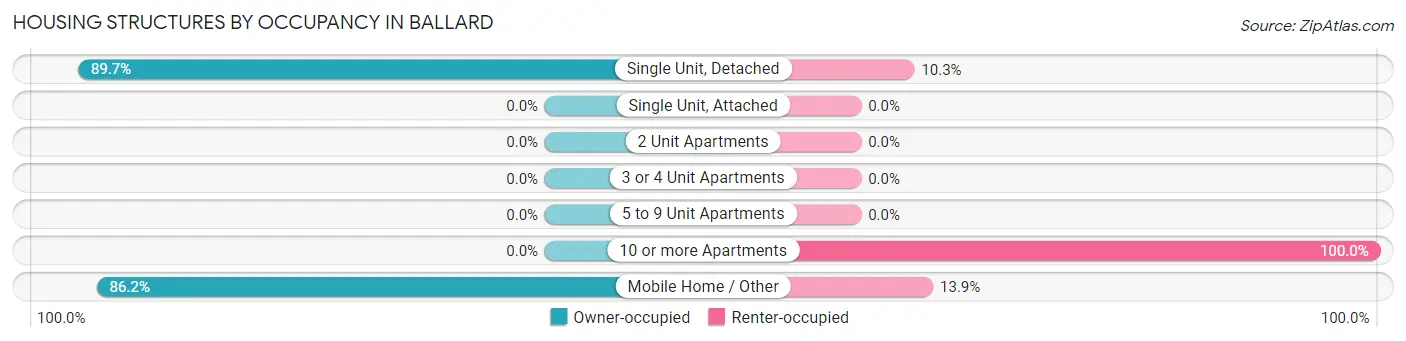
| Structure Type | Owner-occupied | Renter-occupied |
| Single Unit, Detached | 350 (89.7%) | 40 (10.3%) |
| Single Unit, Attached | 0 (0.0%) | 0 (0.0%) |
| 2 Unit Apartments | 0 (0.0%) | 0 (0.0%) |
| 3 or 4 Unit Apartments | 0 (0.0%) | 0 (0.0%) |
| 5 to 9 Unit Apartments | 0 (0.0%) | 0 (0.0%) |
| 10 or more Apartments | 0 (0.0%) | 3 (100.0%) |
| Mobile Home / Other | 56 (86.2%) | 9 (13.9%) |
| Total | 406 (88.6%) | 52 (11.4%) |
Housing Structures by Number of Rooms in Ballard
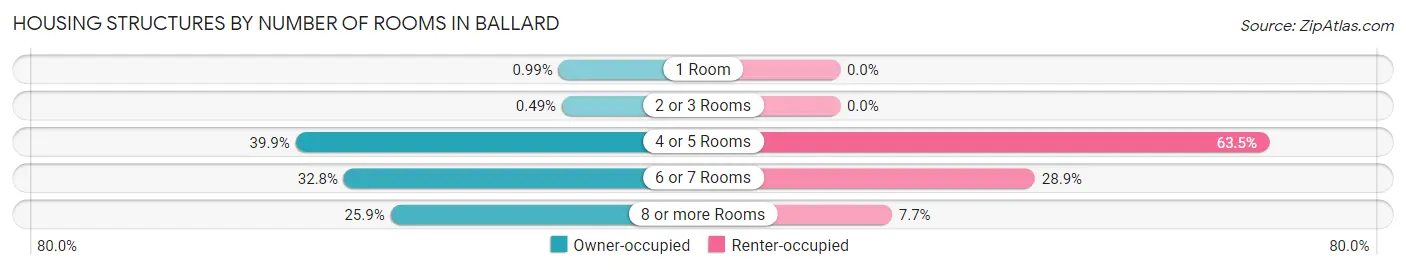
| Number of Rooms | Owner-occupied | Renter-occupied |
| 1 Room | 4 (1.0%) | 0 (0.0%) |
| 2 or 3 Rooms | 2 (0.5%) | 0 (0.0%) |
| 4 or 5 Rooms | 162 (39.9%) | 33 (63.5%) |
| 6 or 7 Rooms | 133 (32.8%) | 15 (28.8%) |
| 8 or more Rooms | 105 (25.9%) | 4 (7.7%) |
| Total | 406 (100.0%) | 52 (100.0%) |
Housing Structure by Heating Type in Ballard
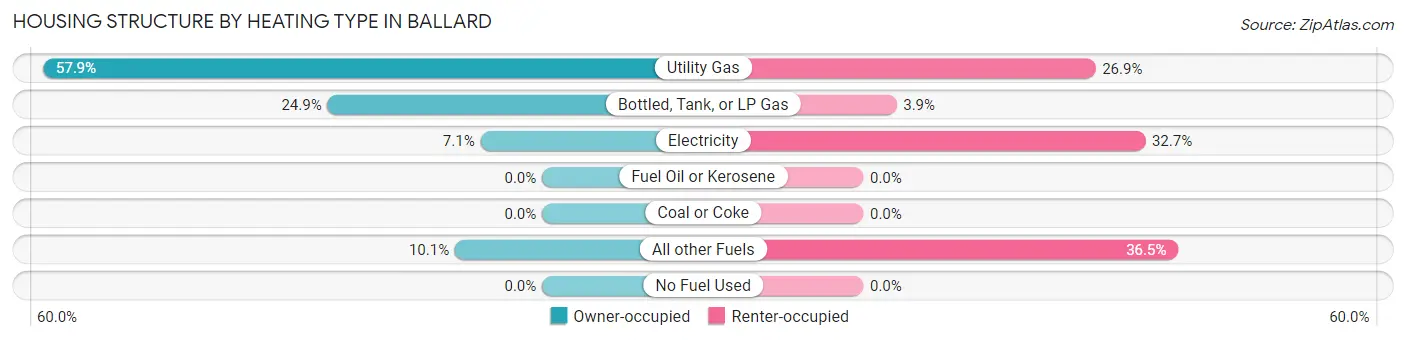
| Heating Type | Owner-occupied | Renter-occupied |
| Utility Gas | 235 (57.9%) | 14 (26.9%) |
| Bottled, Tank, or LP Gas | 101 (24.9%) | 2 (3.8%) |
| Electricity | 29 (7.1%) | 17 (32.7%) |
| Fuel Oil or Kerosene | 0 (0.0%) | 0 (0.0%) |
| Coal or Coke | 0 (0.0%) | 0 (0.0%) |
| All other Fuels | 41 (10.1%) | 19 (36.5%) |
| No Fuel Used | 0 (0.0%) | 0 (0.0%) |
| Total | 406 (100.0%) | 52 (100.0%) |
Household Vehicle Usage in Ballard
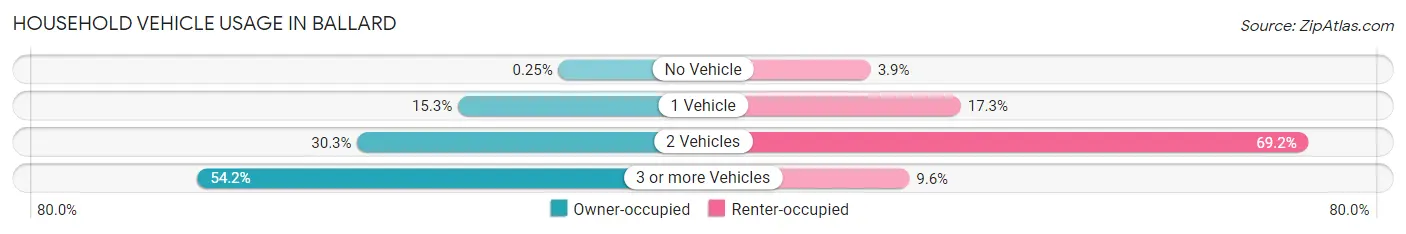
| Vehicles per Household | Owner-occupied | Renter-occupied |
| No Vehicle | 1 (0.3%) | 2 (3.8%) |
| 1 Vehicle | 62 (15.3%) | 9 (17.3%) |
| 2 Vehicles | 123 (30.3%) | 36 (69.2%) |
| 3 or more Vehicles | 220 (54.2%) | 5 (9.6%) |
| Total | 406 (100.0%) | 52 (100.0%) |
Real Estate & Mortgages in Ballard
Real Estate and Mortgage Overview in Ballard
| Characteristic | Without Mortgage | With Mortgage |
| Housing Units | 164 | 242 |
| Median Property Value | $221,400 | $225,000 |
| Median Household Income | $50,833 | $40 |
| Monthly Housing Costs | $443 | $0 |
| Real Estate Taxes | $1,571 | $7 |
Property Value by Mortgage Status in Ballard
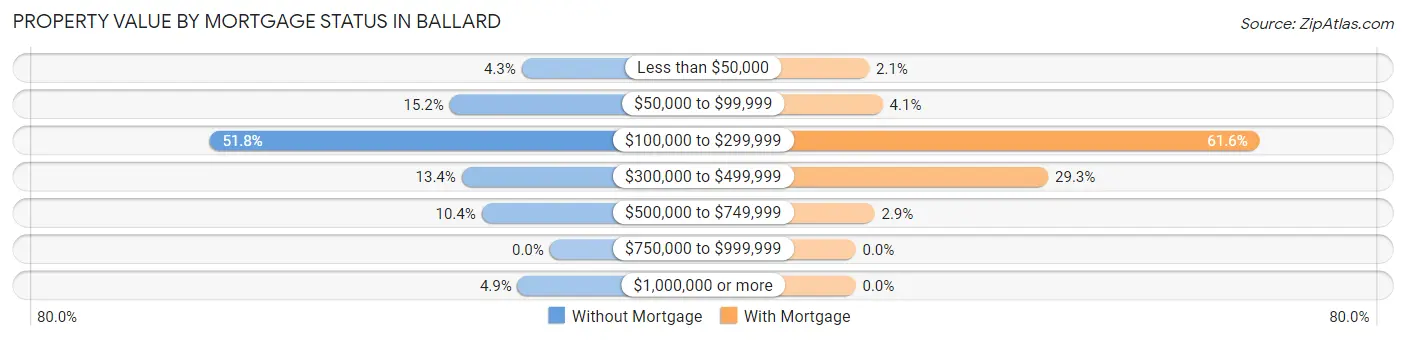
| Property Value | Without Mortgage | With Mortgage |
| Less than $50,000 | 7 (4.3%) | 5 (2.1%) |
| $50,000 to $99,999 | 25 (15.2%) | 10 (4.1%) |
| $100,000 to $299,999 | 85 (51.8%) | 149 (61.6%) |
| $300,000 to $499,999 | 22 (13.4%) | 71 (29.3%) |
| $500,000 to $749,999 | 17 (10.4%) | 7 (2.9%) |
| $750,000 to $999,999 | 0 (0.0%) | 0 (0.0%) |
| $1,000,000 or more | 8 (4.9%) | 0 (0.0%) |
| Total | 164 (100.0%) | 242 (100.0%) |
Household Income by Mortgage Status in Ballard
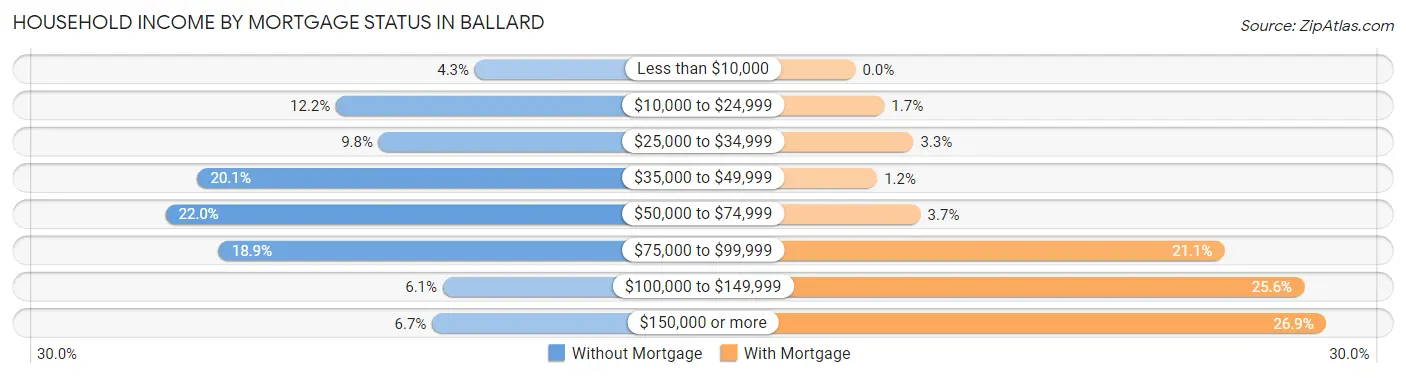
| Household Income | Without Mortgage | With Mortgage |
| Less than $10,000 | 7 (4.3%) | 0 (0.0%) |
| $10,000 to $24,999 | 20 (12.2%) | 4 (1.7%) |
| $25,000 to $34,999 | 16 (9.8%) | 8 (3.3%) |
| $35,000 to $49,999 | 33 (20.1%) | 3 (1.2%) |
| $50,000 to $74,999 | 36 (22.0%) | 9 (3.7%) |
| $75,000 to $99,999 | 31 (18.9%) | 51 (21.1%) |
| $100,000 to $149,999 | 10 (6.1%) | 62 (25.6%) |
| $150,000 or more | 11 (6.7%) | 65 (26.9%) |
| Total | 164 (100.0%) | 242 (100.0%) |
Property Value to Household Income Ratio in Ballard
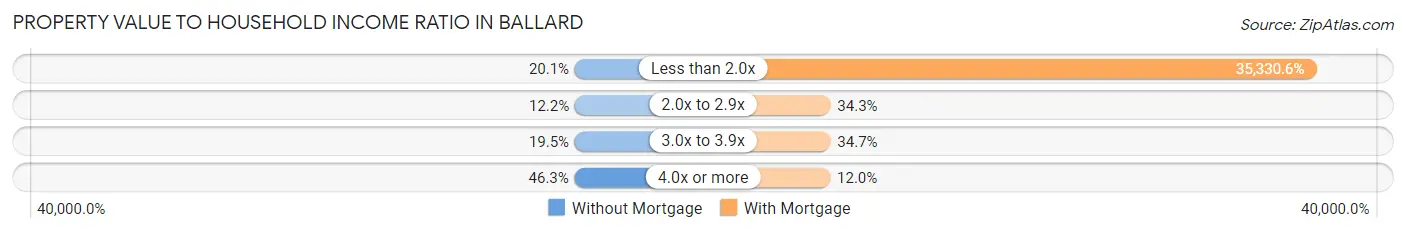
| Value-to-Income Ratio | Without Mortgage | With Mortgage |
| Less than 2.0x | 33 (20.1%) | 85,500 (35,330.6%) |
| 2.0x to 2.9x | 20 (12.2%) | 83 (34.3%) |
| 3.0x to 3.9x | 32 (19.5%) | 84 (34.7%) |
| 4.0x or more | 76 (46.3%) | 29 (12.0%) |
| Total | 164 (100.0%) | 242 (100.0%) |
Real Estate Taxes by Mortgage Status in Ballard
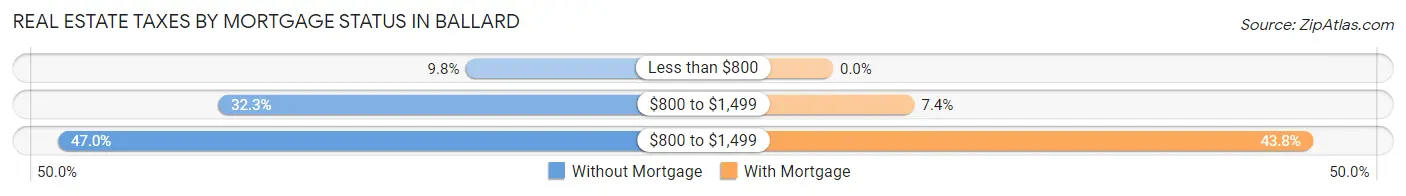
| Property Taxes | Without Mortgage | With Mortgage |
| Less than $800 | 16 (9.8%) | 0 (0.0%) |
| $800 to $1,499 | 53 (32.3%) | 18 (7.4%) |
| $800 to $1,499 | 77 (46.9%) | 106 (43.8%) |
| Total | 164 (100.0%) | 242 (100.0%) |
Health & Disability in Ballard
Health Insurance Coverage by Age in Ballard
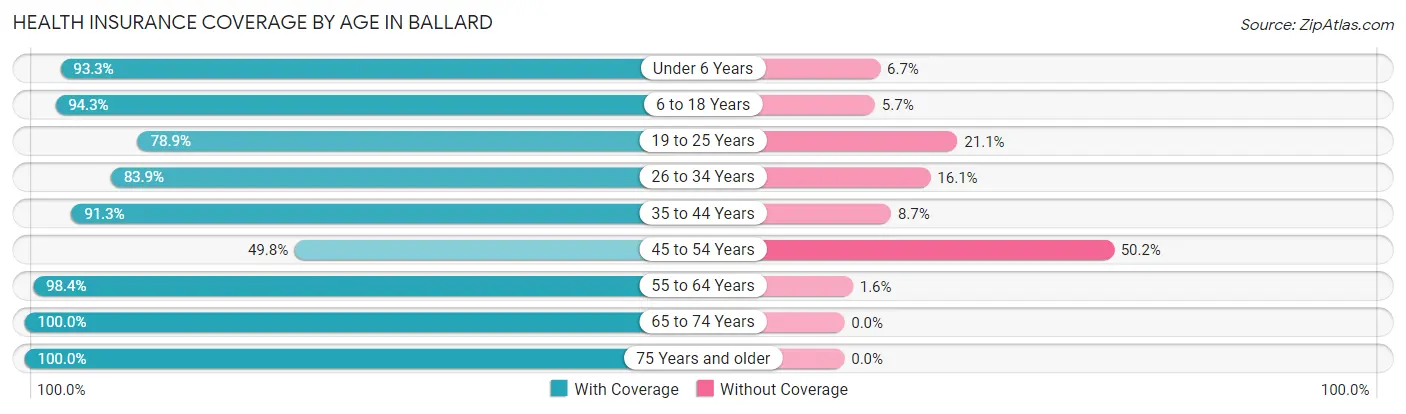
| Age Bracket | With Coverage | Without Coverage |
| Under 6 Years | 140 (93.3%) | 10 (6.7%) |
| 6 to 18 Years | 380 (94.3%) | 23 (5.7%) |
| 19 to 25 Years | 101 (78.9%) | 27 (21.1%) |
| 26 to 34 Years | 183 (83.9%) | 35 (16.1%) |
| 35 to 44 Years | 220 (91.3%) | 21 (8.7%) |
| 45 to 54 Years | 102 (49.8%) | 103 (50.2%) |
| 55 to 64 Years | 187 (98.4%) | 3 (1.6%) |
| 65 to 74 Years | 112 (100.0%) | 0 (0.0%) |
| 75 Years and older | 53 (100.0%) | 0 (0.0%) |
| Total | 1,478 (86.9%) | 222 (13.1%) |
Health Insurance Coverage by Citizenship Status in Ballard
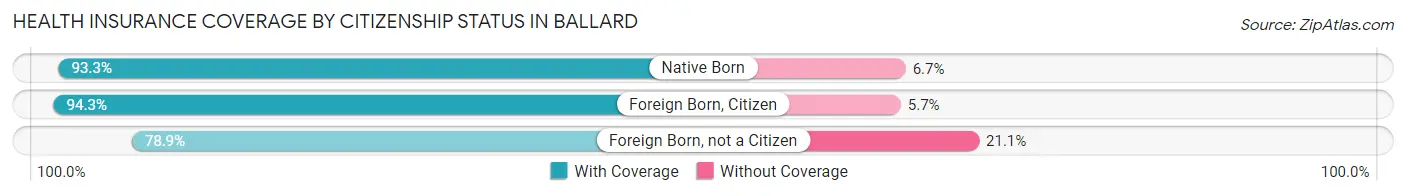
| Citizenship Status | With Coverage | Without Coverage |
| Native Born | 140 (93.3%) | 10 (6.7%) |
| Foreign Born, Citizen | 380 (94.3%) | 23 (5.7%) |
| Foreign Born, not a Citizen | 101 (78.9%) | 27 (21.1%) |
Health Insurance Coverage by Household Income in Ballard
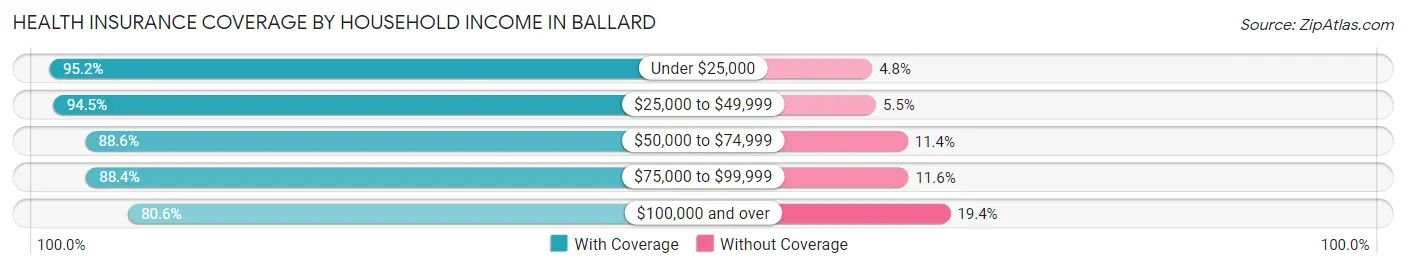
| Household Income | With Coverage | Without Coverage |
| Under $25,000 | 120 (95.2%) | 6 (4.8%) |
| $25,000 to $49,999 | 172 (94.5%) | 10 (5.5%) |
| $50,000 to $74,999 | 457 (88.6%) | 59 (11.4%) |
| $75,000 to $99,999 | 260 (88.4%) | 34 (11.6%) |
| $100,000 and over | 469 (80.6%) | 113 (19.4%) |
Public vs Private Health Insurance Coverage by Age in Ballard
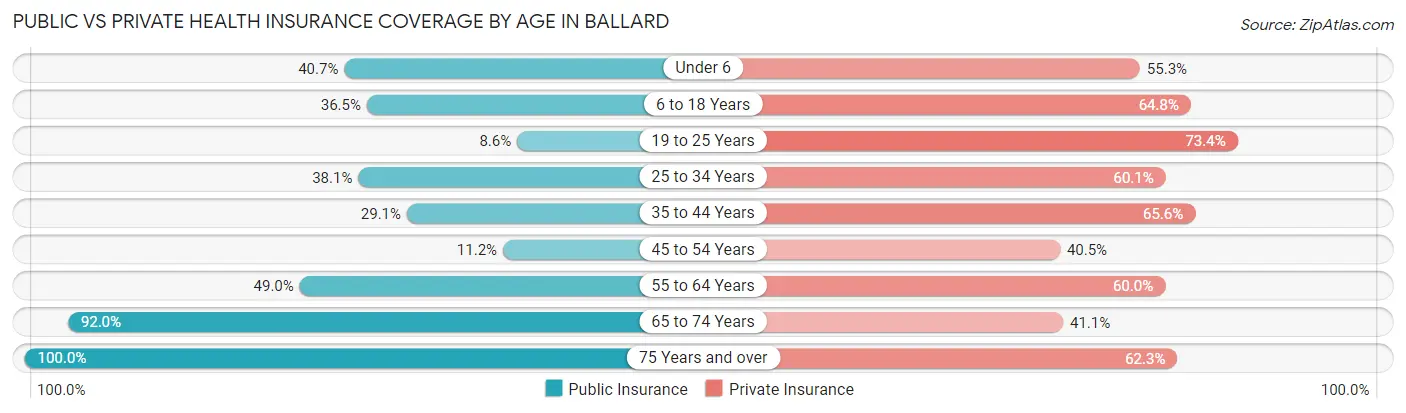
| Age Bracket | Public Insurance | Private Insurance |
| Under 6 | 61 (40.7%) | 83 (55.3%) |
| 6 to 18 Years | 147 (36.5%) | 261 (64.8%) |
| 19 to 25 Years | 11 (8.6%) | 94 (73.4%) |
| 25 to 34 Years | 83 (38.1%) | 131 (60.1%) |
| 35 to 44 Years | 70 (29.0%) | 158 (65.6%) |
| 45 to 54 Years | 23 (11.2%) | 83 (40.5%) |
| 55 to 64 Years | 93 (48.9%) | 114 (60.0%) |
| 65 to 74 Years | 103 (92.0%) | 46 (41.1%) |
| 75 Years and over | 53 (100.0%) | 33 (62.3%) |
| Total | 644 (37.9%) | 1,003 (59.0%) |
Disability Status by Sex by Age in Ballard
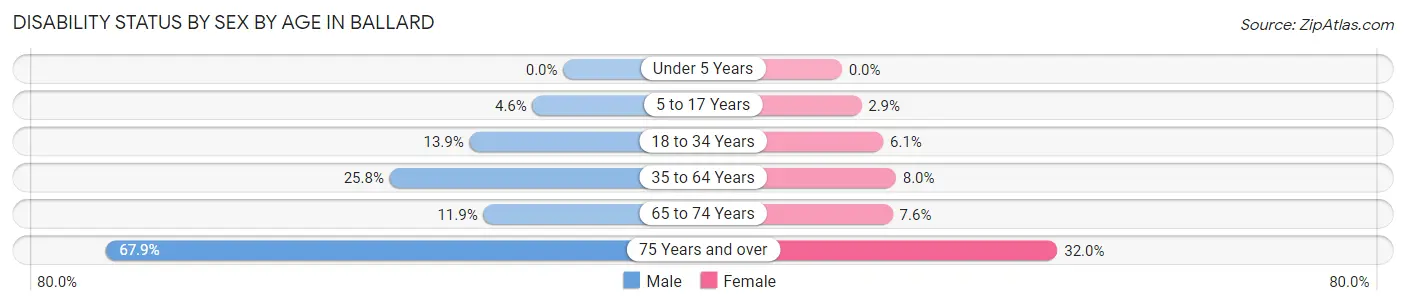
| Age Bracket | Male | Female |
| Under 5 Years | 0 (0.0%) | 0 (0.0%) |
| 5 to 17 Years | 11 (4.6%) | 5 (2.9%) |
| 18 to 34 Years | 28 (13.9%) | 10 (6.1%) |
| 35 to 64 Years | 74 (25.8%) | 28 (8.0%) |
| 65 to 74 Years | 7 (11.9%) | 4 (7.5%) |
| 75 Years and over | 19 (67.9%) | 8 (32.0%) |
Disability Class by Sex by Age in Ballard
Disability Class: Hearing Difficulty
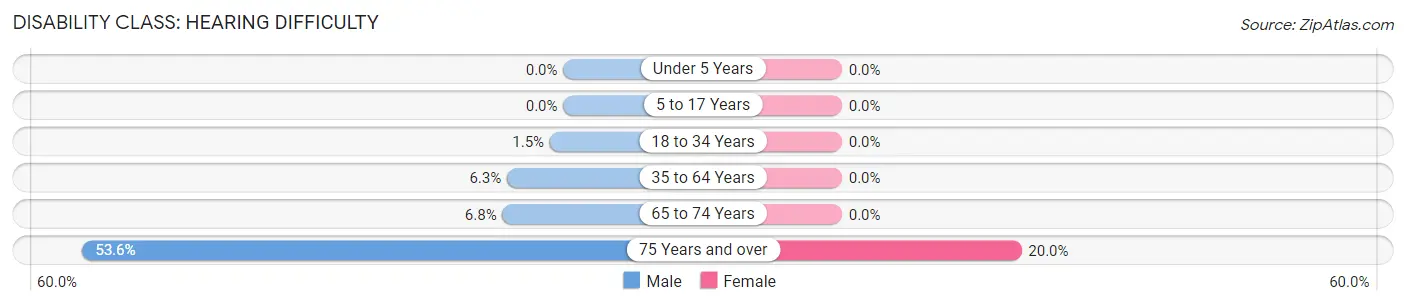
| Age Bracket | Male | Female |
| Under 5 Years | 0 (0.0%) | 0 (0.0%) |
| 5 to 17 Years | 0 (0.0%) | 0 (0.0%) |
| 18 to 34 Years | 3 (1.5%) | 0 (0.0%) |
| 35 to 64 Years | 18 (6.3%) | 0 (0.0%) |
| 65 to 74 Years | 4 (6.8%) | 0 (0.0%) |
| 75 Years and over | 15 (53.6%) | 5 (20.0%) |
Disability Class: Vision Difficulty
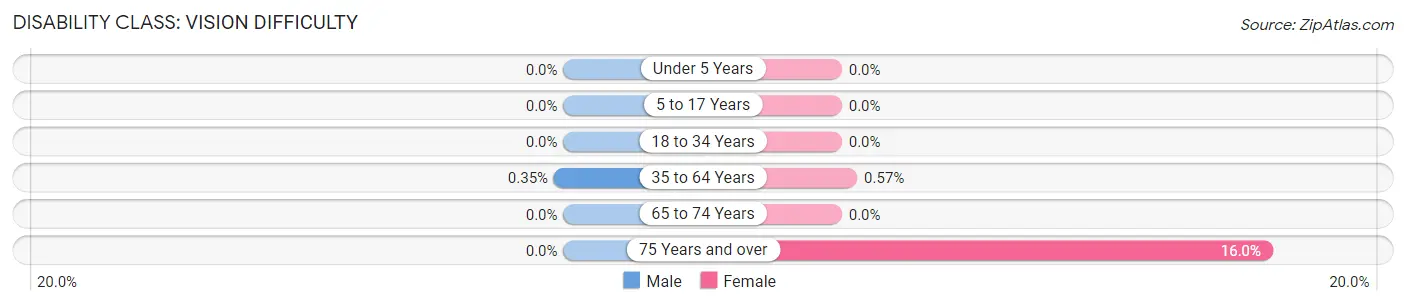
| Age Bracket | Male | Female |
| Under 5 Years | 0 (0.0%) | 0 (0.0%) |
| 5 to 17 Years | 0 (0.0%) | 0 (0.0%) |
| 18 to 34 Years | 0 (0.0%) | 0 (0.0%) |
| 35 to 64 Years | 1 (0.4%) | 2 (0.6%) |
| 65 to 74 Years | 0 (0.0%) | 0 (0.0%) |
| 75 Years and over | 0 (0.0%) | 4 (16.0%) |
Disability Class: Cognitive Difficulty
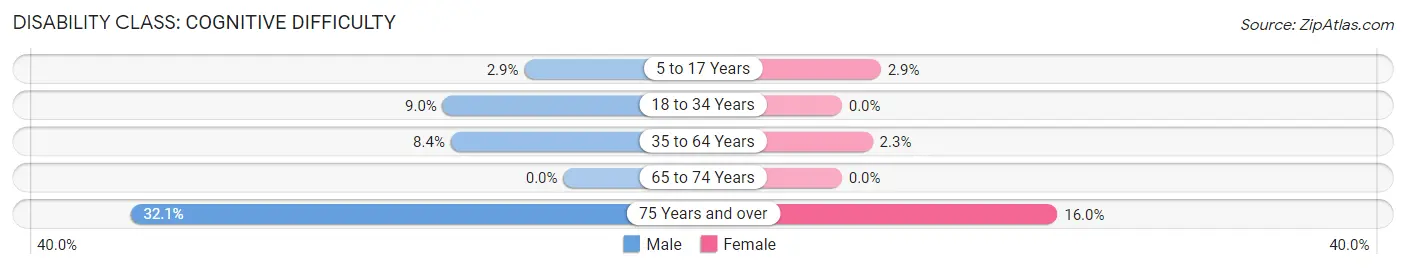
| Age Bracket | Male | Female |
| 5 to 17 Years | 7 (2.9%) | 5 (2.9%) |
| 18 to 34 Years | 18 (9.0%) | 0 (0.0%) |
| 35 to 64 Years | 24 (8.4%) | 8 (2.3%) |
| 65 to 74 Years | 0 (0.0%) | 0 (0.0%) |
| 75 Years and over | 9 (32.1%) | 4 (16.0%) |
Disability Class: Ambulatory Difficulty
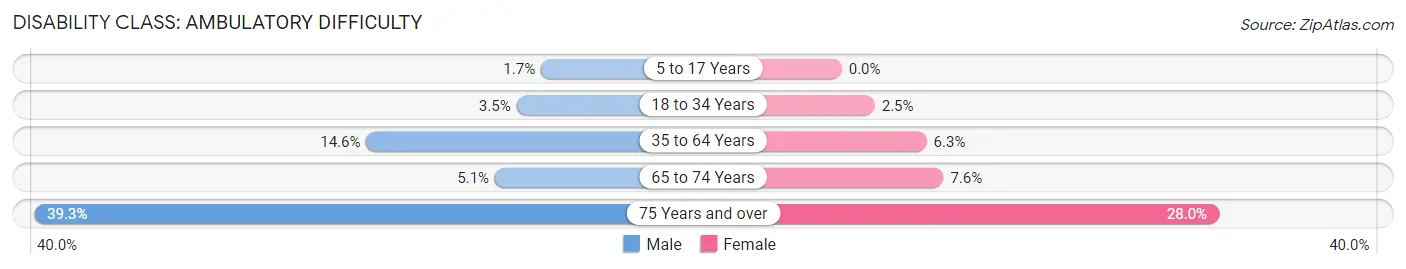
| Age Bracket | Male | Female |
| 5 to 17 Years | 4 (1.7%) | 0 (0.0%) |
| 18 to 34 Years | 7 (3.5%) | 4 (2.5%) |
| 35 to 64 Years | 42 (14.6%) | 22 (6.3%) |
| 65 to 74 Years | 3 (5.1%) | 4 (7.5%) |
| 75 Years and over | 11 (39.3%) | 7 (28.0%) |
Disability Class: Self-Care Difficulty
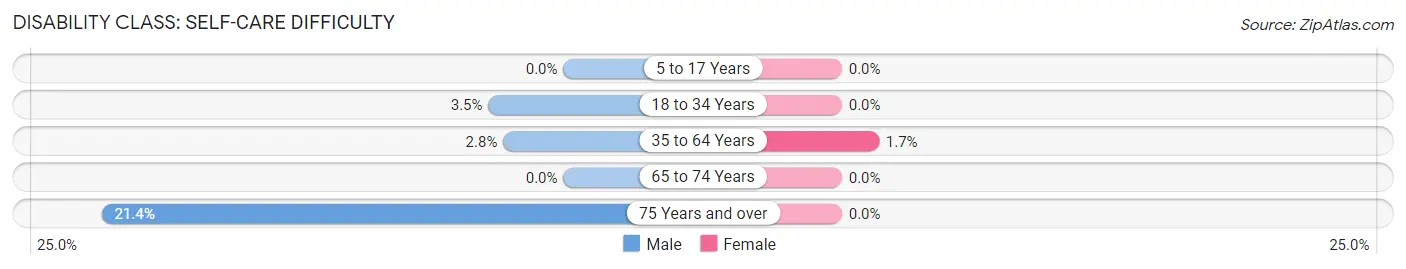
| Age Bracket | Male | Female |
| 5 to 17 Years | 0 (0.0%) | 0 (0.0%) |
| 18 to 34 Years | 7 (3.5%) | 0 (0.0%) |
| 35 to 64 Years | 8 (2.8%) | 6 (1.7%) |
| 65 to 74 Years | 0 (0.0%) | 0 (0.0%) |
| 75 Years and over | 6 (21.4%) | 0 (0.0%) |
Technology Access in Ballard
Computing Device Access in Ballard
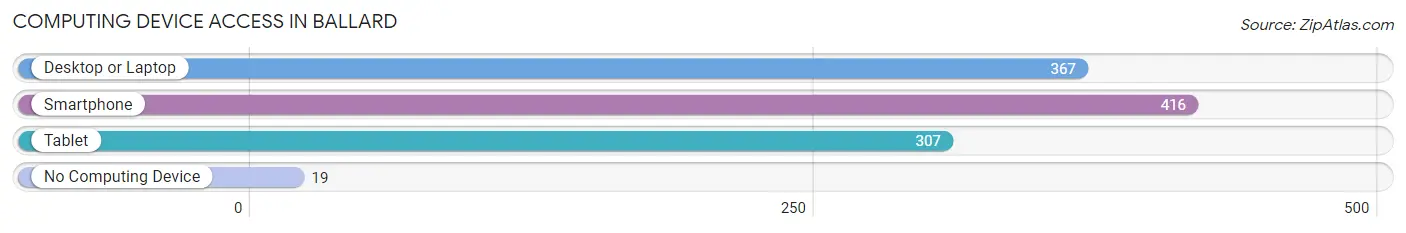
| Device Type | # Households | % Households |
| Desktop or Laptop | 367 | 80.1% |
| Smartphone | 416 | 90.8% |
| Tablet | 307 | 67.0% |
| No Computing Device | 19 | 4.2% |
| Total | 458 | 100.0% |
Internet Access in Ballard
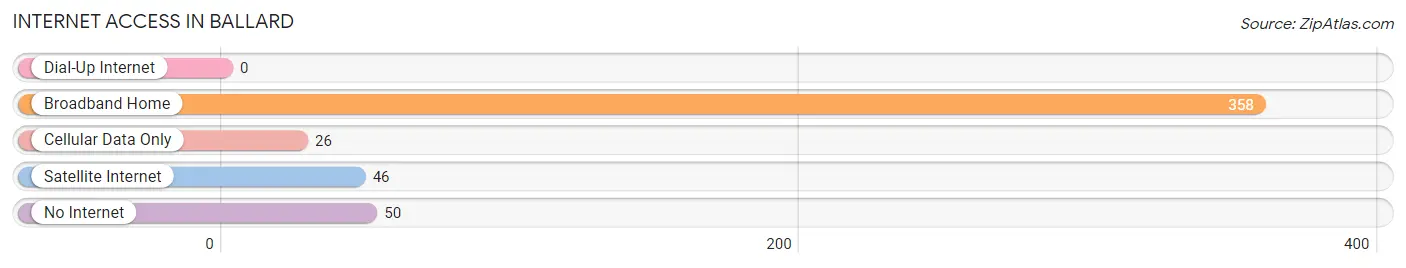
| Internet Type | # Households | % Households |
| Dial-Up Internet | 0 | 0.0% |
| Broadband Home | 358 | 78.2% |
| Cellular Data Only | 26 | 5.7% |
| Satellite Internet | 46 | 10.0% |
| No Internet | 50 | 10.9% |
| Total | 458 | 100.0% |
Ballard Summary
Ballard is a small town located in the southeastern corner of Utah, in the United States. It is situated in the San Rafael Swell, a large geological formation in the Colorado Plateau. The town is located in Emery County, and is part of the larger San Rafael Swell region. Ballard is a rural community, with a population of just over 200 people.
History
Ballard was first settled in the late 1800s by Mormon pioneers. The town was named after a local rancher, John Ballard, who was one of the first settlers in the area. The town was officially incorporated in 1909.
In the early 1900s, Ballard was a thriving agricultural community, with a population of over 500 people. The town was home to several businesses, including a general store, a blacksmith shop, and a hotel. The town also had a school, a post office, and a church.
In the 1950s, the population of Ballard began to decline, as many of the town’s residents moved away in search of better economic opportunities. By the 1970s, the population had dropped to just over 200 people.
Geography
Ballard is located in the southeastern corner of Utah, in the San Rafael Swell region. The town is situated at an elevation of 5,400 feet, and is surrounded by desert terrain. The town is located near the San Rafael River, and is close to the San Rafael Reef, a large geological formation in the Colorado Plateau.
The climate in Ballard is semi-arid, with hot summers and cold winters. The average annual temperature is around 50 degrees Fahrenheit. The town receives an average of 8 inches of precipitation per year.
Economy
The economy of Ballard is largely based on agriculture and tourism. The town is home to several farms, which produce a variety of crops, including alfalfa, hay, and wheat. The town is also home to several tourist attractions, including the San Rafael Swell, the San Rafael River, and the San Rafael Reef.
The town is also home to several small businesses, including a general store, a gas station, and a restaurant. The town is served by a post office, and is located near several larger towns, including Green River and Price.
Demographics
As of the 2010 census, the population of Ballard was 214 people. The racial makeup of the town was 97.2% White, 0.5% Native American, 0.5% Asian, 0.5% from other races, and 1.4% from two or more races. The median household income in Ballard was $37,500, and the median family income was $41,250.
Conclusion
Ballard is a small town located in the southeastern corner of Utah, in the United States. It is situated in the San Rafael Swell, a large geological formation in the Colorado Plateau. The town is home to just over 200 people, and is largely supported by agriculture and tourism. Ballard is a rural community, with a population that is mostly White. The town is served by a post office, and is located near several larger towns, including Green River and Price.
Common Questions
What is the Total Population of Ballard?
Total Population of Ballard is 1,700.
What is the Total Male Population of Ballard?
Total Male Population of Ballard is 871.
What is the Total Female Population of Ballard?
Total Female Population of Ballard is 829.
What is the Ratio of Males per 100 Females in Ballard?
There are 105.07 Males per 100 Females in Ballard.
What is the Ratio of Females per 100 Males in Ballard?
There are 95.18 Females per 100 Males in Ballard.
What is the Median Population Age in Ballard?
Median Population Age in Ballard is 33.7 Years.
What is the Average Family Size in Ballard
Average Family Size in Ballard is 4.0 People.
What is the Average Household Size in Ballard
Average Household Size in Ballard is 3.7 People.
What is Per Capita Income in Ballard?
Per Capita income in Ballard is $22,633.
What is the Median Family Income in Ballard?
Median Family Income in Ballard is $77,500.
What is the Median Household income in Ballard?
Median Household Income in Ballard is $73,833.
What is Income or Wage Gap in Ballard?
Income or Wage Gap in Ballard is 81.5%.
Women in Ballard earn 18.5 cents for every dollar earned by a man.
What is Inequality or Gini Index in Ballard?
Inequality or Gini Index in Ballard is 0.34.
How Large is the Labor Force in Ballard?
There are 791 People in the Labor Forcein in Ballard.
What is the Percentage of People in the Labor Force in Ballard?
63.9% of People are in the Labor Force in Ballard.
What is the Unemployment Rate in Ballard?
Unemployment Rate in Ballard is 10.1%.