Cities with the Highest Percentage of Hawaiian / Pacific Population in Utah
RELATED REPORTS & OPTIONS
Hawaiian / Pacific
Utah
Compare Cities
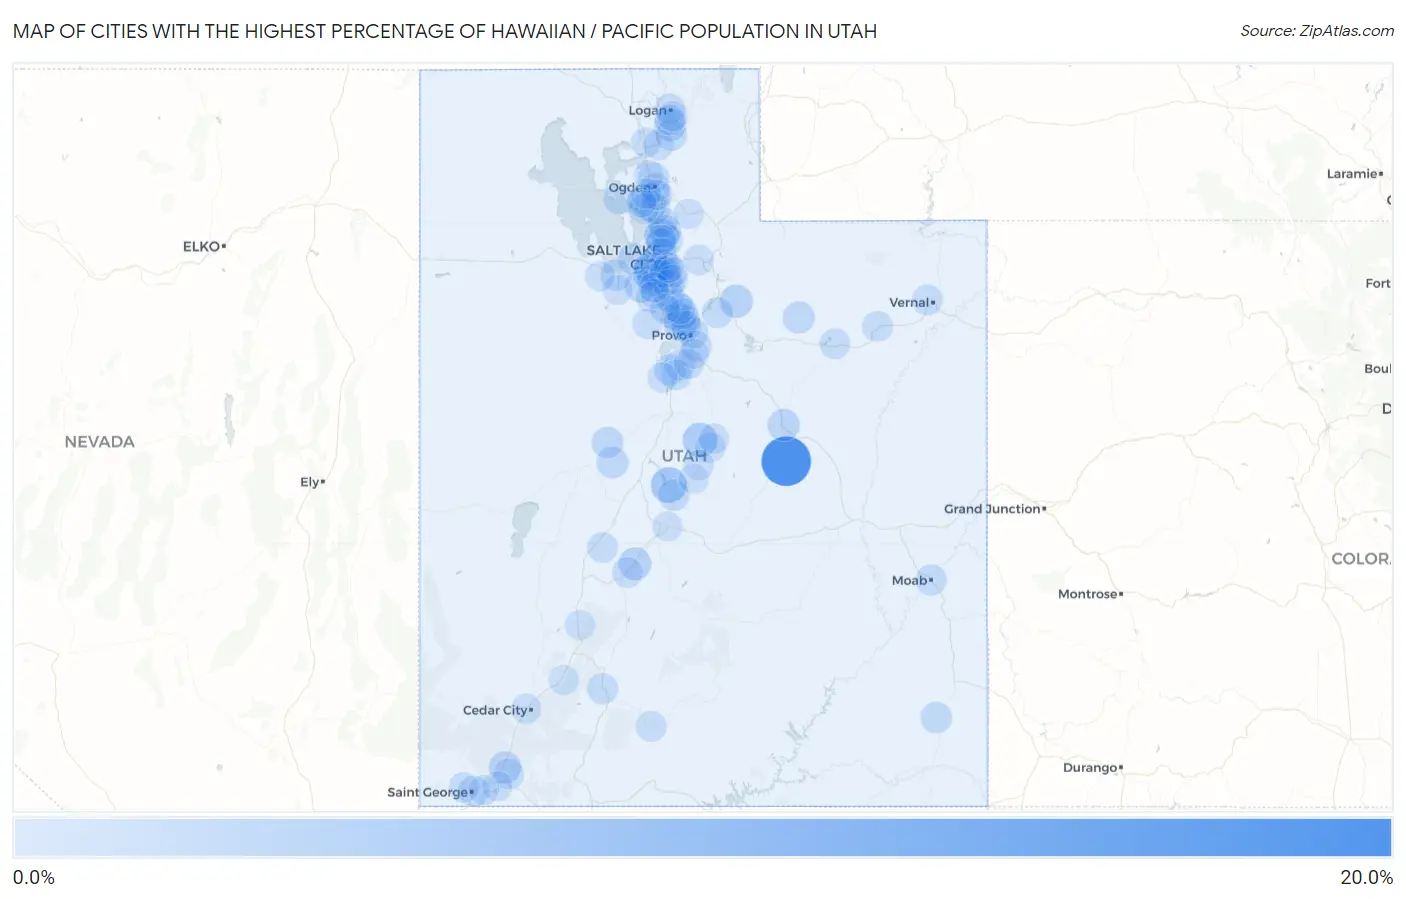
Map of Cities with the Highest Percentage of Hawaiian / Pacific Population in Utah
0.0%
20.0%
Cities with the Highest Percentage of Hawaiian / Pacific Population in Utah
| City | Hawaiian / Pacific | vs State | vs National | |
| 1. | Elmo | 19.7% | 0.94%(+18.8)#1 | 0.19%(+19.5)#37 |
| 2. | Fayette | 5.6% | 0.94%(+4.67)#2 | 0.19%(+5.42)#171 |
| 3. | Moroni | 4.5% | 0.94%(+3.59)#3 | 0.19%(+4.34)#211 |
| 4. | Kearns | 4.5% | 0.94%(+3.57)#4 | 0.19%(+4.32)#212 |
| 5. | West Bountiful | 4.3% | 0.94%(+3.37)#5 | 0.19%(+4.11)#219 |
| 6. | West Valley City | 4.2% | 0.94%(+3.23)#6 | 0.19%(+3.98)#228 |
| 7. | Timber Lakes | 3.1% | 0.94%(+2.16)#7 | 0.19%(+2.91)#303 |
| 8. | Midvale | 2.9% | 0.94%(+1.93)#8 | 0.19%(+2.68)#323 |
| 9. | Elsinore | 2.8% | 0.94%(+1.86)#9 | 0.19%(+2.60)#330 |
| 10. | Vineyard | 2.5% | 0.94%(+1.53)#10 | 0.19%(+2.28)#359 |
| 11. | Copperton | 2.5% | 0.94%(+1.52)#11 | 0.19%(+2.27)#362 |
| 12. | Carbonville | 2.3% | 0.94%(+1.33)#12 | 0.19%(+2.08)#388 |
| 13. | Toquerville | 2.3% | 0.94%(+1.33)#13 | 0.19%(+2.07)#389 |
| 14. | Lindon | 2.2% | 0.94%(+1.27)#14 | 0.19%(+2.02)#394 |
| 15. | Hyrum | 2.1% | 0.94%(+1.16)#15 | 0.19%(+1.91)#411 |
| 16. | Centerville | 2.0% | 0.94%(+1.07)#16 | 0.19%(+1.82)#429 |
| 17. | Tabiona | 1.9% | 0.94%(+0.987)#17 | 0.19%(+1.73)#449 |
| 18. | Oak City | 1.8% | 0.94%(+0.825)#18 | 0.19%(+1.57)#489 |
| 19. | Taylorsville | 1.7% | 0.94%(+0.801)#19 | 0.19%(+1.55)#494 |
| 20. | Salt Lake City | 1.7% | 0.94%(+0.784)#20 | 0.19%(+1.53)#501 |
| 21. | Lynndyl | 1.7% | 0.94%(+0.744)#21 | 0.19%(+1.49)#508 |
| 22. | West Jordan | 1.6% | 0.94%(+0.670)#22 | 0.19%(+1.42)#531 |
| 23. | Blanding | 1.6% | 0.94%(+0.648)#23 | 0.19%(+1.40)#537 |
| 24. | Magna | 1.6% | 0.94%(+0.625)#24 | 0.19%(+1.37)#542 |
| 25. | Clearfield | 1.4% | 0.94%(+0.460)#25 | 0.19%(+1.21)#583 |
| 26. | Highland | 1.4% | 0.94%(+0.455)#26 | 0.19%(+1.20)#585 |
| 27. | Provo | 1.4% | 0.94%(+0.437)#27 | 0.19%(+1.18)#594 |
| 28. | Gunnison | 1.4% | 0.94%(+0.429)#28 | 0.19%(+1.18)#598 |
| 29. | Paradise | 1.3% | 0.94%(+0.389)#29 | 0.19%(+1.14)#615 |
| 30. | Stansbury Park | 1.3% | 0.94%(+0.386)#30 | 0.19%(+1.13)#616 |
| 31. | Genola | 1.3% | 0.94%(+0.338)#31 | 0.19%(+1.09)#631 |
| 32. | Panguitch | 1.2% | 0.94%(+0.239)#32 | 0.19%(+0.986)#661 |
| 33. | Payson | 1.1% | 0.94%(+0.202)#33 | 0.19%(+0.949)#678 |
| 34. | Moab | 1.1% | 0.94%(+0.171)#34 | 0.19%(+0.918)#694 |
| 35. | Wallsburg | 1.0% | 0.94%(+0.102)#35 | 0.19%(+0.849)#719 |
| 36. | Hooper | 1.0% | 0.94%(+0.088)#36 | 0.19%(+0.836)#726 |
| 37. | South Salt Lake | 1.0% | 0.94%(+0.078)#37 | 0.19%(+0.826)#729 |
| 38. | Springville | 0.97% | 0.94%(+0.035)#38 | 0.19%(+0.783)#753 |
| 39. | American Fork | 0.97% | 0.94%(+0.032)#39 | 0.19%(+0.779)#755 |
| 40. | Herriman | 0.95% | 0.94%(+0.017)#40 | 0.19%(+0.764)#767 |
| 41. | Pleasant Grove | 0.95% | 0.94%(+0.014)#41 | 0.19%(+0.762)#770 |
| 42. | Roosevelt | 0.94% | 0.94%(+0.008)#42 | 0.19%(+0.755)#774 |
| 43. | La Verkin | 0.89% | 0.94%(-0.042)#43 | 0.19%(+0.706)#812 |
| 44. | St George | 0.88% | 0.94%(-0.053)#44 | 0.19%(+0.695)#823 |
| 45. | Clinton | 0.88% | 0.94%(-0.056)#45 | 0.19%(+0.692)#825 |
| 46. | Maeser | 0.87% | 0.94%(-0.064)#46 | 0.19%(+0.684)#831 |
| 47. | Sandy | 0.83% | 0.94%(-0.105)#47 | 0.19%(+0.643)#859 |
| 48. | Layton | 0.82% | 0.94%(-0.119)#48 | 0.19%(+0.629)#875 |
| 49. | Harrisville | 0.81% | 0.94%(-0.126)#49 | 0.19%(+0.622)#882 |
| 50. | North Salt Lake | 0.81% | 0.94%(-0.127)#50 | 0.19%(+0.620)#885 |
| 51. | Draper | 0.76% | 0.94%(-0.178)#51 | 0.19%(+0.570)#930 |
| 52. | Joseph | 0.72% | 0.94%(-0.220)#52 | 0.19%(+0.528)#977 |
| 53. | Bountiful | 0.71% | 0.94%(-0.229)#53 | 0.19%(+0.519)#988 |
| 54. | Orem | 0.70% | 0.94%(-0.233)#54 | 0.19%(+0.515)#994 |
| 55. | Henrieville | 0.70% | 0.94%(-0.237)#55 | 0.19%(+0.511)#1,000 |
| 56. | Murray | 0.70% | 0.94%(-0.239)#56 | 0.19%(+0.509)#1,002 |
| 57. | Duchesne | 0.69% | 0.94%(-0.246)#57 | 0.19%(+0.502)#1,012 |
| 58. | Cedar Hills | 0.66% | 0.94%(-0.275)#58 | 0.19%(+0.473)#1,049 |
| 59. | Farmington | 0.65% | 0.94%(-0.286)#59 | 0.19%(+0.461)#1,061 |
| 60. | Kanosh | 0.64% | 0.94%(-0.292)#60 | 0.19%(+0.455)#1,066 |
| 61. | Spring City | 0.63% | 0.94%(-0.305)#61 | 0.19%(+0.443)#1,078 |
| 62. | Santaquin | 0.63% | 0.94%(-0.307)#62 | 0.19%(+0.440)#1,081 |
| 63. | Mantua | 0.59% | 0.94%(-0.343)#63 | 0.19%(+0.405)#1,128 |
| 64. | Eagle Mountain | 0.58% | 0.94%(-0.357)#64 | 0.19%(+0.390)#1,140 |
| 65. | Cottonwood Heights | 0.58% | 0.94%(-0.359)#65 | 0.19%(+0.389)#1,142 |
| 66. | Logan | 0.52% | 0.94%(-0.414)#66 | 0.19%(+0.333)#1,218 |
| 67. | Washington Terrace | 0.52% | 0.94%(-0.416)#67 | 0.19%(+0.332)#1,220 |
| 68. | Salem | 0.52% | 0.94%(-0.419)#68 | 0.19%(+0.329)#1,223 |
| 69. | Summit Park | 0.51% | 0.94%(-0.431)#69 | 0.19%(+0.317)#1,239 |
| 70. | Syracuse | 0.47% | 0.94%(-0.464)#70 | 0.19%(+0.284)#1,303 |
| 71. | Mount Pleasant | 0.46% | 0.94%(-0.474)#71 | 0.19%(+0.274)#1,317 |
| 72. | Nibley | 0.46% | 0.94%(-0.475)#72 | 0.19%(+0.272)#1,319 |
| 73. | Millville | 0.44% | 0.94%(-0.498)#73 | 0.19%(+0.249)#1,362 |
| 74. | Holladay | 0.43% | 0.94%(-0.505)#74 | 0.19%(+0.242)#1,375 |
| 75. | Brigham City | 0.43% | 0.94%(-0.508)#75 | 0.19%(+0.240)#1,380 |
| 76. | Riverton | 0.38% | 0.94%(-0.553)#76 | 0.19%(+0.195)#1,486 |
| 77. | Santa Clara | 0.38% | 0.94%(-0.556)#77 | 0.19%(+0.192)#1,494 |
| 78. | Lehi | 0.37% | 0.94%(-0.563)#78 | 0.19%(+0.185)#1,512 |
| 79. | South Jordan | 0.37% | 0.94%(-0.566)#79 | 0.19%(+0.181)#1,522 |
| 80. | Millcreek | 0.37% | 0.94%(-0.568)#80 | 0.19%(+0.180)#1,528 |
| 81. | Ephraim | 0.37% | 0.94%(-0.570)#81 | 0.19%(+0.177)#1,538 |
| 82. | Goshen | 0.35% | 0.94%(-0.590)#82 | 0.19%(+0.158)#1,592 |
| 83. | Cedar City | 0.34% | 0.94%(-0.596)#83 | 0.19%(+0.152)#1,612 |
| 84. | Ogden | 0.31% | 0.94%(-0.627)#84 | 0.19%(+0.120)#1,696 |
| 85. | Paragonah | 0.30% | 0.94%(-0.635)#85 | 0.19%(+0.113)#1,724 |
| 86. | Tooele | 0.29% | 0.94%(-0.642)#86 | 0.19%(+0.106)#1,747 |
| 87. | Hurricane | 0.29% | 0.94%(-0.645)#87 | 0.19%(+0.102)#1,758 |
| 88. | Morgan | 0.29% | 0.94%(-0.649)#88 | 0.19%(+0.099)#1,774 |
| 89. | Grantsville | 0.29% | 0.94%(-0.650)#89 | 0.19%(+0.097)#1,780 |
| 90. | Beaver | 0.28% | 0.94%(-0.658)#90 | 0.19%(+0.090)#1,813 |
| 91. | White | 0.25% | 0.94%(-0.685)#91 | 0.19%(+0.063)#1,924 |
| 92. | Spanish Fork | 0.22% | 0.94%(-0.721)#92 | 0.19%(+0.027)#2,064 |
| 93. | Washington | 0.21% | 0.94%(-0.724)#93 | 0.19%(+0.024)#2,076 |
| 94. | Woods Cross | 0.20% | 0.94%(-0.735)#94 | 0.19%(+0.012)#2,124 |
| 95. | South Ogden | 0.19% | 0.94%(-0.742)#95 | 0.19%(+0.006)#2,157 |
| 96. | Manti | 0.17% | 0.94%(-0.764)#96 | 0.19%(-0.016)#2,264 |
| 97. | Roy | 0.17% | 0.94%(-0.765)#97 | 0.19%(-0.017)#2,272 |
| 98. | West Point | 0.17% | 0.94%(-0.767)#98 | 0.19%(-0.019)#2,284 |
| 99. | Salina | 0.16% | 0.94%(-0.776)#99 | 0.19%(-0.029)#2,344 |
| 100. | Farr West | 0.15% | 0.94%(-0.781)#100 | 0.19%(-0.034)#2,374 |
Common Questions
What are the Top 10 Cities with the Highest Percentage of Hawaiian / Pacific Population in Utah?
Top 10 Cities with the Highest Percentage of Hawaiian / Pacific Population in Utah are:
#1
19.7%
#2
5.6%
#3
4.5%
#4
4.5%
#5
4.3%
#6
4.2%
#7
3.1%
#8
2.9%
#9
2.8%
#10
2.5%
What city has the Highest Percentage of Hawaiian / Pacific Population in Utah?
Elmo has the Highest Percentage of Hawaiian / Pacific Population in Utah with 19.7%.
What is the Percentage of Hawaiian / Pacific Population in the State of Utah?
Percentage of Hawaiian / Pacific Population in Utah is 0.94%.
What is the Percentage of Hawaiian / Pacific Population in the United States?
Percentage of Hawaiian / Pacific Population in the United States is 0.19%.