Woodland Hills, UT
Woodland Hills Map
Woodland Hills Overview
1,329
TOTAL POPULATION
692
MALE POPULATION
637
FEMALE POPULATION
108.63
MALES / 100 FEMALES
92.05
FEMALES / 100 MALES
38.7
MEDIAN AGE
3.9
AVG FAMILY SIZE
3.7
AVG HOUSEHOLD SIZE
$44,065
PER CAPITA INCOME
$131,528
AVG FAMILY INCOME
$130,096
AVG HOUSEHOLD INCOME
52.2%
WAGE / INCOME GAP [ % ]
47.8¢/ $1
WAGE / INCOME GAP [ $ ]
0.39
INEQUALITY / GINI INDEX
610
LABOR FORCE [ PEOPLE ]
60.4%
PERCENT IN LABOR FORCE
2.3%
UNEMPLOYMENT RATE
Woodland Hills Area Codes
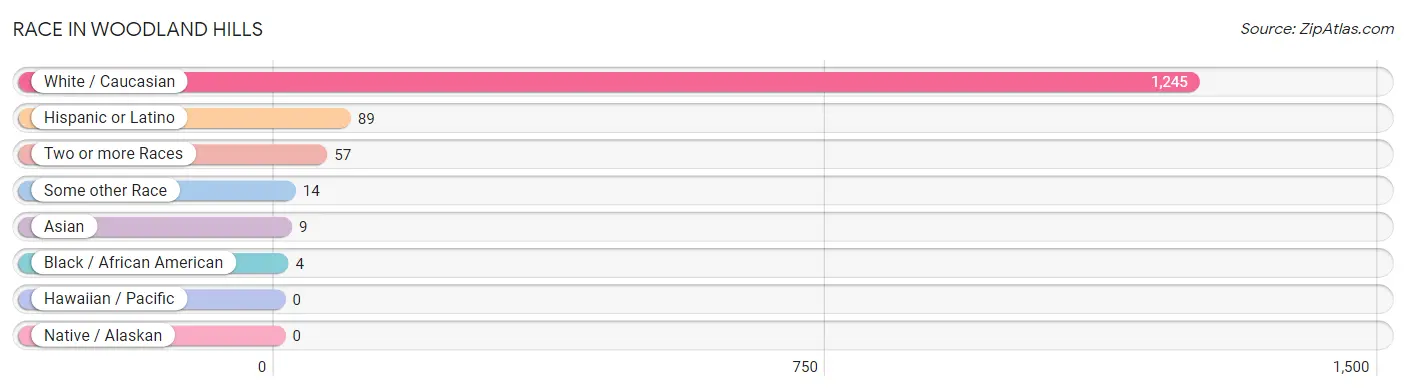
Race in Woodland Hills
The most populous races in Woodland Hills are White / Caucasian (1,245 | 93.7%), Hispanic or Latino (89 | 6.7%), and Two or more Races (57 | 4.3%).
| Race | # Population | % Population |
| Asian | 9 | 0.7% |
| Black / African American | 4 | 0.3% |
| Hawaiian / Pacific | 0 | 0.0% |
| Hispanic or Latino | 89 | 6.7% |
| Native / Alaskan | 0 | 0.0% |
| White / Caucasian | 1,245 | 93.7% |
| Two or more Races | 57 | 4.3% |
| Some other Race | 14 | 1.1% |
| Total | 1,329 | 100.0% |
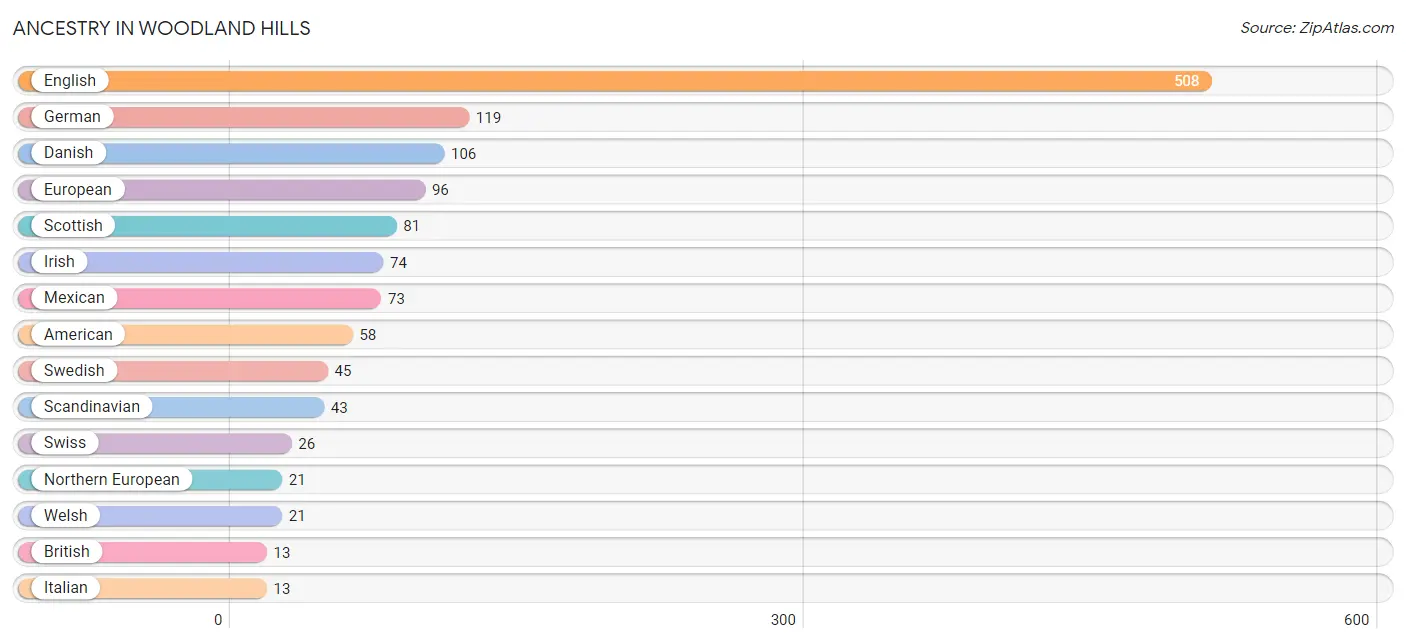
Ancestry in Woodland Hills
The most populous ancestries reported in Woodland Hills are English (508 | 38.2%), German (119 | 8.9%), Danish (106 | 8.0%), European (96 | 7.2%), and Scottish (81 | 6.1%), together accounting for 68.5% of all Woodland Hills residents.
| Ancestry | # Population | % Population |
| American | 58 | 4.4% |
| Arab | 4 | 0.3% |
| Argentinean | 3 | 0.2% |
| Austrian | 8 | 0.6% |
| Bhutanese | 1 | 0.1% |
| British | 13 | 1.0% |
| Burmese | 8 | 0.6% |
| Central American | 6 | 0.4% |
| Cherokee | 7 | 0.5% |
| Cuban | 1 | 0.1% |
| Czech | 3 | 0.2% |
| Danish | 106 | 8.0% |
| Dutch | 6 | 0.4% |
| Ecuadorian | 2 | 0.2% |
| English | 508 | 38.2% |
| European | 96 | 7.2% |
| Fijian | 3 | 0.2% |
| Finnish | 9 | 0.7% |
| French | 10 | 0.7% |
| German | 119 | 8.9% |
| Guatemalan | 4 | 0.3% |
| Hungarian | 2 | 0.2% |
| Icelander | 4 | 0.3% |
| Iranian | 2 | 0.2% |
| Irish | 74 | 5.6% |
| Israeli | 2 | 0.2% |
| Italian | 13 | 1.0% |
| Mexican | 73 | 5.5% |
| Northern European | 21 | 1.6% |
| Norwegian | 8 | 0.6% |
| Peruvian | 1 | 0.1% |
| Portuguese | 10 | 0.7% |
| Puerto Rican | 2 | 0.2% |
| Russian | 8 | 0.6% |
| Salvadoran | 2 | 0.2% |
| Scandinavian | 43 | 3.2% |
| Scotch-Irish | 8 | 0.6% |
| Scottish | 81 | 6.1% |
| Serbian | 8 | 0.6% |
| South American | 6 | 0.4% |
| Spaniard | 1 | 0.1% |
| Swedish | 45 | 3.4% |
| Swiss | 26 | 2.0% |
| Syrian | 4 | 0.3% |
| Welsh | 21 | 1.6% | View All 45 Rows |
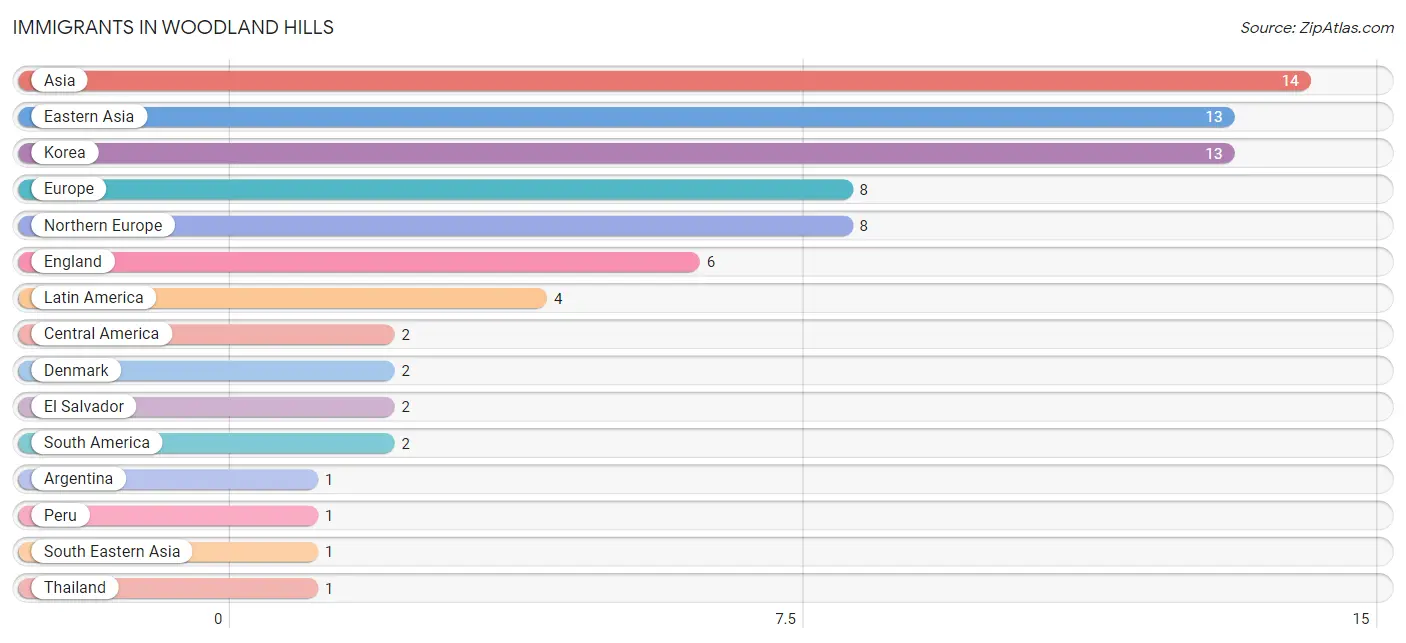
Immigrants in Woodland Hills
The most numerous immigrant groups reported in Woodland Hills came from Asia (14 | 1.1%), Eastern Asia (13 | 1.0%), Korea (13 | 1.0%), Europe (8 | 0.6%), and Northern Europe (8 | 0.6%), together accounting for 4.2% of all Woodland Hills residents.
| Immigration Origin | # Population | % Population |
| Argentina | 1 | 0.1% |
| Asia | 14 | 1.1% |
| Central America | 2 | 0.2% |
| Denmark | 2 | 0.2% |
| Eastern Asia | 13 | 1.0% |
| El Salvador | 2 | 0.2% |
| England | 6 | 0.4% |
| Europe | 8 | 0.6% |
| Korea | 13 | 1.0% |
| Latin America | 4 | 0.3% |
| Northern Europe | 8 | 0.6% |
| Peru | 1 | 0.1% |
| South America | 2 | 0.2% |
| South Eastern Asia | 1 | 0.1% |
| Thailand | 1 | 0.1% | View All 15 Rows |
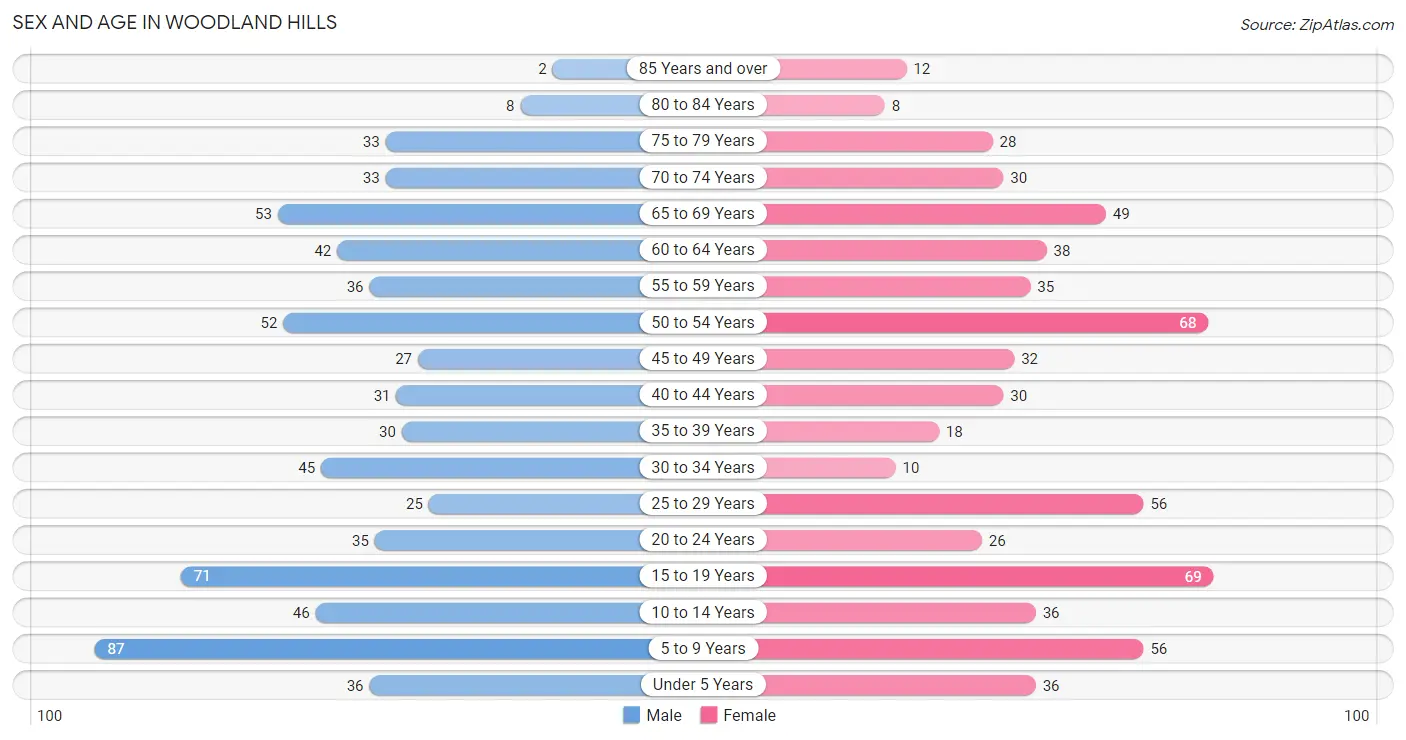
Sex and Age in Woodland Hills
Sex and Age in Woodland Hills
The most populous age groups in Woodland Hills are 5 to 9 Years (87 | 12.6%) for men and 15 to 19 Years (69 | 10.8%) for women.
| Age Bracket | Male | Female |
| Under 5 Years | 36 (5.2%) | 36 (5.7%) |
| 5 to 9 Years | 87 (12.6%) | 56 (8.8%) |
| 10 to 14 Years | 46 (6.7%) | 36 (5.7%) |
| 15 to 19 Years | 71 (10.3%) | 69 (10.8%) |
| 20 to 24 Years | 35 (5.1%) | 26 (4.1%) |
| 25 to 29 Years | 25 (3.6%) | 56 (8.8%) |
| 30 to 34 Years | 45 (6.5%) | 10 (1.6%) |
| 35 to 39 Years | 30 (4.3%) | 18 (2.8%) |
| 40 to 44 Years | 31 (4.5%) | 30 (4.7%) |
| 45 to 49 Years | 27 (3.9%) | 32 (5.0%) |
| 50 to 54 Years | 52 (7.5%) | 68 (10.7%) |
| 55 to 59 Years | 36 (5.2%) | 35 (5.5%) |
| 60 to 64 Years | 42 (6.1%) | 38 (6.0%) |
| 65 to 69 Years | 53 (7.7%) | 49 (7.7%) |
| 70 to 74 Years | 33 (4.8%) | 30 (4.7%) |
| 75 to 79 Years | 33 (4.8%) | 28 (4.4%) |
| 80 to 84 Years | 8 (1.2%) | 8 (1.3%) |
| 85 Years and over | 2 (0.3%) | 12 (1.9%) |
| Total | 692 (100.0%) | 637 (100.0%) |
Families and Households in Woodland Hills
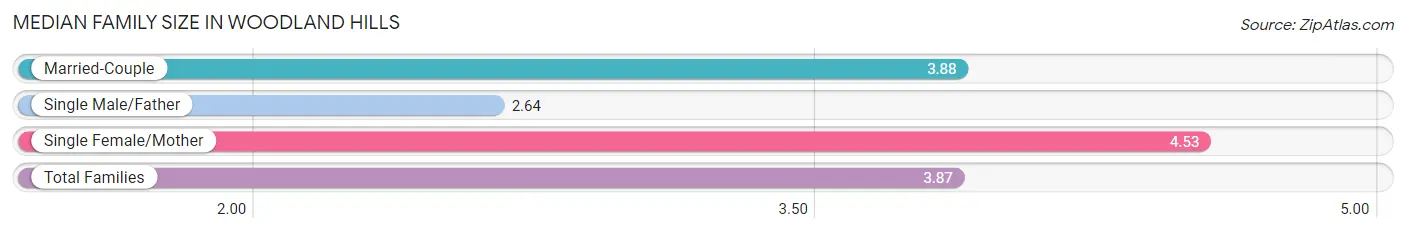
Median Family Size in Woodland Hills
The median family size in Woodland Hills is 3.87 persons per family, with single female/mother families (15 | 4.4%) accounting for the largest median family size of 4.53 persons per family. On the other hand, single male/father families (11 | 3.3%) represent the smallest median family size with 2.64 persons per family.
| Family Type | # Families | Family Size |
| Married-Couple | 311 (92.3%) | 3.88 |
| Single Male/Father | 11 (3.3%) | 2.64 |
| Single Female/Mother | 15 (4.4%) | 4.53 |
| Total Families | 337 (100.0%) | 3.87 |
Median Household Size in Woodland Hills
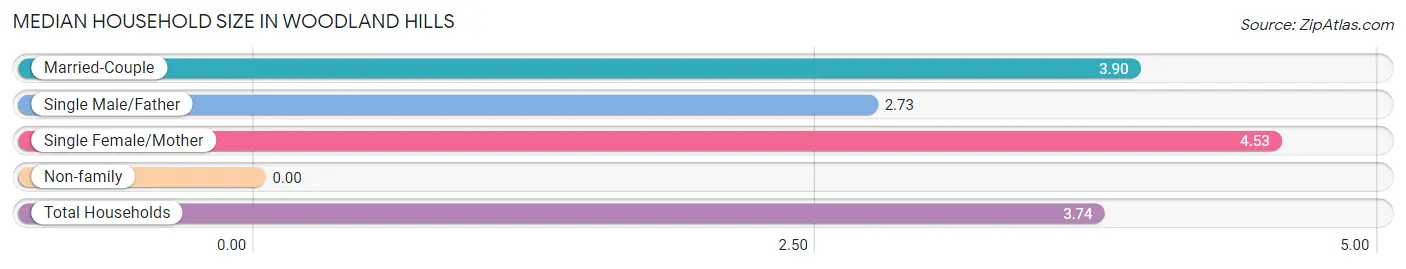
| Household Type | # Households | Household Size |
| Married-Couple | 311 (87.6%) | 3.90 |
| Single Male/Father | 11 (3.1%) | 2.73 |
| Single Female/Mother | 15 (4.2%) | 4.53 |
| Non-family | 18 (5.1%) | - |
| Total Households | 355 (100.0%) | 3.74 |
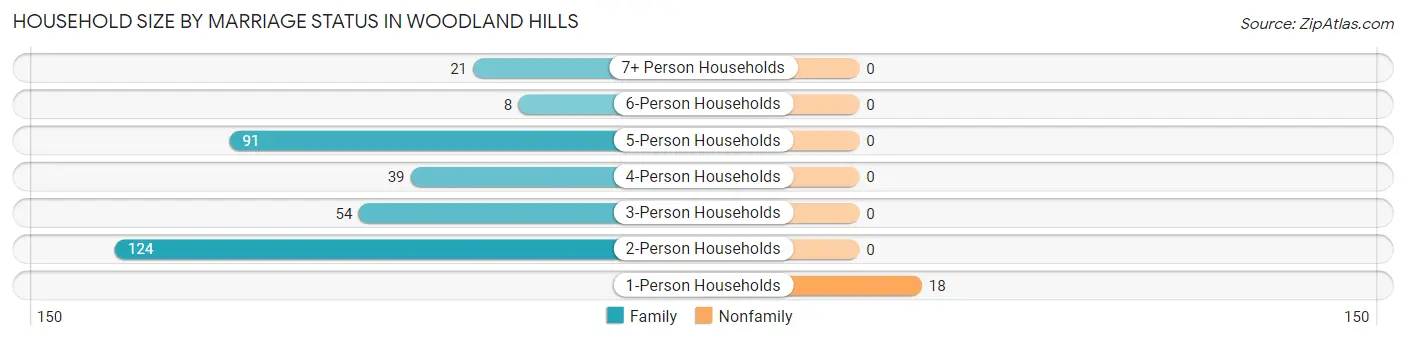
Household Size by Marriage Status in Woodland Hills
Out of a total of 355 households in Woodland Hills, 337 (94.9%) are family households, while 18 (5.1%) are nonfamily households. The most numerous type of family households are 2-person households, comprising 124, and the most common type of nonfamily households are 1-person households, comprising 18.
| Household Size | Family Households | Nonfamily Households |
| 1-Person Households | - | 18 (5.1%) |
| 2-Person Households | 124 (34.9%) | 0 (0.0%) |
| 3-Person Households | 54 (15.2%) | 0 (0.0%) |
| 4-Person Households | 39 (11.0%) | 0 (0.0%) |
| 5-Person Households | 91 (25.6%) | 0 (0.0%) |
| 6-Person Households | 8 (2.2%) | 0 (0.0%) |
| 7+ Person Households | 21 (5.9%) | 0 (0.0%) |
| Total | 337 (94.9%) | 18 (5.1%) |
Female Fertility in Woodland Hills
Fertility by Age in Woodland Hills
Average fertility rate in Woodland Hills is 15.0 births per 1,000 women. Women in the age bracket of 20 to 34 years have the highest fertility rate with 33.0 births per 1,000 women. Women in the age bracket of 20 to 34 years acount for 75.0% of all women with births.
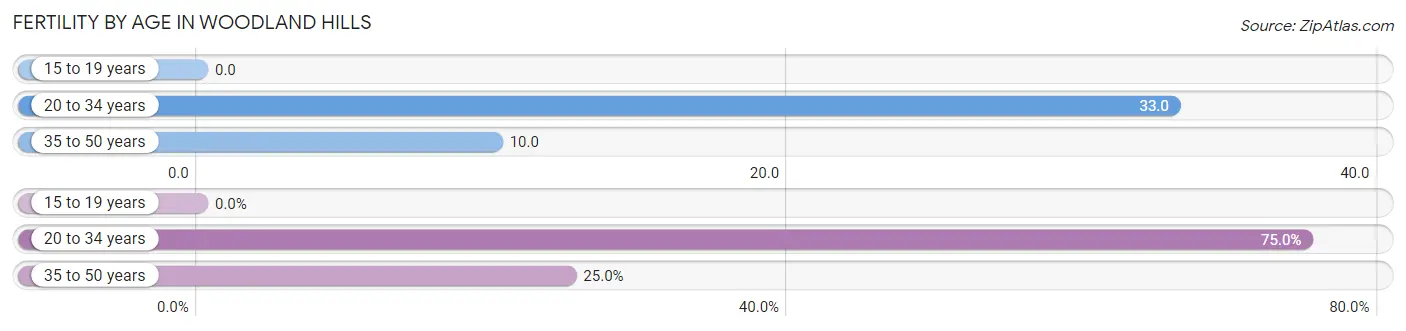
| Age Bracket | Women with Births | Births / 1,000 Women |
| 15 to 19 years | 0 (0.0%) | 0.0 |
| 20 to 34 years | 3 (75.0%) | 33.0 |
| 35 to 50 years | 1 (25.0%) | 10.0 |
| Total | 4 (100.0%) | 15.0 |
Fertility by Age by Marriage Status in Woodland Hills
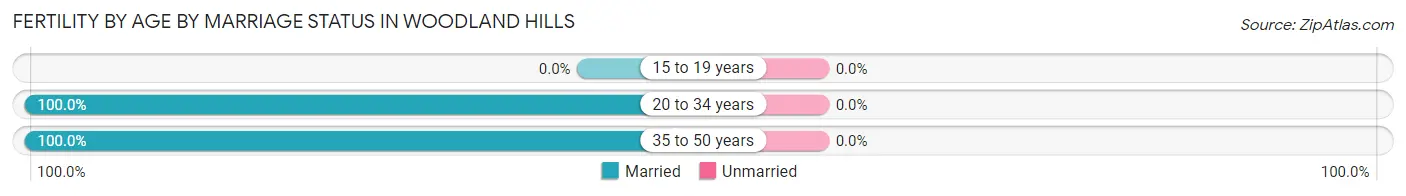
| Age Bracket | Married | Unmarried |
| 15 to 19 years | 0 (0.0%) | 0 (0.0%) |
| 20 to 34 years | 3 (100.0%) | 0 (0.0%) |
| 35 to 50 years | 1 (100.0%) | 0 (0.0%) |
| Total | 4 (100.0%) | 0 (0.0%) |
Fertility by Education in Woodland Hills
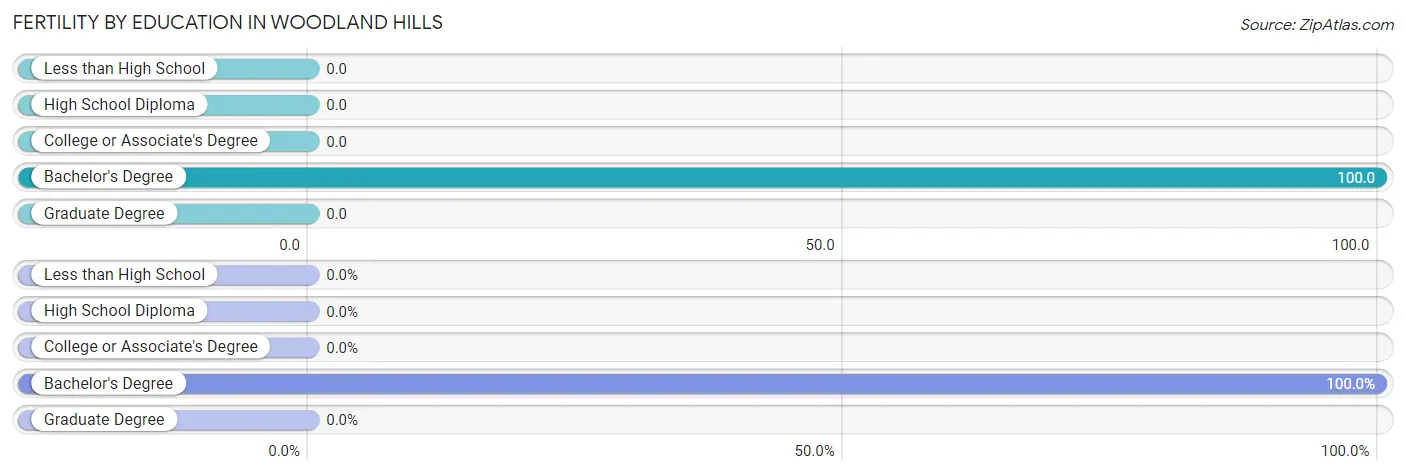
| Educational Attainment | Women with Births | Births / 1,000 Women |
| Less than High School | 0 (0.0%) | 0.0 |
| High School Diploma | 0 (0.0%) | 0.0 |
| College or Associate's Degree | 0 (0.0%) | 0.0 |
| Bachelor's Degree | 4 (100.0%) | 100.0 |
| Graduate Degree | 0 (0.0%) | 0.0 |
| Total | 4 (100.0%) | 15.0 |
Fertility by Education by Marriage Status in Woodland Hills
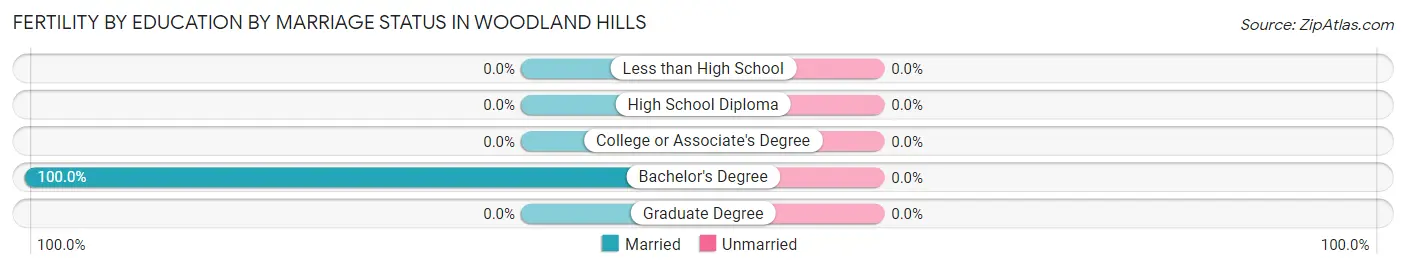
| Educational Attainment | Married | Unmarried |
| Less than High School | 0 (0.0%) | 0 (0.0%) |
| High School Diploma | 0 (0.0%) | 0 (0.0%) |
| College or Associate's Degree | 0 (0.0%) | 0 (0.0%) |
| Bachelor's Degree | 4 (100.0%) | 0 (0.0%) |
| Graduate Degree | 0 (0.0%) | 0 (0.0%) |
| Total | 4 (100.0%) | 0 (0.0%) |
Income in Woodland Hills
Income Overview in Woodland Hills
Per Capita Income in Woodland Hills is $44,065, while median incomes of families and households are $131,528 and $130,096 respectively.
| Characteristic | Number | Measure |
| Per Capita Income | 1,329 | $44,065 |
| Median Family Income | 337 | $131,528 |
| Mean Family Income | 337 | $166,589 |
| Median Household Income | 355 | $130,096 |
| Mean Household Income | 355 | $162,499 |
| Income Deficit | 337 | $0 |
| Wage / Income Gap (%) | 1,329 | 52.21% |
| Wage / Income Gap ($) | 1,329 | 47.79¢ per $1 |
| Gini / Inequality Index | 1,329 | 0.39 |
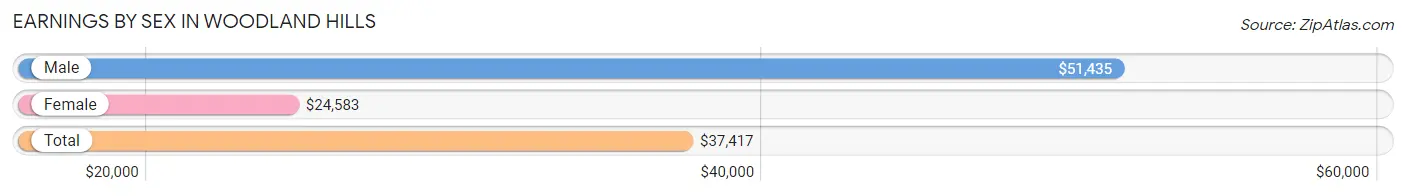
Earnings by Sex in Woodland Hills
Average Earnings in Woodland Hills are $37,417, $51,435 for men and $24,583 for women, a difference of 52.2%.
| Sex | Number | Average Earnings |
| Male | 407 (61.0%) | $51,435 |
| Female | 260 (39.0%) | $24,583 |
| Total | 667 (100.0%) | $37,417 |
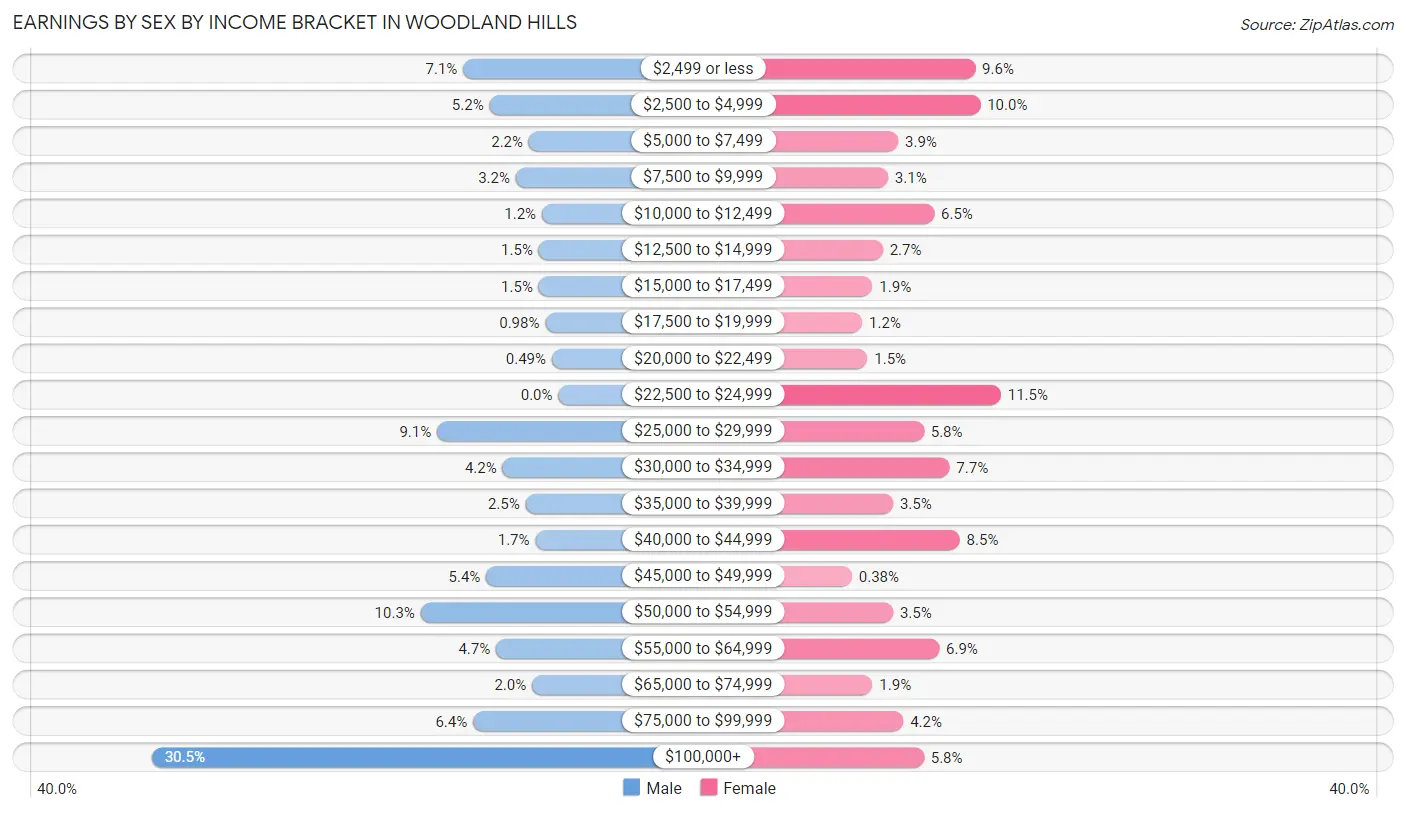
Earnings by Sex by Income Bracket in Woodland Hills
The most common earnings brackets in Woodland Hills are $100,000+ for men (124 | 30.5%) and $22,500 to $24,999 for women (30 | 11.5%).
| Income | Male | Female |
| $2,499 or less | 29 (7.1%) | 25 (9.6%) |
| $2,500 to $4,999 | 21 (5.2%) | 26 (10.0%) |
| $5,000 to $7,499 | 9 (2.2%) | 10 (3.8%) |
| $7,500 to $9,999 | 13 (3.2%) | 8 (3.1%) |
| $10,000 to $12,499 | 5 (1.2%) | 17 (6.5%) |
| $12,500 to $14,999 | 6 (1.5%) | 7 (2.7%) |
| $15,000 to $17,499 | 6 (1.5%) | 5 (1.9%) |
| $17,500 to $19,999 | 4 (1.0%) | 3 (1.1%) |
| $20,000 to $22,499 | 2 (0.5%) | 4 (1.5%) |
| $22,500 to $24,999 | 0 (0.0%) | 30 (11.5%) |
| $25,000 to $29,999 | 37 (9.1%) | 15 (5.8%) |
| $30,000 to $34,999 | 17 (4.2%) | 20 (7.7%) |
| $35,000 to $39,999 | 10 (2.5%) | 9 (3.5%) |
| $40,000 to $44,999 | 7 (1.7%) | 22 (8.5%) |
| $45,000 to $49,999 | 22 (5.4%) | 1 (0.4%) |
| $50,000 to $54,999 | 42 (10.3%) | 9 (3.5%) |
| $55,000 to $64,999 | 19 (4.7%) | 18 (6.9%) |
| $65,000 to $74,999 | 8 (2.0%) | 5 (1.9%) |
| $75,000 to $99,999 | 26 (6.4%) | 11 (4.2%) |
| $100,000+ | 124 (30.5%) | 15 (5.8%) |
| Total | 407 (100.0%) | 260 (100.0%) |
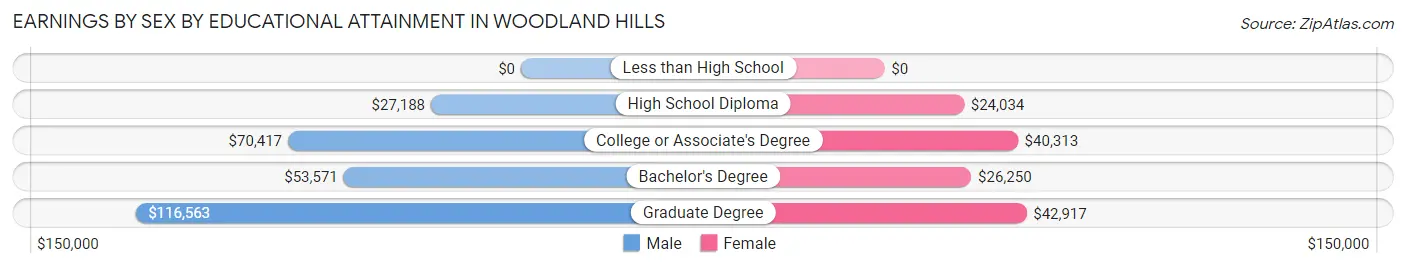
Earnings by Sex by Educational Attainment in Woodland Hills
Average earnings in Woodland Hills are $59,688 for men and $30,333 for women, a difference of 49.2%. Men with an educational attainment of graduate degree enjoy the highest average annual earnings of $116,563, while those with high school diploma education earn the least with $27,188. Women with an educational attainment of graduate degree earn the most with the average annual earnings of $42,917, while those with high school diploma education have the smallest earnings of $24,034.
| Educational Attainment | Male Income | Female Income |
| Less than High School | - | - |
| High School Diploma | $27,188 | $24,034 |
| College or Associate's Degree | $70,417 | $40,313 |
| Bachelor's Degree | $53,571 | $26,250 |
| Graduate Degree | $116,563 | $42,917 |
| Total | $59,688 | $30,333 |
Family Income in Woodland Hills
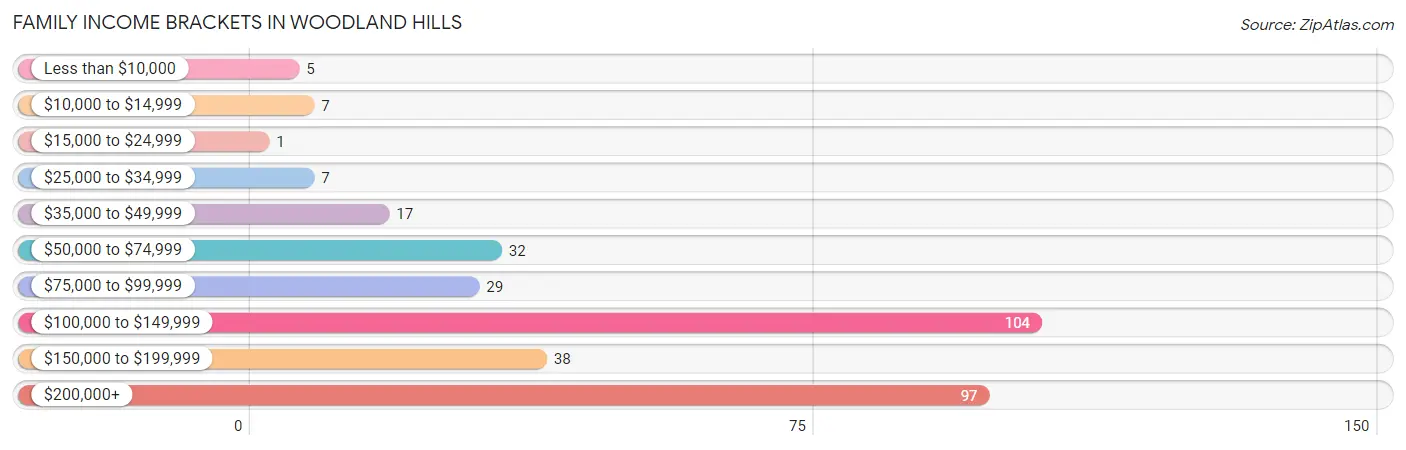
Family Income Brackets in Woodland Hills
According to the Woodland Hills family income data, there are 104 families falling into the $100,000 to $149,999 income range, which is the most common income bracket and makes up 30.9% of all families. Conversely, the $15,000 to $24,999 income bracket is the least frequent group with only 1 families (0.3%) belonging to this category.
| Income Bracket | # Families | % Families |
| Less than $10,000 | 5 | 1.5% |
| $10,000 to $14,999 | 7 | 2.1% |
| $15,000 to $24,999 | 1 | 0.3% |
| $25,000 to $34,999 | 7 | 2.1% |
| $35,000 to $49,999 | 17 | 5.0% |
| $50,000 to $74,999 | 32 | 9.5% |
| $75,000 to $99,999 | 29 | 8.6% |
| $100,000 to $149,999 | 104 | 30.9% |
| $150,000 to $199,999 | 38 | 11.3% |
| $200,000+ | 97 | 28.8% |
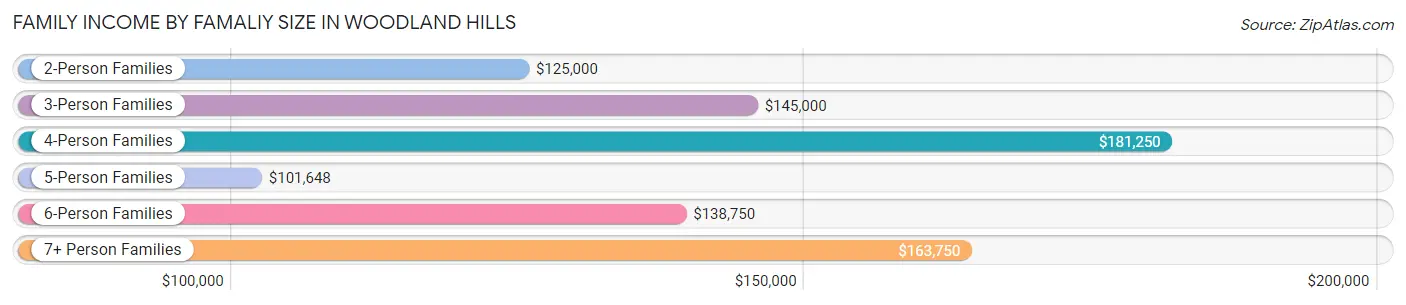
Family Income by Famaliy Size in Woodland Hills
4-person families (39 | 11.6%) account for the highest median family income in Woodland Hills with $181,250 per family, while 2-person families (126 | 37.4%) have the highest median income of $62,500 per family member.
| Income Bracket | # Families | Median Income |
| 2-Person Families | 126 (37.4%) | $125,000 |
| 3-Person Families | 54 (16.0%) | $145,000 |
| 4-Person Families | 39 (11.6%) | $181,250 |
| 5-Person Families | 89 (26.4%) | $101,648 |
| 6-Person Families | 8 (2.4%) | $138,750 |
| 7+ Person Families | 21 (6.2%) | $163,750 |
| Total | 337 (100.0%) | $131,528 |
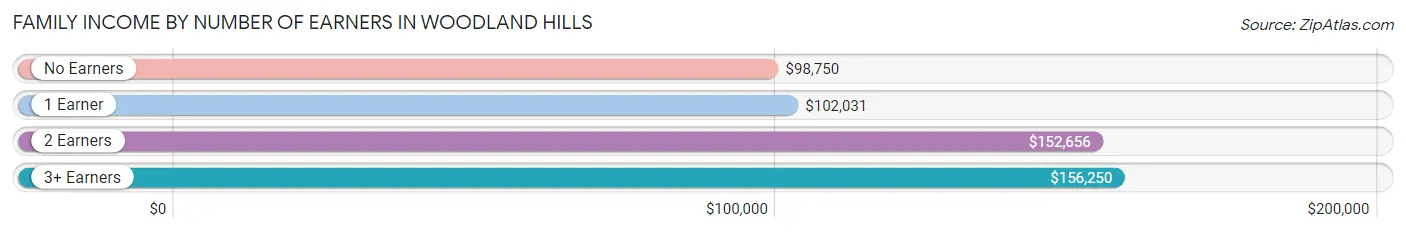
Family Income by Number of Earners in Woodland Hills
The median family income in Woodland Hills is $131,528, with families comprising 3+ earners (95) having the highest median family income of $156,250, while families with no earners (42) have the lowest median family income of $98,750, accounting for 28.2% and 12.5% of families, respectively.
| Number of Earners | # Families | Median Income |
| No Earners | 42 (12.5%) | $98,750 |
| 1 Earner | 93 (27.6%) | $102,031 |
| 2 Earners | 107 (31.8%) | $152,656 |
| 3+ Earners | 95 (28.2%) | $156,250 |
| Total | 337 (100.0%) | $131,528 |
Household Income in Woodland Hills
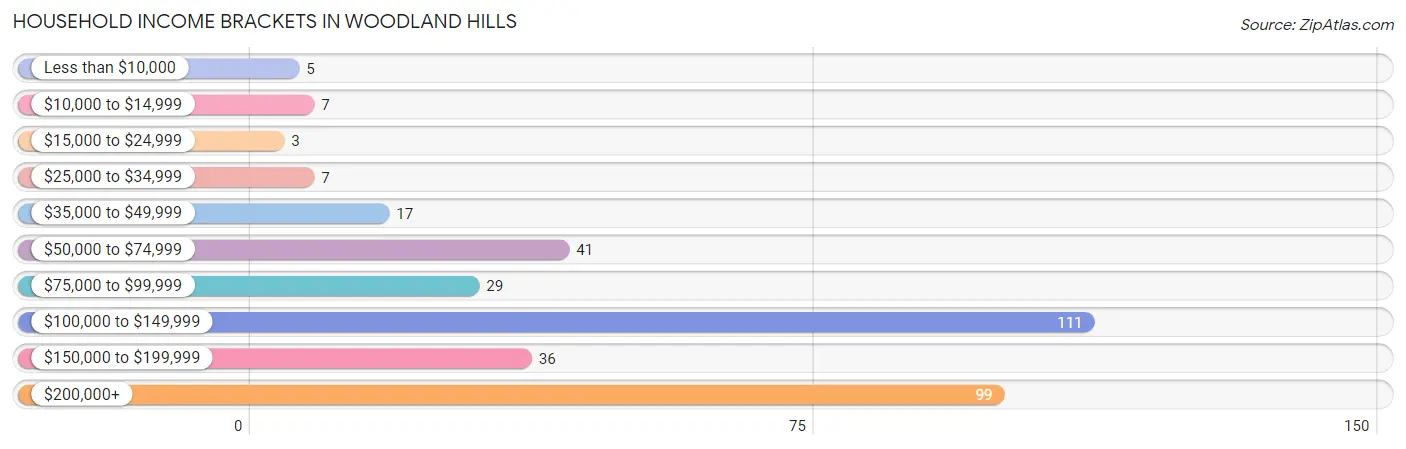
Household Income Brackets in Woodland Hills
With 111 households falling in the category, the $100,000 to $149,999 income range is the most frequent in Woodland Hills, accounting for 31.3% of all households. In contrast, only 3 households (0.9%) fall into the $15,000 to $24,999 income bracket, making it the least populous group.
| Income Bracket | # Households | % Households |
| Less than $10,000 | 5 | 1.4% |
| $10,000 to $14,999 | 7 | 2.0% |
| $15,000 to $24,999 | 3 | 0.8% |
| $25,000 to $34,999 | 7 | 2.0% |
| $35,000 to $49,999 | 17 | 4.8% |
| $50,000 to $74,999 | 41 | 11.5% |
| $75,000 to $99,999 | 29 | 8.2% |
| $100,000 to $149,999 | 111 | 31.3% |
| $150,000 to $199,999 | 36 | 10.1% |
| $200,000+ | 99 | 27.9% |
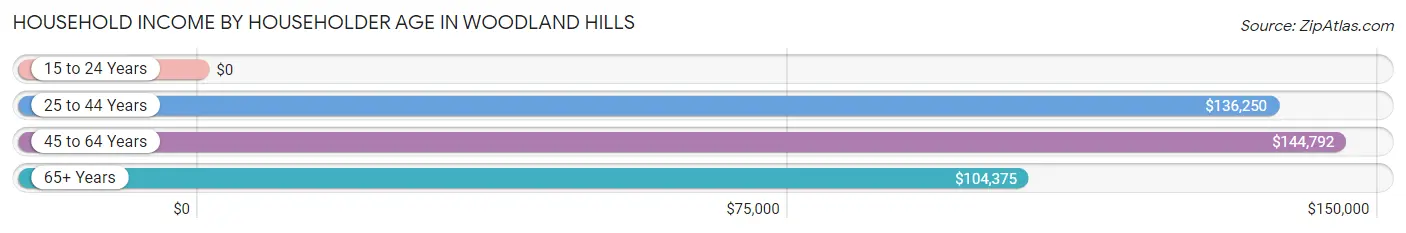
Household Income by Householder Age in Woodland Hills
The median household income in Woodland Hills is $130,096, with the highest median household income of $144,792 found in the 45 to 64 years age bracket for the primary householder. A total of 167 households (47.0%) fall into this category.
| Income Bracket | # Households | Median Income |
| 15 to 24 Years | 0 (0.0%) | $0 |
| 25 to 44 Years | 61 (17.2%) | $136,250 |
| 45 to 64 Years | 167 (47.0%) | $144,792 |
| 65+ Years | 127 (35.8%) | $104,375 |
| Total | 355 (100.0%) | $130,096 |
Poverty in Woodland Hills
Income Below Poverty by Sex and Age in Woodland Hills
With 3.9% poverty level for males and 9.6% for females among the residents of Woodland Hills, under 5 year old males and 25 to 34 year old females are the most vulnerable to poverty, with 8 males (22.2%) and 16 females (24.2%) in their respective age groups living below the poverty level.
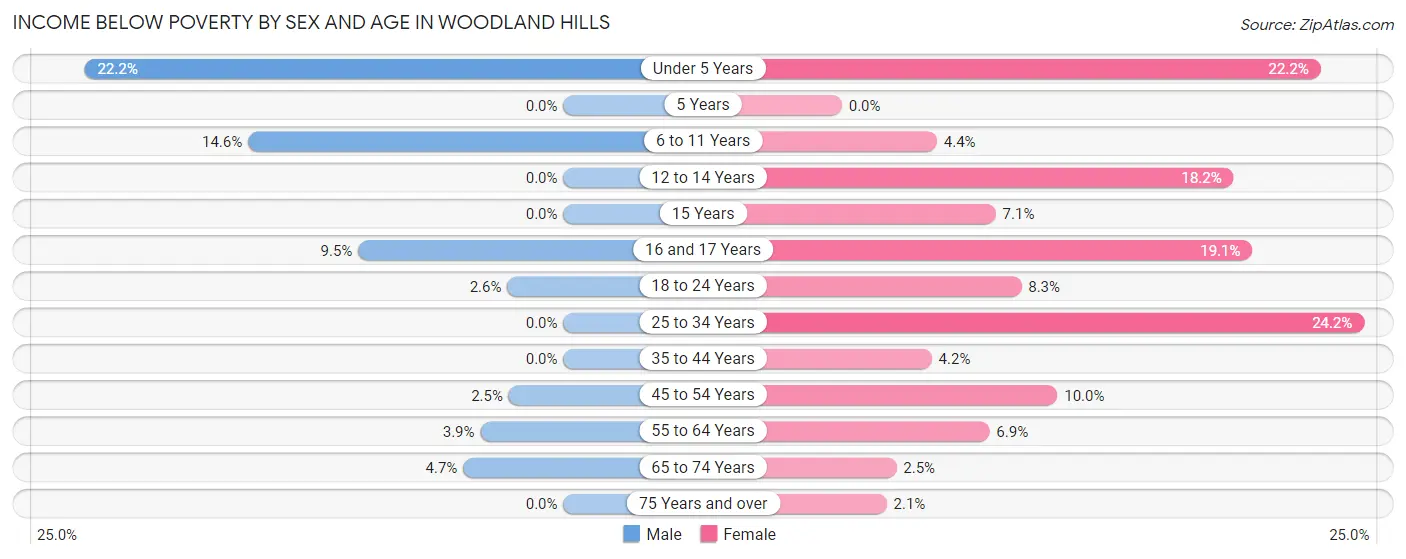
| Age Bracket | Male | Female |
| Under 5 Years | 8 (22.2%) | 8 (22.2%) |
| 5 Years | 0 (0.0%) | 0 (0.0%) |
| 6 to 11 Years | 6 (14.6%) | 3 (4.4%) |
| 12 to 14 Years | 0 (0.0%) | 4 (18.2%) |
| 15 Years | 0 (0.0%) | 1 (7.1%) |
| 16 and 17 Years | 2 (9.5%) | 4 (19.1%) |
| 18 to 24 Years | 2 (2.6%) | 5 (8.3%) |
| 25 to 34 Years | 0 (0.0%) | 16 (24.2%) |
| 35 to 44 Years | 0 (0.0%) | 2 (4.2%) |
| 45 to 54 Years | 2 (2.5%) | 10 (10.0%) |
| 55 to 64 Years | 3 (3.8%) | 5 (6.9%) |
| 65 to 74 Years | 4 (4.6%) | 2 (2.5%) |
| 75 Years and over | 0 (0.0%) | 1 (2.1%) |
| Total | 27 (3.9%) | 61 (9.6%) |
Income Above Poverty by Sex and Age in Woodland Hills
According to the poverty statistics in Woodland Hills, males aged 5 years and females aged 5 years are the age groups that are most secure financially, with 100.0% of males and 100.0% of females in these age groups living above the poverty line.
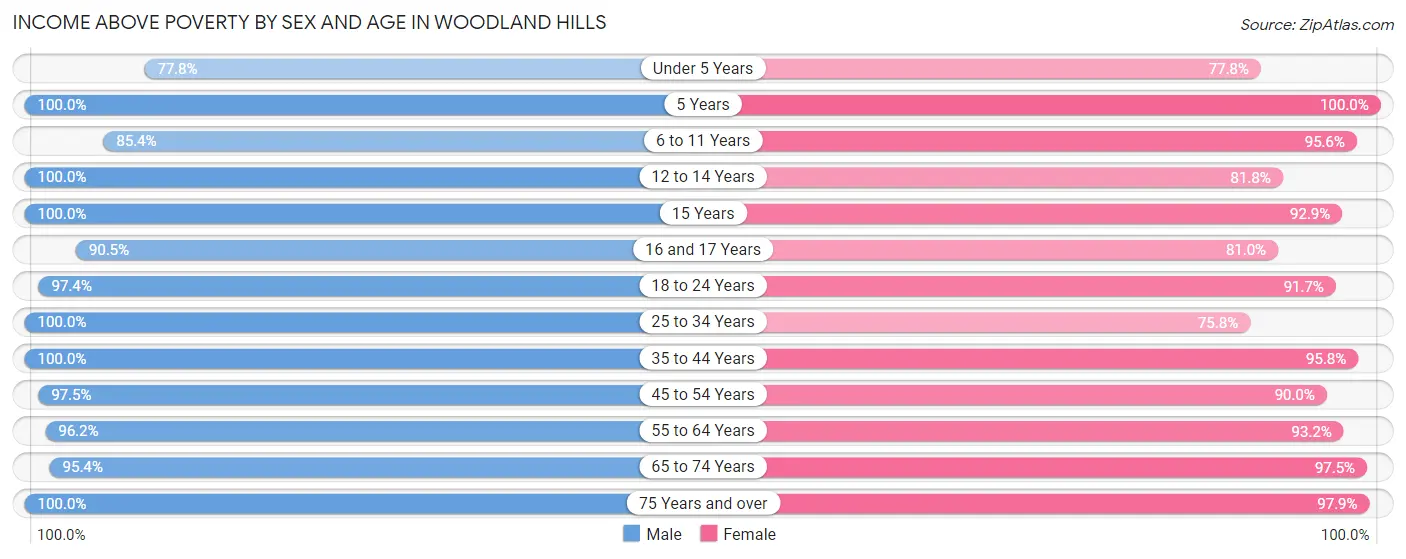
| Age Bracket | Male | Female |
| Under 5 Years | 28 (77.8%) | 28 (77.8%) |
| 5 Years | 57 (100.0%) | 2 (100.0%) |
| 6 to 11 Years | 35 (85.4%) | 65 (95.6%) |
| 12 to 14 Years | 35 (100.0%) | 18 (81.8%) |
| 15 Years | 8 (100.0%) | 13 (92.9%) |
| 16 and 17 Years | 19 (90.5%) | 17 (80.9%) |
| 18 to 24 Years | 75 (97.4%) | 55 (91.7%) |
| 25 to 34 Years | 70 (100.0%) | 50 (75.8%) |
| 35 to 44 Years | 61 (100.0%) | 46 (95.8%) |
| 45 to 54 Years | 77 (97.5%) | 90 (90.0%) |
| 55 to 64 Years | 75 (96.2%) | 68 (93.1%) |
| 65 to 74 Years | 82 (95.4%) | 77 (97.5%) |
| 75 Years and over | 43 (100.0%) | 47 (97.9%) |
| Total | 665 (96.1%) | 576 (90.4%) |
Income Below Poverty Among Married-Couple Families in Woodland Hills
The poverty statistics for married-couple families in Woodland Hills show that 2.6% or 8 of the total 311 families live below the poverty line. Families with 5 or more children have the highest poverty rate of 37.5%, comprising of 3 families. On the other hand, families with 1 or 2 children have the lowest poverty rate of 0.0%, which includes 0 families.
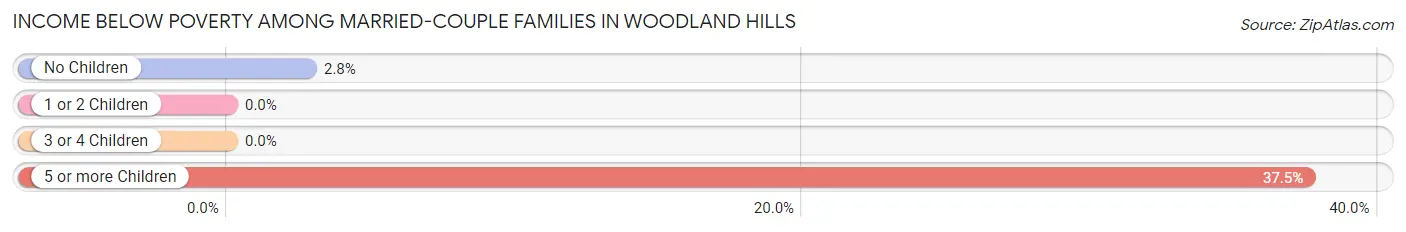
| Children | Above Poverty | Below Poverty |
| No Children | 177 (97.3%) | 5 (2.8%) |
| 1 or 2 Children | 76 (100.0%) | 0 (0.0%) |
| 3 or 4 Children | 45 (100.0%) | 0 (0.0%) |
| 5 or more Children | 5 (62.5%) | 3 (37.5%) |
| Total | 303 (97.4%) | 8 (2.6%) |
Income Below Poverty Among Single-Parent Households in Woodland Hills
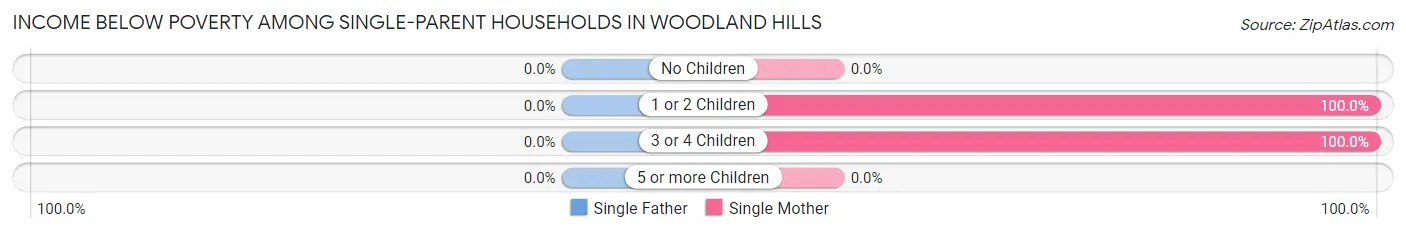
| Children | Single Father | Single Mother |
| No Children | 0 (0.0%) | 0 (0.0%) |
| 1 or 2 Children | 0 (0.0%) | 7 (100.0%) |
| 3 or 4 Children | 0 (0.0%) | 1 (100.0%) |
| 5 or more Children | 0 (0.0%) | 0 (0.0%) |
| Total | 0 (0.0%) | 8 (53.3%) |
Income Below Poverty Among Married-Couple vs Single-Parent Households in Woodland Hills
The poverty data for Woodland Hills shows that 8 of the married-couple family households (2.6%) and 8 of the single-parent households (30.8%) are living below the poverty level. Within the married-couple family households, those with 5 or more children have the highest poverty rate, with 3 households (37.5%) falling below the poverty line. Among the single-parent households, those with 3 or 4 children have the highest poverty rate, with 1 household (100.0%) living below poverty.
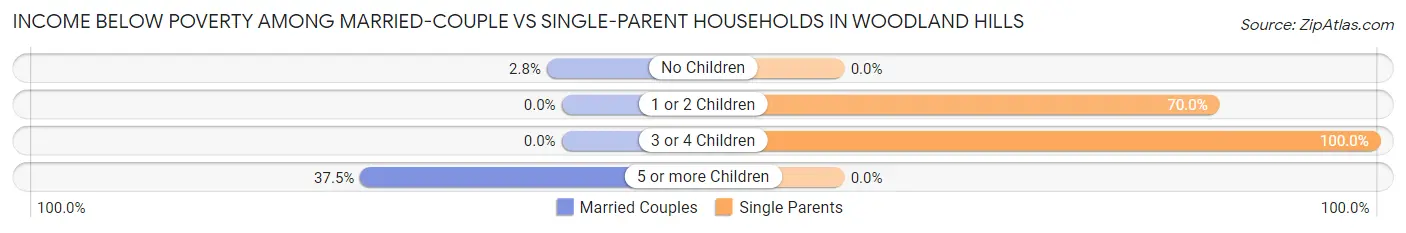
| Children | Married-Couple Families | Single-Parent Households |
| No Children | 5 (2.8%) | 0 (0.0%) |
| 1 or 2 Children | 0 (0.0%) | 7 (70.0%) |
| 3 or 4 Children | 0 (0.0%) | 1 (100.0%) |
| 5 or more Children | 3 (37.5%) | 0 (0.0%) |
| Total | 8 (2.6%) | 8 (30.8%) |
Employment Characteristics in Woodland Hills
Employment by Class of Employer in Woodland Hills
Among the 585 employed individuals in Woodland Hills, private company employees (363 | 62.1%), self-employed (incorporated) (69 | 11.8%), and local government employees (43 | 7.3%) make up the most common classes of employment.
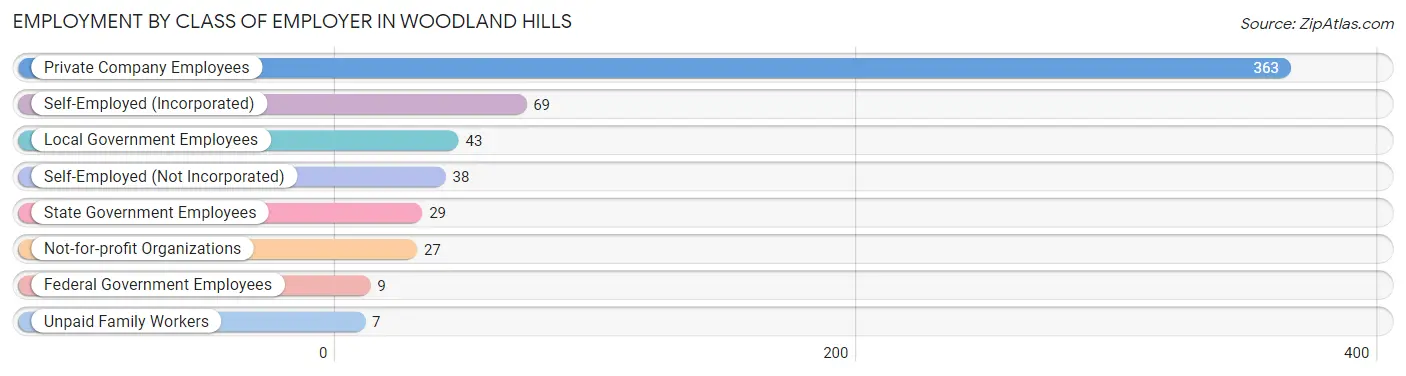
| Employer Class | # Employees | % Employees |
| Private Company Employees | 363 | 62.1% |
| Self-Employed (Incorporated) | 69 | 11.8% |
| Self-Employed (Not Incorporated) | 38 | 6.5% |
| Not-for-profit Organizations | 27 | 4.6% |
| Local Government Employees | 43 | 7.3% |
| State Government Employees | 29 | 5.0% |
| Federal Government Employees | 9 | 1.5% |
| Unpaid Family Workers | 7 | 1.2% |
| Total | 585 | 100.0% |
Employment Status by Age in Woodland Hills
According to the labor force statistics for Woodland Hills, out of the total population over 16 years of age (1,010), 60.4% or 610 individuals are in the labor force, with 2.3% or 14 of them unemployed. The age group with the highest labor force participation rate is 30 to 34 years, with 96.4% or 53 individuals in the labor force. Within the labor force, the 16 to 19 years age range has the highest percentage of unemployed individuals, with 21.1% or 8 of them being unemployed.
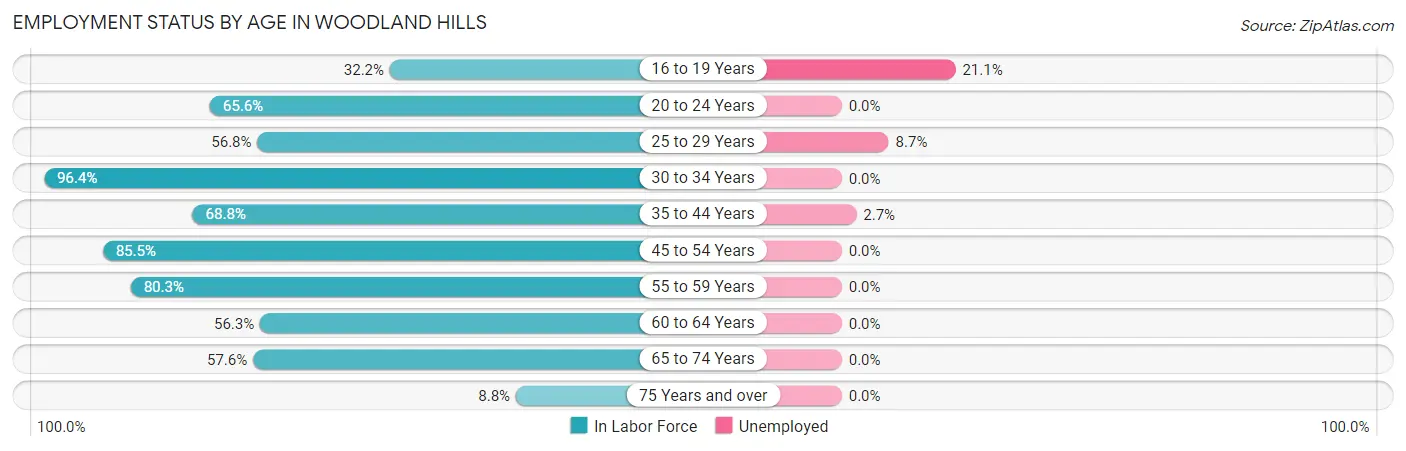
| Age Bracket | In Labor Force | Unemployed |
| 16 to 19 Years | 38 (32.2%) | 8 (21.1%) |
| 20 to 24 Years | 40 (65.6%) | 0 (0.0%) |
| 25 to 29 Years | 46 (56.8%) | 4 (8.7%) |
| 30 to 34 Years | 53 (96.4%) | 0 (0.0%) |
| 35 to 44 Years | 75 (68.8%) | 2 (2.7%) |
| 45 to 54 Years | 153 (85.5%) | 0 (0.0%) |
| 55 to 59 Years | 57 (80.3%) | 0 (0.0%) |
| 60 to 64 Years | 45 (56.3%) | 0 (0.0%) |
| 65 to 74 Years | 95 (57.6%) | 0 (0.0%) |
| 75 Years and over | 8 (8.8%) | 0 (0.0%) |
| Total | 610 (60.4%) | 14 (2.3%) |
Employment Status by Educational Attainment in Woodland Hills
According to labor force statistics for Woodland Hills, 74.6% of individuals (429) out of the total population between 25 and 64 years of age (575) are in the labor force, with 1.4% or 6 of them being unemployed. The group with the highest labor force participation rate are those with the educational attainment of bachelor's degree or higher, with 84.6% or 214 individuals in the labor force. Within the labor force, individuals with high school diploma education have the highest percentage of unemployment, with 2.2% or 2 of them being unemployed.
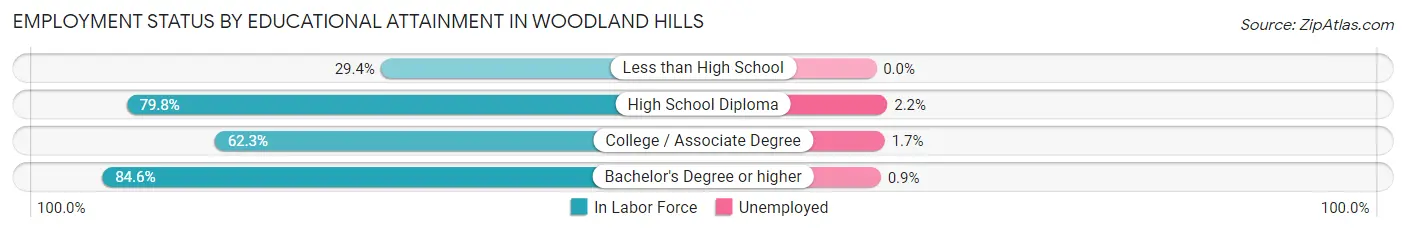
| Educational Attainment | In Labor Force | Unemployed |
| Less than High School | 5 (29.4%) | 0 (0.0%) |
| High School Diploma | 91 (79.8%) | 3 (2.2%) |
| College / Associate Degree | 119 (62.3%) | 3 (1.7%) |
| Bachelor's Degree or higher | 214 (84.6%) | 2 (0.9%) |
| Total | 429 (74.6%) | 8 (1.4%) |
Employment Occupations by Sex in Woodland Hills
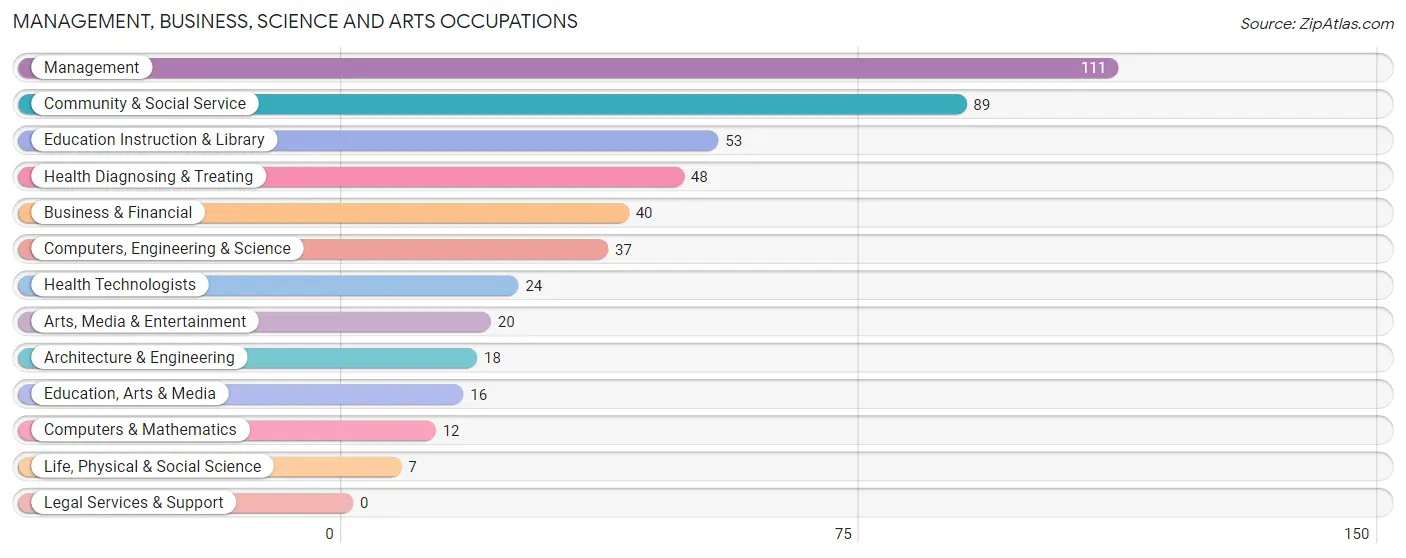
Management, Business, Science and Arts Occupations
The most common Management, Business, Science and Arts occupations in Woodland Hills are Management (111 | 18.6%), Community & Social Service (89 | 14.9%), Education Instruction & Library (53 | 8.9%), Health Diagnosing & Treating (48 | 8.1%), and Business & Financial (40 | 6.7%).
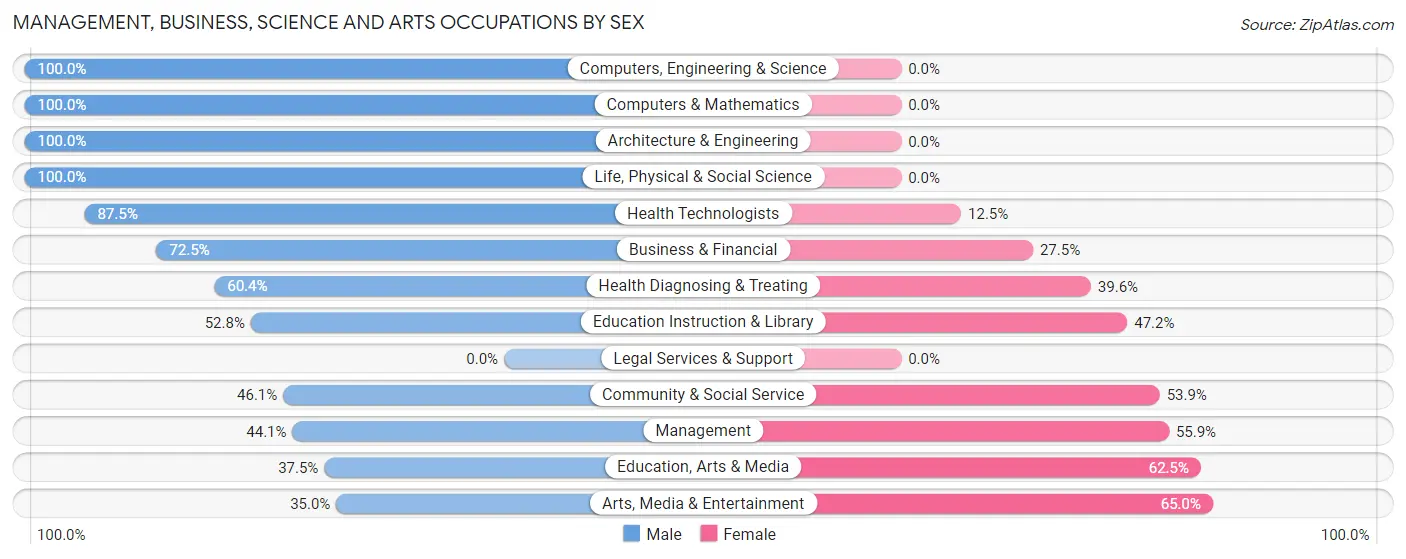
Management, Business, Science and Arts Occupations by Sex
Within the Management, Business, Science and Arts occupations in Woodland Hills, the most male-oriented occupations are Computers, Engineering & Science (100.0%), Computers & Mathematics (100.0%), and Architecture & Engineering (100.0%), while the most female-oriented occupations are Arts, Media & Entertainment (65.0%), Education, Arts & Media (62.5%), and Management (55.9%).
| Occupation | Male | Female |
| Management | 49 (44.1%) | 62 (55.9%) |
| Business & Financial | 29 (72.5%) | 11 (27.5%) |
| Computers, Engineering & Science | 37 (100.0%) | 0 (0.0%) |
| Computers & Mathematics | 12 (100.0%) | 0 (0.0%) |
| Architecture & Engineering | 18 (100.0%) | 0 (0.0%) |
| Life, Physical & Social Science | 7 (100.0%) | 0 (0.0%) |
| Community & Social Service | 41 (46.1%) | 48 (53.9%) |
| Education, Arts & Media | 6 (37.5%) | 10 (62.5%) |
| Legal Services & Support | 0 (0.0%) | 0 (0.0%) |
| Education Instruction & Library | 28 (52.8%) | 25 (47.2%) |
| Arts, Media & Entertainment | 7 (35.0%) | 13 (65.0%) |
| Health Diagnosing & Treating | 29 (60.4%) | 19 (39.6%) |
| Health Technologists | 21 (87.5%) | 3 (12.5%) |
| Total (Category) | 185 (56.9%) | 140 (43.1%) |
| Total (Overall) | 365 (61.2%) | 231 (38.8%) |
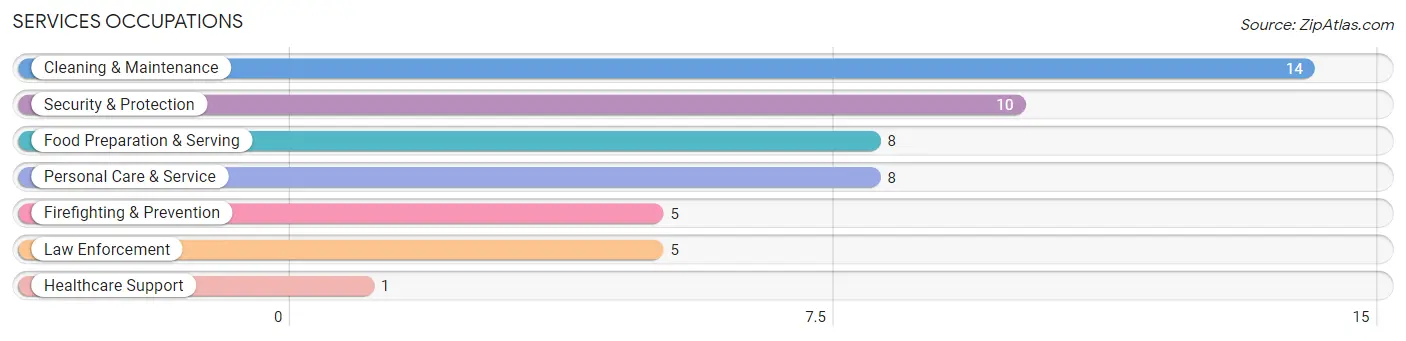
Services Occupations
The most common Services occupations in Woodland Hills are Cleaning & Maintenance (14 | 2.4%), Security & Protection (10 | 1.7%), Food Preparation & Serving (8 | 1.3%), Personal Care & Service (8 | 1.3%), and Firefighting & Prevention (5 | 0.8%).
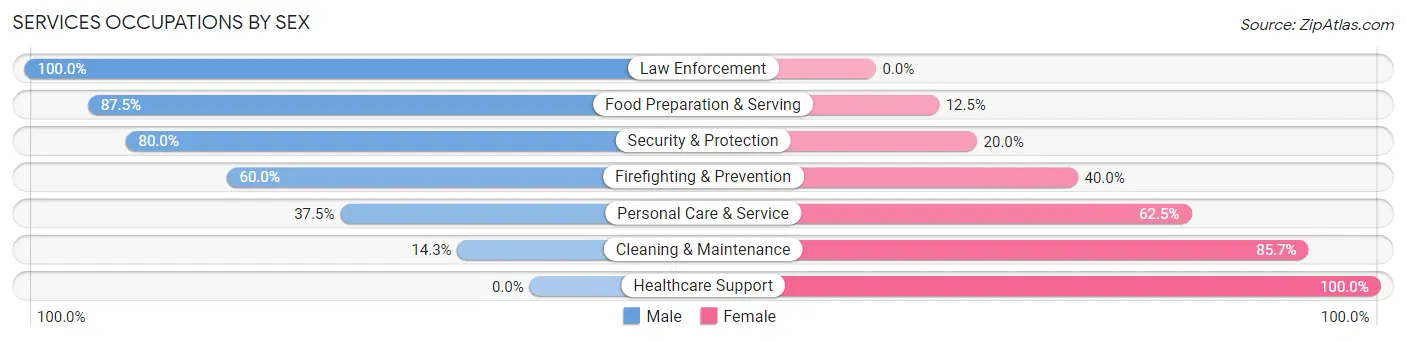
Services Occupations by Sex
Within the Services occupations in Woodland Hills, the most male-oriented occupations are Law Enforcement (100.0%), Food Preparation & Serving (87.5%), and Security & Protection (80.0%), while the most female-oriented occupations are Healthcare Support (100.0%), Cleaning & Maintenance (85.7%), and Personal Care & Service (62.5%).
| Occupation | Male | Female |
| Healthcare Support | 0 (0.0%) | 1 (100.0%) |
| Security & Protection | 8 (80.0%) | 2 (20.0%) |
| Firefighting & Prevention | 3 (60.0%) | 2 (40.0%) |
| Law Enforcement | 5 (100.0%) | 0 (0.0%) |
| Food Preparation & Serving | 7 (87.5%) | 1 (12.5%) |
| Cleaning & Maintenance | 2 (14.3%) | 12 (85.7%) |
| Personal Care & Service | 3 (37.5%) | 5 (62.5%) |
| Total (Category) | 20 (48.8%) | 21 (51.2%) |
| Total (Overall) | 365 (61.2%) | 231 (38.8%) |
Sales and Office Occupations
The most common Sales and Office occupations in Woodland Hills are Office & Administration (73 | 12.2%), and Sales & Related (49 | 8.2%).
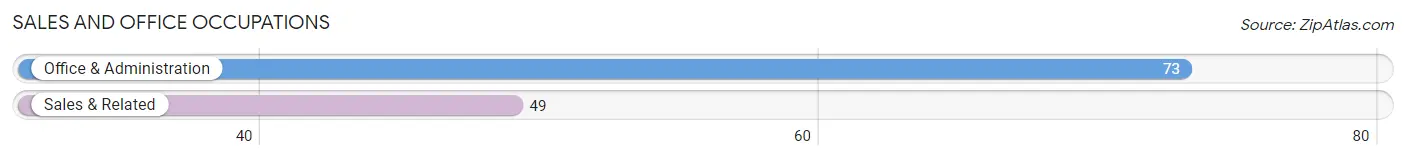
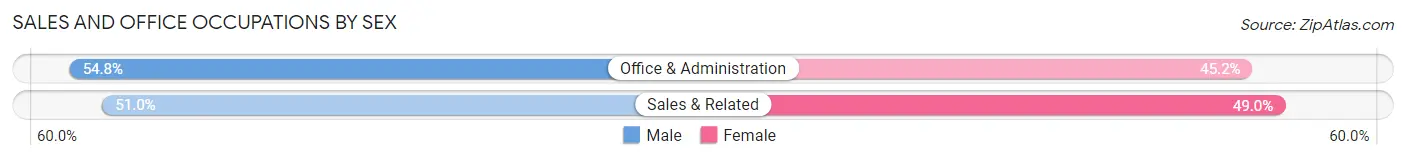
Sales and Office Occupations by Sex
| Occupation | Male | Female |
| Sales & Related | 25 (51.0%) | 24 (49.0%) |
| Office & Administration | 40 (54.8%) | 33 (45.2%) |
| Total (Category) | 65 (53.3%) | 57 (46.7%) |
| Total (Overall) | 365 (61.2%) | 231 (38.8%) |
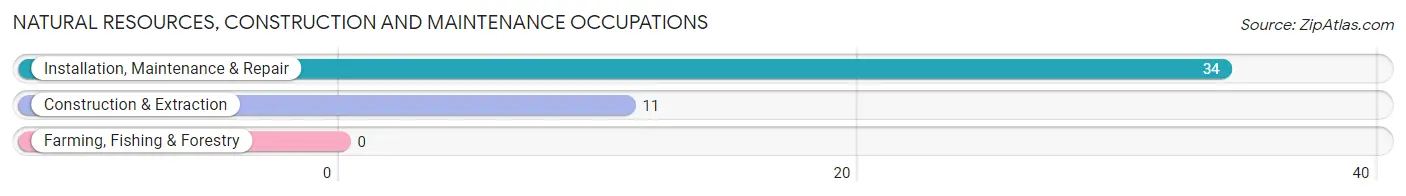
Natural Resources, Construction and Maintenance Occupations
The most common Natural Resources, Construction and Maintenance occupations in Woodland Hills are Installation, Maintenance & Repair (34 | 5.7%), and Construction & Extraction (11 | 1.8%).
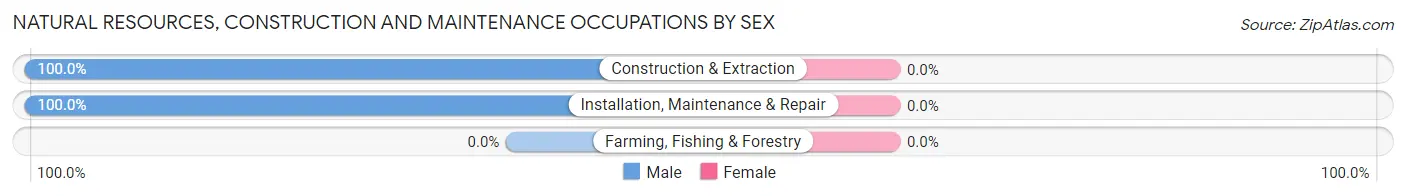
Natural Resources, Construction and Maintenance Occupations by Sex
| Occupation | Male | Female |
| Farming, Fishing & Forestry | 0 (0.0%) | 0 (0.0%) |
| Construction & Extraction | 11 (100.0%) | 0 (0.0%) |
| Installation, Maintenance & Repair | 34 (100.0%) | 0 (0.0%) |
| Total (Category) | 45 (100.0%) | 0 (0.0%) |
| Total (Overall) | 365 (61.2%) | 231 (38.8%) |
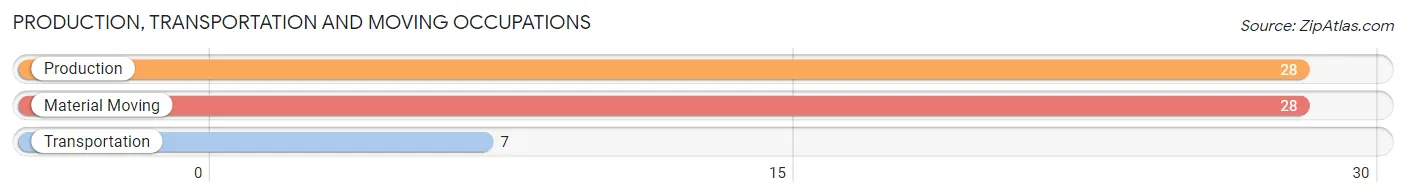
Production, Transportation and Moving Occupations
The most common Production, Transportation and Moving occupations in Woodland Hills are Production (28 | 4.7%), Material Moving (28 | 4.7%), and Transportation (7 | 1.2%).
Production, Transportation and Moving Occupations by Sex
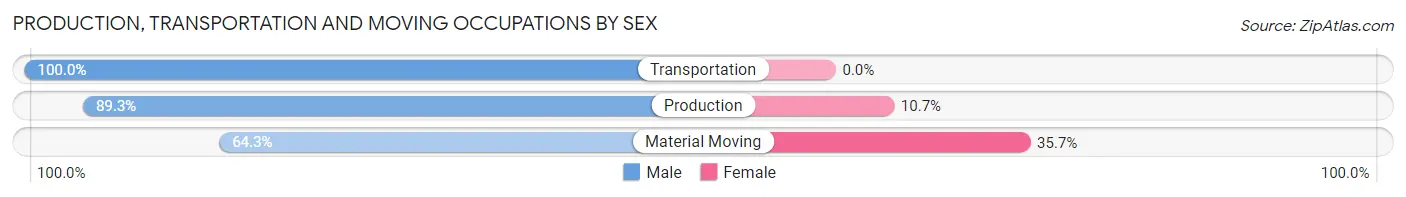
| Occupation | Male | Female |
| Production | 25 (89.3%) | 3 (10.7%) |
| Transportation | 7 (100.0%) | 0 (0.0%) |
| Material Moving | 18 (64.3%) | 10 (35.7%) |
| Total (Category) | 50 (79.4%) | 13 (20.6%) |
| Total (Overall) | 365 (61.2%) | 231 (38.8%) |
Employment Industries by Sex in Woodland Hills
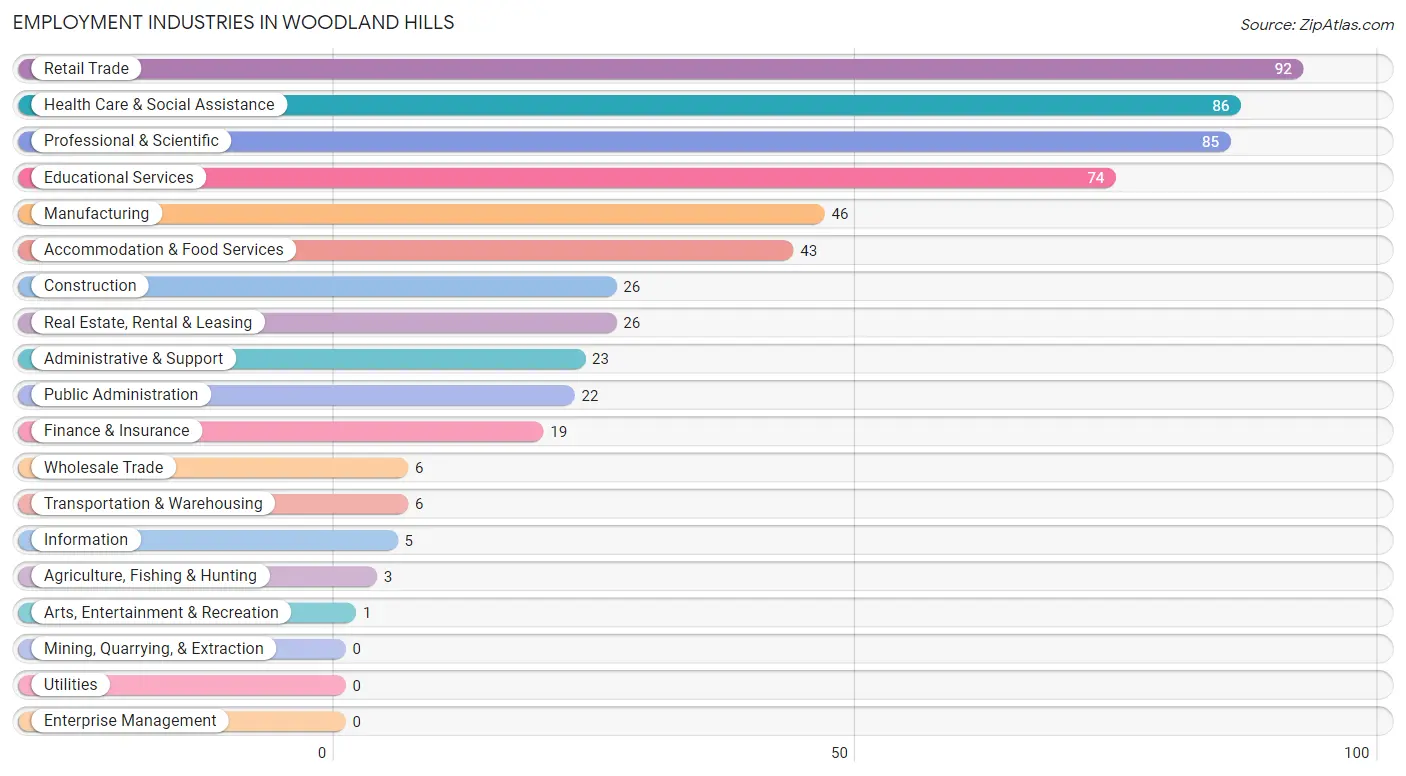
Employment Industries in Woodland Hills
The major employment industries in Woodland Hills include Retail Trade (92 | 15.4%), Health Care & Social Assistance (86 | 14.4%), Professional & Scientific (85 | 14.3%), Educational Services (74 | 12.4%), and Manufacturing (46 | 7.7%).
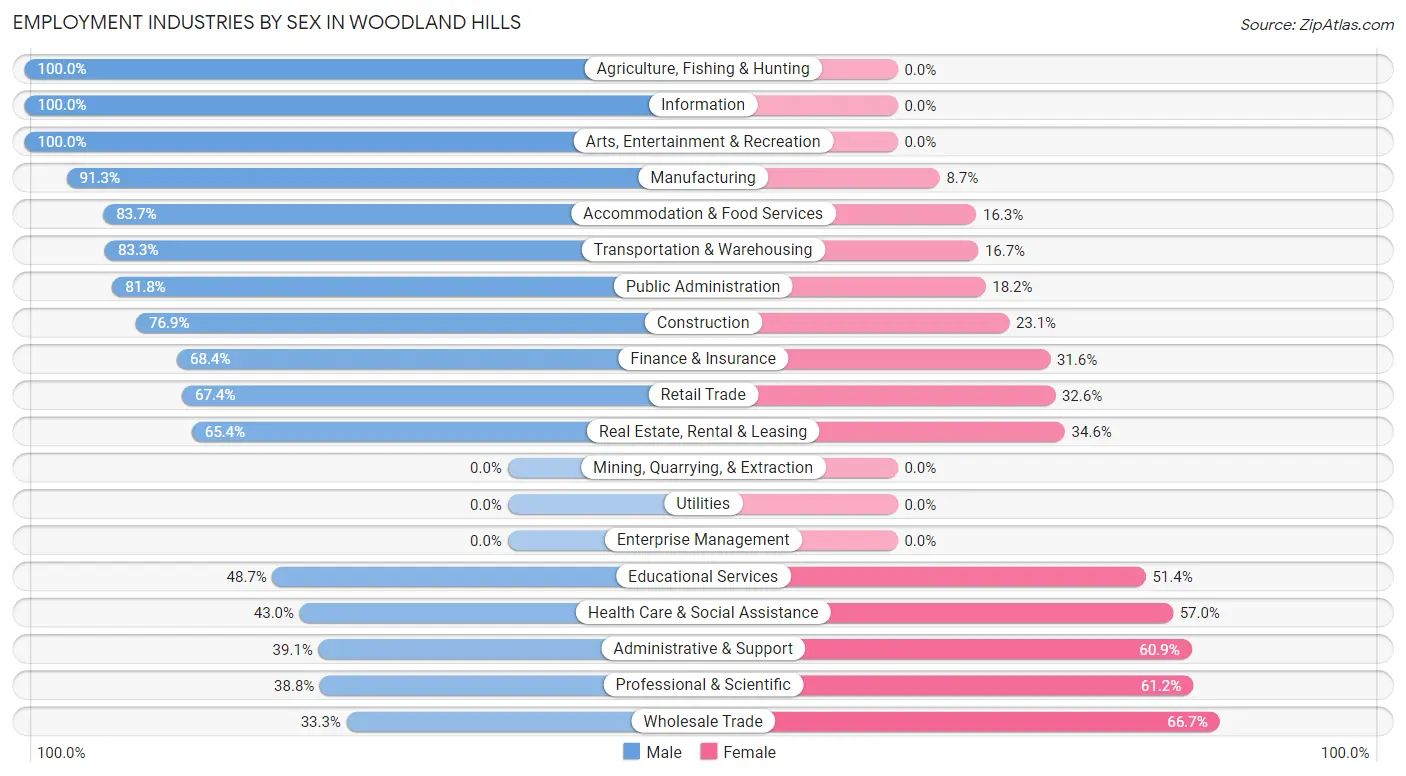
Employment Industries by Sex in Woodland Hills
The Woodland Hills industries that see more men than women are Agriculture, Fishing & Hunting (100.0%), Information (100.0%), and Arts, Entertainment & Recreation (100.0%), whereas the industries that tend to have a higher number of women are Wholesale Trade (66.7%), Professional & Scientific (61.2%), and Administrative & Support (60.9%).
| Industry | Male | Female |
| Agriculture, Fishing & Hunting | 3 (100.0%) | 0 (0.0%) |
| Mining, Quarrying, & Extraction | 0 (0.0%) | 0 (0.0%) |
| Construction | 20 (76.9%) | 6 (23.1%) |
| Manufacturing | 42 (91.3%) | 4 (8.7%) |
| Wholesale Trade | 2 (33.3%) | 4 (66.7%) |
| Retail Trade | 62 (67.4%) | 30 (32.6%) |
| Transportation & Warehousing | 5 (83.3%) | 1 (16.7%) |
| Utilities | 0 (0.0%) | 0 (0.0%) |
| Information | 5 (100.0%) | 0 (0.0%) |
| Finance & Insurance | 13 (68.4%) | 6 (31.6%) |
| Real Estate, Rental & Leasing | 17 (65.4%) | 9 (34.6%) |
| Professional & Scientific | 33 (38.8%) | 52 (61.2%) |
| Enterprise Management | 0 (0.0%) | 0 (0.0%) |
| Administrative & Support | 9 (39.1%) | 14 (60.9%) |
| Educational Services | 36 (48.6%) | 38 (51.3%) |
| Health Care & Social Assistance | 37 (43.0%) | 49 (57.0%) |
| Arts, Entertainment & Recreation | 1 (100.0%) | 0 (0.0%) |
| Accommodation & Food Services | 36 (83.7%) | 7 (16.3%) |
| Public Administration | 18 (81.8%) | 4 (18.2%) |
| Total | 365 (61.2%) | 231 (38.8%) |
Education in Woodland Hills
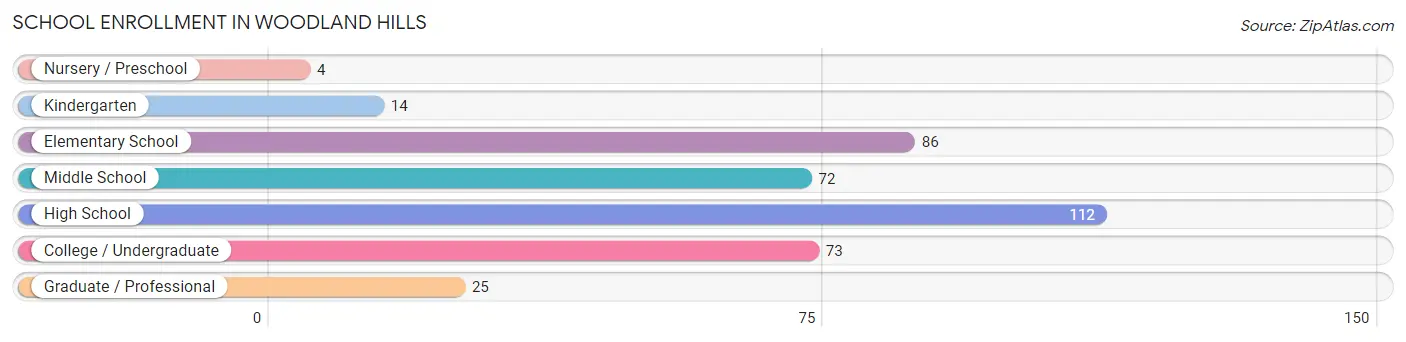
School Enrollment in Woodland Hills
The most common levels of schooling among the 386 students in Woodland Hills are high school (112 | 29.0%), elementary school (86 | 22.3%), and college / undergraduate (73 | 18.9%).
| School Level | # Students | % Students |
| Nursery / Preschool | 4 | 1.0% |
| Kindergarten | 14 | 3.6% |
| Elementary School | 86 | 22.3% |
| Middle School | 72 | 18.6% |
| High School | 112 | 29.0% |
| College / Undergraduate | 73 | 18.9% |
| Graduate / Professional | 25 | 6.5% |
| Total | 386 | 100.0% |
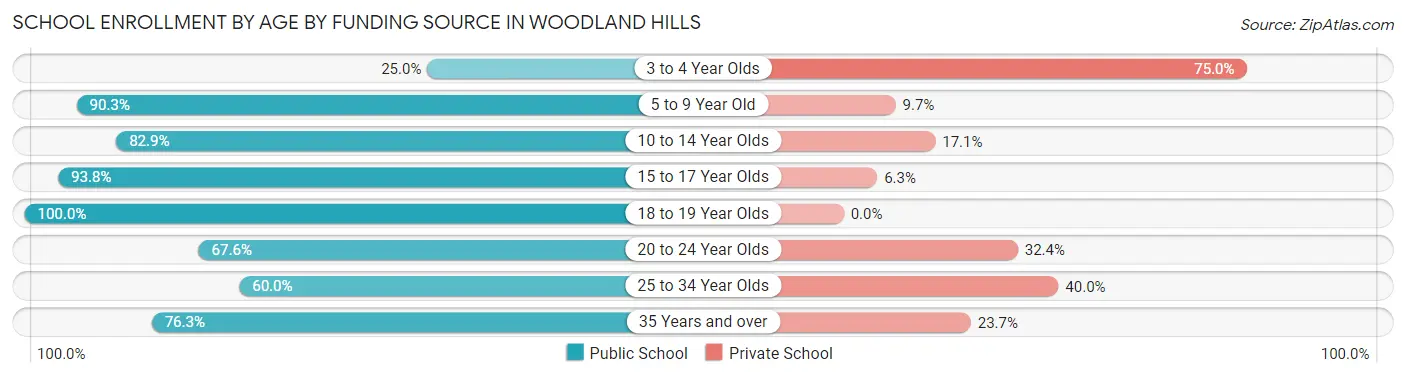
School Enrollment by Age by Funding Source in Woodland Hills
Out of a total of 386 students who are enrolled in schools in Woodland Hills, 59 (15.3%) attend a private institution, while the remaining 327 (84.7%) are enrolled in public schools. The age group of 3 to 4 year olds has the highest likelihood of being enrolled in private schools, with 3 (75.0% in the age bracket) enrolled. Conversely, the age group of 18 to 19 year olds has the lowest likelihood of being enrolled in a private school, with 48 (100.0% in the age bracket) attending a public institution.
| Age Bracket | Public School | Private School |
| 3 to 4 Year Olds | 1 (25.0%) | 3 (75.0%) |
| 5 to 9 Year Old | 84 (90.3%) | 9 (9.7%) |
| 10 to 14 Year Olds | 68 (82.9%) | 14 (17.1%) |
| 15 to 17 Year Olds | 60 (93.8%) | 4 (6.2%) |
| 18 to 19 Year Olds | 48 (100.0%) | 0 (0.0%) |
| 20 to 24 Year Olds | 25 (67.6%) | 12 (32.4%) |
| 25 to 34 Year Olds | 12 (60.0%) | 8 (40.0%) |
| 35 Years and over | 29 (76.3%) | 9 (23.7%) |
| Total | 327 (84.7%) | 59 (15.3%) |
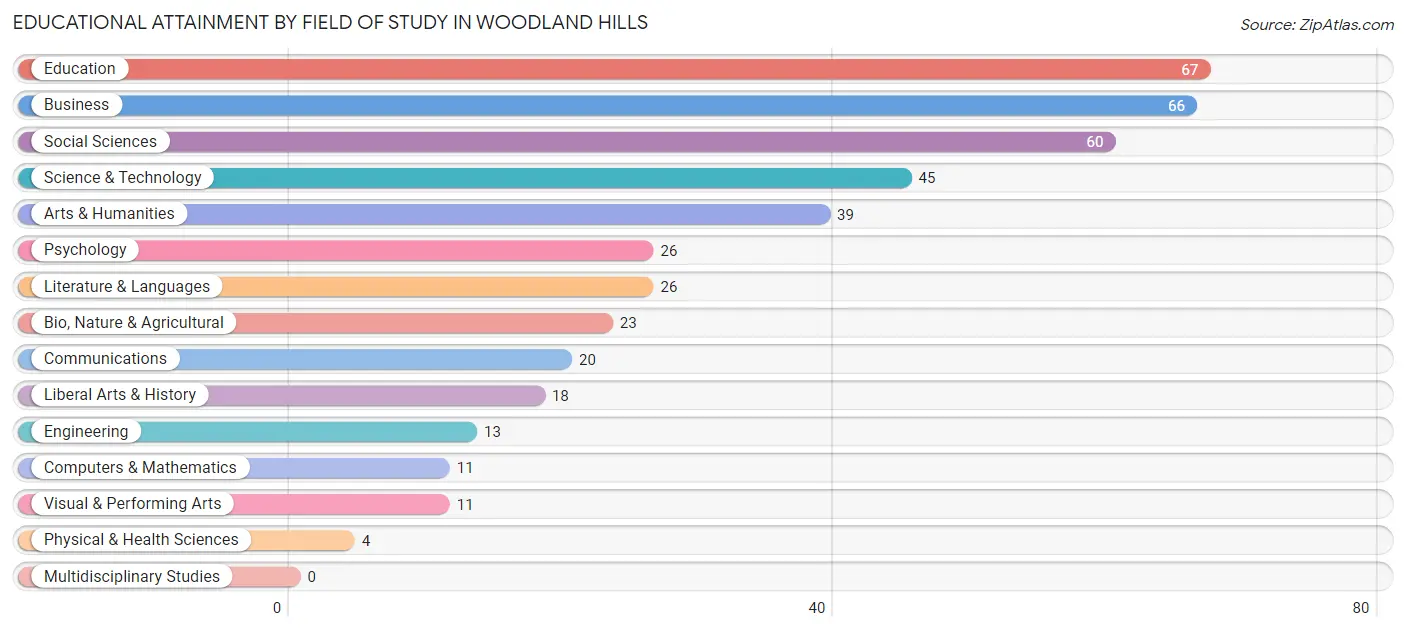
Educational Attainment by Field of Study in Woodland Hills
Education (67 | 15.6%), business (66 | 15.4%), social sciences (60 | 14.0%), science & technology (45 | 10.5%), and arts & humanities (39 | 9.1%) are the most common fields of study among 429 individuals in Woodland Hills who have obtained a bachelor's degree or higher.
| Field of Study | # Graduates | % Graduates |
| Computers & Mathematics | 11 | 2.6% |
| Bio, Nature & Agricultural | 23 | 5.4% |
| Physical & Health Sciences | 4 | 0.9% |
| Psychology | 26 | 6.1% |
| Social Sciences | 60 | 14.0% |
| Engineering | 13 | 3.0% |
| Multidisciplinary Studies | 0 | 0.0% |
| Science & Technology | 45 | 10.5% |
| Business | 66 | 15.4% |
| Education | 67 | 15.6% |
| Literature & Languages | 26 | 6.1% |
| Liberal Arts & History | 18 | 4.2% |
| Visual & Performing Arts | 11 | 2.6% |
| Communications | 20 | 4.7% |
| Arts & Humanities | 39 | 9.1% |
| Total | 429 | 100.0% |
Transportation & Commute in Woodland Hills
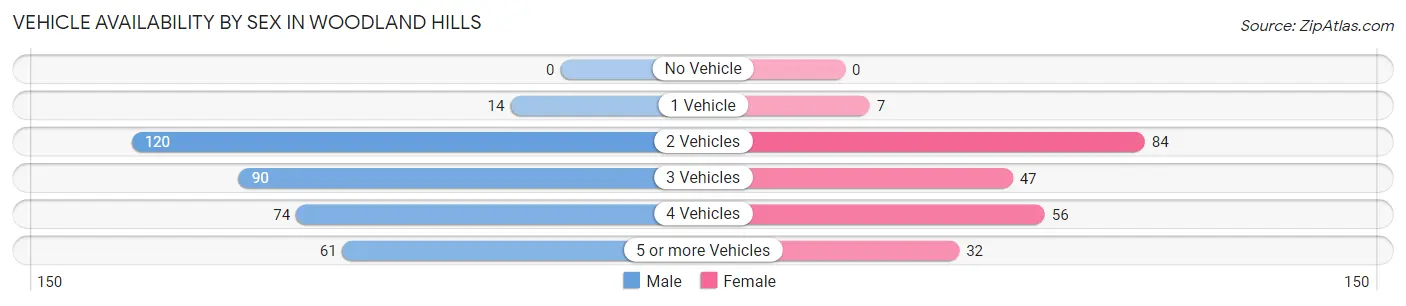
Vehicle Availability by Sex in Woodland Hills
The most prevalent vehicle ownership categories in Woodland Hills are males with 2 vehicles (120, accounting for 33.4%) and females with 2 vehicles (84, making up 53.1%).
| Vehicles Available | Male | Female |
| No Vehicle | 0 (0.0%) | 0 (0.0%) |
| 1 Vehicle | 14 (3.9%) | 7 (3.1%) |
| 2 Vehicles | 120 (33.4%) | 84 (37.2%) |
| 3 Vehicles | 90 (25.1%) | 47 (20.8%) |
| 4 Vehicles | 74 (20.6%) | 56 (24.8%) |
| 5 or more Vehicles | 61 (17.0%) | 32 (14.2%) |
| Total | 359 (100.0%) | 226 (100.0%) |
Commute Time in Woodland Hills
The most frequently occuring commute durations in Woodland Hills are 30 to 34 minutes (136 commuters, 30.2%), 20 to 24 minutes (68 commuters, 15.1%), and 25 to 29 minutes (57 commuters, 12.6%).
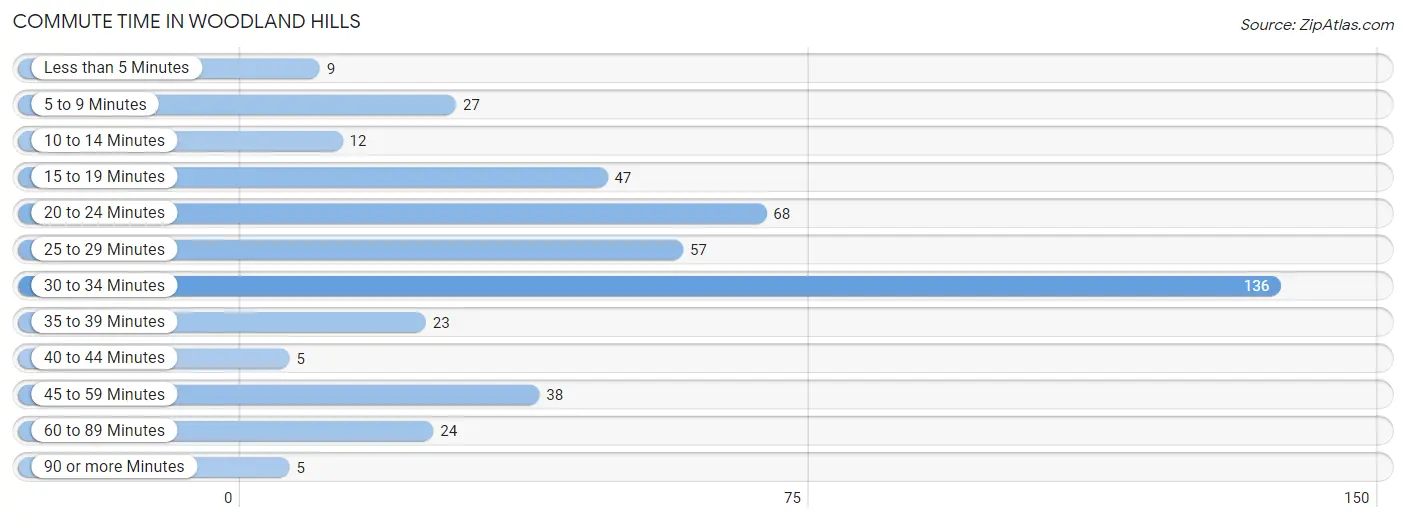
| Commute Time | # Commuters | % Commuters |
| Less than 5 Minutes | 9 | 2.0% |
| 5 to 9 Minutes | 27 | 6.0% |
| 10 to 14 Minutes | 12 | 2.7% |
| 15 to 19 Minutes | 47 | 10.4% |
| 20 to 24 Minutes | 68 | 15.1% |
| 25 to 29 Minutes | 57 | 12.6% |
| 30 to 34 Minutes | 136 | 30.2% |
| 35 to 39 Minutes | 23 | 5.1% |
| 40 to 44 Minutes | 5 | 1.1% |
| 45 to 59 Minutes | 38 | 8.4% |
| 60 to 89 Minutes | 24 | 5.3% |
| 90 or more Minutes | 5 | 1.1% |
Commute Time by Sex in Woodland Hills
The most common commute times in Woodland Hills are 30 to 34 minutes (113 commuters, 40.4%) for males and 15 to 19 minutes (30 commuters, 17.5%) for females.
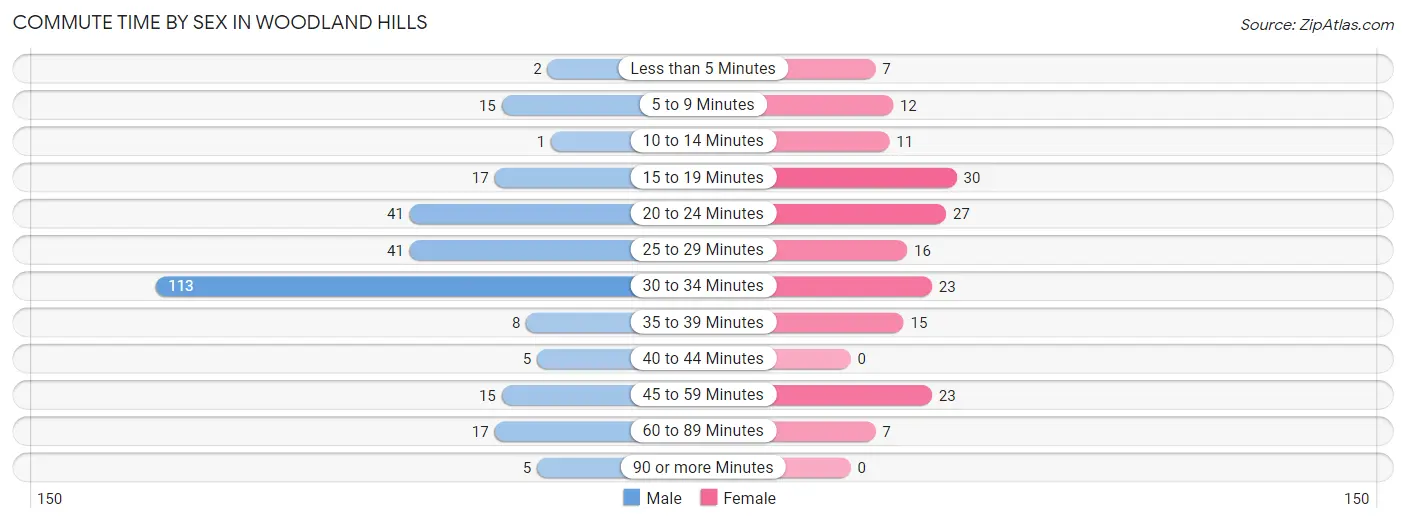
| Commute Time | Male | Female |
| Less than 5 Minutes | 2 (0.7%) | 7 (4.1%) |
| 5 to 9 Minutes | 15 (5.4%) | 12 (7.0%) |
| 10 to 14 Minutes | 1 (0.4%) | 11 (6.4%) |
| 15 to 19 Minutes | 17 (6.1%) | 30 (17.5%) |
| 20 to 24 Minutes | 41 (14.6%) | 27 (15.8%) |
| 25 to 29 Minutes | 41 (14.6%) | 16 (9.4%) |
| 30 to 34 Minutes | 113 (40.4%) | 23 (13.5%) |
| 35 to 39 Minutes | 8 (2.9%) | 15 (8.8%) |
| 40 to 44 Minutes | 5 (1.8%) | 0 (0.0%) |
| 45 to 59 Minutes | 15 (5.4%) | 23 (13.5%) |
| 60 to 89 Minutes | 17 (6.1%) | 7 (4.1%) |
| 90 or more Minutes | 5 (1.8%) | 0 (0.0%) |
Time of Departure to Work by Sex in Woodland Hills
The most frequent times of departure to work in Woodland Hills are 7:00 AM to 7:29 AM (74, 26.4%) for males and 7:30 AM to 7:59 AM (29, 17.0%) for females.
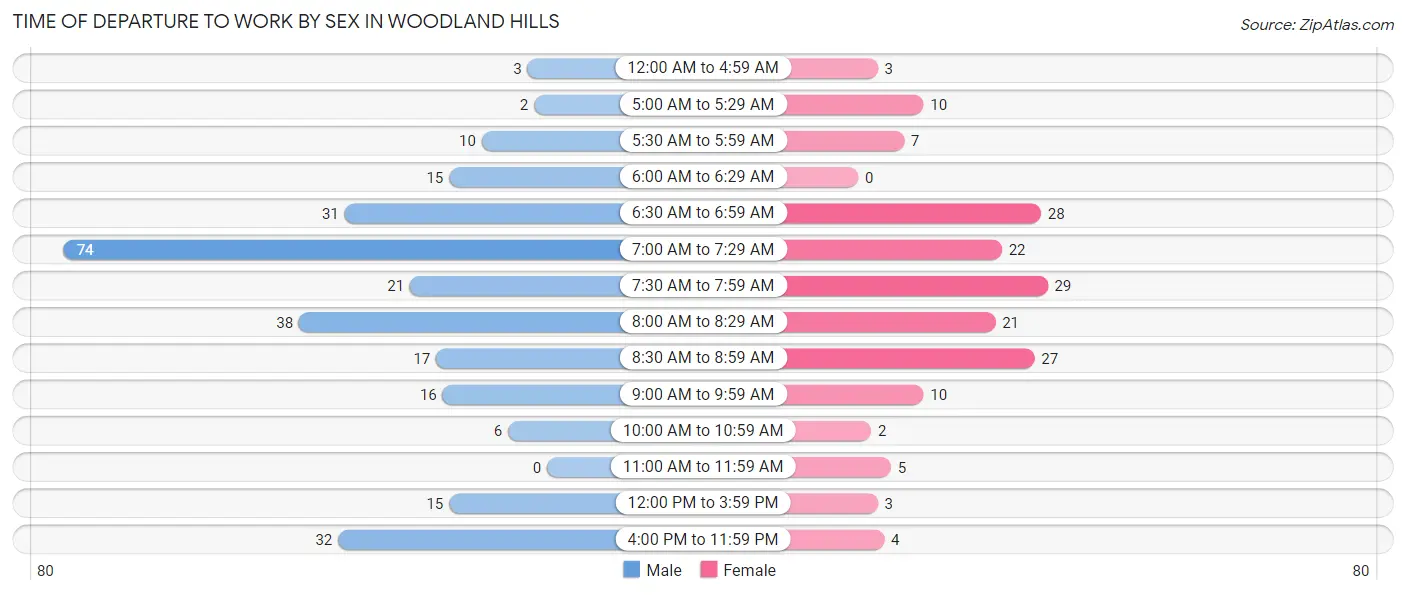
| Time of Departure | Male | Female |
| 12:00 AM to 4:59 AM | 3 (1.1%) | 3 (1.8%) |
| 5:00 AM to 5:29 AM | 2 (0.7%) | 10 (5.9%) |
| 5:30 AM to 5:59 AM | 10 (3.6%) | 7 (4.1%) |
| 6:00 AM to 6:29 AM | 15 (5.4%) | 0 (0.0%) |
| 6:30 AM to 6:59 AM | 31 (11.1%) | 28 (16.4%) |
| 7:00 AM to 7:29 AM | 74 (26.4%) | 22 (12.9%) |
| 7:30 AM to 7:59 AM | 21 (7.5%) | 29 (17.0%) |
| 8:00 AM to 8:29 AM | 38 (13.6%) | 21 (12.3%) |
| 8:30 AM to 8:59 AM | 17 (6.1%) | 27 (15.8%) |
| 9:00 AM to 9:59 AM | 16 (5.7%) | 10 (5.9%) |
| 10:00 AM to 10:59 AM | 6 (2.1%) | 2 (1.2%) |
| 11:00 AM to 11:59 AM | 0 (0.0%) | 5 (2.9%) |
| 12:00 PM to 3:59 PM | 15 (5.4%) | 3 (1.8%) |
| 4:00 PM to 11:59 PM | 32 (11.4%) | 4 (2.3%) |
| Total | 280 (100.0%) | 171 (100.0%) |
Housing Occupancy in Woodland Hills
Occupancy by Ownership in Woodland Hills
Of the total 355 dwellings in Woodland Hills, owner-occupied units account for 323 (91.0%), while renter-occupied units make up 32 (9.0%).
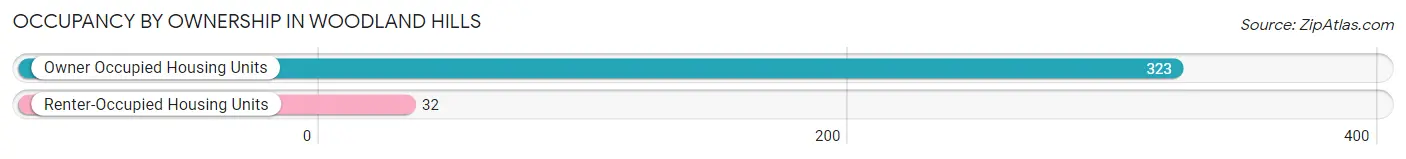
| Occupancy | # Housing Units | % Housing Units |
| Owner Occupied Housing Units | 323 | 91.0% |
| Renter-Occupied Housing Units | 32 | 9.0% |
| Total Occupied Housing Units | 355 | 100.0% |
Occupancy by Household Size in Woodland Hills
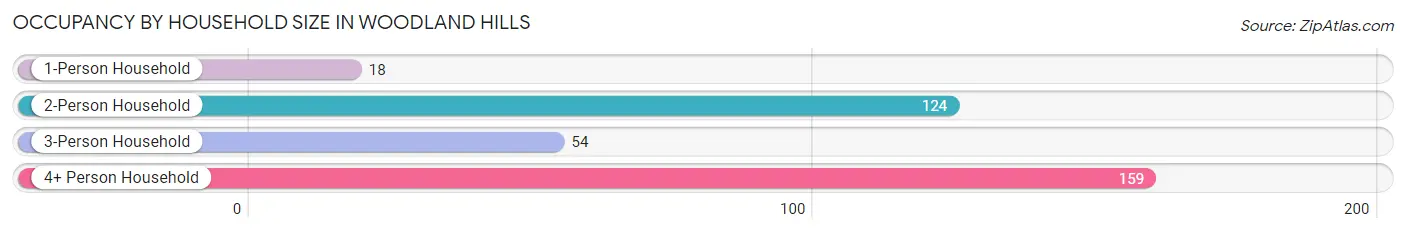
| Household Size | # Housing Units | % Housing Units |
| 1-Person Household | 18 | 5.1% |
| 2-Person Household | 124 | 34.9% |
| 3-Person Household | 54 | 15.2% |
| 4+ Person Household | 159 | 44.8% |
| Total Housing Units | 355 | 100.0% |
Occupancy by Ownership by Household Size in Woodland Hills
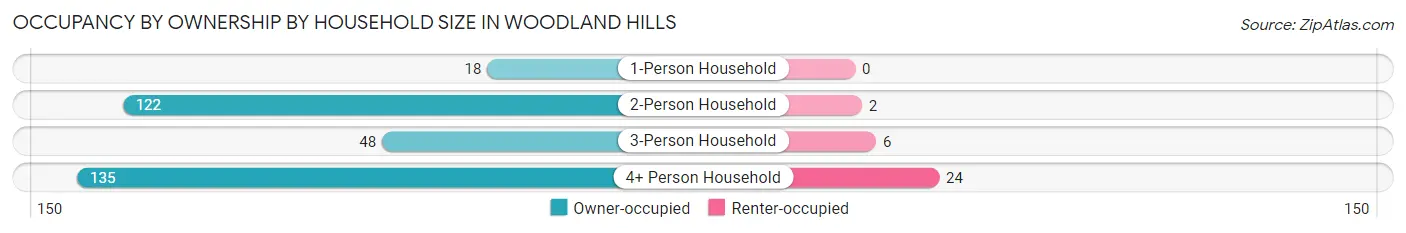
| Household Size | Owner-occupied | Renter-occupied |
| 1-Person Household | 18 (100.0%) | 0 (0.0%) |
| 2-Person Household | 122 (98.4%) | 2 (1.6%) |
| 3-Person Household | 48 (88.9%) | 6 (11.1%) |
| 4+ Person Household | 135 (84.9%) | 24 (15.1%) |
| Total Housing Units | 323 (91.0%) | 32 (9.0%) |
Occupancy by Educational Attainment in Woodland Hills
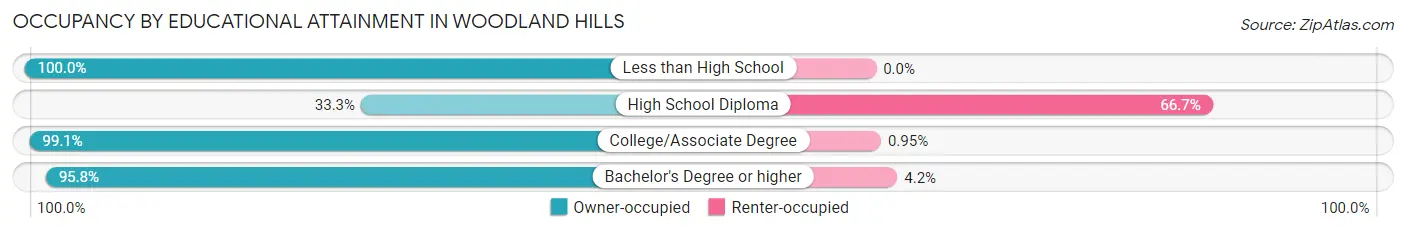
| Household Size | Owner-occupied | Renter-occupied |
| Less than High School | 2 (100.0%) | 0 (0.0%) |
| High School Diploma | 11 (33.3%) | 22 (66.7%) |
| College/Associate Degree | 104 (99.1%) | 1 (0.9%) |
| Bachelor's Degree or higher | 206 (95.8%) | 9 (4.2%) |
Occupancy by Age of Householder in Woodland Hills
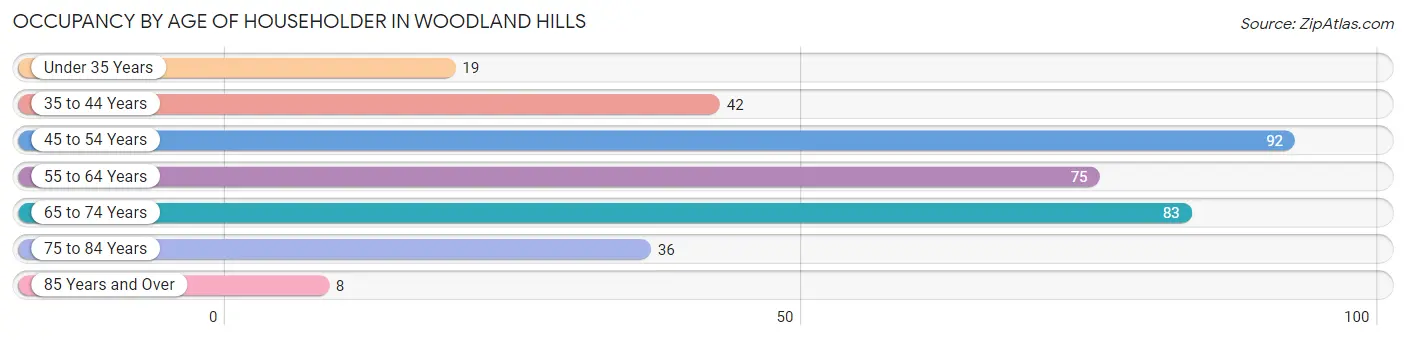
| Age Bracket | # Households | % Households |
| Under 35 Years | 19 | 5.3% |
| 35 to 44 Years | 42 | 11.8% |
| 45 to 54 Years | 92 | 25.9% |
| 55 to 64 Years | 75 | 21.1% |
| 65 to 74 Years | 83 | 23.4% |
| 75 to 84 Years | 36 | 10.1% |
| 85 Years and Over | 8 | 2.2% |
| Total | 355 | 100.0% |
Housing Finances in Woodland Hills
Median Income by Occupancy in Woodland Hills
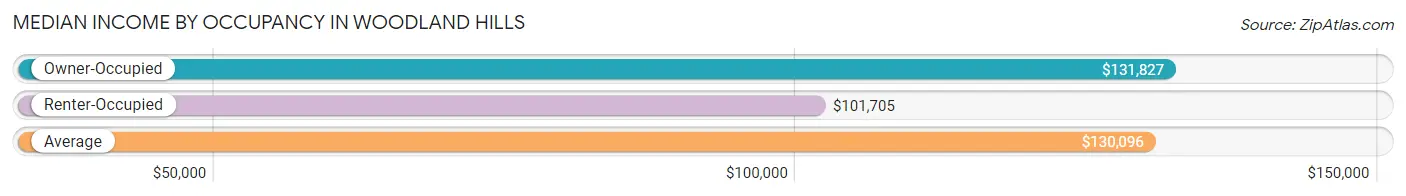
| Occupancy Type | # Households | Median Income |
| Owner-Occupied | 323 (91.0%) | $131,827 |
| Renter-Occupied | 32 (9.0%) | $101,705 |
| Average | 355 (100.0%) | $130,096 |
Occupancy by Householder Income Bracket in Woodland Hills
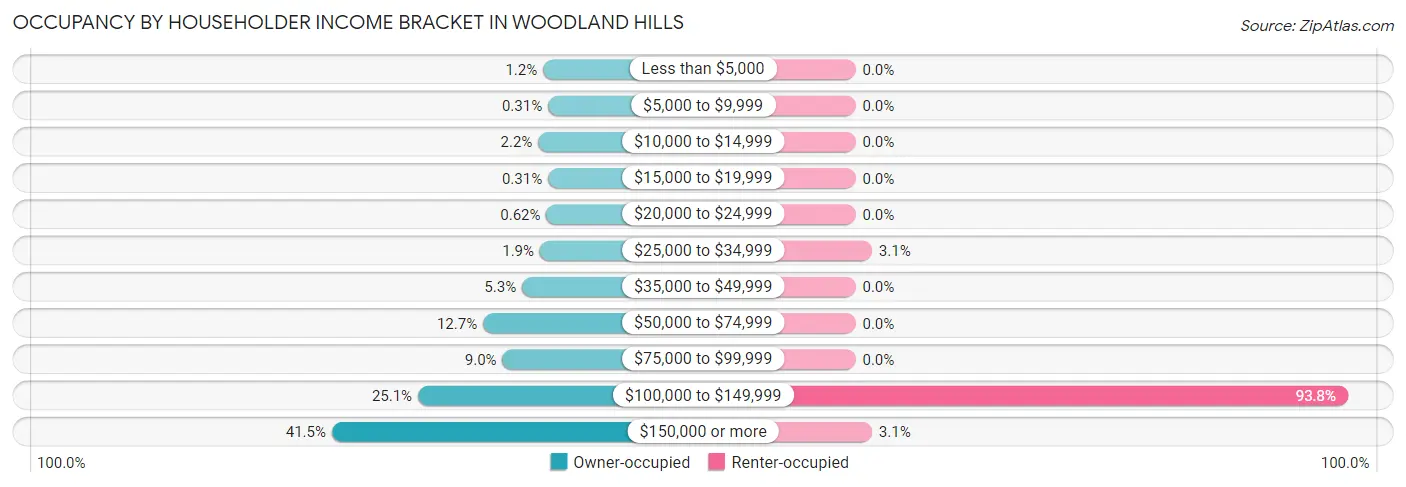
| Income Bracket | Owner-occupied | Renter-occupied |
| Less than $5,000 | 4 (1.2%) | 0 (0.0%) |
| $5,000 to $9,999 | 1 (0.3%) | 0 (0.0%) |
| $10,000 to $14,999 | 7 (2.2%) | 0 (0.0%) |
| $15,000 to $19,999 | 1 (0.3%) | 0 (0.0%) |
| $20,000 to $24,999 | 2 (0.6%) | 0 (0.0%) |
| $25,000 to $34,999 | 6 (1.9%) | 1 (3.1%) |
| $35,000 to $49,999 | 17 (5.3%) | 0 (0.0%) |
| $50,000 to $74,999 | 41 (12.7%) | 0 (0.0%) |
| $75,000 to $99,999 | 29 (9.0%) | 0 (0.0%) |
| $100,000 to $149,999 | 81 (25.1%) | 30 (93.8%) |
| $150,000 or more | 134 (41.5%) | 1 (3.1%) |
| Total | 323 (100.0%) | 32 (100.0%) |
Monthly Housing Cost Tiers in Woodland Hills
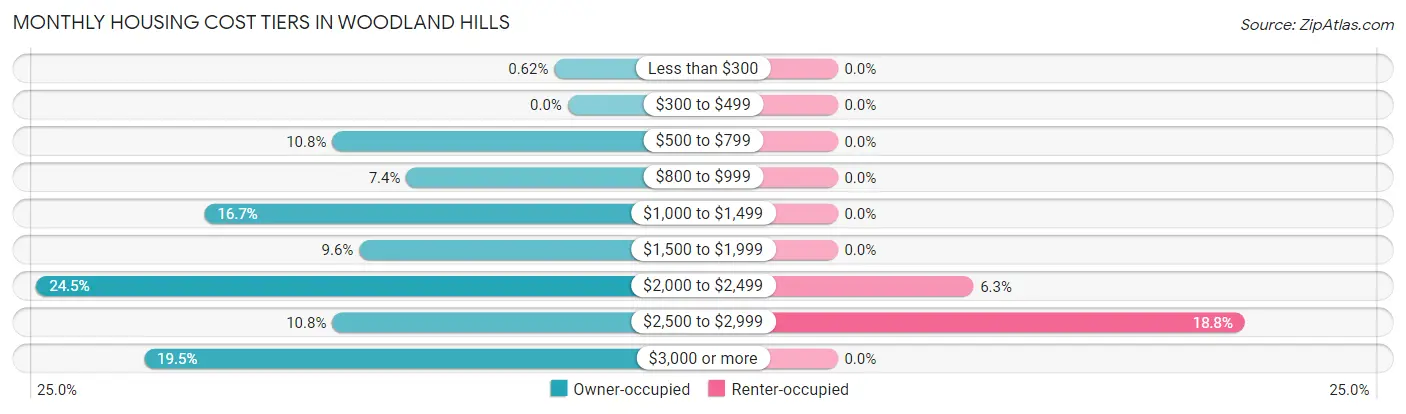
| Monthly Cost | Owner-occupied | Renter-occupied |
| Less than $300 | 2 (0.6%) | 0 (0.0%) |
| $300 to $499 | 0 (0.0%) | 0 (0.0%) |
| $500 to $799 | 35 (10.8%) | 0 (0.0%) |
| $800 to $999 | 24 (7.4%) | 0 (0.0%) |
| $1,000 to $1,499 | 54 (16.7%) | 0 (0.0%) |
| $1,500 to $1,999 | 31 (9.6%) | 0 (0.0%) |
| $2,000 to $2,499 | 79 (24.5%) | 2 (6.2%) |
| $2,500 to $2,999 | 35 (10.8%) | 6 (18.8%) |
| $3,000 or more | 63 (19.5%) | 0 (0.0%) |
| Total | 323 (100.0%) | 32 (100.0%) |
Physical Housing Characteristics in Woodland Hills
Housing Structures in Woodland Hills
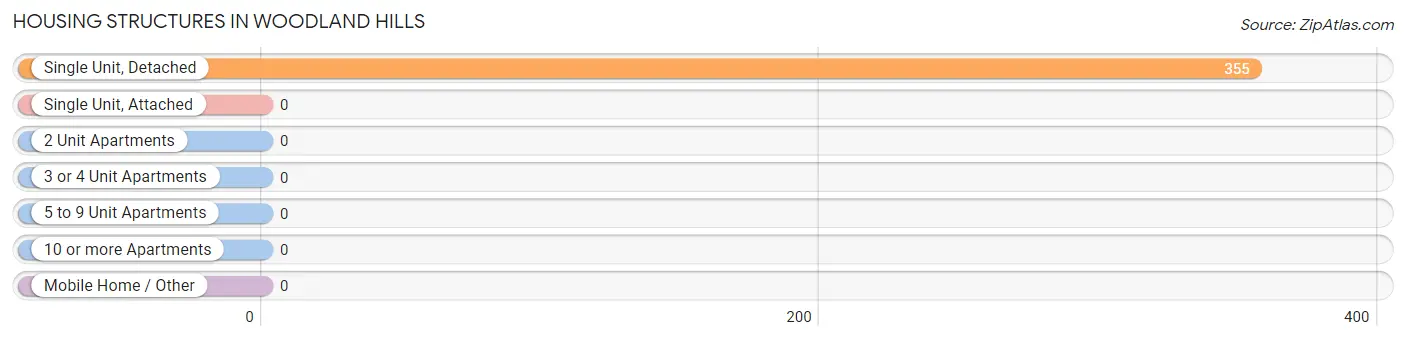
| Structure Type | # Housing Units | % Housing Units |
| Single Unit, Detached | 355 | 100.0% |
| Single Unit, Attached | 0 | 0.0% |
| 2 Unit Apartments | 0 | 0.0% |
| 3 or 4 Unit Apartments | 0 | 0.0% |
| 5 to 9 Unit Apartments | 0 | 0.0% |
| 10 or more Apartments | 0 | 0.0% |
| Mobile Home / Other | 0 | 0.0% |
| Total | 355 | 100.0% |
Housing Structures by Occupancy in Woodland Hills
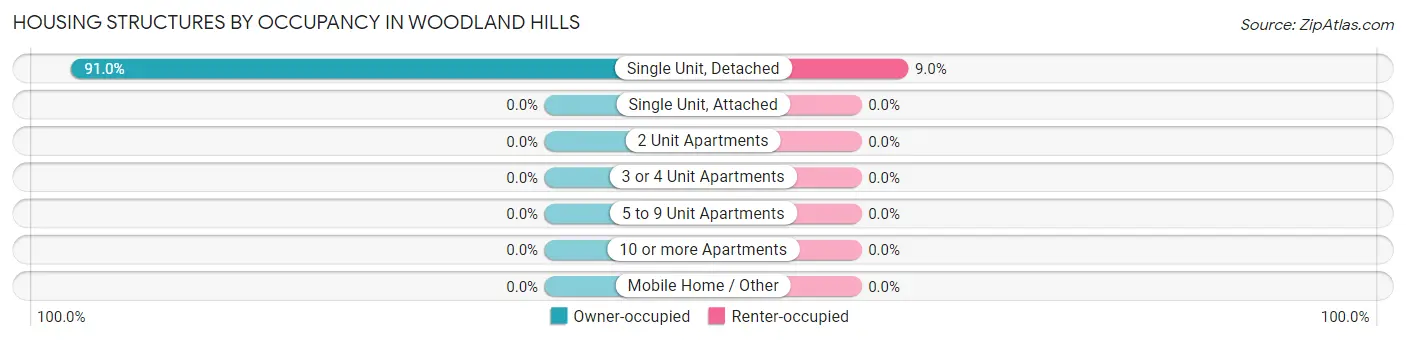
| Structure Type | Owner-occupied | Renter-occupied |
| Single Unit, Detached | 323 (91.0%) | 32 (9.0%) |
| Single Unit, Attached | 0 (0.0%) | 0 (0.0%) |
| 2 Unit Apartments | 0 (0.0%) | 0 (0.0%) |
| 3 or 4 Unit Apartments | 0 (0.0%) | 0 (0.0%) |
| 5 to 9 Unit Apartments | 0 (0.0%) | 0 (0.0%) |
| 10 or more Apartments | 0 (0.0%) | 0 (0.0%) |
| Mobile Home / Other | 0 (0.0%) | 0 (0.0%) |
| Total | 323 (91.0%) | 32 (9.0%) |
Housing Structures by Number of Rooms in Woodland Hills
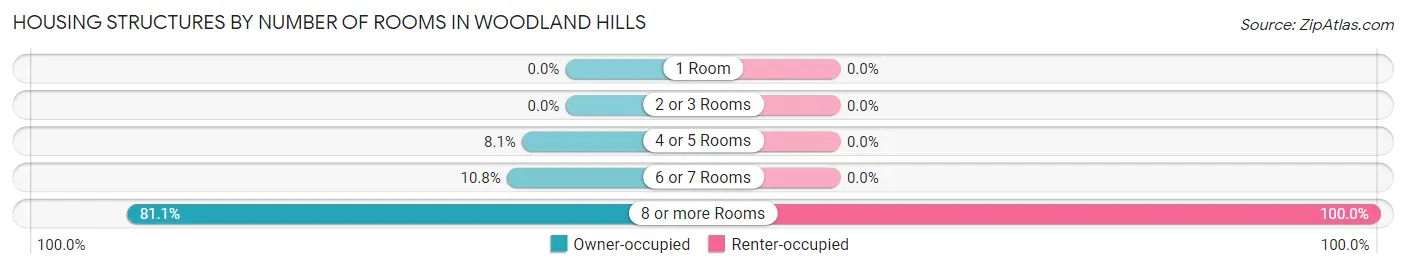
| Number of Rooms | Owner-occupied | Renter-occupied |
| 1 Room | 0 (0.0%) | 0 (0.0%) |
| 2 or 3 Rooms | 0 (0.0%) | 0 (0.0%) |
| 4 or 5 Rooms | 26 (8.1%) | 0 (0.0%) |
| 6 or 7 Rooms | 35 (10.8%) | 0 (0.0%) |
| 8 or more Rooms | 262 (81.1%) | 32 (100.0%) |
| Total | 323 (100.0%) | 32 (100.0%) |
Housing Structure by Heating Type in Woodland Hills
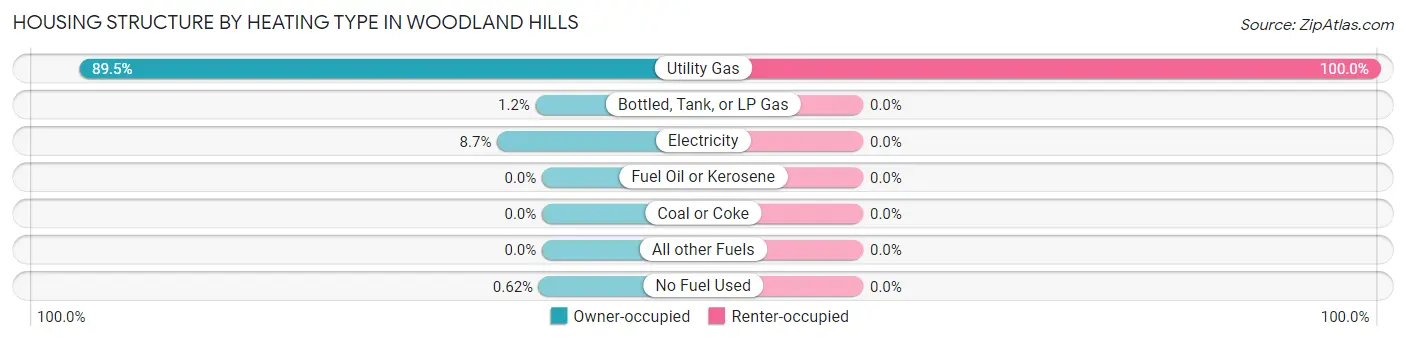
| Heating Type | Owner-occupied | Renter-occupied |
| Utility Gas | 289 (89.5%) | 32 (100.0%) |
| Bottled, Tank, or LP Gas | 4 (1.2%) | 0 (0.0%) |
| Electricity | 28 (8.7%) | 0 (0.0%) |
| Fuel Oil or Kerosene | 0 (0.0%) | 0 (0.0%) |
| Coal or Coke | 0 (0.0%) | 0 (0.0%) |
| All other Fuels | 0 (0.0%) | 0 (0.0%) |
| No Fuel Used | 2 (0.6%) | 0 (0.0%) |
| Total | 323 (100.0%) | 32 (100.0%) |
Household Vehicle Usage in Woodland Hills
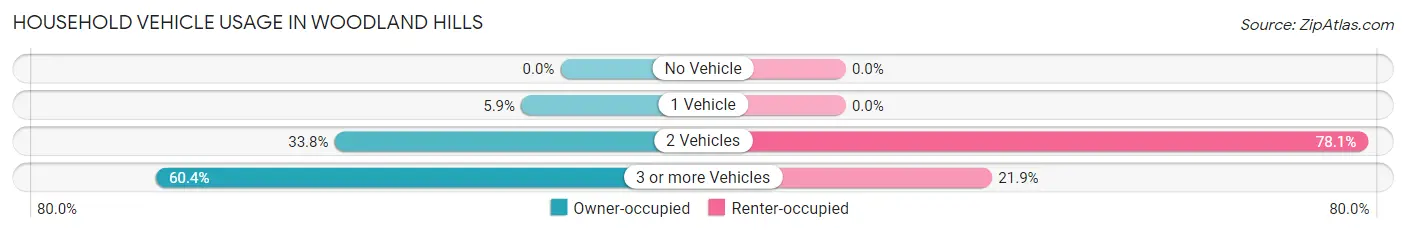
| Vehicles per Household | Owner-occupied | Renter-occupied |
| No Vehicle | 0 (0.0%) | 0 (0.0%) |
| 1 Vehicle | 19 (5.9%) | 0 (0.0%) |
| 2 Vehicles | 109 (33.8%) | 25 (78.1%) |
| 3 or more Vehicles | 195 (60.4%) | 7 (21.9%) |
| Total | 323 (100.0%) | 32 (100.0%) |
Real Estate & Mortgages in Woodland Hills
Real Estate and Mortgage Overview in Woodland Hills
| Characteristic | Without Mortgage | With Mortgage |
| Housing Units | 108 | 215 |
| Median Property Value | $718,800 | $717,000 |
| Median Household Income | $153,333 | $78 |
| Monthly Housing Costs | $894 | $63 |
| Real Estate Taxes | $4,711 | $0 |
Property Value by Mortgage Status in Woodland Hills
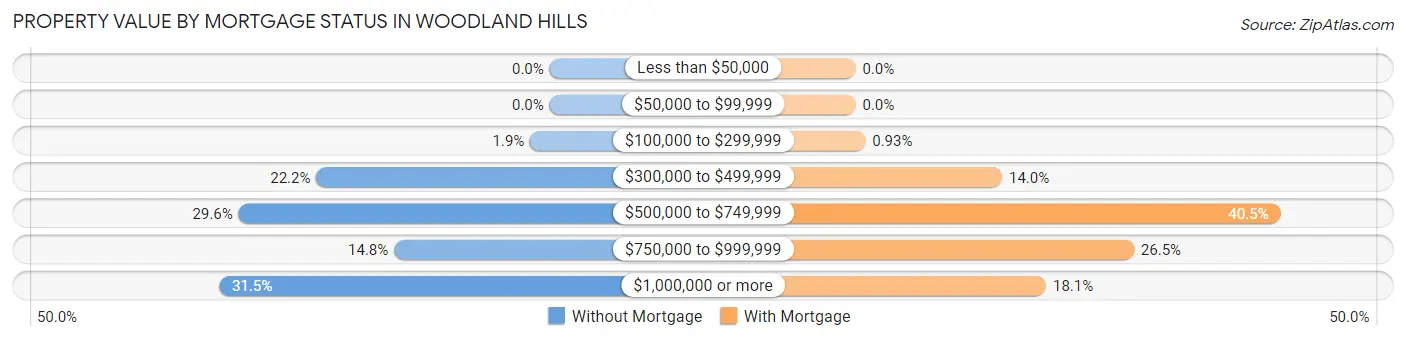
| Property Value | Without Mortgage | With Mortgage |
| Less than $50,000 | 0 (0.0%) | 0 (0.0%) |
| $50,000 to $99,999 | 0 (0.0%) | 0 (0.0%) |
| $100,000 to $299,999 | 2 (1.8%) | 2 (0.9%) |
| $300,000 to $499,999 | 24 (22.2%) | 30 (14.0%) |
| $500,000 to $749,999 | 32 (29.6%) | 87 (40.5%) |
| $750,000 to $999,999 | 16 (14.8%) | 57 (26.5%) |
| $1,000,000 or more | 34 (31.5%) | 39 (18.1%) |
| Total | 108 (100.0%) | 215 (100.0%) |
Household Income by Mortgage Status in Woodland Hills
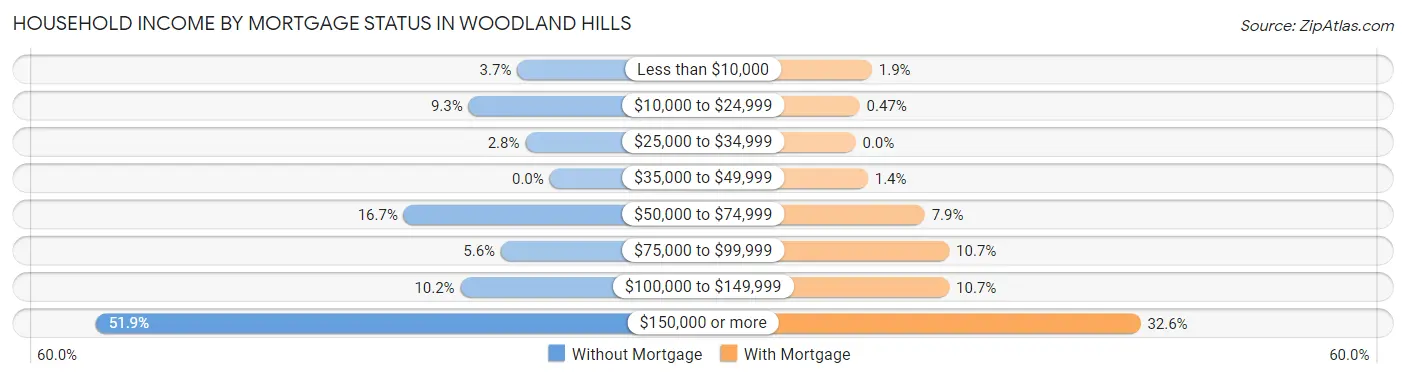
| Household Income | Without Mortgage | With Mortgage |
| Less than $10,000 | 4 (3.7%) | 4 (1.9%) |
| $10,000 to $24,999 | 10 (9.3%) | 1 (0.5%) |
| $25,000 to $34,999 | 3 (2.8%) | 0 (0.0%) |
| $35,000 to $49,999 | 0 (0.0%) | 3 (1.4%) |
| $50,000 to $74,999 | 18 (16.7%) | 17 (7.9%) |
| $75,000 to $99,999 | 6 (5.6%) | 23 (10.7%) |
| $100,000 to $149,999 | 11 (10.2%) | 23 (10.7%) |
| $150,000 or more | 56 (51.8%) | 70 (32.6%) |
| Total | 108 (100.0%) | 215 (100.0%) |
Property Value to Household Income Ratio in Woodland Hills
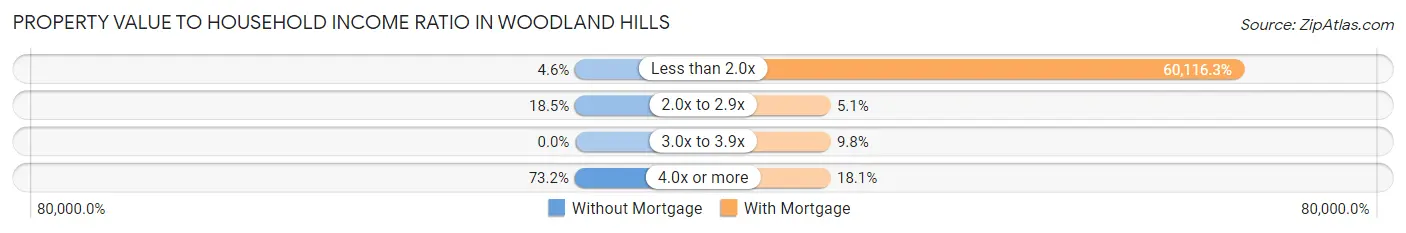
| Value-to-Income Ratio | Without Mortgage | With Mortgage |
| Less than 2.0x | 5 (4.6%) | 129,250 (60,116.3%) |
| 2.0x to 2.9x | 20 (18.5%) | 11 (5.1%) |
| 3.0x to 3.9x | 0 (0.0%) | 21 (9.8%) |
| 4.0x or more | 79 (73.2%) | 39 (18.1%) |
| Total | 108 (100.0%) | 215 (100.0%) |
Real Estate Taxes by Mortgage Status in Woodland Hills
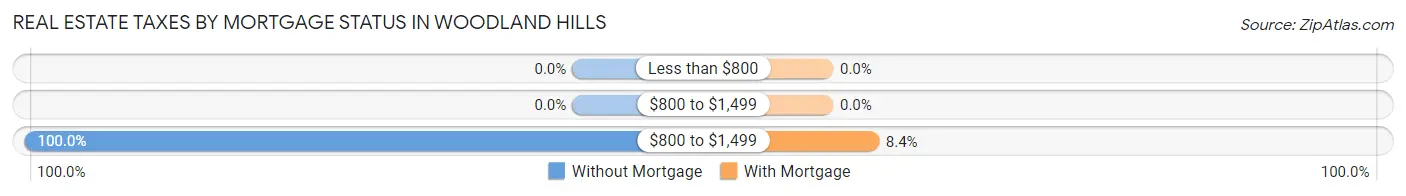
| Property Taxes | Without Mortgage | With Mortgage |
| Less than $800 | 0 (0.0%) | 0 (0.0%) |
| $800 to $1,499 | 0 (0.0%) | 0 (0.0%) |
| $800 to $1,499 | 108 (100.0%) | 18 (8.4%) |
| Total | 108 (100.0%) | 215 (100.0%) |
Health & Disability in Woodland Hills
Health Insurance Coverage by Age in Woodland Hills
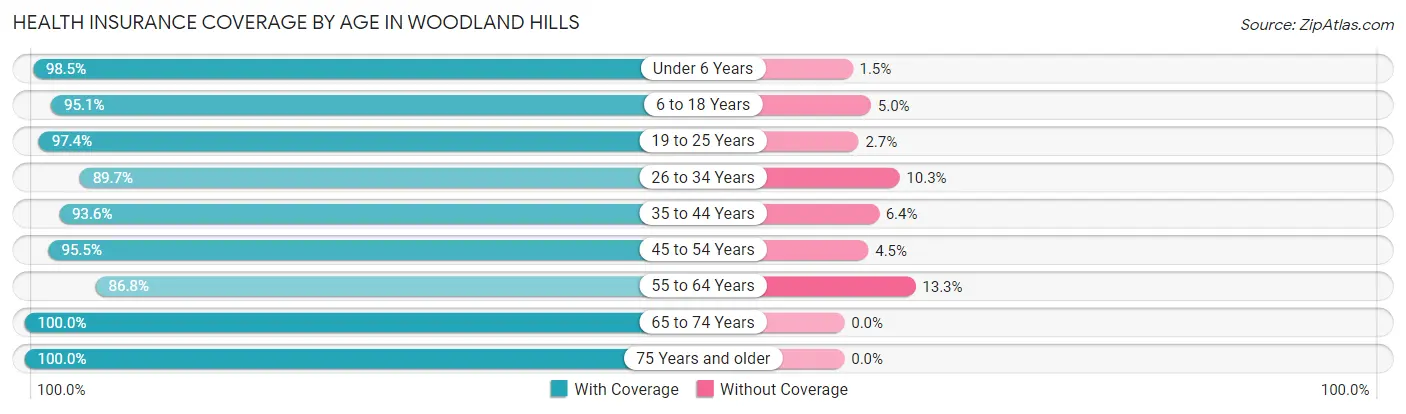
| Age Bracket | With Coverage | Without Coverage |
| Under 6 Years | 129 (98.5%) | 2 (1.5%) |
| 6 to 18 Years | 269 (95.1%) | 14 (5.0%) |
| 19 to 25 Years | 110 (97.4%) | 3 (2.6%) |
| 26 to 34 Years | 96 (89.7%) | 11 (10.3%) |
| 35 to 44 Years | 102 (93.6%) | 7 (6.4%) |
| 45 to 54 Years | 171 (95.5%) | 8 (4.5%) |
| 55 to 64 Years | 131 (86.8%) | 20 (13.3%) |
| 65 to 74 Years | 165 (100.0%) | 0 (0.0%) |
| 75 Years and older | 91 (100.0%) | 0 (0.0%) |
| Total | 1,264 (95.1%) | 65 (4.9%) |
Health Insurance Coverage by Citizenship Status in Woodland Hills
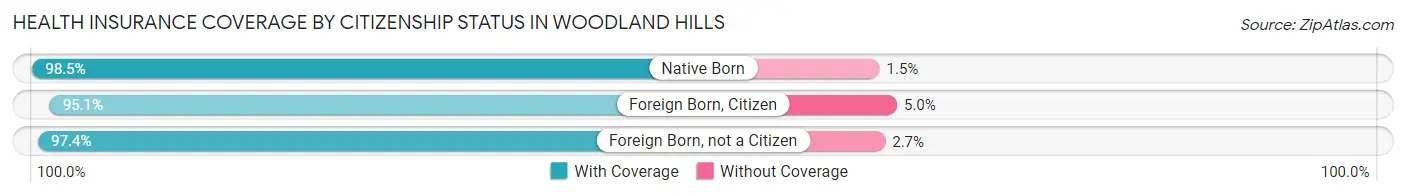
| Citizenship Status | With Coverage | Without Coverage |
| Native Born | 129 (98.5%) | 2 (1.5%) |
| Foreign Born, Citizen | 269 (95.1%) | 14 (5.0%) |
| Foreign Born, not a Citizen | 110 (97.4%) | 3 (2.6%) |
Health Insurance Coverage by Household Income in Woodland Hills
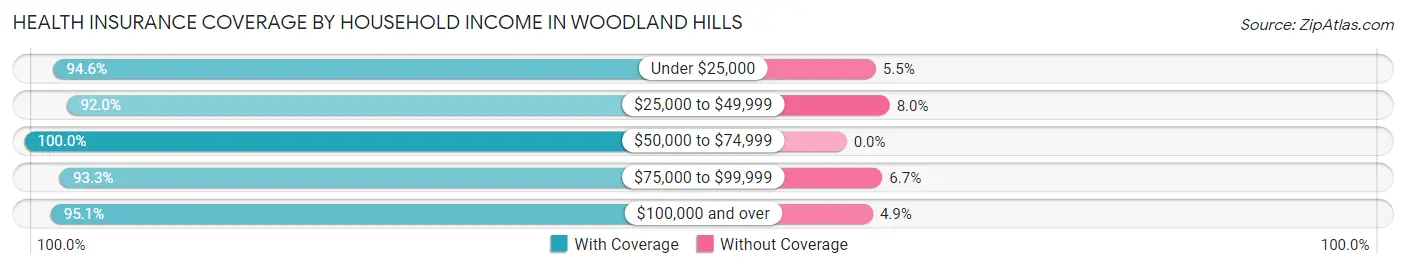
| Household Income | With Coverage | Without Coverage |
| Under $25,000 | 52 (94.6%) | 3 (5.4%) |
| $25,000 to $49,999 | 103 (92.0%) | 9 (8.0%) |
| $50,000 to $74,999 | 114 (100.0%) | 0 (0.0%) |
| $75,000 to $99,999 | 84 (93.3%) | 6 (6.7%) |
| $100,000 and over | 911 (95.1%) | 47 (4.9%) |
Public vs Private Health Insurance Coverage by Age in Woodland Hills
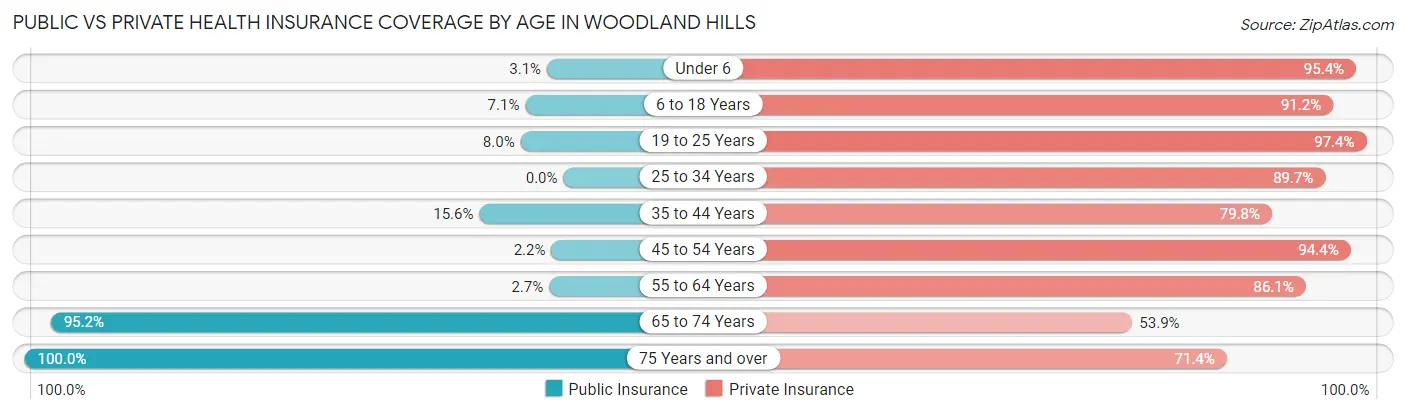
| Age Bracket | Public Insurance | Private Insurance |
| Under 6 | 4 (3.0%) | 125 (95.4%) |
| 6 to 18 Years | 20 (7.1%) | 258 (91.2%) |
| 19 to 25 Years | 9 (8.0%) | 110 (97.4%) |
| 25 to 34 Years | 0 (0.0%) | 96 (89.7%) |
| 35 to 44 Years | 17 (15.6%) | 87 (79.8%) |
| 45 to 54 Years | 4 (2.2%) | 169 (94.4%) |
| 55 to 64 Years | 4 (2.6%) | 130 (86.1%) |
| 65 to 74 Years | 157 (95.2%) | 89 (53.9%) |
| 75 Years and over | 91 (100.0%) | 65 (71.4%) |
| Total | 306 (23.0%) | 1,129 (85.0%) |
Disability Status by Sex by Age in Woodland Hills
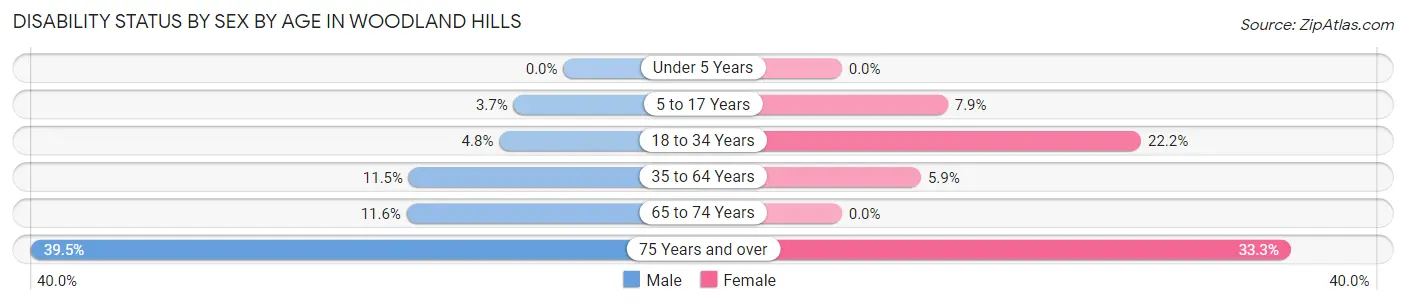
| Age Bracket | Male | Female |
| Under 5 Years | 0 (0.0%) | 0 (0.0%) |
| 5 to 17 Years | 6 (3.7%) | 10 (7.9%) |
| 18 to 34 Years | 7 (4.8%) | 28 (22.2%) |
| 35 to 64 Years | 25 (11.5%) | 13 (5.9%) |
| 65 to 74 Years | 10 (11.6%) | 0 (0.0%) |
| 75 Years and over | 17 (39.5%) | 16 (33.3%) |
Disability Class by Sex by Age in Woodland Hills
Disability Class: Hearing Difficulty
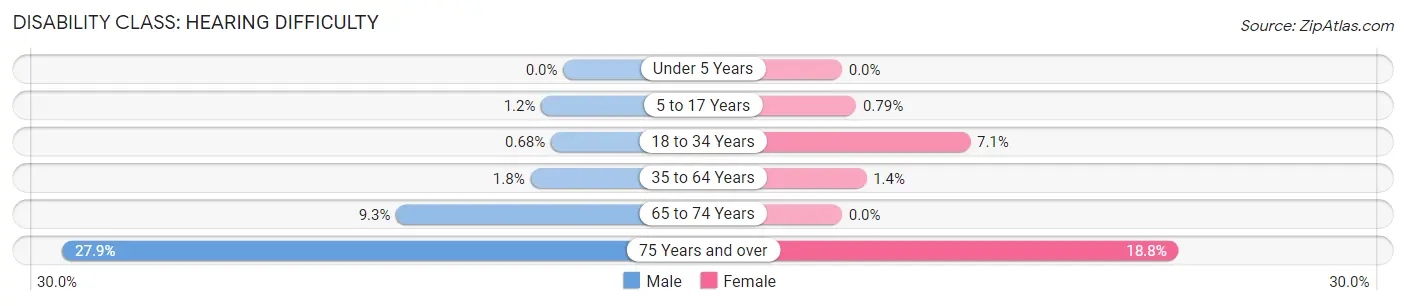
| Age Bracket | Male | Female |
| Under 5 Years | 0 (0.0%) | 0 (0.0%) |
| 5 to 17 Years | 2 (1.2%) | 1 (0.8%) |
| 18 to 34 Years | 1 (0.7%) | 9 (7.1%) |
| 35 to 64 Years | 4 (1.8%) | 3 (1.4%) |
| 65 to 74 Years | 8 (9.3%) | 0 (0.0%) |
| 75 Years and over | 12 (27.9%) | 9 (18.8%) |
Disability Class: Vision Difficulty
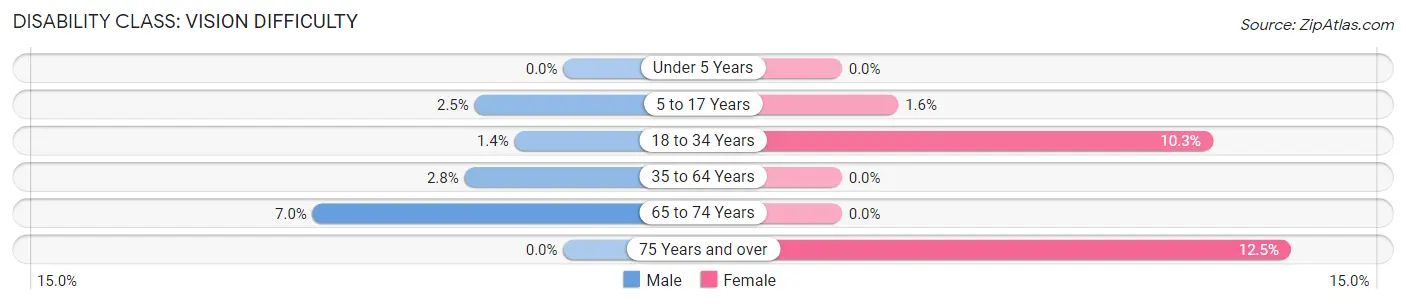
| Age Bracket | Male | Female |
| Under 5 Years | 0 (0.0%) | 0 (0.0%) |
| 5 to 17 Years | 4 (2.5%) | 2 (1.6%) |
| 18 to 34 Years | 2 (1.4%) | 13 (10.3%) |
| 35 to 64 Years | 6 (2.8%) | 0 (0.0%) |
| 65 to 74 Years | 6 (7.0%) | 0 (0.0%) |
| 75 Years and over | 0 (0.0%) | 6 (12.5%) |
Disability Class: Cognitive Difficulty
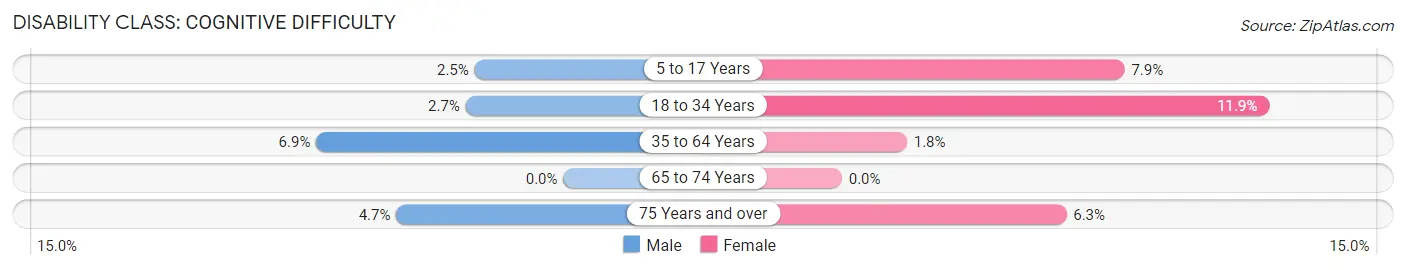
| Age Bracket | Male | Female |
| 5 to 17 Years | 4 (2.5%) | 10 (7.9%) |
| 18 to 34 Years | 4 (2.7%) | 15 (11.9%) |
| 35 to 64 Years | 15 (6.9%) | 4 (1.8%) |
| 65 to 74 Years | 0 (0.0%) | 0 (0.0%) |
| 75 Years and over | 2 (4.6%) | 3 (6.2%) |
Disability Class: Ambulatory Difficulty
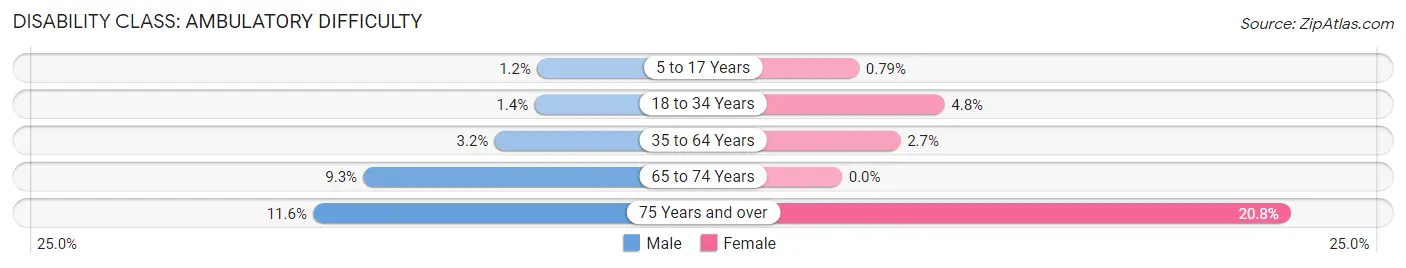
| Age Bracket | Male | Female |
| 5 to 17 Years | 2 (1.2%) | 1 (0.8%) |
| 18 to 34 Years | 2 (1.4%) | 6 (4.8%) |
| 35 to 64 Years | 7 (3.2%) | 6 (2.7%) |
| 65 to 74 Years | 8 (9.3%) | 0 (0.0%) |
| 75 Years and over | 5 (11.6%) | 10 (20.8%) |
Disability Class: Self-Care Difficulty
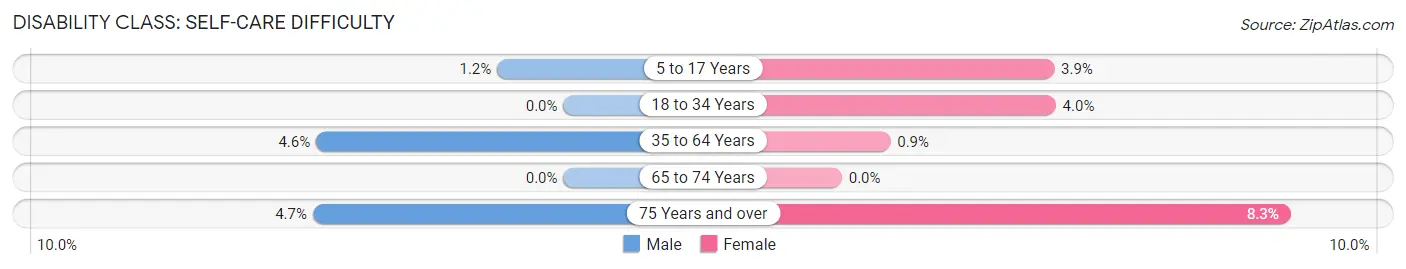
| Age Bracket | Male | Female |
| 5 to 17 Years | 2 (1.2%) | 5 (3.9%) |
| 18 to 34 Years | 0 (0.0%) | 5 (4.0%) |
| 35 to 64 Years | 10 (4.6%) | 2 (0.9%) |
| 65 to 74 Years | 0 (0.0%) | 0 (0.0%) |
| 75 Years and over | 2 (4.6%) | 4 (8.3%) |
Technology Access in Woodland Hills
Computing Device Access in Woodland Hills
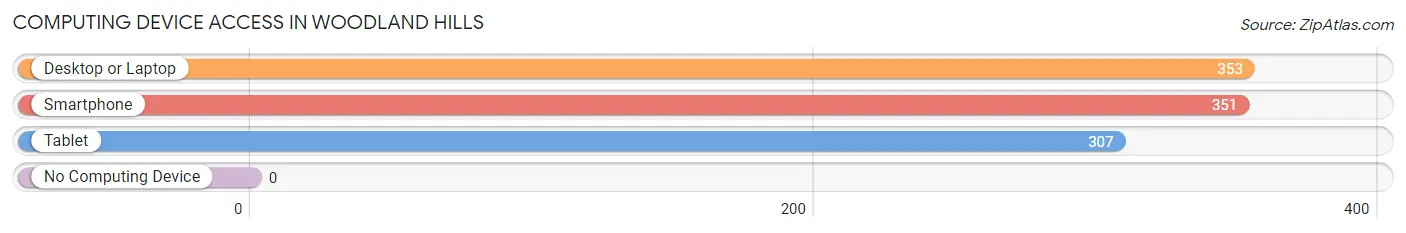
| Device Type | # Households | % Households |
| Desktop or Laptop | 353 | 99.4% |
| Smartphone | 351 | 98.9% |
| Tablet | 307 | 86.5% |
| No Computing Device | 0 | 0.0% |
| Total | 355 | 100.0% |
Internet Access in Woodland Hills
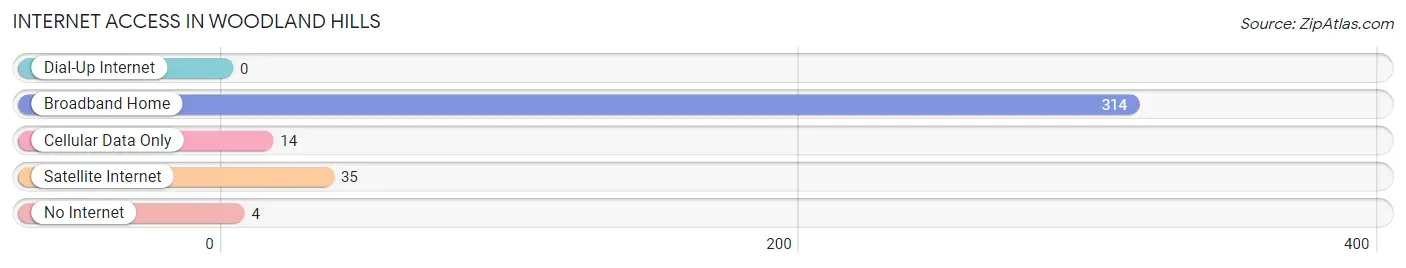
| Internet Type | # Households | % Households |
| Dial-Up Internet | 0 | 0.0% |
| Broadband Home | 314 | 88.4% |
| Cellular Data Only | 14 | 3.9% |
| Satellite Internet | 35 | 9.9% |
| No Internet | 4 | 1.1% |
| Total | 355 | 100.0% |
Woodland Hills Summary
Woodland Hills is a small city located in the southwestern corner of Utah, in the United States. It is situated in the foothills of the Wasatch Mountains, and is part of the Salt Lake City metropolitan area. The city has a population of approximately 8,000 people, and is known for its rural atmosphere and scenic beauty.
Geography
Woodland Hills is located in the southwestern corner of Utah, in the United States. It is situated in the foothills of the Wasatch Mountains, and is part of the Salt Lake City metropolitan area. The city is located at an elevation of 4,890 feet (1,490 m) above sea level. The city is bordered by the cities of West Valley City and Taylorsville to the north, South Jordan to the east, and Herriman to the south. The city covers an area of approximately 4.5 square miles (11.7 km2).
Climate
Woodland Hills has a semi-arid climate, with hot summers and cold winters. The average annual temperature is 48.3 °F (9.1 °C). The average high temperature in July is 90.2 °F (32.3 °C), and the average low temperature in January is 17.7 °F (-7.9 °C). The average annual precipitation is 17.2 inches (437 mm).
Demographics
As of the 2010 census, Woodland Hills had a population of 8,000 people. The racial makeup of the city was 87.2% White, 4.2% Hispanic or Latino, 2.2% Asian, 1.2% African American, 0.7% Native American, and 0.3% Pacific Islander. The median household income was $60,945, and the median family income was $68,958.
Economy
Woodland Hills is primarily a residential community, and the majority of its residents are employed in the nearby cities of Salt Lake City and West Valley City. The city is home to several small businesses, including a grocery store, a hardware store, and a few restaurants. The city also has a few light industrial businesses, such as a printing company and a metal fabrication shop.
Education
Woodland Hills is served by the Granite School District. The city is home to two elementary schools, one middle school, and one high school. The city also has a branch of the Salt Lake Community College.
Conclusion
Woodland Hills is a small city located in the southwestern corner of Utah, in the United States. It is situated in the foothills of the Wasatch Mountains, and is part of the Salt Lake City metropolitan area. The city has a population of approximately 8,000 people, and is known for its rural atmosphere and scenic beauty. The city has a semi-arid climate, with hot summers and cold winters. The majority of its residents are employed in the nearby cities of Salt Lake City and West Valley City. The city is served by the Granite School District, and is home to two elementary schools, one middle school, and one high school.
Common Questions
What is the Total Population of Woodland Hills?
Total Population of Woodland Hills is 1,329.
What is the Total Male Population of Woodland Hills?
Total Male Population of Woodland Hills is 692.
What is the Total Female Population of Woodland Hills?
Total Female Population of Woodland Hills is 637.
What is the Ratio of Males per 100 Females in Woodland Hills?
There are 108.63 Males per 100 Females in Woodland Hills.
What is the Ratio of Females per 100 Males in Woodland Hills?
There are 92.05 Females per 100 Males in Woodland Hills.
What is the Median Population Age in Woodland Hills?
Median Population Age in Woodland Hills is 38.7 Years.
What is the Average Family Size in Woodland Hills
Average Family Size in Woodland Hills is 3.9 People.
What is the Average Household Size in Woodland Hills
Average Household Size in Woodland Hills is 3.7 People.
What is Per Capita Income in Woodland Hills?
Per Capita income in Woodland Hills is $44,065.
What is the Median Family Income in Woodland Hills?
Median Family Income in Woodland Hills is $131,528.
What is the Median Household income in Woodland Hills?
Median Household Income in Woodland Hills is $130,096.
What is Income or Wage Gap in Woodland Hills?
Income or Wage Gap in Woodland Hills is 52.2%.
Women in Woodland Hills earn 47.8 cents for every dollar earned by a man.
What is Inequality or Gini Index in Woodland Hills?
Inequality or Gini Index in Woodland Hills is 0.39.
How Large is the Labor Force in Woodland Hills?
There are 610 People in the Labor Forcein in Woodland Hills.
What is the Percentage of People in the Labor Force in Woodland Hills?
60.4% of People are in the Labor Force in Woodland Hills.
What is the Unemployment Rate in Woodland Hills?
Unemployment Rate in Woodland Hills is 2.3%.