Elwood, UT
Elwood Map
Elwood Overview
1,598
TOTAL POPULATION
764
MALE POPULATION
834
FEMALE POPULATION
91.61
MALES / 100 FEMALES
109.16
FEMALES / 100 MALES
37.1
MEDIAN AGE
3.9
AVG FAMILY SIZE
3.6
AVG HOUSEHOLD SIZE
$35,280
PER CAPITA INCOME
$101,125
AVG FAMILY INCOME
$98,309
AVG HOUSEHOLD INCOME
56.3%
WAGE / INCOME GAP [ % ]
43.7¢/ $1
WAGE / INCOME GAP [ $ ]
0.35
INEQUALITY / GINI INDEX
894
LABOR FORCE [ PEOPLE ]
71.9%
PERCENT IN LABOR FORCE
5.8%
UNEMPLOYMENT RATE
Elwood Area Codes
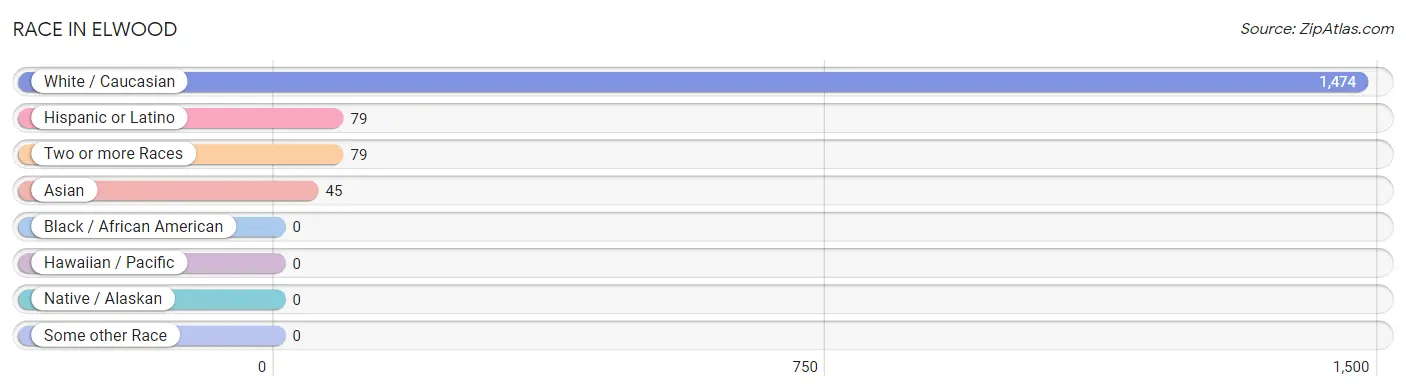
Race in Elwood
The most populous races in Elwood are White / Caucasian (1,474 | 92.2%), Hispanic or Latino (79 | 4.9%), and Two or more Races (79 | 4.9%).
| Race | # Population | % Population |
| Asian | 45 | 2.8% |
| Black / African American | 0 | 0.0% |
| Hawaiian / Pacific | 0 | 0.0% |
| Hispanic or Latino | 79 | 4.9% |
| Native / Alaskan | 0 | 0.0% |
| White / Caucasian | 1,474 | 92.2% |
| Two or more Races | 79 | 4.9% |
| Some other Race | 0 | 0.0% |
| Total | 1,598 | 100.0% |
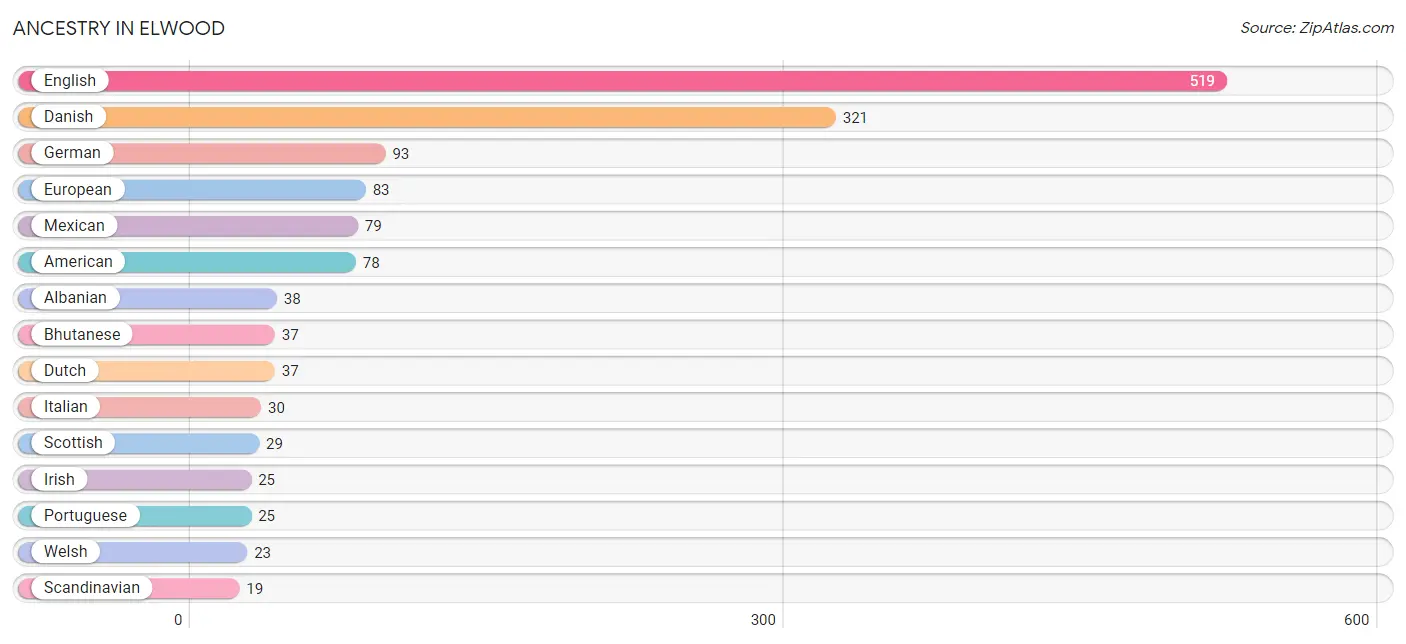
Ancestry in Elwood
The most populous ancestries reported in Elwood are English (519 | 32.5%), Danish (321 | 20.1%), German (93 | 5.8%), European (83 | 5.2%), and Mexican (79 | 4.9%), together accounting for 68.5% of all Elwood residents.
| Ancestry | # Population | % Population |
| Albanian | 38 | 2.4% |
| American | 78 | 4.9% |
| Bhutanese | 37 | 2.3% |
| British | 3 | 0.2% |
| Canadian | 5 | 0.3% |
| Czech | 4 | 0.3% |
| Danish | 321 | 20.1% |
| Dutch | 37 | 2.3% |
| English | 519 | 32.5% |
| European | 83 | 5.2% |
| French | 2 | 0.1% |
| German | 93 | 5.8% |
| Irish | 25 | 1.6% |
| Italian | 30 | 1.9% |
| Korean | 8 | 0.5% |
| Lithuanian | 3 | 0.2% |
| Mexican | 79 | 4.9% |
| Northern European | 5 | 0.3% |
| Norwegian | 7 | 0.4% |
| Polish | 2 | 0.1% |
| Portuguese | 25 | 1.6% |
| Scandinavian | 19 | 1.2% |
| Scotch-Irish | 6 | 0.4% |
| Scottish | 29 | 1.8% |
| Swedish | 15 | 0.9% |
| Swiss | 10 | 0.6% |
| Welsh | 23 | 1.4% | View All 27 Rows |
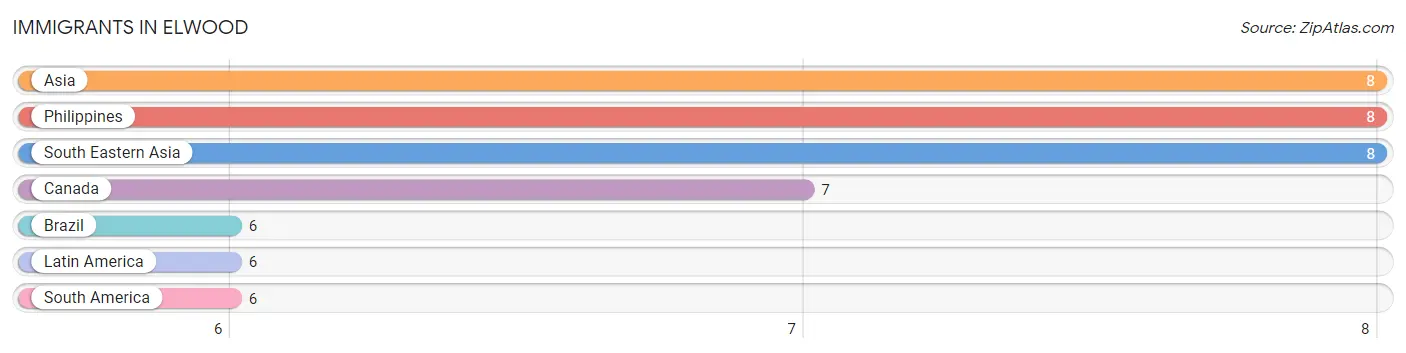
Immigrants in Elwood
The most numerous immigrant groups reported in Elwood came from Asia (8 | 0.5%), Philippines (8 | 0.5%), South Eastern Asia (8 | 0.5%), Canada (7 | 0.4%), and Brazil (6 | 0.4%), together accounting for 2.3% of all Elwood residents.
| Immigration Origin | # Population | % Population |
| Asia | 8 | 0.5% |
| Brazil | 6 | 0.4% |
| Canada | 7 | 0.4% |
| Latin America | 6 | 0.4% |
| Philippines | 8 | 0.5% |
| South America | 6 | 0.4% |
| South Eastern Asia | 8 | 0.5% | View All 7 Rows |
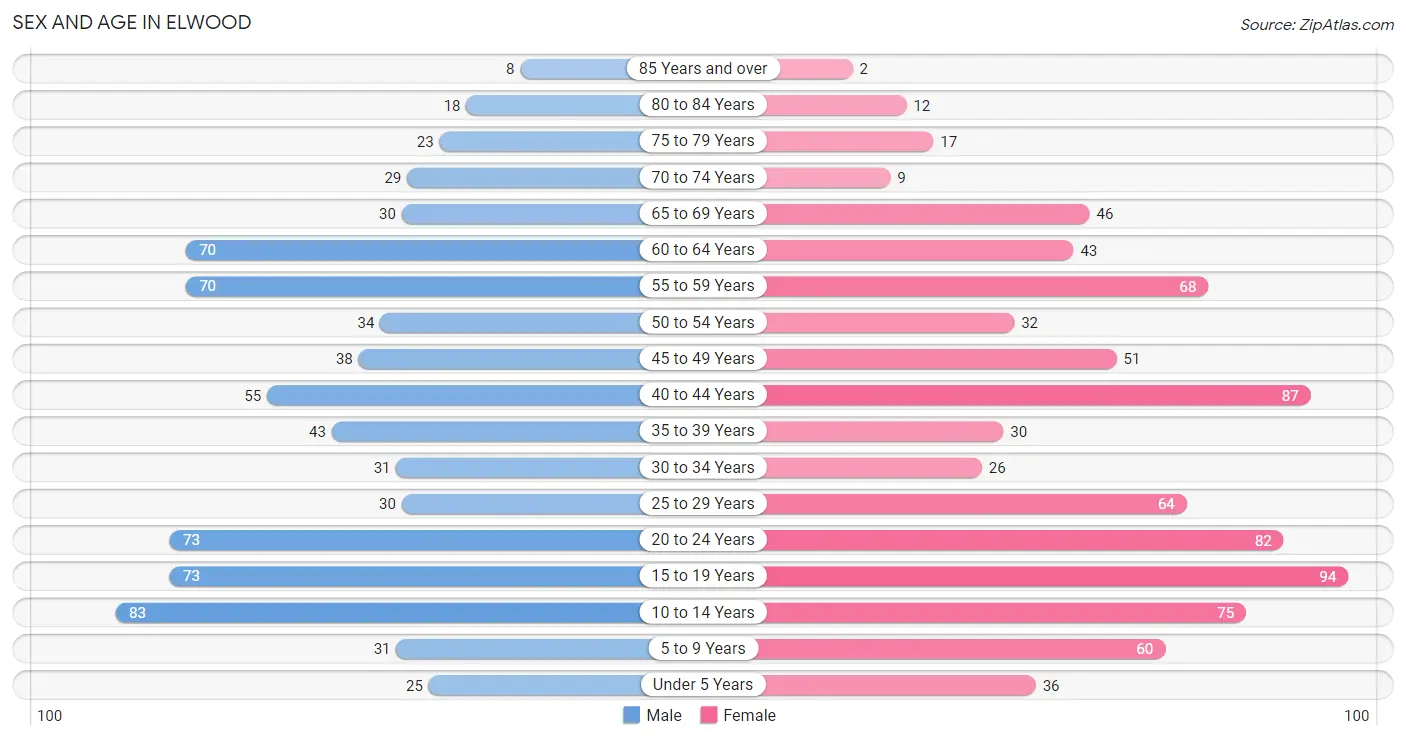
Sex and Age in Elwood
Sex and Age in Elwood
The most populous age groups in Elwood are 10 to 14 Years (83 | 10.9%) for men and 15 to 19 Years (94 | 11.3%) for women.
| Age Bracket | Male | Female |
| Under 5 Years | 25 (3.3%) | 36 (4.3%) |
| 5 to 9 Years | 31 (4.1%) | 60 (7.2%) |
| 10 to 14 Years | 83 (10.9%) | 75 (9.0%) |
| 15 to 19 Years | 73 (9.6%) | 94 (11.3%) |
| 20 to 24 Years | 73 (9.6%) | 82 (9.8%) |
| 25 to 29 Years | 30 (3.9%) | 64 (7.7%) |
| 30 to 34 Years | 31 (4.1%) | 26 (3.1%) |
| 35 to 39 Years | 43 (5.6%) | 30 (3.6%) |
| 40 to 44 Years | 55 (7.2%) | 87 (10.4%) |
| 45 to 49 Years | 38 (5.0%) | 51 (6.1%) |
| 50 to 54 Years | 34 (4.4%) | 32 (3.8%) |
| 55 to 59 Years | 70 (9.2%) | 68 (8.2%) |
| 60 to 64 Years | 70 (9.2%) | 43 (5.2%) |
| 65 to 69 Years | 30 (3.9%) | 46 (5.5%) |
| 70 to 74 Years | 29 (3.8%) | 9 (1.1%) |
| 75 to 79 Years | 23 (3.0%) | 17 (2.0%) |
| 80 to 84 Years | 18 (2.4%) | 12 (1.4%) |
| 85 Years and over | 8 (1.1%) | 2 (0.2%) |
| Total | 764 (100.0%) | 834 (100.0%) |
Families and Households in Elwood
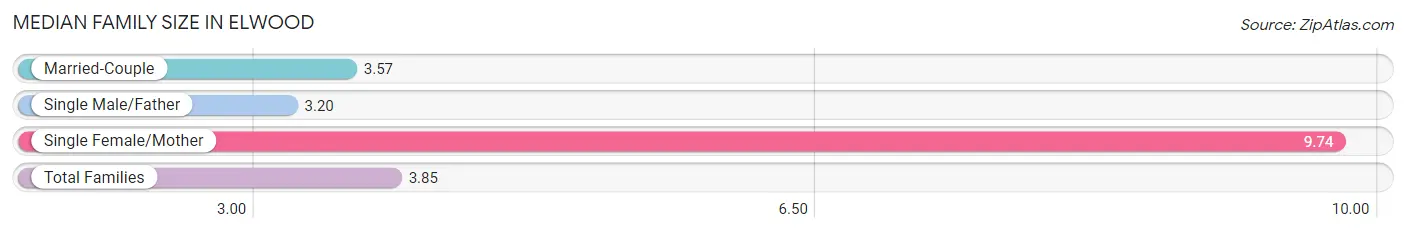
Median Family Size in Elwood
The median family size in Elwood is 3.85 persons per family, with single female/mother families (19 | 4.8%) accounting for the largest median family size of 9.74 persons per family. On the other hand, single male/father families (15 | 3.8%) represent the smallest median family size with 3.20 persons per family.
| Family Type | # Families | Family Size |
| Married-Couple | 365 (91.5%) | 3.57 |
| Single Male/Father | 15 (3.8%) | 3.20 |
| Single Female/Mother | 19 (4.8%) | 9.74 |
| Total Families | 399 (100.0%) | 3.85 |
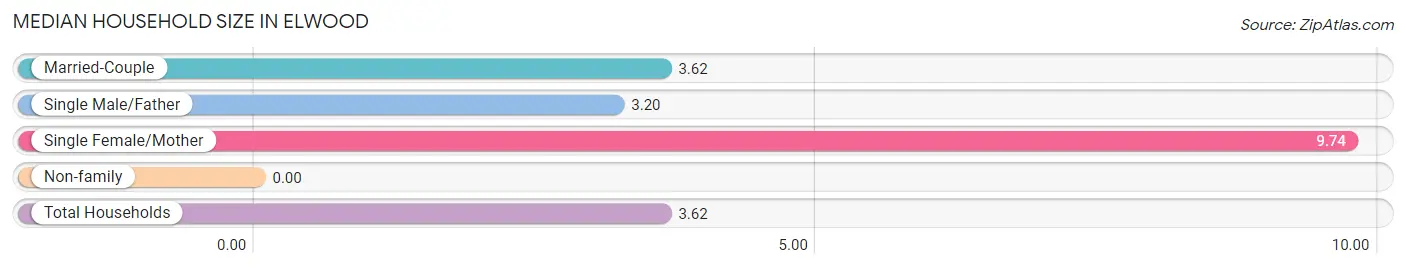
Median Household Size in Elwood
| Household Type | # Households | Household Size |
| Married-Couple | 365 (82.8%) | 3.62 |
| Single Male/Father | 15 (3.4%) | 3.20 |
| Single Female/Mother | 19 (4.3%) | 9.74 |
| Non-family | 42 (9.5%) | - |
| Total Households | 441 (100.0%) | 3.62 |
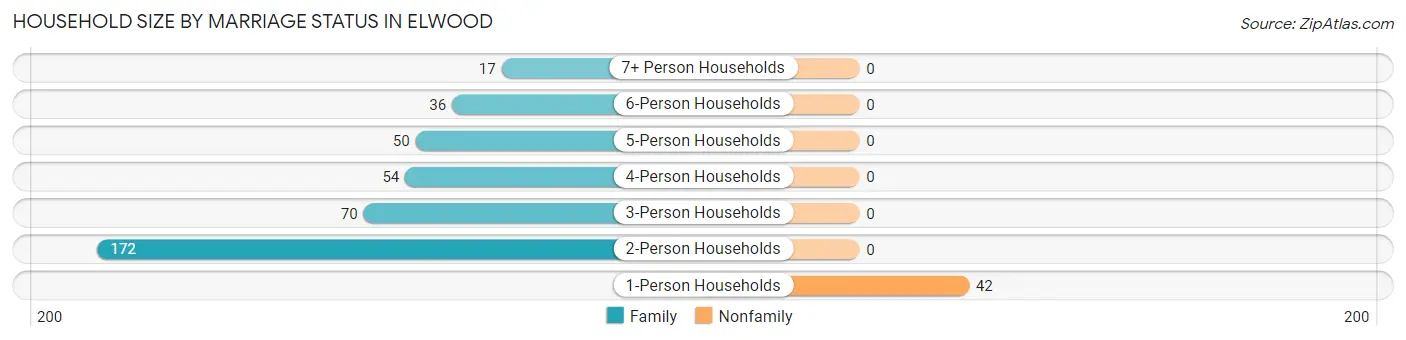
Household Size by Marriage Status in Elwood
Out of a total of 441 households in Elwood, 399 (90.5%) are family households, while 42 (9.5%) are nonfamily households. The most numerous type of family households are 2-person households, comprising 172, and the most common type of nonfamily households are 1-person households, comprising 42.
| Household Size | Family Households | Nonfamily Households |
| 1-Person Households | - | 42 (9.5%) |
| 2-Person Households | 172 (39.0%) | 0 (0.0%) |
| 3-Person Households | 70 (15.9%) | 0 (0.0%) |
| 4-Person Households | 54 (12.2%) | 0 (0.0%) |
| 5-Person Households | 50 (11.3%) | 0 (0.0%) |
| 6-Person Households | 36 (8.2%) | 0 (0.0%) |
| 7+ Person Households | 17 (3.8%) | 0 (0.0%) |
| Total | 399 (90.5%) | 42 (9.5%) |
Female Fertility in Elwood
Fertility by Age in Elwood
Average fertility rate in Elwood is 7.0 births per 1,000 women. Women in the age bracket of 20 to 34 years have the highest fertility rate with 17.0 births per 1,000 women. Women in the age bracket of 20 to 34 years acount for 100.0% of all women with births.
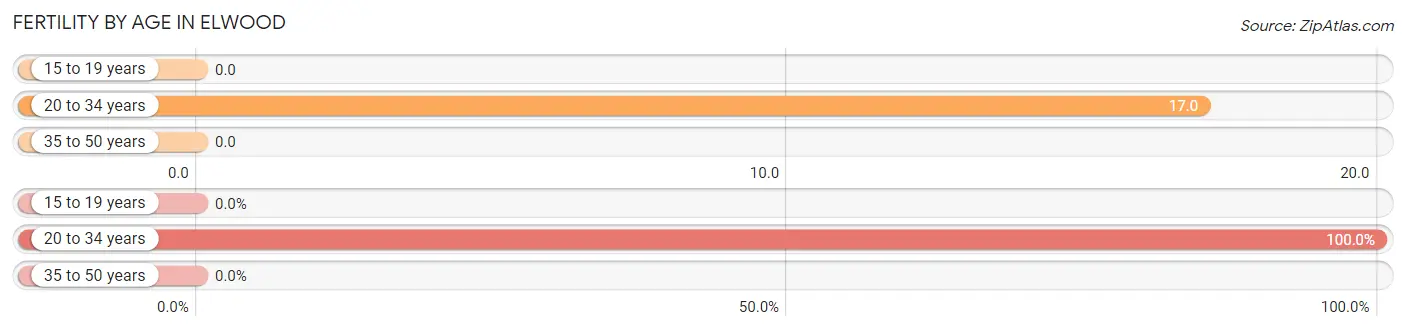
| Age Bracket | Women with Births | Births / 1,000 Women |
| 15 to 19 years | 0 (0.0%) | 0.0 |
| 20 to 34 years | 3 (100.0%) | 17.0 |
| 35 to 50 years | 0 (0.0%) | 0.0 |
| Total | 3 (100.0%) | 7.0 |
Fertility by Age by Marriage Status in Elwood
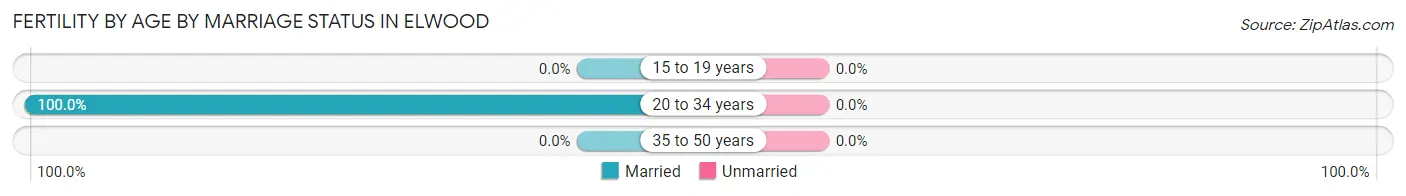
| Age Bracket | Married | Unmarried |
| 15 to 19 years | 0 (0.0%) | 0 (0.0%) |
| 20 to 34 years | 3 (100.0%) | 0 (0.0%) |
| 35 to 50 years | 0 (0.0%) | 0 (0.0%) |
| Total | 3 (100.0%) | 0 (0.0%) |
Fertility by Education in Elwood
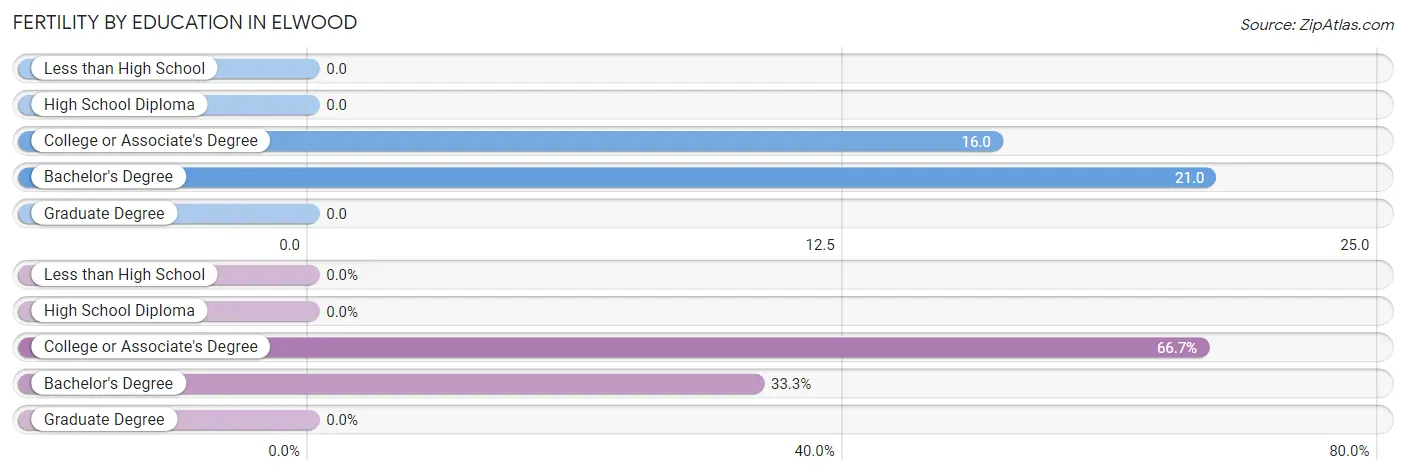
| Educational Attainment | Women with Births | Births / 1,000 Women |
| Less than High School | 0 (0.0%) | 0.0 |
| High School Diploma | 0 (0.0%) | 0.0 |
| College or Associate's Degree | 2 (66.7%) | 16.0 |
| Bachelor's Degree | 1 (33.3%) | 21.0 |
| Graduate Degree | 0 (0.0%) | 0.0 |
| Total | 3 (100.0%) | 7.0 |
Fertility by Education by Marriage Status in Elwood
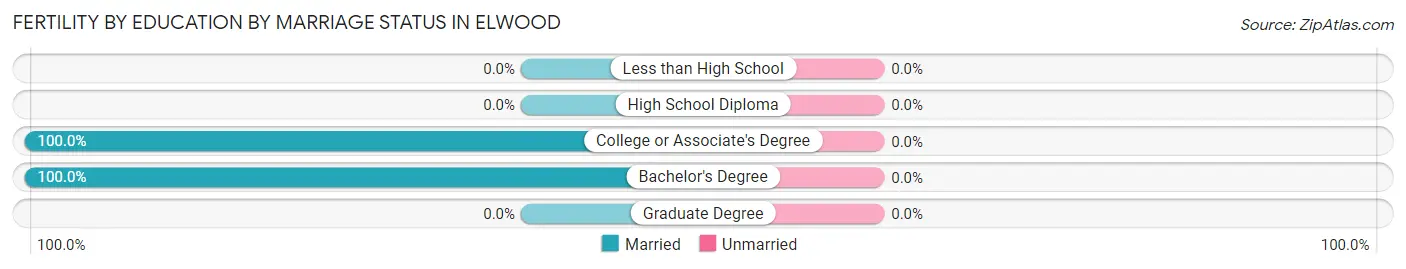
| Educational Attainment | Married | Unmarried |
| Less than High School | 0 (0.0%) | 0 (0.0%) |
| High School Diploma | 0 (0.0%) | 0 (0.0%) |
| College or Associate's Degree | 2 (100.0%) | 0 (0.0%) |
| Bachelor's Degree | 1 (100.0%) | 0 (0.0%) |
| Graduate Degree | 0 (0.0%) | 0 (0.0%) |
| Total | 3 (100.0%) | 0 (0.0%) |
Income in Elwood
Income Overview in Elwood
Per Capita Income in Elwood is $35,280, while median incomes of families and households are $101,125 and $98,309 respectively.
| Characteristic | Number | Measure |
| Per Capita Income | 1,598 | $35,280 |
| Median Family Income | 399 | $101,125 |
| Mean Family Income | 399 | $123,595 |
| Median Household Income | 441 | $98,309 |
| Mean Household Income | 441 | $116,916 |
| Income Deficit | 399 | $0 |
| Wage / Income Gap (%) | 1,598 | 56.33% |
| Wage / Income Gap ($) | 1,598 | 43.67¢ per $1 |
| Gini / Inequality Index | 1,598 | 0.35 |
Earnings by Sex in Elwood
Average Earnings in Elwood are $33,649, $49,183 for men and $21,477 for women, a difference of 56.3%.
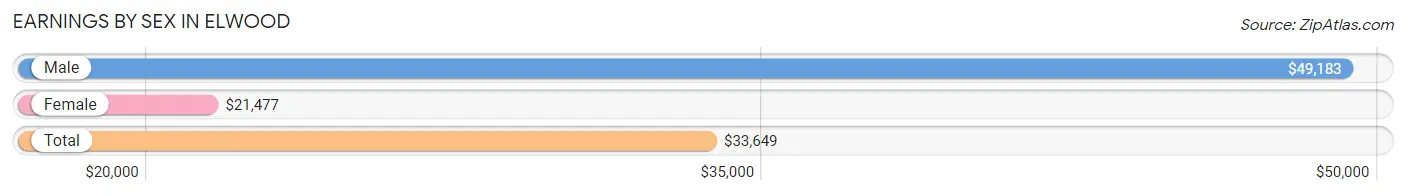
| Sex | Number | Average Earnings |
| Male | 493 (51.8%) | $49,183 |
| Female | 459 (48.2%) | $21,477 |
| Total | 952 (100.0%) | $33,649 |
Earnings by Sex by Income Bracket in Elwood
The most common earnings brackets in Elwood are $55,000 to $64,999 for men (84 | 17.0%) and $2,499 or less for women (52 | 11.3%).
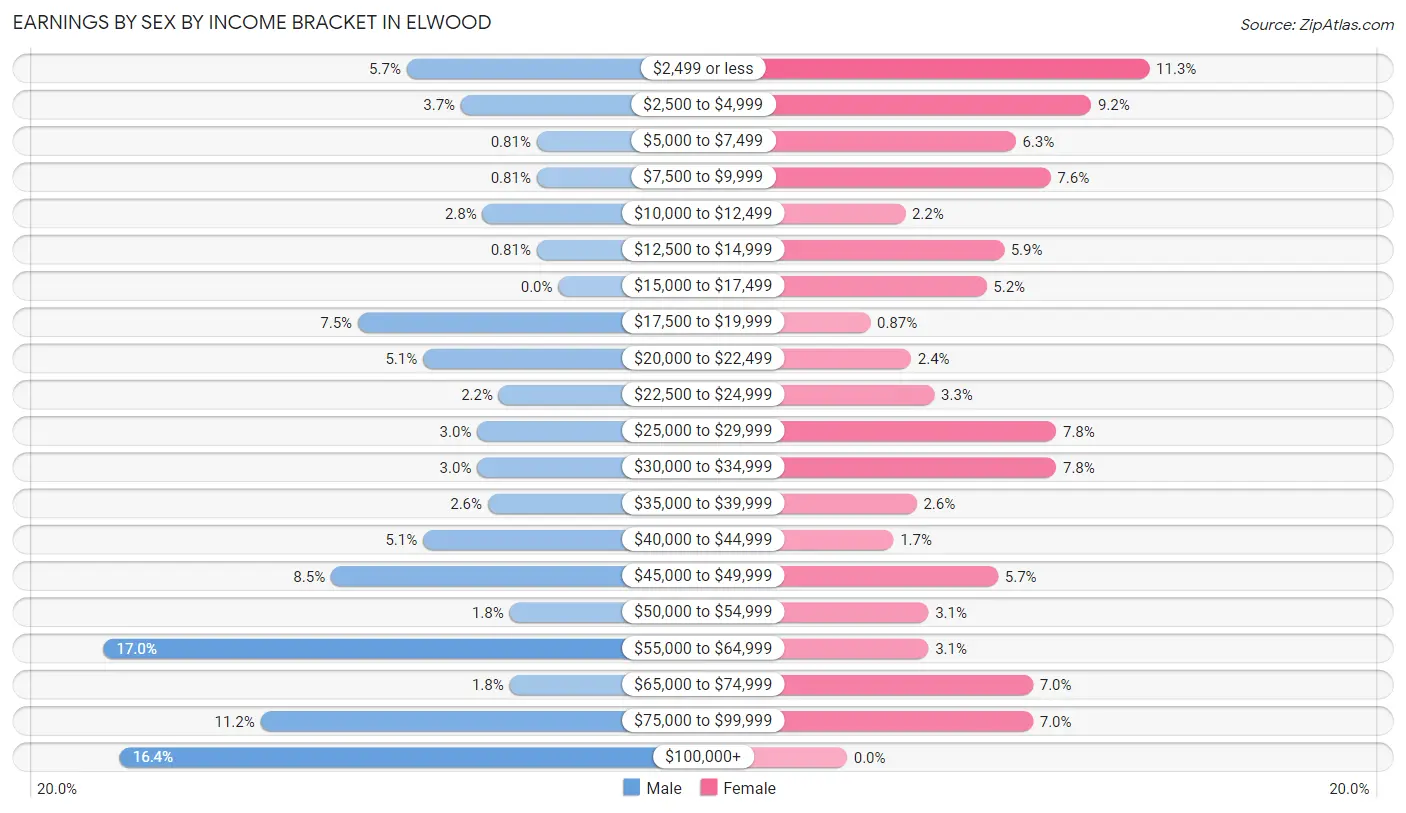
| Income | Male | Female |
| $2,499 or less | 28 (5.7%) | 52 (11.3%) |
| $2,500 to $4,999 | 18 (3.6%) | 42 (9.1%) |
| $5,000 to $7,499 | 4 (0.8%) | 29 (6.3%) |
| $7,500 to $9,999 | 4 (0.8%) | 35 (7.6%) |
| $10,000 to $12,499 | 14 (2.8%) | 10 (2.2%) |
| $12,500 to $14,999 | 4 (0.8%) | 27 (5.9%) |
| $15,000 to $17,499 | 0 (0.0%) | 24 (5.2%) |
| $17,500 to $19,999 | 37 (7.5%) | 4 (0.9%) |
| $20,000 to $22,499 | 25 (5.1%) | 11 (2.4%) |
| $22,500 to $24,999 | 11 (2.2%) | 15 (3.3%) |
| $25,000 to $29,999 | 15 (3.0%) | 36 (7.8%) |
| $30,000 to $34,999 | 15 (3.0%) | 36 (7.8%) |
| $35,000 to $39,999 | 13 (2.6%) | 12 (2.6%) |
| $40,000 to $44,999 | 25 (5.1%) | 8 (1.7%) |
| $45,000 to $49,999 | 42 (8.5%) | 26 (5.7%) |
| $50,000 to $54,999 | 9 (1.8%) | 14 (3.0%) |
| $55,000 to $64,999 | 84 (17.0%) | 14 (3.0%) |
| $65,000 to $74,999 | 9 (1.8%) | 32 (7.0%) |
| $75,000 to $99,999 | 55 (11.2%) | 32 (7.0%) |
| $100,000+ | 81 (16.4%) | 0 (0.0%) |
| Total | 493 (100.0%) | 459 (100.0%) |
Earnings by Sex by Educational Attainment in Elwood
Average earnings in Elwood are $60,216 for men and $31,979 for women, a difference of 46.9%. Men with an educational attainment of graduate degree enjoy the highest average annual earnings of $103,438, while those with college or associate's degree education earn the least with $48,802. Women with an educational attainment of graduate degree earn the most with the average annual earnings of $64,583, while those with high school diploma education have the smallest earnings of $23,929.
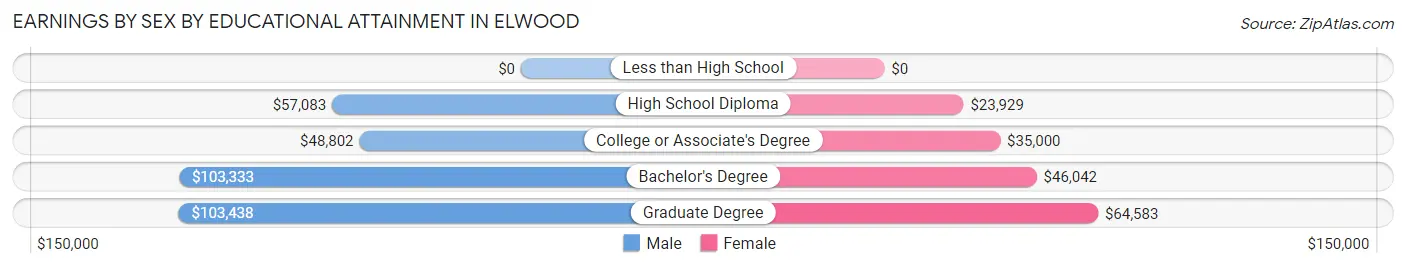
| Educational Attainment | Male Income | Female Income |
| Less than High School | - | - |
| High School Diploma | $57,083 | $23,929 |
| College or Associate's Degree | $48,802 | $35,000 |
| Bachelor's Degree | $103,333 | $46,042 |
| Graduate Degree | $103,438 | $64,583 |
| Total | $60,216 | $31,979 |
Family Income in Elwood
Family Income Brackets in Elwood
According to the Elwood family income data, there are 98 families falling into the $100,000 to $149,999 income range, which is the most common income bracket and makes up 24.6% of all families.
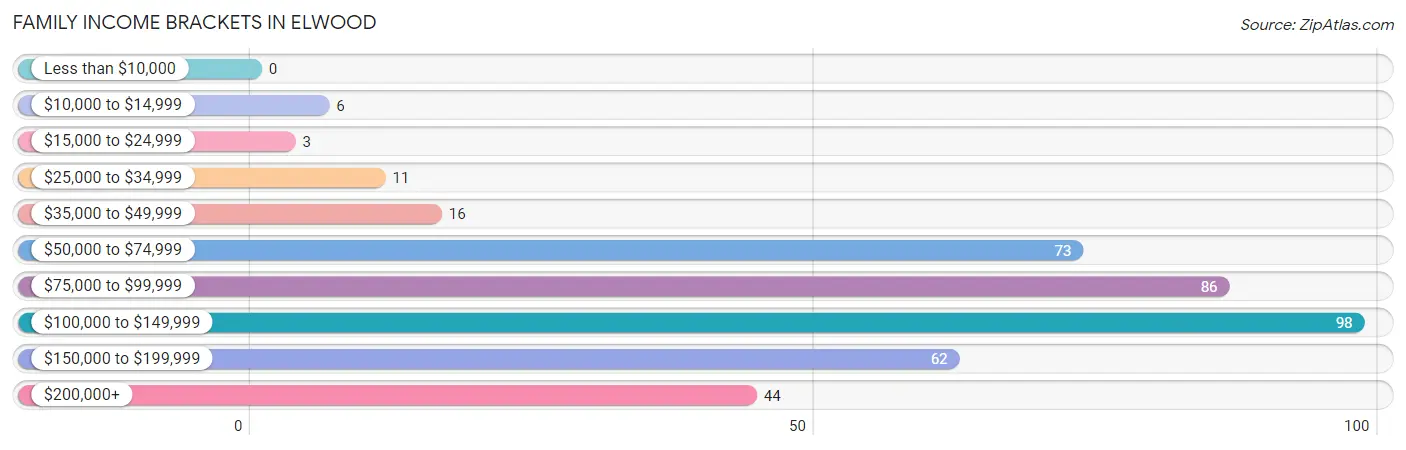
| Income Bracket | # Families | % Families |
| Less than $10,000 | 0 | 0.0% |
| $10,000 to $14,999 | 6 | 1.5% |
| $15,000 to $24,999 | 3 | 0.8% |
| $25,000 to $34,999 | 11 | 2.8% |
| $35,000 to $49,999 | 16 | 4.0% |
| $50,000 to $74,999 | 73 | 18.3% |
| $75,000 to $99,999 | 86 | 21.6% |
| $100,000 to $149,999 | 98 | 24.6% |
| $150,000 to $199,999 | 62 | 15.5% |
| $200,000+ | 44 | 11.0% |
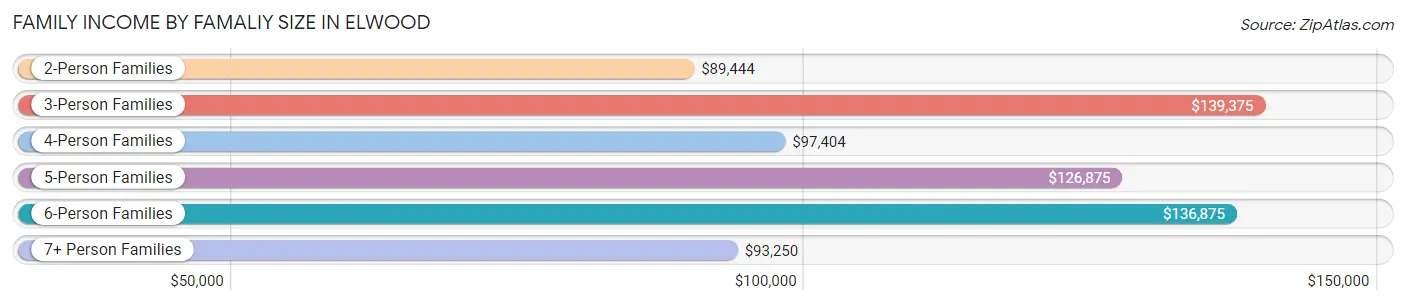
Family Income by Famaliy Size in Elwood
3-person families (73 | 18.3%) account for the highest median family income in Elwood with $139,375 per family, while 3-person families (73 | 18.3%) have the highest median income of $46,458 per family member.
| Income Bracket | # Families | Median Income |
| 2-Person Families | 172 (43.1%) | $89,444 |
| 3-Person Families | 73 (18.3%) | $139,375 |
| 4-Person Families | 51 (12.8%) | $97,404 |
| 5-Person Families | 61 (15.3%) | $126,875 |
| 6-Person Families | 25 (6.3%) | $136,875 |
| 7+ Person Families | 17 (4.3%) | $93,250 |
| Total | 399 (100.0%) | $101,125 |
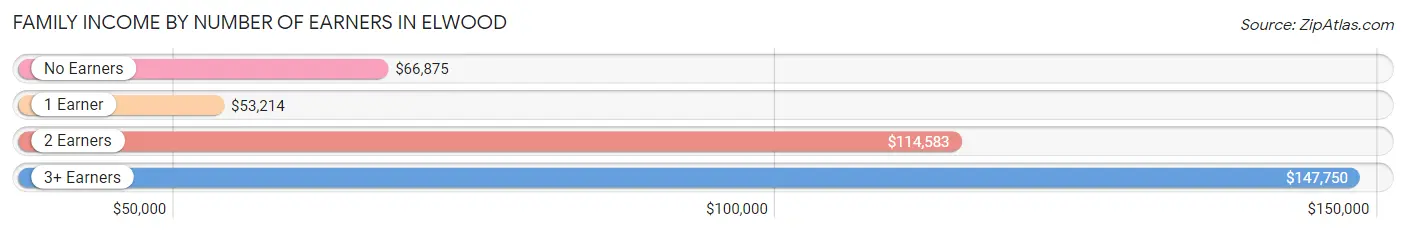
Family Income by Number of Earners in Elwood
The median family income in Elwood is $101,125, with families comprising 3+ earners (124) having the highest median family income of $147,750, while families with 1 earner (84) have the lowest median family income of $53,214, accounting for 31.1% and 21.0% of families, respectively.
| Number of Earners | # Families | Median Income |
| No Earners | 43 (10.8%) | $66,875 |
| 1 Earner | 84 (21.0%) | $53,214 |
| 2 Earners | 148 (37.1%) | $114,583 |
| 3+ Earners | 124 (31.1%) | $147,750 |
| Total | 399 (100.0%) | $101,125 |
Household Income in Elwood
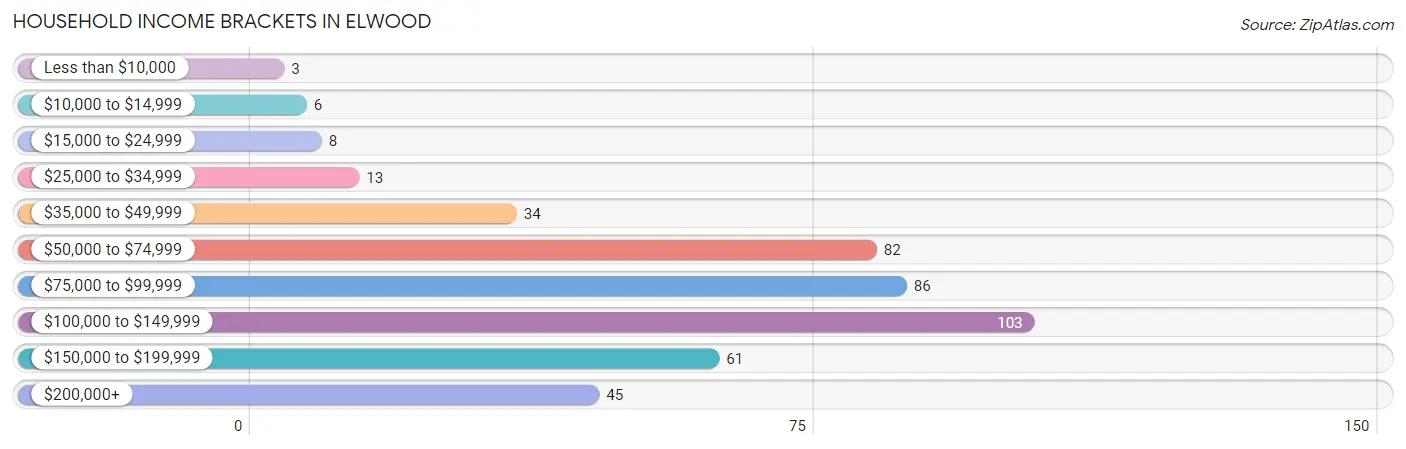
Household Income Brackets in Elwood
With 103 households falling in the category, the $100,000 to $149,999 income range is the most frequent in Elwood, accounting for 23.4% of all households. In contrast, only 3 households (0.7%) fall into the less than $10,000 income bracket, making it the least populous group.
| Income Bracket | # Households | % Households |
| Less than $10,000 | 3 | 0.7% |
| $10,000 to $14,999 | 6 | 1.4% |
| $15,000 to $24,999 | 8 | 1.8% |
| $25,000 to $34,999 | 13 | 2.9% |
| $35,000 to $49,999 | 34 | 7.7% |
| $50,000 to $74,999 | 82 | 18.6% |
| $75,000 to $99,999 | 86 | 19.5% |
| $100,000 to $149,999 | 103 | 23.4% |
| $150,000 to $199,999 | 61 | 13.8% |
| $200,000+ | 45 | 10.2% |
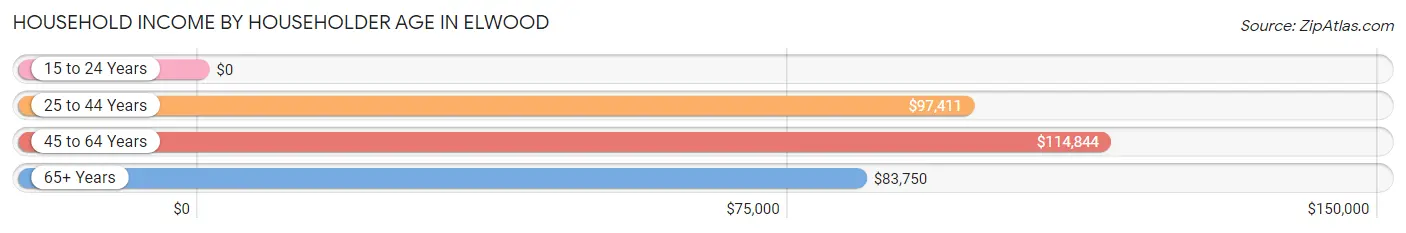
Household Income by Householder Age in Elwood
The median household income in Elwood is $98,309, with the highest median household income of $114,844 found in the 45 to 64 years age bracket for the primary householder. A total of 209 households (47.4%) fall into this category. Meanwhile, the 15 to 24 years age bracket for the primary householder has the lowest median household income of $0, with 9 households (2.0%) in this group.
| Income Bracket | # Households | Median Income |
| 15 to 24 Years | 9 (2.0%) | $0 |
| 25 to 44 Years | 113 (25.6%) | $97,411 |
| 45 to 64 Years | 209 (47.4%) | $114,844 |
| 65+ Years | 110 (24.9%) | $83,750 |
| Total | 441 (100.0%) | $98,309 |
Poverty in Elwood
Income Below Poverty by Sex and Age in Elwood
With 3.9% poverty level for males and 1.4% for females among the residents of Elwood, 15 year old males and 16 and 17 year old females are the most vulnerable to poverty, with 16 males (55.2%) and 6 females (10.7%) in their respective age groups living below the poverty level.
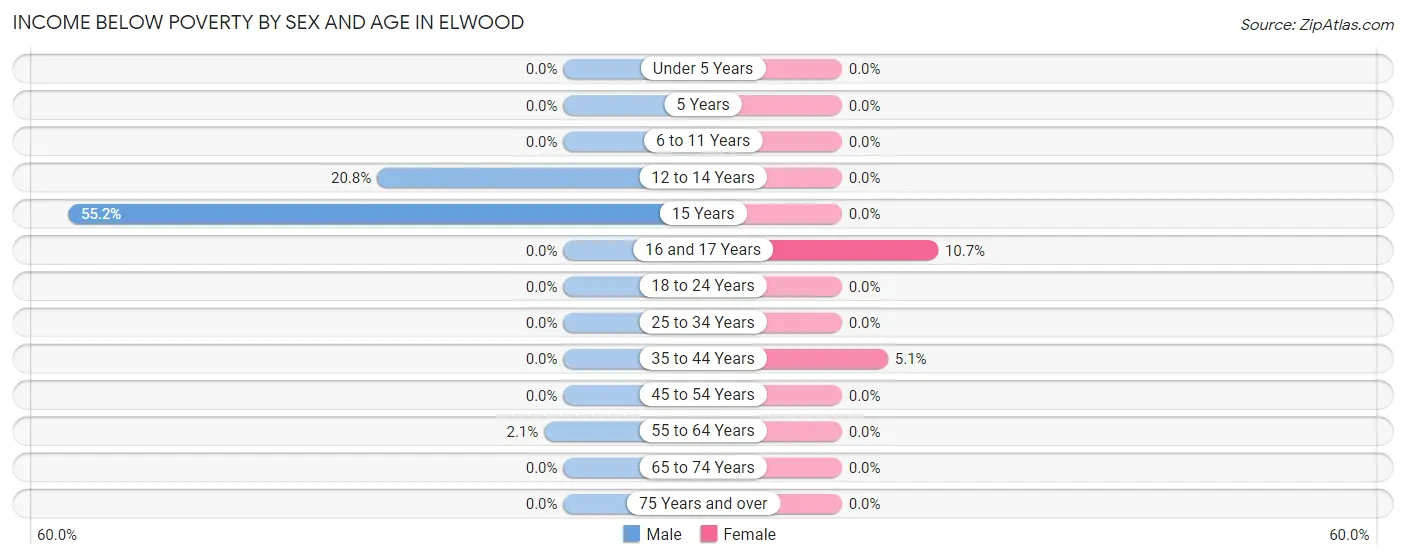
| Age Bracket | Male | Female |
| Under 5 Years | 0 (0.0%) | 0 (0.0%) |
| 5 Years | 0 (0.0%) | 0 (0.0%) |
| 6 to 11 Years | 0 (0.0%) | 0 (0.0%) |
| 12 to 14 Years | 11 (20.7%) | 0 (0.0%) |
| 15 Years | 16 (55.2%) | 0 (0.0%) |
| 16 and 17 Years | 0 (0.0%) | 6 (10.7%) |
| 18 to 24 Years | 0 (0.0%) | 0 (0.0%) |
| 25 to 34 Years | 0 (0.0%) | 0 (0.0%) |
| 35 to 44 Years | 0 (0.0%) | 6 (5.1%) |
| 45 to 54 Years | 0 (0.0%) | 0 (0.0%) |
| 55 to 64 Years | 3 (2.1%) | 0 (0.0%) |
| 65 to 74 Years | 0 (0.0%) | 0 (0.0%) |
| 75 Years and over | 0 (0.0%) | 0 (0.0%) |
| Total | 30 (3.9%) | 12 (1.4%) |
Income Above Poverty by Sex and Age in Elwood
According to the poverty statistics in Elwood, males aged under 5 years and females aged under 5 years are the age groups that are most secure financially, with 100.0% of males and 100.0% of females in these age groups living above the poverty line.
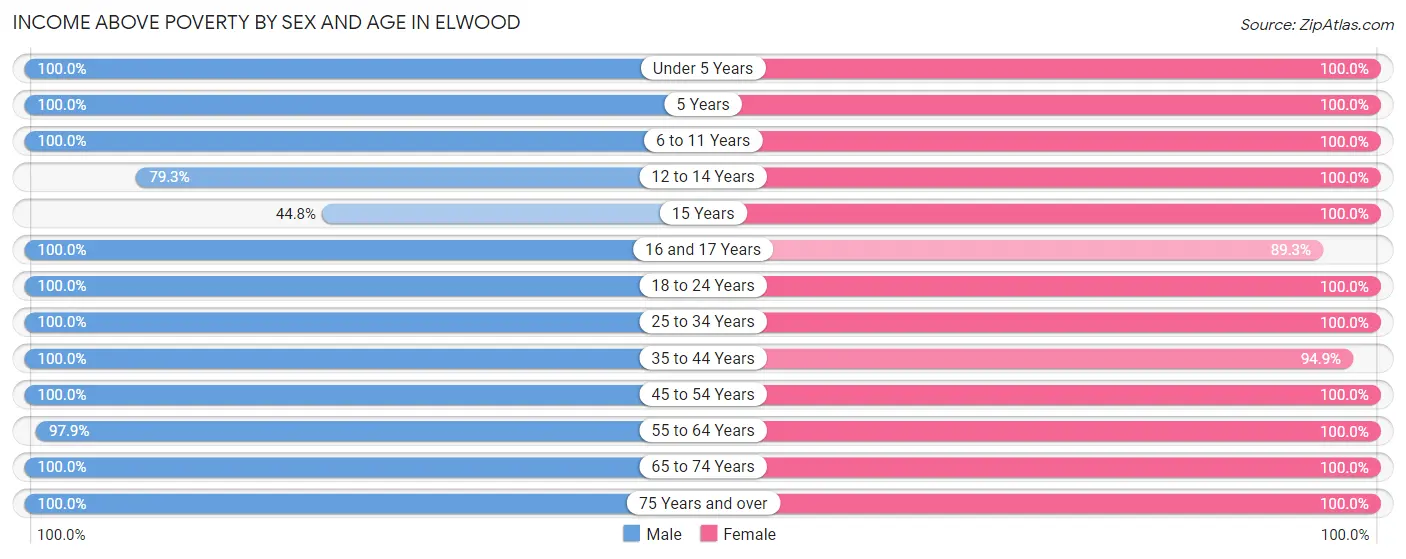
| Age Bracket | Male | Female |
| Under 5 Years | 25 (100.0%) | 36 (100.0%) |
| 5 Years | 2 (100.0%) | 17 (100.0%) |
| 6 to 11 Years | 59 (100.0%) | 74 (100.0%) |
| 12 to 14 Years | 42 (79.2%) | 44 (100.0%) |
| 15 Years | 13 (44.8%) | 15 (100.0%) |
| 16 and 17 Years | 21 (100.0%) | 50 (89.3%) |
| 18 to 24 Years | 96 (100.0%) | 105 (100.0%) |
| 25 to 34 Years | 61 (100.0%) | 90 (100.0%) |
| 35 to 44 Years | 98 (100.0%) | 111 (94.9%) |
| 45 to 54 Years | 72 (100.0%) | 83 (100.0%) |
| 55 to 64 Years | 137 (97.9%) | 111 (100.0%) |
| 65 to 74 Years | 59 (100.0%) | 55 (100.0%) |
| 75 Years and over | 49 (100.0%) | 31 (100.0%) |
| Total | 734 (96.1%) | 822 (98.6%) |
Income Below Poverty Among Married-Couple Families in Elwood
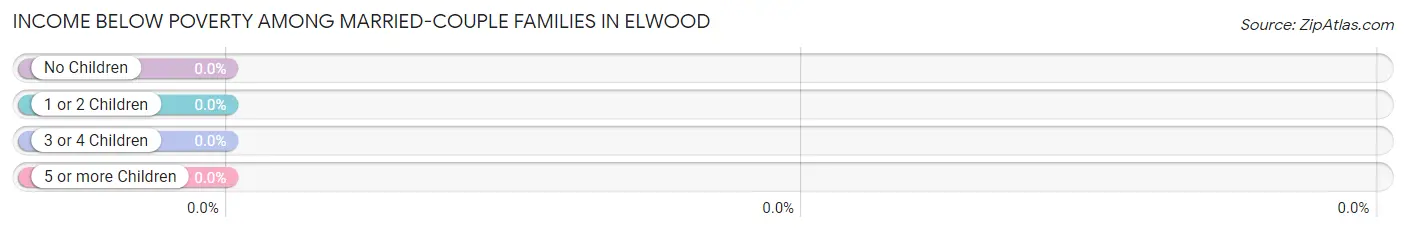
| Children | Above Poverty | Below Poverty |
| No Children | 222 (100.0%) | 0 (0.0%) |
| 1 or 2 Children | 97 (100.0%) | 0 (0.0%) |
| 3 or 4 Children | 43 (100.0%) | 0 (0.0%) |
| 5 or more Children | 3 (100.0%) | 0 (0.0%) |
| Total | 365 (100.0%) | 0 (0.0%) |
Income Below Poverty Among Single-Parent Households in Elwood
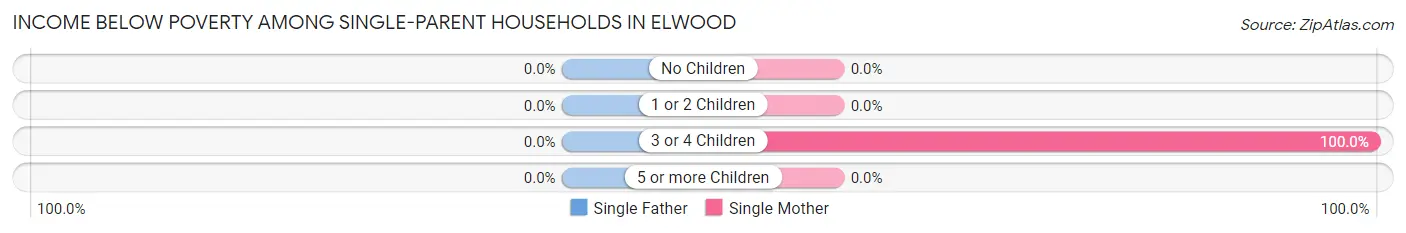
| Children | Single Father | Single Mother |
| No Children | 0 (0.0%) | 0 (0.0%) |
| 1 or 2 Children | 0 (0.0%) | 0 (0.0%) |
| 3 or 4 Children | 0 (0.0%) | 6 (100.0%) |
| 5 or more Children | 0 (0.0%) | 0 (0.0%) |
| Total | 0 (0.0%) | 6 (31.6%) |
Income Below Poverty Among Married-Couple vs Single-Parent Households in Elwood
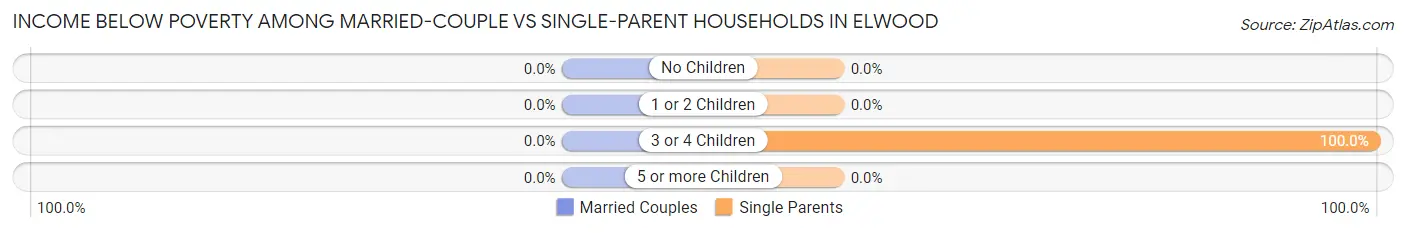
| Children | Married-Couple Families | Single-Parent Households |
| No Children | 0 (0.0%) | 0 (0.0%) |
| 1 or 2 Children | 0 (0.0%) | 0 (0.0%) |
| 3 or 4 Children | 0 (0.0%) | 6 (100.0%) |
| 5 or more Children | 0 (0.0%) | 0 (0.0%) |
| Total | 0 (0.0%) | 6 (17.6%) |
Employment Characteristics in Elwood
Employment by Class of Employer in Elwood
Among the 840 employed individuals in Elwood, private company employees (536 | 63.8%), self-employed (incorporated) (72 | 8.6%), and self-employed (not incorporated) (65 | 7.7%) make up the most common classes of employment.
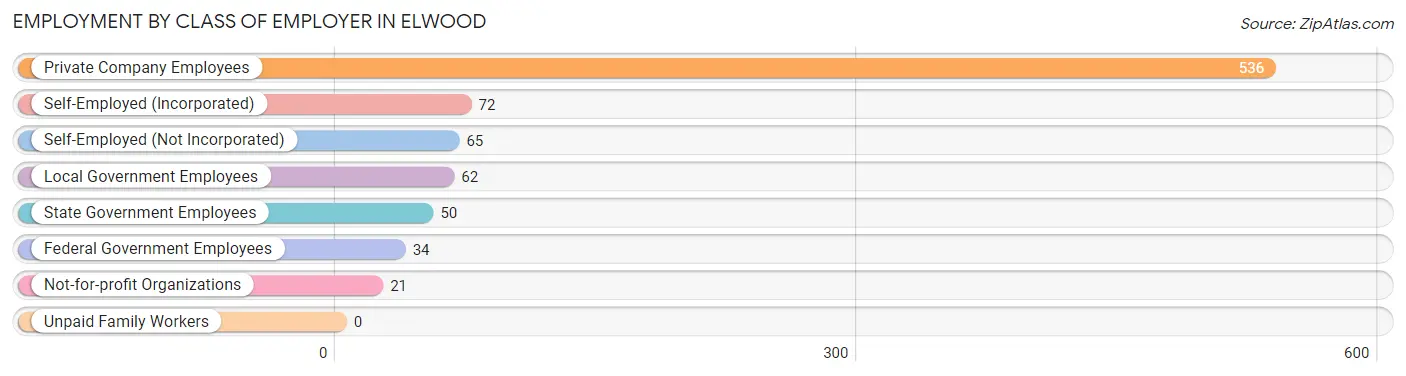
| Employer Class | # Employees | % Employees |
| Private Company Employees | 536 | 63.8% |
| Self-Employed (Incorporated) | 72 | 8.6% |
| Self-Employed (Not Incorporated) | 65 | 7.7% |
| Not-for-profit Organizations | 21 | 2.5% |
| Local Government Employees | 62 | 7.4% |
| State Government Employees | 50 | 5.9% |
| Federal Government Employees | 34 | 4.1% |
| Unpaid Family Workers | 0 | 0.0% |
| Total | 840 | 100.0% |
Employment Status by Age in Elwood
According to the labor force statistics for Elwood, out of the total population over 16 years of age (1,244), 71.9% or 894 individuals are in the labor force, with 5.8% or 52 of them unemployed. The age group with the highest labor force participation rate is 55 to 59 years, with 92.0% or 127 individuals in the labor force. Within the labor force, the 20 to 24 years age range has the highest percentage of unemployed individuals, with 16.9% or 22 of them being unemployed.
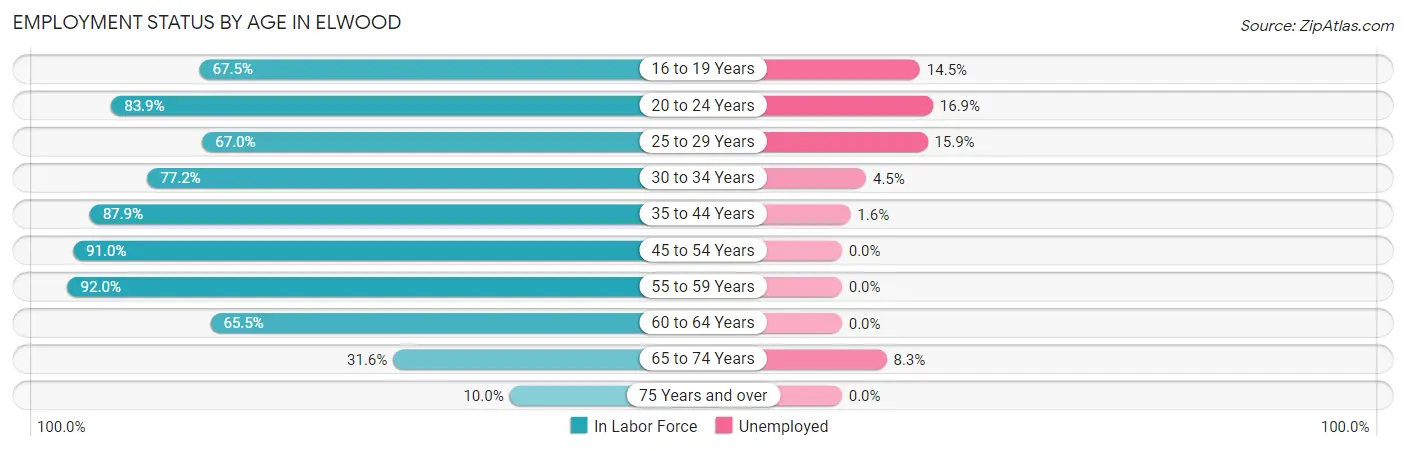
| Age Bracket | In Labor Force | Unemployed |
| 16 to 19 Years | 83 (67.5%) | 12 (14.5%) |
| 20 to 24 Years | 130 (83.9%) | 22 (16.9%) |
| 25 to 29 Years | 63 (67.0%) | 10 (15.9%) |
| 30 to 34 Years | 44 (77.2%) | 2 (4.5%) |
| 35 to 44 Years | 189 (87.9%) | 3 (1.6%) |
| 45 to 54 Years | 141 (91.0%) | 0 (0.0%) |
| 55 to 59 Years | 127 (92.0%) | 0 (0.0%) |
| 60 to 64 Years | 74 (65.5%) | 0 (0.0%) |
| 65 to 74 Years | 36 (31.6%) | 3 (8.3%) |
| 75 Years and over | 8 (10.0%) | 0 (0.0%) |
| Total | 894 (71.9%) | 52 (5.8%) |
Employment Status by Educational Attainment in Elwood
According to labor force statistics for Elwood, 82.6% of individuals (638) out of the total population between 25 and 64 years of age (772) are in the labor force, with 2.4% or 15 of them being unemployed. The group with the highest labor force participation rate are those with the educational attainment of bachelor's degree or higher, with 85.8% or 163 individuals in the labor force. Within the labor force, individuals with high school diploma education have the highest percentage of unemployment, with 3.7% or 9 of them being unemployed.
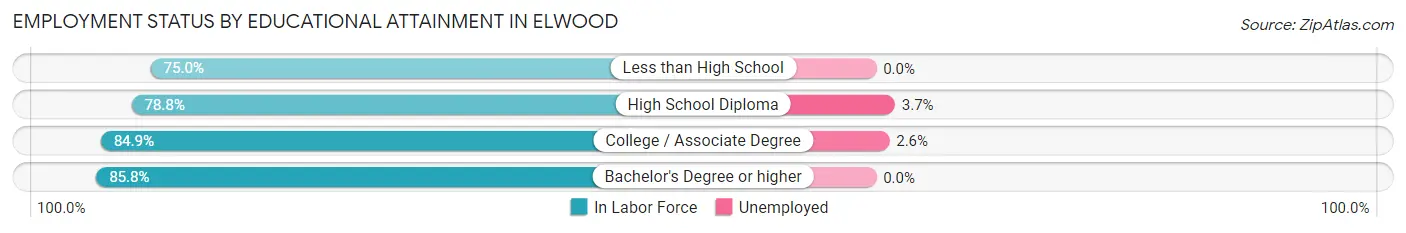
| Educational Attainment | In Labor Force | Unemployed |
| Less than High School | 3 (75.0%) | 0 (0.0%) |
| High School Diploma | 241 (78.8%) | 11 (3.7%) |
| College / Associate Degree | 231 (84.9%) | 7 (2.6%) |
| Bachelor's Degree or higher | 163 (85.8%) | 0 (0.0%) |
| Total | 638 (82.6%) | 19 (2.4%) |
Employment Occupations by Sex in Elwood
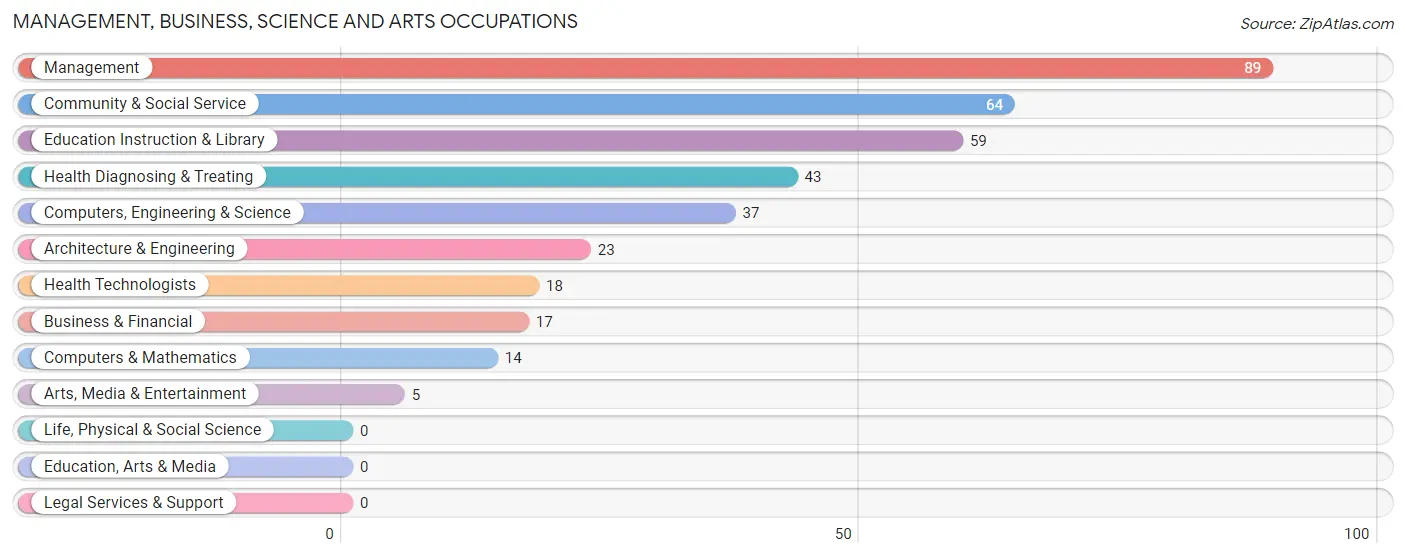
Management, Business, Science and Arts Occupations
The most common Management, Business, Science and Arts occupations in Elwood are Management (89 | 10.6%), Community & Social Service (64 | 7.6%), Education Instruction & Library (59 | 7.0%), Health Diagnosing & Treating (43 | 5.1%), and Computers, Engineering & Science (37 | 4.4%).
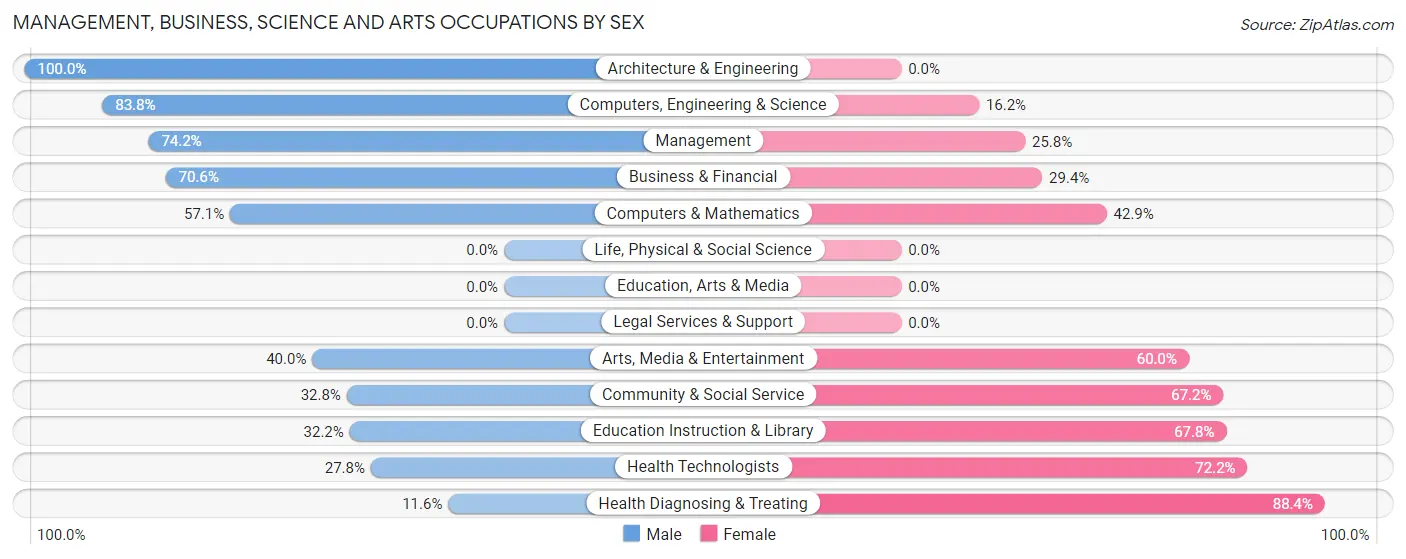
Management, Business, Science and Arts Occupations by Sex
Within the Management, Business, Science and Arts occupations in Elwood, the most male-oriented occupations are Architecture & Engineering (100.0%), Computers, Engineering & Science (83.8%), and Management (74.2%), while the most female-oriented occupations are Health Diagnosing & Treating (88.4%), Health Technologists (72.2%), and Education Instruction & Library (67.8%).
| Occupation | Male | Female |
| Management | 66 (74.2%) | 23 (25.8%) |
| Business & Financial | 12 (70.6%) | 5 (29.4%) |
| Computers, Engineering & Science | 31 (83.8%) | 6 (16.2%) |
| Computers & Mathematics | 8 (57.1%) | 6 (42.9%) |
| Architecture & Engineering | 23 (100.0%) | 0 (0.0%) |
| Life, Physical & Social Science | 0 (0.0%) | 0 (0.0%) |
| Community & Social Service | 21 (32.8%) | 43 (67.2%) |
| Education, Arts & Media | 0 (0.0%) | 0 (0.0%) |
| Legal Services & Support | 0 (0.0%) | 0 (0.0%) |
| Education Instruction & Library | 19 (32.2%) | 40 (67.8%) |
| Arts, Media & Entertainment | 2 (40.0%) | 3 (60.0%) |
| Health Diagnosing & Treating | 5 (11.6%) | 38 (88.4%) |
| Health Technologists | 5 (27.8%) | 13 (72.2%) |
| Total (Category) | 135 (54.0%) | 115 (46.0%) |
| Total (Overall) | 455 (54.0%) | 388 (46.0%) |
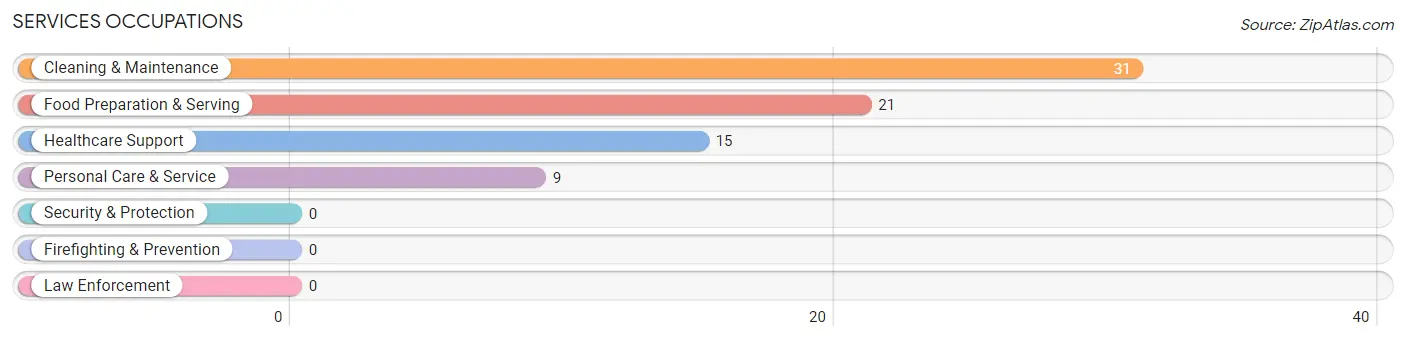
Services Occupations
The most common Services occupations in Elwood are Cleaning & Maintenance (31 | 3.7%), Food Preparation & Serving (21 | 2.5%), Healthcare Support (15 | 1.8%), and Personal Care & Service (9 | 1.1%).
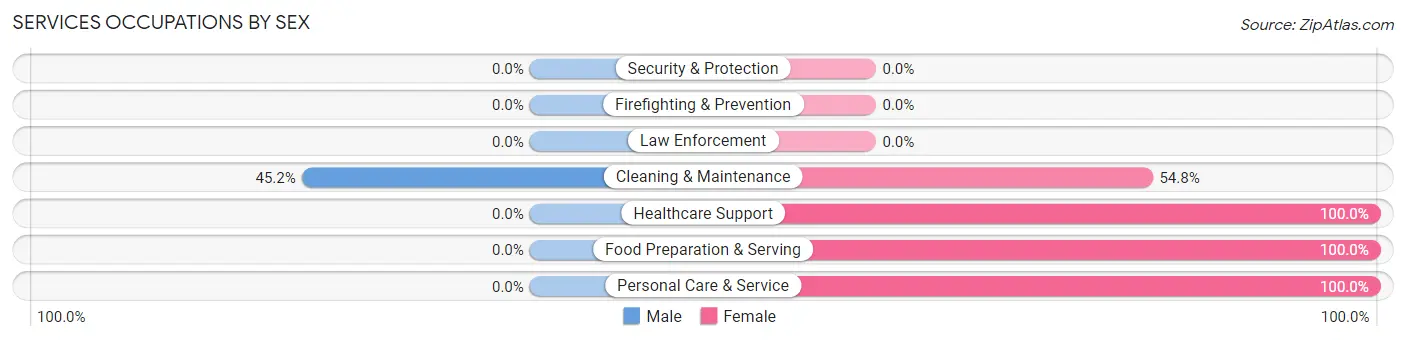
Services Occupations by Sex
| Occupation | Male | Female |
| Healthcare Support | 0 (0.0%) | 15 (100.0%) |
| Security & Protection | 0 (0.0%) | 0 (0.0%) |
| Firefighting & Prevention | 0 (0.0%) | 0 (0.0%) |
| Law Enforcement | 0 (0.0%) | 0 (0.0%) |
| Food Preparation & Serving | 0 (0.0%) | 21 (100.0%) |
| Cleaning & Maintenance | 14 (45.2%) | 17 (54.8%) |
| Personal Care & Service | 0 (0.0%) | 9 (100.0%) |
| Total (Category) | 14 (18.4%) | 62 (81.6%) |
| Total (Overall) | 455 (54.0%) | 388 (46.0%) |
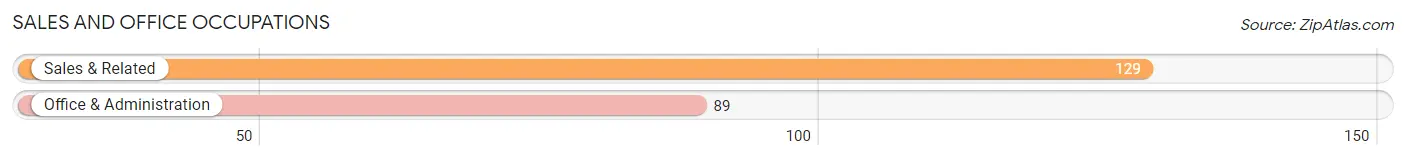
Sales and Office Occupations
The most common Sales and Office occupations in Elwood are Sales & Related (129 | 15.3%), and Office & Administration (89 | 10.6%).
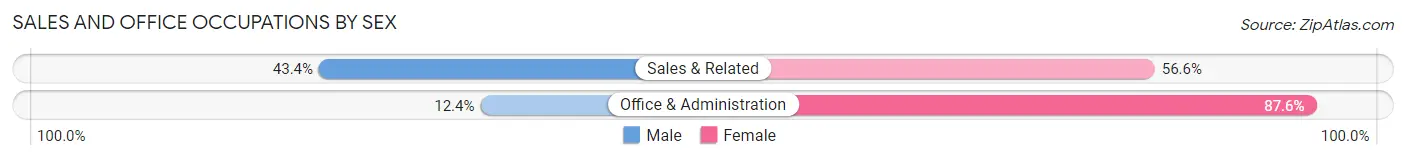
Sales and Office Occupations by Sex
| Occupation | Male | Female |
| Sales & Related | 56 (43.4%) | 73 (56.6%) |
| Office & Administration | 11 (12.4%) | 78 (87.6%) |
| Total (Category) | 67 (30.7%) | 151 (69.3%) |
| Total (Overall) | 455 (54.0%) | 388 (46.0%) |
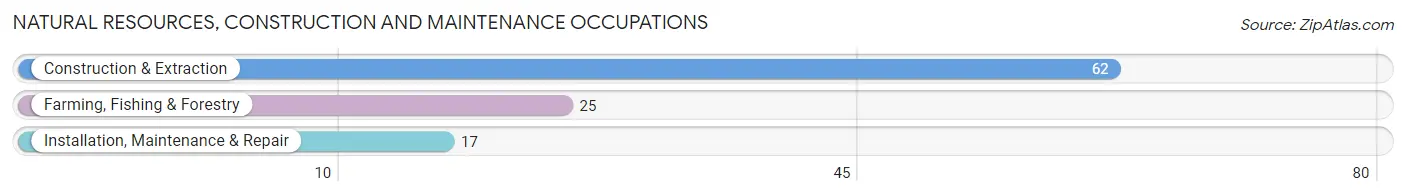
Natural Resources, Construction and Maintenance Occupations
The most common Natural Resources, Construction and Maintenance occupations in Elwood are Construction & Extraction (62 | 7.3%), Farming, Fishing & Forestry (25 | 3.0%), and Installation, Maintenance & Repair (17 | 2.0%).
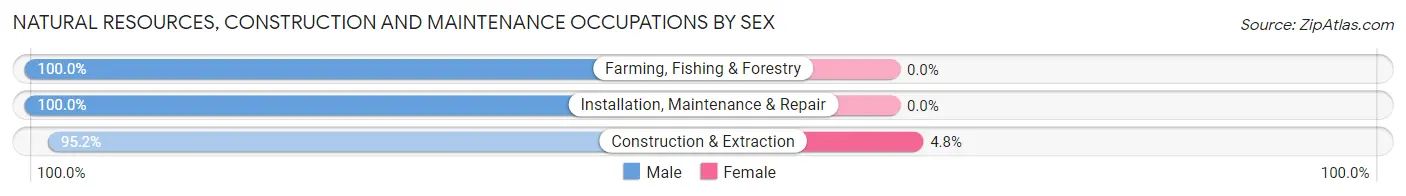
Natural Resources, Construction and Maintenance Occupations by Sex
| Occupation | Male | Female |
| Farming, Fishing & Forestry | 25 (100.0%) | 0 (0.0%) |
| Construction & Extraction | 59 (95.2%) | 3 (4.8%) |
| Installation, Maintenance & Repair | 17 (100.0%) | 0 (0.0%) |
| Total (Category) | 101 (97.1%) | 3 (2.9%) |
| Total (Overall) | 455 (54.0%) | 388 (46.0%) |
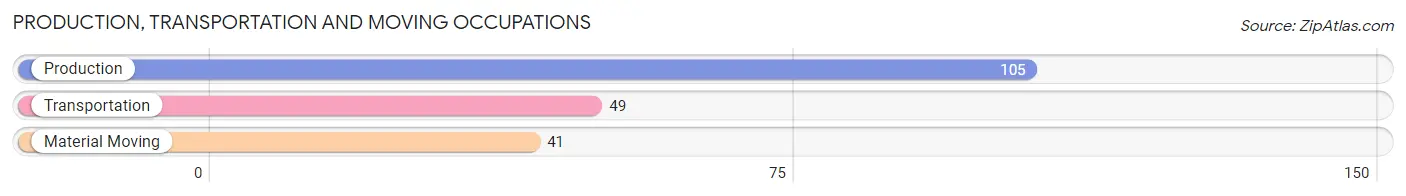
Production, Transportation and Moving Occupations
The most common Production, Transportation and Moving occupations in Elwood are Production (105 | 12.5%), Transportation (49 | 5.8%), and Material Moving (41 | 4.9%).
Production, Transportation and Moving Occupations by Sex
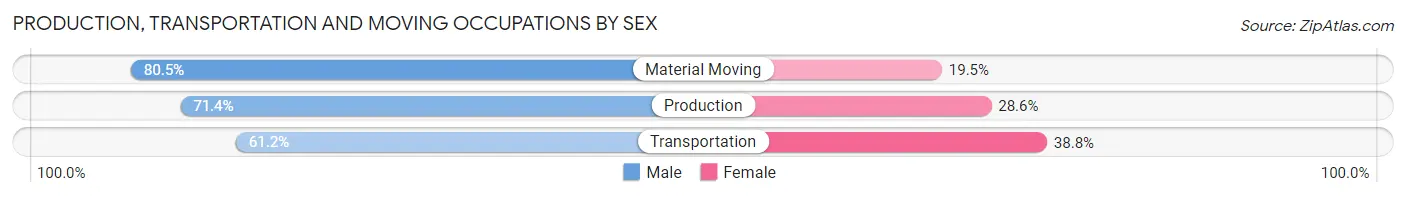
| Occupation | Male | Female |
| Production | 75 (71.4%) | 30 (28.6%) |
| Transportation | 30 (61.2%) | 19 (38.8%) |
| Material Moving | 33 (80.5%) | 8 (19.5%) |
| Total (Category) | 138 (70.8%) | 57 (29.2%) |
| Total (Overall) | 455 (54.0%) | 388 (46.0%) |
Employment Industries by Sex in Elwood
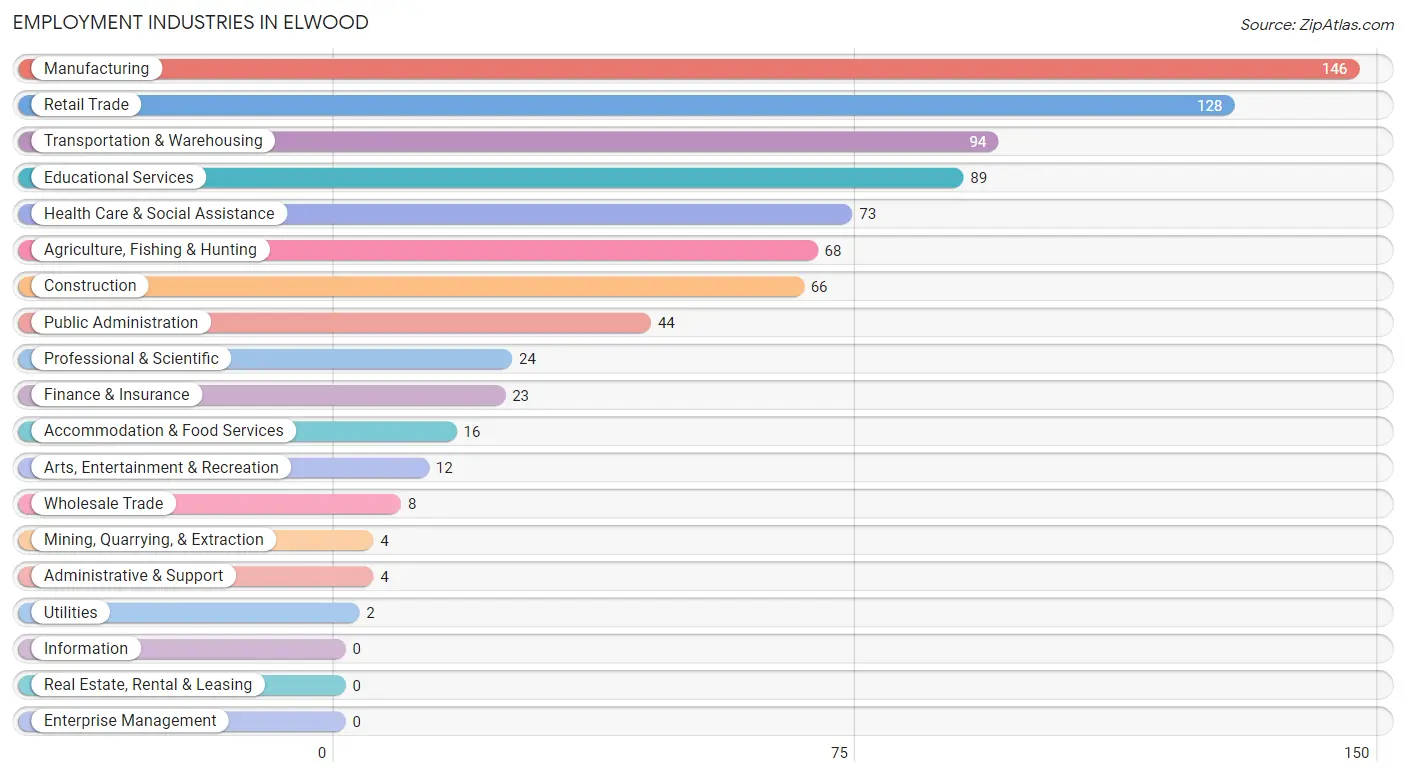
Employment Industries in Elwood
The major employment industries in Elwood include Manufacturing (146 | 17.3%), Retail Trade (128 | 15.2%), Transportation & Warehousing (94 | 11.2%), Educational Services (89 | 10.6%), and Health Care & Social Assistance (73 | 8.7%).
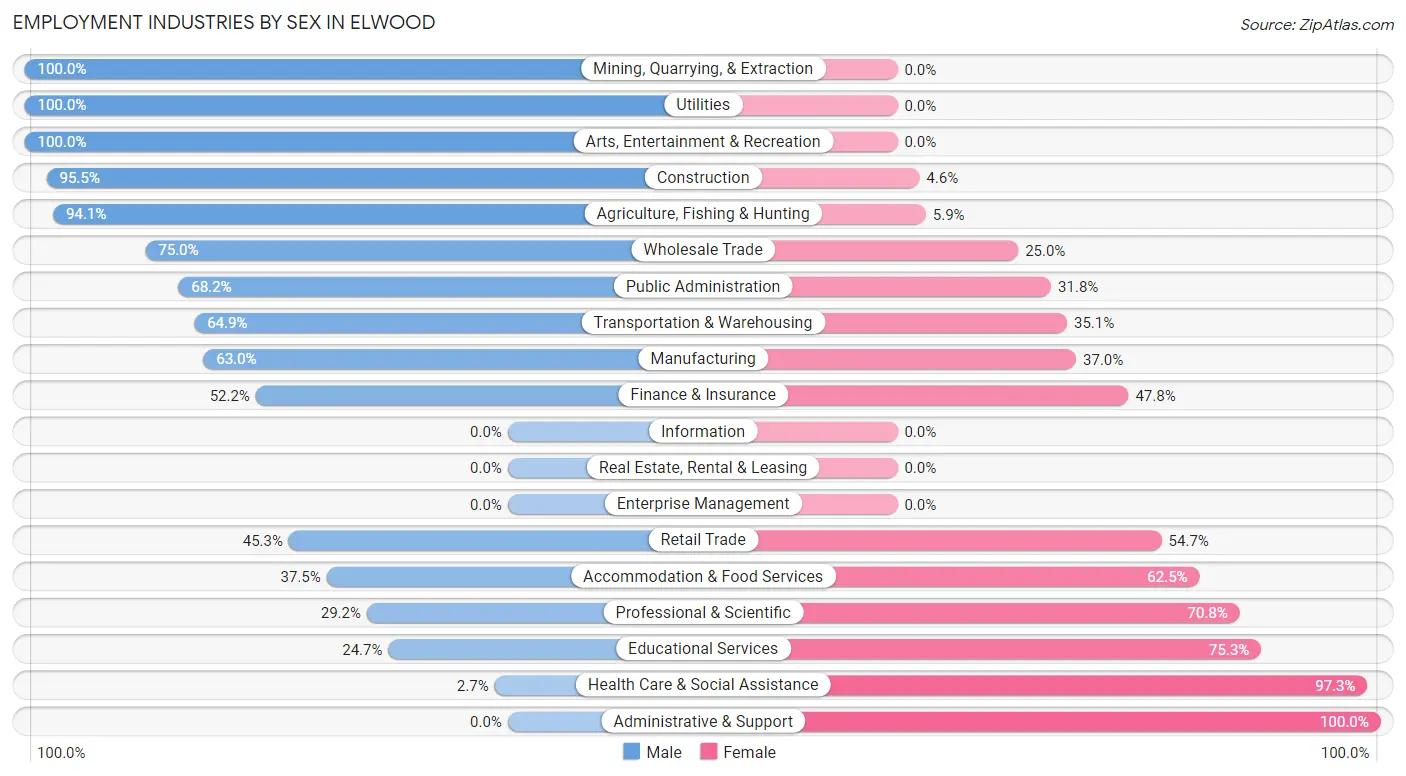
Employment Industries by Sex in Elwood
The Elwood industries that see more men than women are Mining, Quarrying, & Extraction (100.0%), Utilities (100.0%), and Arts, Entertainment & Recreation (100.0%), whereas the industries that tend to have a higher number of women are Administrative & Support (100.0%), Health Care & Social Assistance (97.3%), and Educational Services (75.3%).
| Industry | Male | Female |
| Agriculture, Fishing & Hunting | 64 (94.1%) | 4 (5.9%) |
| Mining, Quarrying, & Extraction | 4 (100.0%) | 0 (0.0%) |
| Construction | 63 (95.5%) | 3 (4.5%) |
| Manufacturing | 92 (63.0%) | 54 (37.0%) |
| Wholesale Trade | 6 (75.0%) | 2 (25.0%) |
| Retail Trade | 58 (45.3%) | 70 (54.7%) |
| Transportation & Warehousing | 61 (64.9%) | 33 (35.1%) |
| Utilities | 2 (100.0%) | 0 (0.0%) |
| Information | 0 (0.0%) | 0 (0.0%) |
| Finance & Insurance | 12 (52.2%) | 11 (47.8%) |
| Real Estate, Rental & Leasing | 0 (0.0%) | 0 (0.0%) |
| Professional & Scientific | 7 (29.2%) | 17 (70.8%) |
| Enterprise Management | 0 (0.0%) | 0 (0.0%) |
| Administrative & Support | 0 (0.0%) | 4 (100.0%) |
| Educational Services | 22 (24.7%) | 67 (75.3%) |
| Health Care & Social Assistance | 2 (2.7%) | 71 (97.3%) |
| Arts, Entertainment & Recreation | 12 (100.0%) | 0 (0.0%) |
| Accommodation & Food Services | 6 (37.5%) | 10 (62.5%) |
| Public Administration | 30 (68.2%) | 14 (31.8%) |
| Total | 455 (54.0%) | 388 (46.0%) |
Education in Elwood
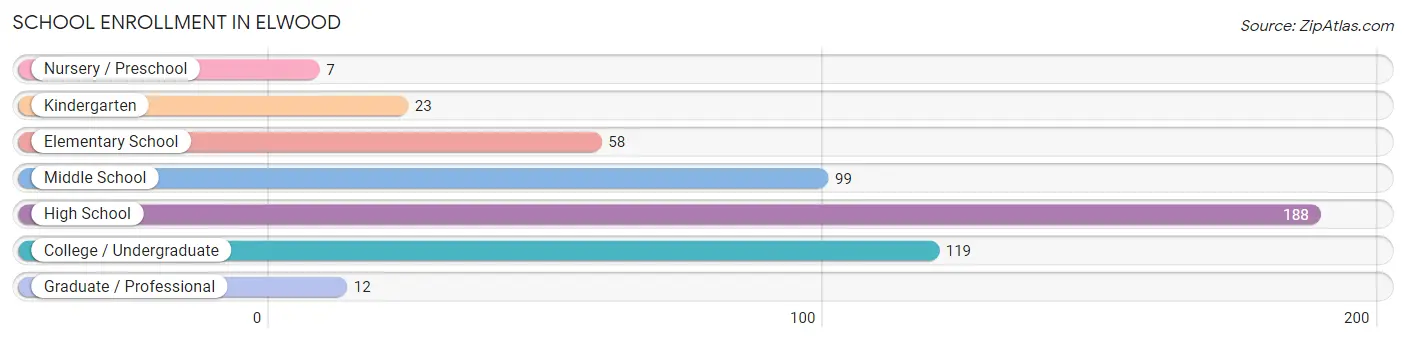
School Enrollment in Elwood
The most common levels of schooling among the 506 students in Elwood are high school (188 | 37.1%), college / undergraduate (119 | 23.5%), and middle school (99 | 19.6%).
| School Level | # Students | % Students |
| Nursery / Preschool | 7 | 1.4% |
| Kindergarten | 23 | 4.5% |
| Elementary School | 58 | 11.5% |
| Middle School | 99 | 19.6% |
| High School | 188 | 37.1% |
| College / Undergraduate | 119 | 23.5% |
| Graduate / Professional | 12 | 2.4% |
| Total | 506 | 100.0% |
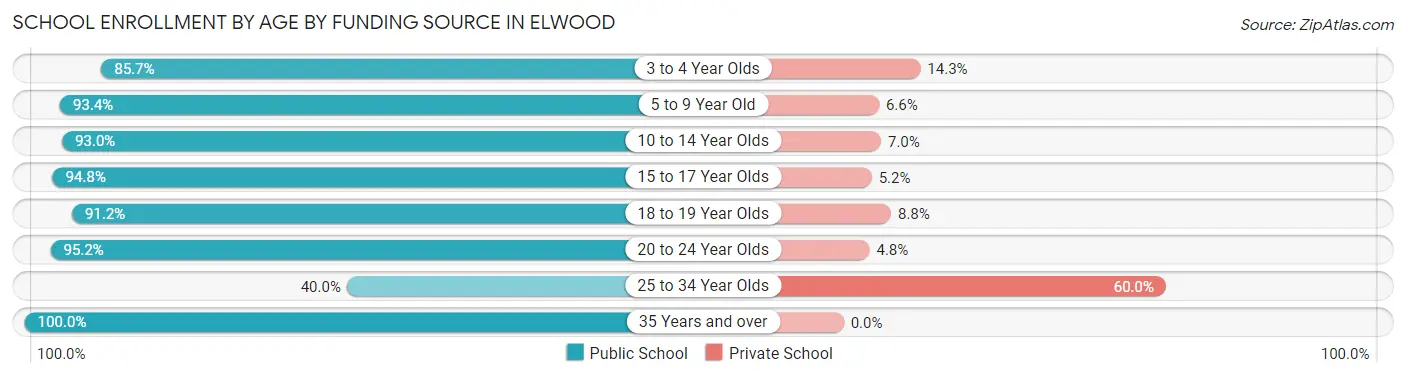
School Enrollment by Age by Funding Source in Elwood
Out of a total of 506 students who are enrolled in schools in Elwood, 36 (7.1%) attend a private institution, while the remaining 470 (92.9%) are enrolled in public schools. The age group of 25 to 34 year olds has the highest likelihood of being enrolled in private schools, with 6 (60.0% in the age bracket) enrolled. Conversely, the age group of 35 years and over has the lowest likelihood of being enrolled in a private school, with 23 (100.0% in the age bracket) attending a public institution.
| Age Bracket | Public School | Private School |
| 3 to 4 Year Olds | 6 (85.7%) | 1 (14.3%) |
| 5 to 9 Year Old | 71 (93.4%) | 5 (6.6%) |
| 10 to 14 Year Olds | 147 (93.0%) | 11 (7.0%) |
| 15 to 17 Year Olds | 109 (94.8%) | 6 (5.2%) |
| 18 to 19 Year Olds | 31 (91.2%) | 3 (8.8%) |
| 20 to 24 Year Olds | 79 (95.2%) | 4 (4.8%) |
| 25 to 34 Year Olds | 4 (40.0%) | 6 (60.0%) |
| 35 Years and over | 23 (100.0%) | 0 (0.0%) |
| Total | 470 (92.9%) | 36 (7.1%) |
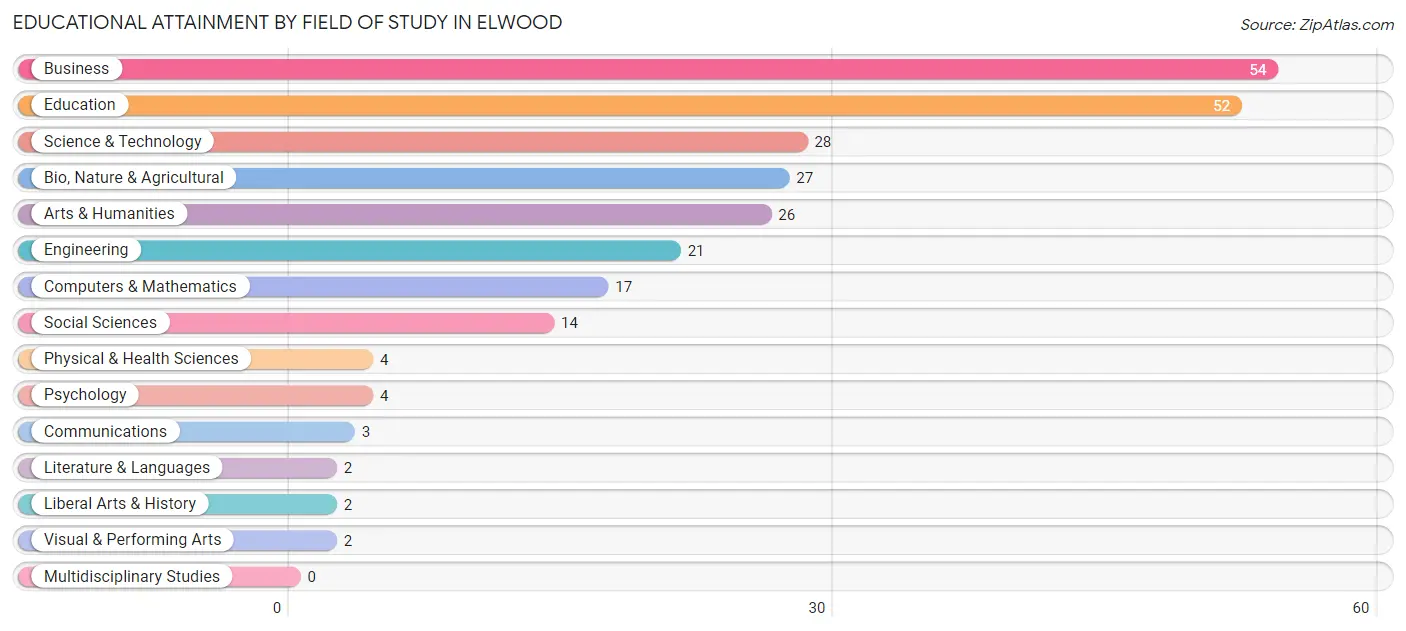
Educational Attainment by Field of Study in Elwood
Business (54 | 21.1%), education (52 | 20.3%), science & technology (28 | 10.9%), bio, nature & agricultural (27 | 10.5%), and arts & humanities (26 | 10.2%) are the most common fields of study among 256 individuals in Elwood who have obtained a bachelor's degree or higher.
| Field of Study | # Graduates | % Graduates |
| Computers & Mathematics | 17 | 6.6% |
| Bio, Nature & Agricultural | 27 | 10.5% |
| Physical & Health Sciences | 4 | 1.6% |
| Psychology | 4 | 1.6% |
| Social Sciences | 14 | 5.5% |
| Engineering | 21 | 8.2% |
| Multidisciplinary Studies | 0 | 0.0% |
| Science & Technology | 28 | 10.9% |
| Business | 54 | 21.1% |
| Education | 52 | 20.3% |
| Literature & Languages | 2 | 0.8% |
| Liberal Arts & History | 2 | 0.8% |
| Visual & Performing Arts | 2 | 0.8% |
| Communications | 3 | 1.2% |
| Arts & Humanities | 26 | 10.2% |
| Total | 256 | 100.0% |
Transportation & Commute in Elwood
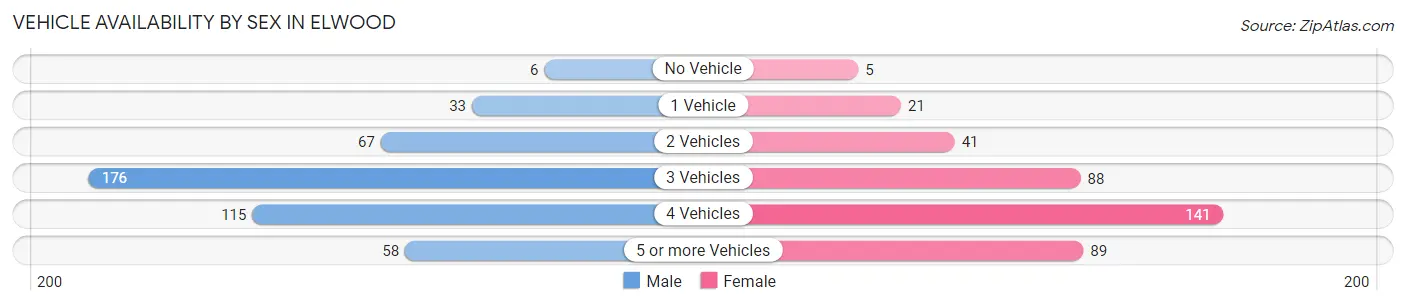
Vehicle Availability by Sex in Elwood
The most prevalent vehicle ownership categories in Elwood are males with 3 vehicles (176, accounting for 38.7%) and females with 3 vehicles (88, making up 45.7%).
| Vehicles Available | Male | Female |
| No Vehicle | 6 (1.3%) | 5 (1.3%) |
| 1 Vehicle | 33 (7.2%) | 21 (5.4%) |
| 2 Vehicles | 67 (14.7%) | 41 (10.6%) |
| 3 Vehicles | 176 (38.7%) | 88 (22.9%) |
| 4 Vehicles | 115 (25.3%) | 141 (36.6%) |
| 5 or more Vehicles | 58 (12.8%) | 89 (23.1%) |
| Total | 455 (100.0%) | 385 (100.0%) |
Commute Time in Elwood
The most frequently occuring commute durations in Elwood are 10 to 14 minutes (183 commuters, 23.9%), 5 to 9 minutes (121 commuters, 15.8%), and 45 to 59 minutes (87 commuters, 11.3%).
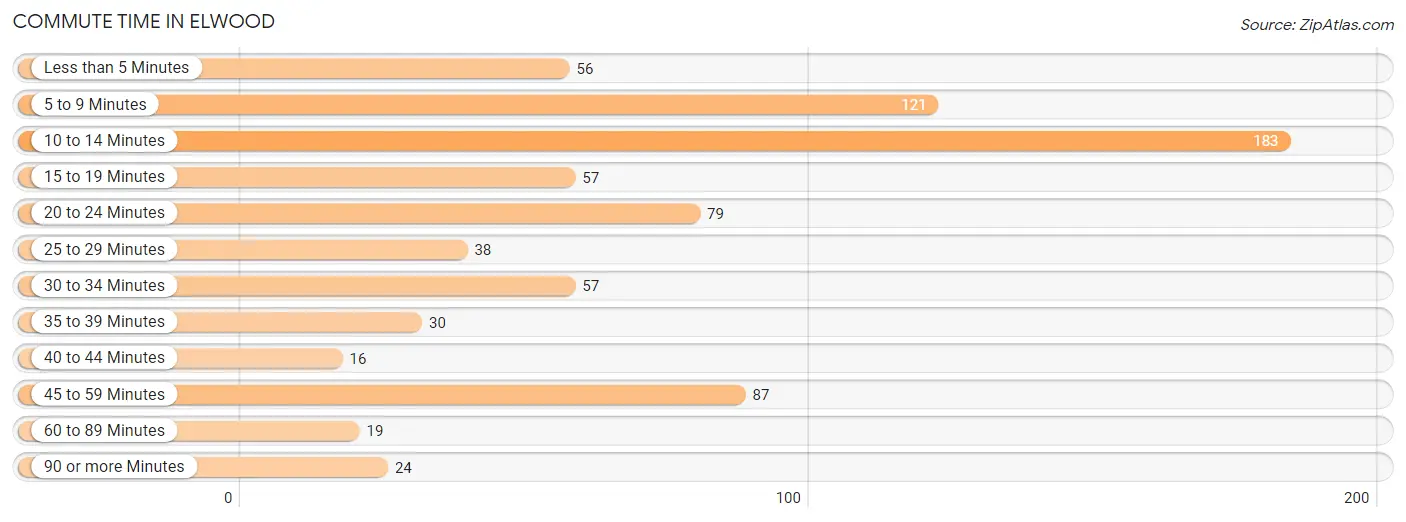
| Commute Time | # Commuters | % Commuters |
| Less than 5 Minutes | 56 | 7.3% |
| 5 to 9 Minutes | 121 | 15.8% |
| 10 to 14 Minutes | 183 | 23.9% |
| 15 to 19 Minutes | 57 | 7.4% |
| 20 to 24 Minutes | 79 | 10.3% |
| 25 to 29 Minutes | 38 | 5.0% |
| 30 to 34 Minutes | 57 | 7.4% |
| 35 to 39 Minutes | 30 | 3.9% |
| 40 to 44 Minutes | 16 | 2.1% |
| 45 to 59 Minutes | 87 | 11.3% |
| 60 to 89 Minutes | 19 | 2.5% |
| 90 or more Minutes | 24 | 3.1% |
Commute Time by Sex in Elwood
The most common commute times in Elwood are 10 to 14 minutes (107 commuters, 27.1%) for males and 10 to 14 minutes (76 commuters, 20.4%) for females.
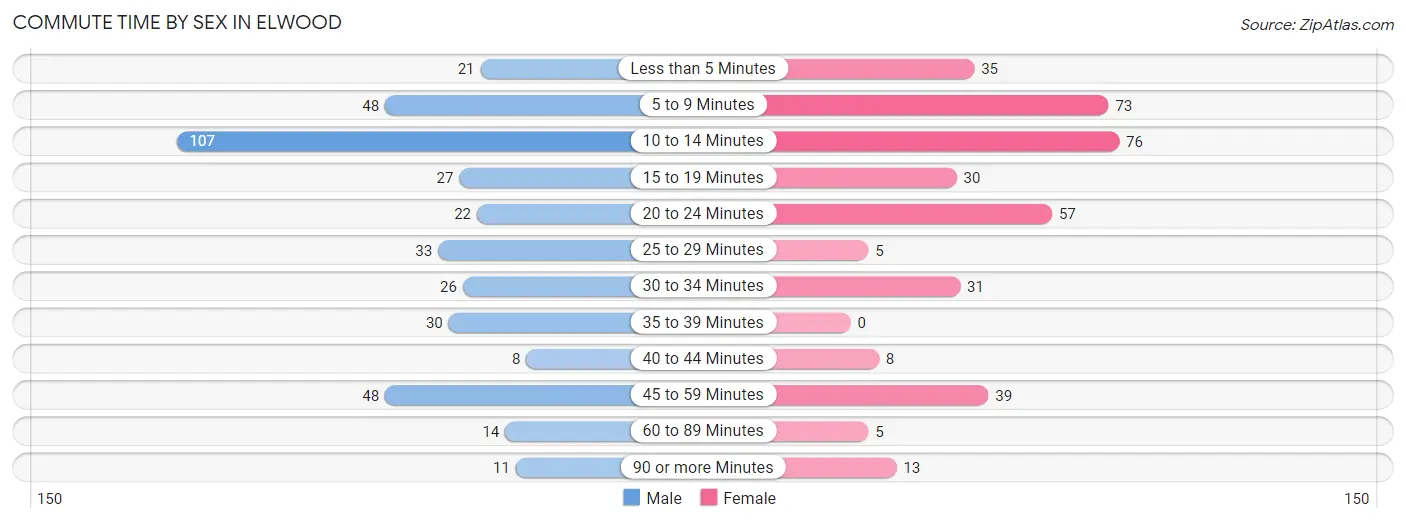
| Commute Time | Male | Female |
| Less than 5 Minutes | 21 (5.3%) | 35 (9.4%) |
| 5 to 9 Minutes | 48 (12.1%) | 73 (19.6%) |
| 10 to 14 Minutes | 107 (27.1%) | 76 (20.4%) |
| 15 to 19 Minutes | 27 (6.8%) | 30 (8.1%) |
| 20 to 24 Minutes | 22 (5.6%) | 57 (15.3%) |
| 25 to 29 Minutes | 33 (8.4%) | 5 (1.3%) |
| 30 to 34 Minutes | 26 (6.6%) | 31 (8.3%) |
| 35 to 39 Minutes | 30 (7.6%) | 0 (0.0%) |
| 40 to 44 Minutes | 8 (2.0%) | 8 (2.1%) |
| 45 to 59 Minutes | 48 (12.1%) | 39 (10.5%) |
| 60 to 89 Minutes | 14 (3.5%) | 5 (1.3%) |
| 90 or more Minutes | 11 (2.8%) | 13 (3.5%) |
Time of Departure to Work by Sex in Elwood
The most frequent times of departure to work in Elwood are 12:00 AM to 4:59 AM (95, 24.0%) for males and 9:00 AM to 9:59 AM (64, 17.2%) for females.
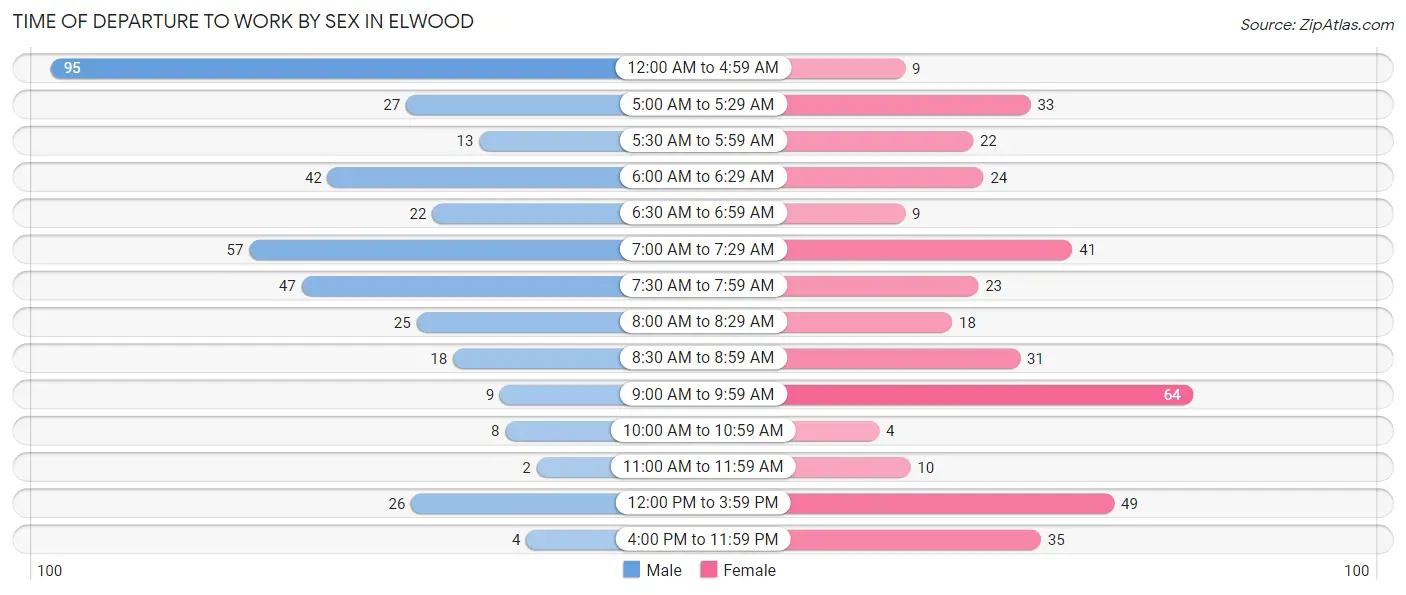
| Time of Departure | Male | Female |
| 12:00 AM to 4:59 AM | 95 (24.0%) | 9 (2.4%) |
| 5:00 AM to 5:29 AM | 27 (6.8%) | 33 (8.9%) |
| 5:30 AM to 5:59 AM | 13 (3.3%) | 22 (5.9%) |
| 6:00 AM to 6:29 AM | 42 (10.6%) | 24 (6.5%) |
| 6:30 AM to 6:59 AM | 22 (5.6%) | 9 (2.4%) |
| 7:00 AM to 7:29 AM | 57 (14.4%) | 41 (11.0%) |
| 7:30 AM to 7:59 AM | 47 (11.9%) | 23 (6.2%) |
| 8:00 AM to 8:29 AM | 25 (6.3%) | 18 (4.8%) |
| 8:30 AM to 8:59 AM | 18 (4.6%) | 31 (8.3%) |
| 9:00 AM to 9:59 AM | 9 (2.3%) | 64 (17.2%) |
| 10:00 AM to 10:59 AM | 8 (2.0%) | 4 (1.1%) |
| 11:00 AM to 11:59 AM | 2 (0.5%) | 10 (2.7%) |
| 12:00 PM to 3:59 PM | 26 (6.6%) | 49 (13.2%) |
| 4:00 PM to 11:59 PM | 4 (1.0%) | 35 (9.4%) |
| Total | 395 (100.0%) | 372 (100.0%) |
Housing Occupancy in Elwood
Occupancy by Ownership in Elwood
Of the total 441 dwellings in Elwood, owner-occupied units account for 419 (95.0%), while renter-occupied units make up 22 (5.0%).
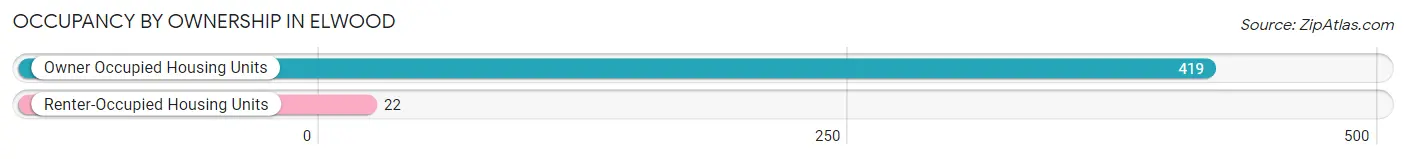
| Occupancy | # Housing Units | % Housing Units |
| Owner Occupied Housing Units | 419 | 95.0% |
| Renter-Occupied Housing Units | 22 | 5.0% |
| Total Occupied Housing Units | 441 | 100.0% |
Occupancy by Household Size in Elwood
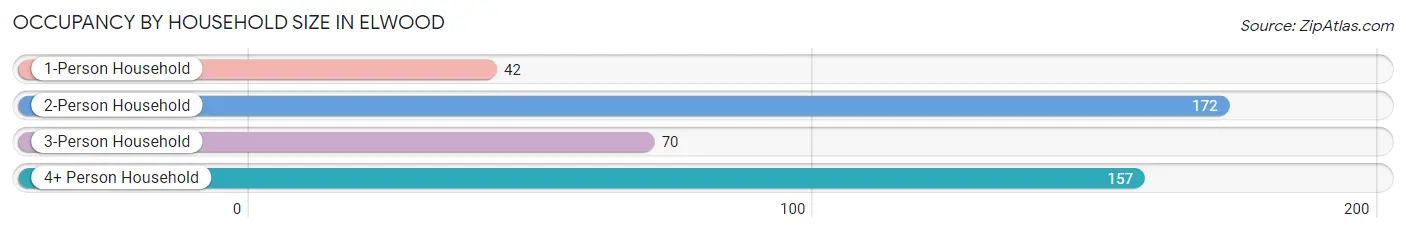
| Household Size | # Housing Units | % Housing Units |
| 1-Person Household | 42 | 9.5% |
| 2-Person Household | 172 | 39.0% |
| 3-Person Household | 70 | 15.9% |
| 4+ Person Household | 157 | 35.6% |
| Total Housing Units | 441 | 100.0% |
Occupancy by Ownership by Household Size in Elwood
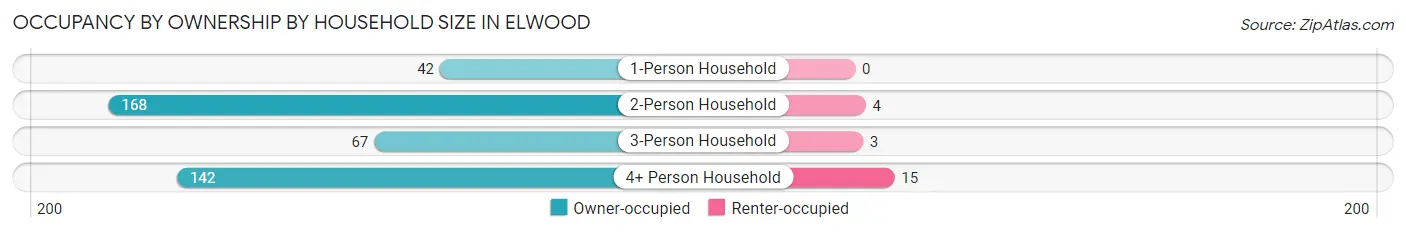
| Household Size | Owner-occupied | Renter-occupied |
| 1-Person Household | 42 (100.0%) | 0 (0.0%) |
| 2-Person Household | 168 (97.7%) | 4 (2.3%) |
| 3-Person Household | 67 (95.7%) | 3 (4.3%) |
| 4+ Person Household | 142 (90.4%) | 15 (9.6%) |
| Total Housing Units | 419 (95.0%) | 22 (5.0%) |
Occupancy by Educational Attainment in Elwood
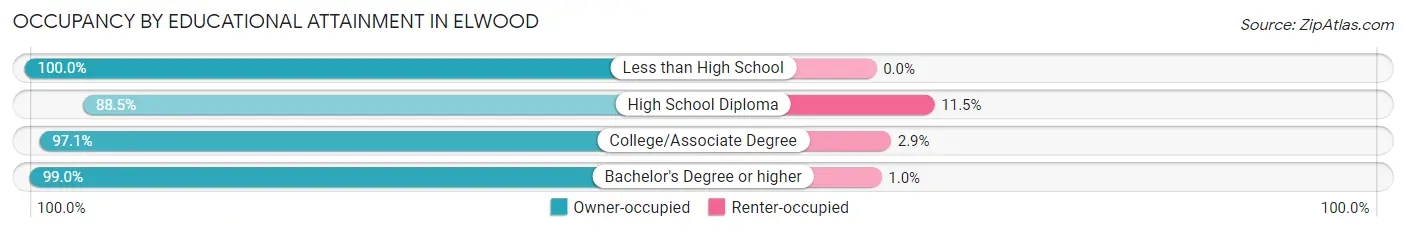
| Household Size | Owner-occupied | Renter-occupied |
| Less than High School | 6 (100.0%) | 0 (0.0%) |
| High School Diploma | 115 (88.5%) | 15 (11.5%) |
| College/Associate Degree | 201 (97.1%) | 6 (2.9%) |
| Bachelor's Degree or higher | 97 (99.0%) | 1 (1.0%) |
Occupancy by Age of Householder in Elwood
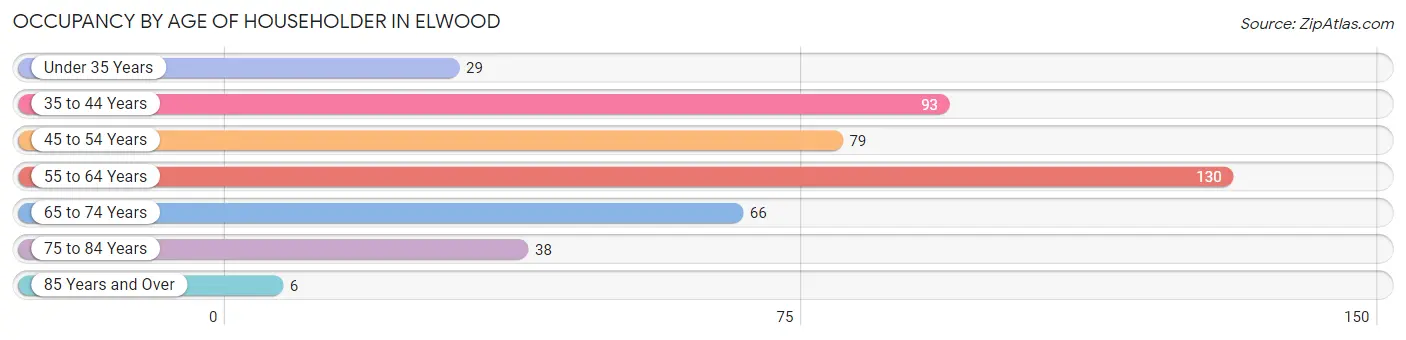
| Age Bracket | # Households | % Households |
| Under 35 Years | 29 | 6.6% |
| 35 to 44 Years | 93 | 21.1% |
| 45 to 54 Years | 79 | 17.9% |
| 55 to 64 Years | 130 | 29.5% |
| 65 to 74 Years | 66 | 15.0% |
| 75 to 84 Years | 38 | 8.6% |
| 85 Years and Over | 6 | 1.4% |
| Total | 441 | 100.0% |
Housing Finances in Elwood
Median Income by Occupancy in Elwood
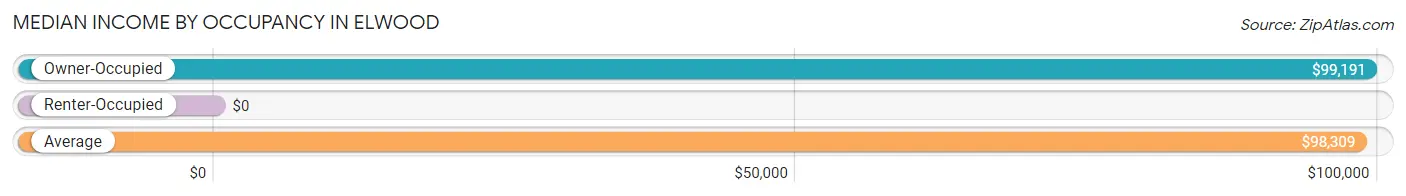
| Occupancy Type | # Households | Median Income |
| Owner-Occupied | 419 (95.0%) | $99,191 |
| Renter-Occupied | 22 (5.0%) | $0 |
| Average | 441 (100.0%) | $98,309 |
Occupancy by Householder Income Bracket in Elwood
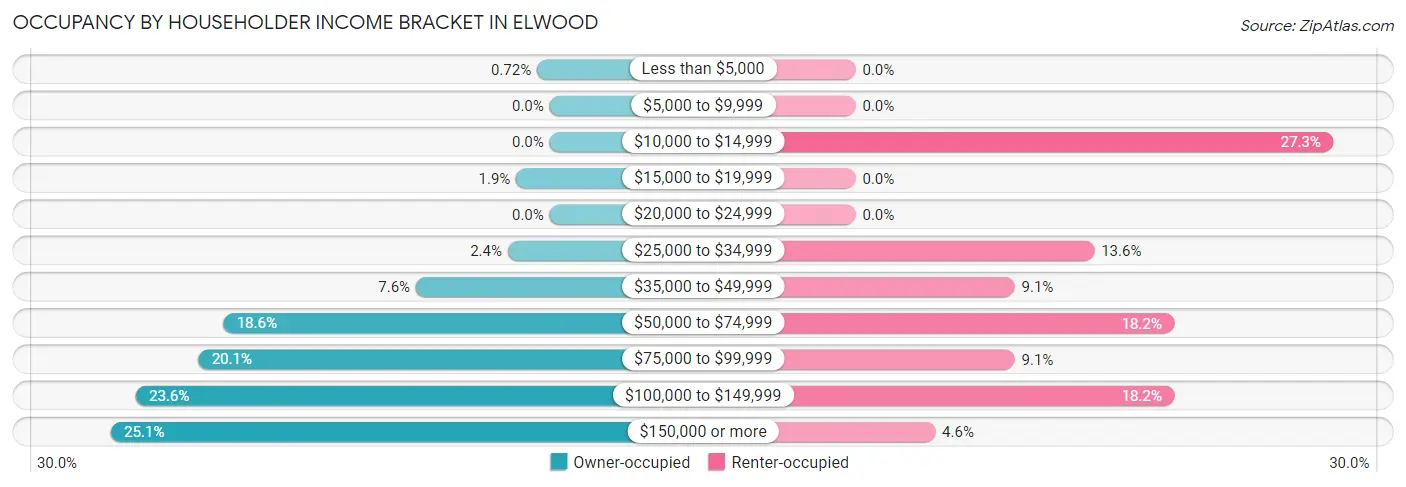
| Income Bracket | Owner-occupied | Renter-occupied |
| Less than $5,000 | 3 (0.7%) | 0 (0.0%) |
| $5,000 to $9,999 | 0 (0.0%) | 0 (0.0%) |
| $10,000 to $14,999 | 0 (0.0%) | 6 (27.3%) |
| $15,000 to $19,999 | 8 (1.9%) | 0 (0.0%) |
| $20,000 to $24,999 | 0 (0.0%) | 0 (0.0%) |
| $25,000 to $34,999 | 10 (2.4%) | 3 (13.6%) |
| $35,000 to $49,999 | 32 (7.6%) | 2 (9.1%) |
| $50,000 to $74,999 | 78 (18.6%) | 4 (18.2%) |
| $75,000 to $99,999 | 84 (20.1%) | 2 (9.1%) |
| $100,000 to $149,999 | 99 (23.6%) | 4 (18.2%) |
| $150,000 or more | 105 (25.1%) | 1 (4.5%) |
| Total | 419 (100.0%) | 22 (100.0%) |
Monthly Housing Cost Tiers in Elwood
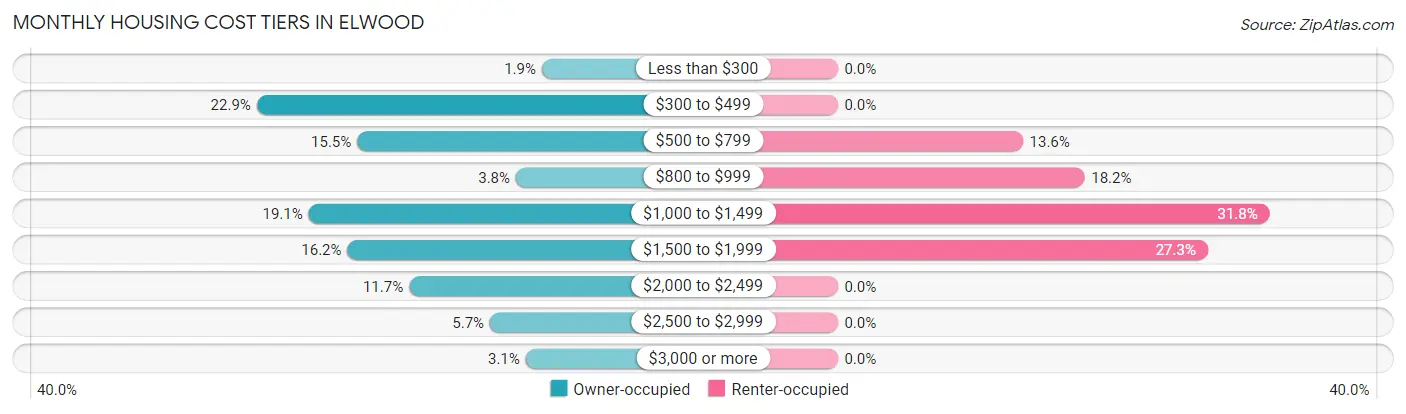
| Monthly Cost | Owner-occupied | Renter-occupied |
| Less than $300 | 8 (1.9%) | 0 (0.0%) |
| $300 to $499 | 96 (22.9%) | 0 (0.0%) |
| $500 to $799 | 65 (15.5%) | 3 (13.6%) |
| $800 to $999 | 16 (3.8%) | 4 (18.2%) |
| $1,000 to $1,499 | 80 (19.1%) | 7 (31.8%) |
| $1,500 to $1,999 | 68 (16.2%) | 6 (27.3%) |
| $2,000 to $2,499 | 49 (11.7%) | 0 (0.0%) |
| $2,500 to $2,999 | 24 (5.7%) | 0 (0.0%) |
| $3,000 or more | 13 (3.1%) | 0 (0.0%) |
| Total | 419 (100.0%) | 22 (100.0%) |
Physical Housing Characteristics in Elwood
Housing Structures in Elwood
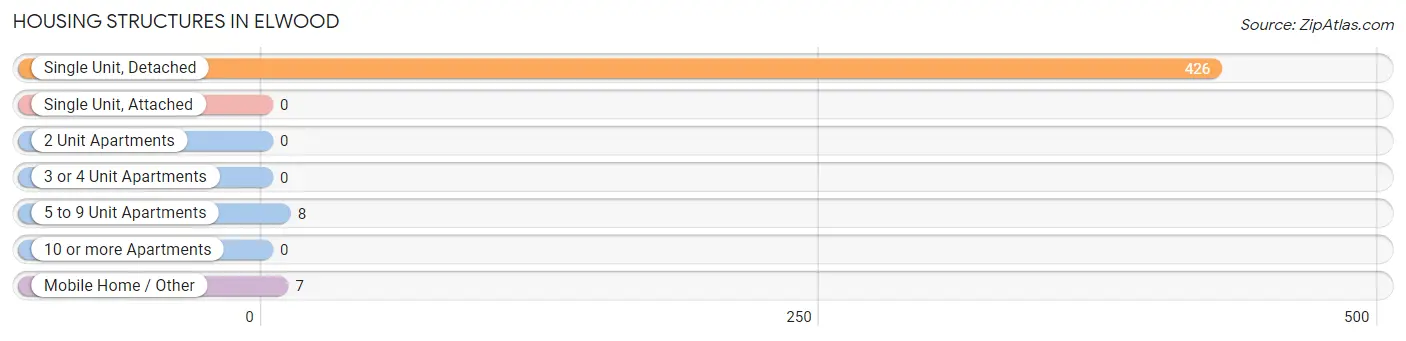
| Structure Type | # Housing Units | % Housing Units |
| Single Unit, Detached | 426 | 96.6% |
| Single Unit, Attached | 0 | 0.0% |
| 2 Unit Apartments | 0 | 0.0% |
| 3 or 4 Unit Apartments | 0 | 0.0% |
| 5 to 9 Unit Apartments | 8 | 1.8% |
| 10 or more Apartments | 0 | 0.0% |
| Mobile Home / Other | 7 | 1.6% |
| Total | 441 | 100.0% |
Housing Structures by Occupancy in Elwood
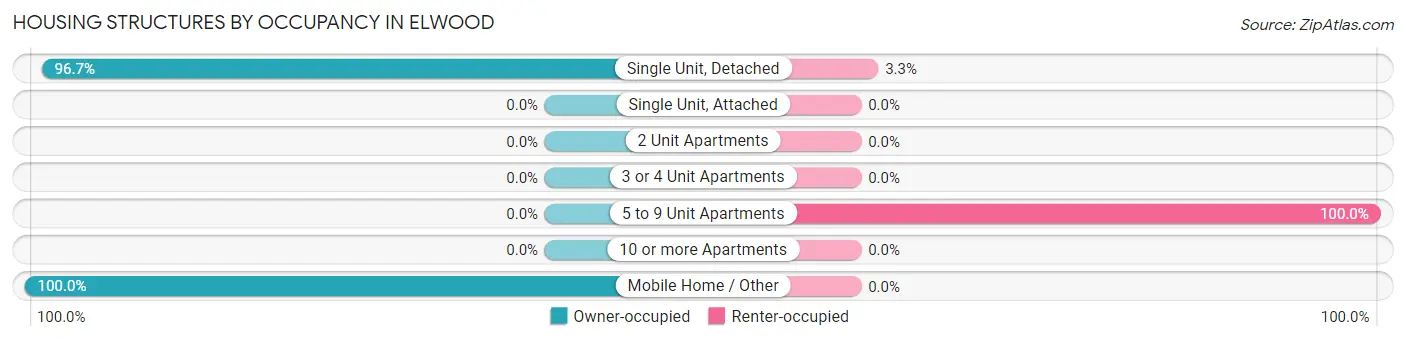
| Structure Type | Owner-occupied | Renter-occupied |
| Single Unit, Detached | 412 (96.7%) | 14 (3.3%) |
| Single Unit, Attached | 0 (0.0%) | 0 (0.0%) |
| 2 Unit Apartments | 0 (0.0%) | 0 (0.0%) |
| 3 or 4 Unit Apartments | 0 (0.0%) | 0 (0.0%) |
| 5 to 9 Unit Apartments | 0 (0.0%) | 8 (100.0%) |
| 10 or more Apartments | 0 (0.0%) | 0 (0.0%) |
| Mobile Home / Other | 7 (100.0%) | 0 (0.0%) |
| Total | 419 (95.0%) | 22 (5.0%) |
Housing Structures by Number of Rooms in Elwood
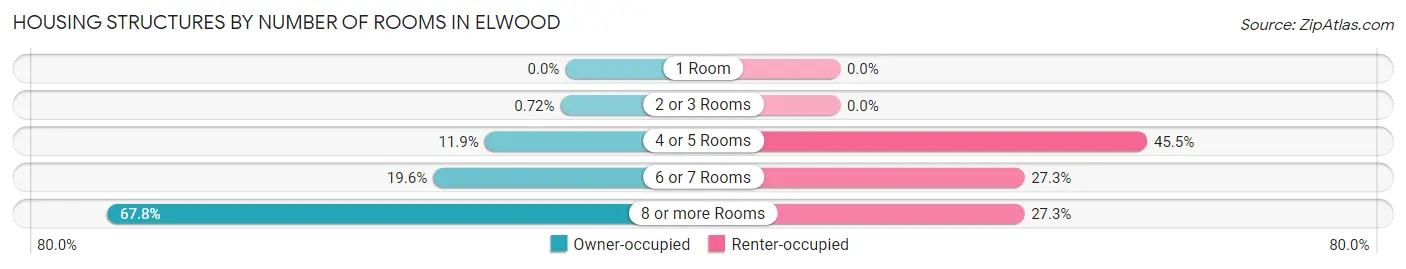
| Number of Rooms | Owner-occupied | Renter-occupied |
| 1 Room | 0 (0.0%) | 0 (0.0%) |
| 2 or 3 Rooms | 3 (0.7%) | 0 (0.0%) |
| 4 or 5 Rooms | 50 (11.9%) | 10 (45.5%) |
| 6 or 7 Rooms | 82 (19.6%) | 6 (27.3%) |
| 8 or more Rooms | 284 (67.8%) | 6 (27.3%) |
| Total | 419 (100.0%) | 22 (100.0%) |
Housing Structure by Heating Type in Elwood
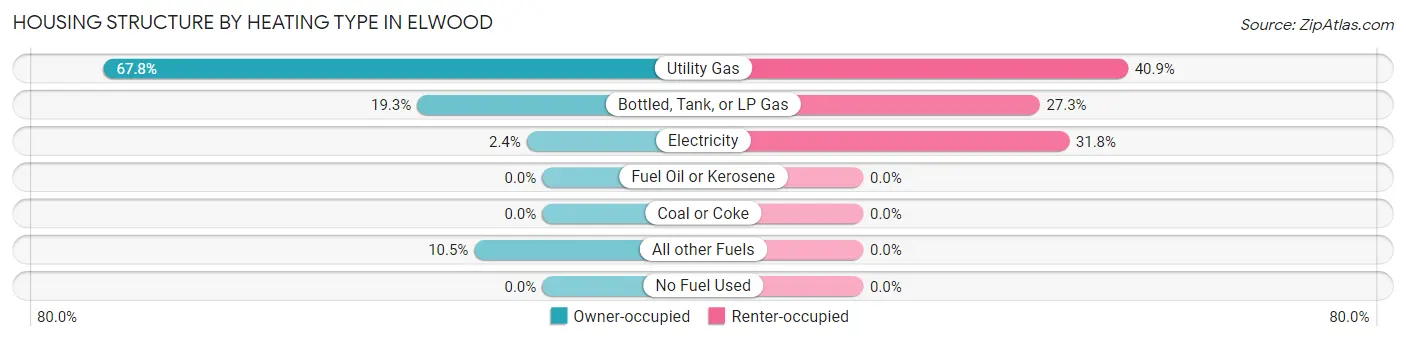
| Heating Type | Owner-occupied | Renter-occupied |
| Utility Gas | 284 (67.8%) | 9 (40.9%) |
| Bottled, Tank, or LP Gas | 81 (19.3%) | 6 (27.3%) |
| Electricity | 10 (2.4%) | 7 (31.8%) |
| Fuel Oil or Kerosene | 0 (0.0%) | 0 (0.0%) |
| Coal or Coke | 0 (0.0%) | 0 (0.0%) |
| All other Fuels | 44 (10.5%) | 0 (0.0%) |
| No Fuel Used | 0 (0.0%) | 0 (0.0%) |
| Total | 419 (100.0%) | 22 (100.0%) |
Household Vehicle Usage in Elwood
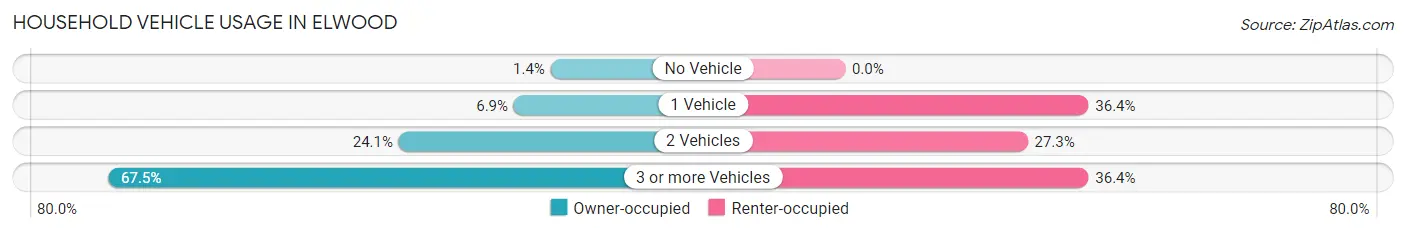
| Vehicles per Household | Owner-occupied | Renter-occupied |
| No Vehicle | 6 (1.4%) | 0 (0.0%) |
| 1 Vehicle | 29 (6.9%) | 8 (36.4%) |
| 2 Vehicles | 101 (24.1%) | 6 (27.3%) |
| 3 or more Vehicles | 283 (67.5%) | 8 (36.4%) |
| Total | 419 (100.0%) | 22 (100.0%) |
Real Estate & Mortgages in Elwood
Real Estate and Mortgage Overview in Elwood
| Characteristic | Without Mortgage | With Mortgage |
| Housing Units | 147 | 272 |
| Median Property Value | $319,400 | $420,000 |
| Median Household Income | $71,563 | $85 |
| Monthly Housing Costs | $452 | $13 |
| Real Estate Taxes | $2,280 | $2 |
Property Value by Mortgage Status in Elwood
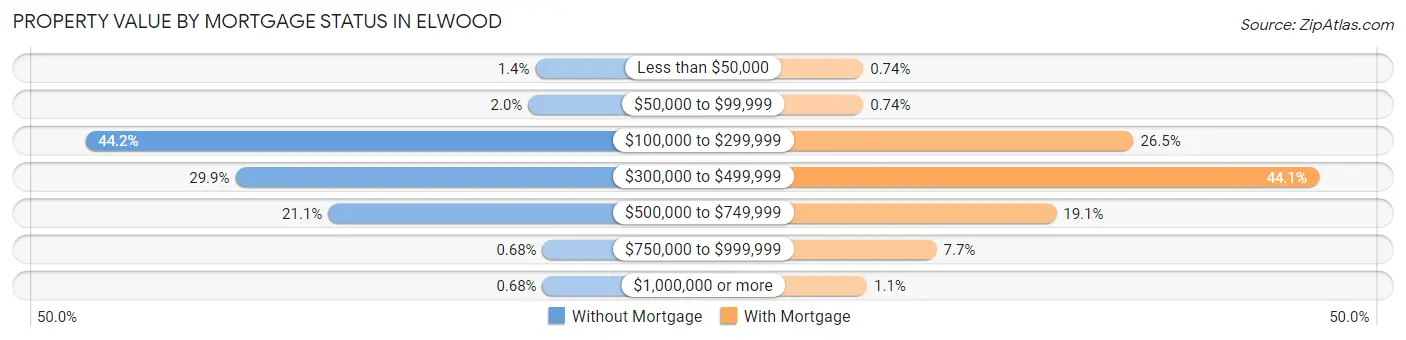
| Property Value | Without Mortgage | With Mortgage |
| Less than $50,000 | 2 (1.4%) | 2 (0.7%) |
| $50,000 to $99,999 | 3 (2.0%) | 2 (0.7%) |
| $100,000 to $299,999 | 65 (44.2%) | 72 (26.5%) |
| $300,000 to $499,999 | 44 (29.9%) | 120 (44.1%) |
| $500,000 to $749,999 | 31 (21.1%) | 52 (19.1%) |
| $750,000 to $999,999 | 1 (0.7%) | 21 (7.7%) |
| $1,000,000 or more | 1 (0.7%) | 3 (1.1%) |
| Total | 147 (100.0%) | 272 (100.0%) |
Household Income by Mortgage Status in Elwood
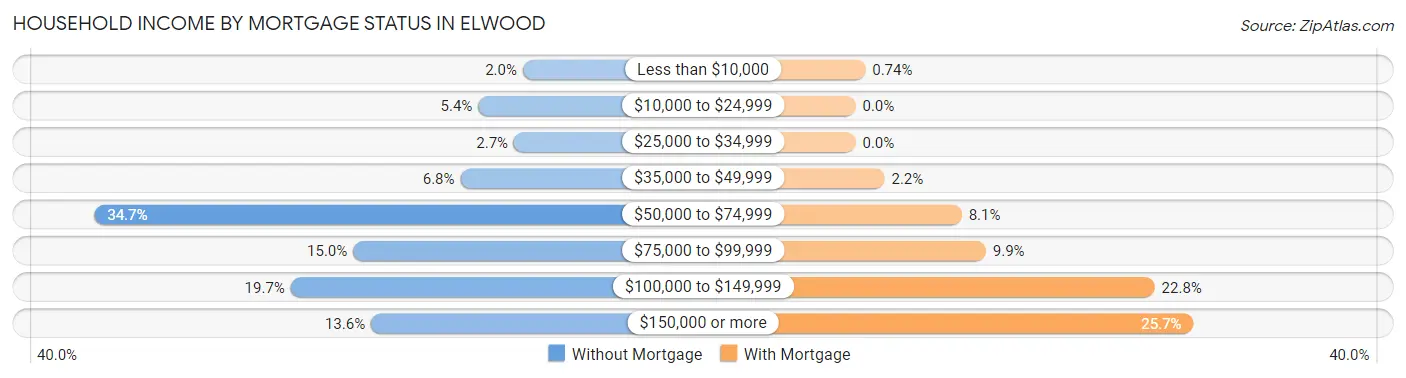
| Household Income | Without Mortgage | With Mortgage |
| Less than $10,000 | 3 (2.0%) | 2 (0.7%) |
| $10,000 to $24,999 | 8 (5.4%) | 0 (0.0%) |
| $25,000 to $34,999 | 4 (2.7%) | 0 (0.0%) |
| $35,000 to $49,999 | 10 (6.8%) | 6 (2.2%) |
| $50,000 to $74,999 | 51 (34.7%) | 22 (8.1%) |
| $75,000 to $99,999 | 22 (15.0%) | 27 (9.9%) |
| $100,000 to $149,999 | 29 (19.7%) | 62 (22.8%) |
| $150,000 or more | 20 (13.6%) | 70 (25.7%) |
| Total | 147 (100.0%) | 272 (100.0%) |
Property Value to Household Income Ratio in Elwood
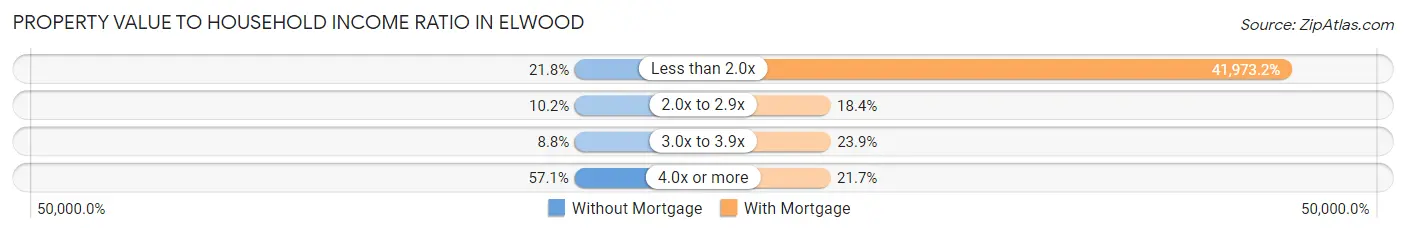
| Value-to-Income Ratio | Without Mortgage | With Mortgage |
| Less than 2.0x | 32 (21.8%) | 114,167 (41,973.2%) |
| 2.0x to 2.9x | 15 (10.2%) | 50 (18.4%) |
| 3.0x to 3.9x | 13 (8.8%) | 65 (23.9%) |
| 4.0x or more | 84 (57.1%) | 59 (21.7%) |
| Total | 147 (100.0%) | 272 (100.0%) |
Real Estate Taxes by Mortgage Status in Elwood
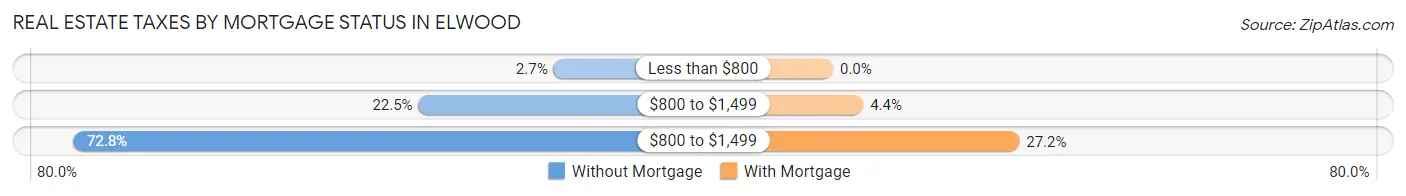
| Property Taxes | Without Mortgage | With Mortgage |
| Less than $800 | 4 (2.7%) | 0 (0.0%) |
| $800 to $1,499 | 33 (22.5%) | 12 (4.4%) |
| $800 to $1,499 | 107 (72.8%) | 74 (27.2%) |
| Total | 147 (100.0%) | 272 (100.0%) |
Health & Disability in Elwood
Health Insurance Coverage by Age in Elwood
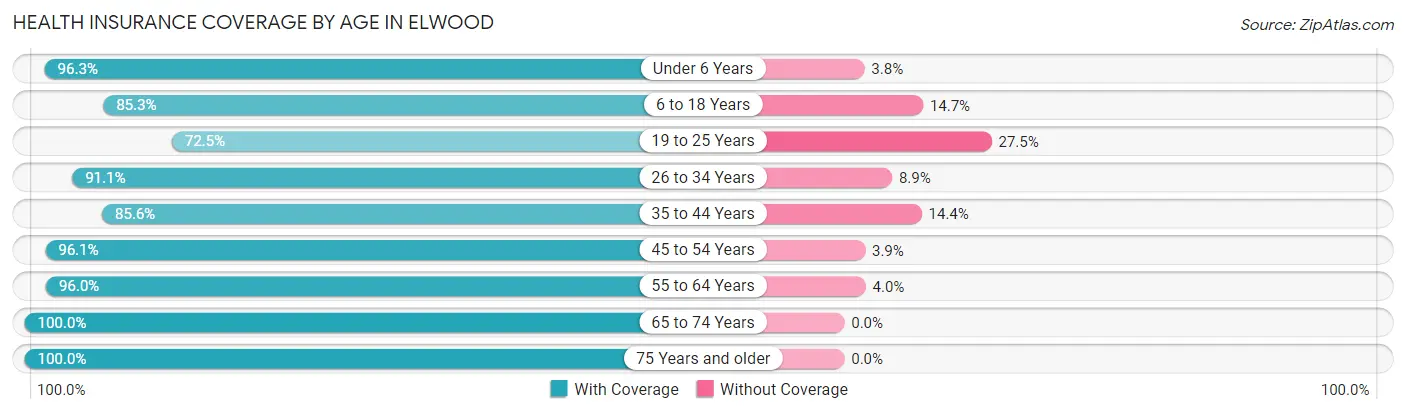
| Age Bracket | With Coverage | Without Coverage |
| Under 6 Years | 77 (96.3%) | 3 (3.7%) |
| 6 to 18 Years | 320 (85.3%) | 55 (14.7%) |
| 19 to 25 Years | 140 (72.5%) | 53 (27.5%) |
| 26 to 34 Years | 123 (91.1%) | 12 (8.9%) |
| 35 to 44 Years | 184 (85.6%) | 31 (14.4%) |
| 45 to 54 Years | 149 (96.1%) | 6 (3.9%) |
| 55 to 64 Years | 241 (96.0%) | 10 (4.0%) |
| 65 to 74 Years | 114 (100.0%) | 0 (0.0%) |
| 75 Years and older | 80 (100.0%) | 0 (0.0%) |
| Total | 1,428 (89.4%) | 170 (10.6%) |
Health Insurance Coverage by Citizenship Status in Elwood
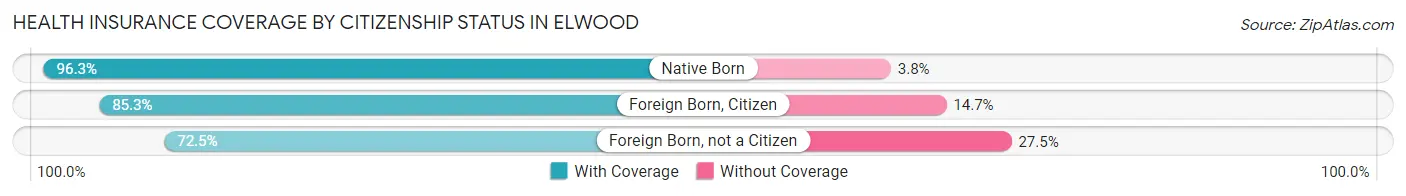
| Citizenship Status | With Coverage | Without Coverage |
| Native Born | 77 (96.3%) | 3 (3.7%) |
| Foreign Born, Citizen | 320 (85.3%) | 55 (14.7%) |
| Foreign Born, not a Citizen | 140 (72.5%) | 53 (27.5%) |
Health Insurance Coverage by Household Income in Elwood
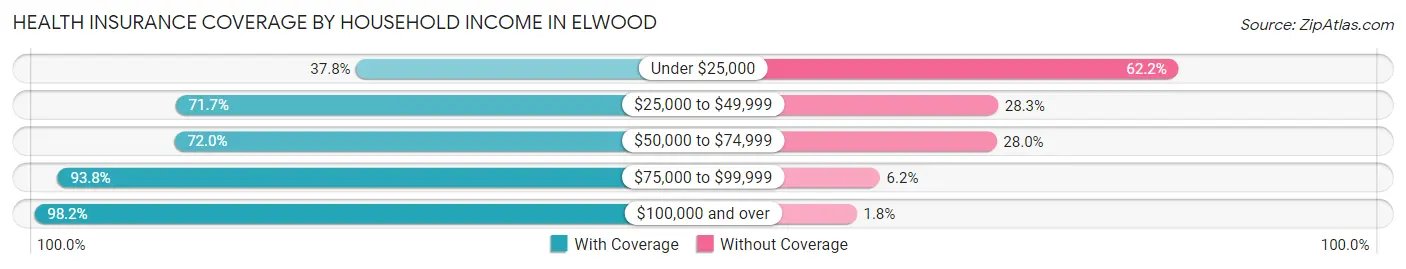
| Household Income | With Coverage | Without Coverage |
| Under $25,000 | 14 (37.8%) | 23 (62.2%) |
| $25,000 to $49,999 | 76 (71.7%) | 30 (28.3%) |
| $50,000 to $74,999 | 208 (72.0%) | 81 (28.0%) |
| $75,000 to $99,999 | 320 (93.8%) | 21 (6.2%) |
| $100,000 and over | 810 (98.2%) | 15 (1.8%) |
Public vs Private Health Insurance Coverage by Age in Elwood
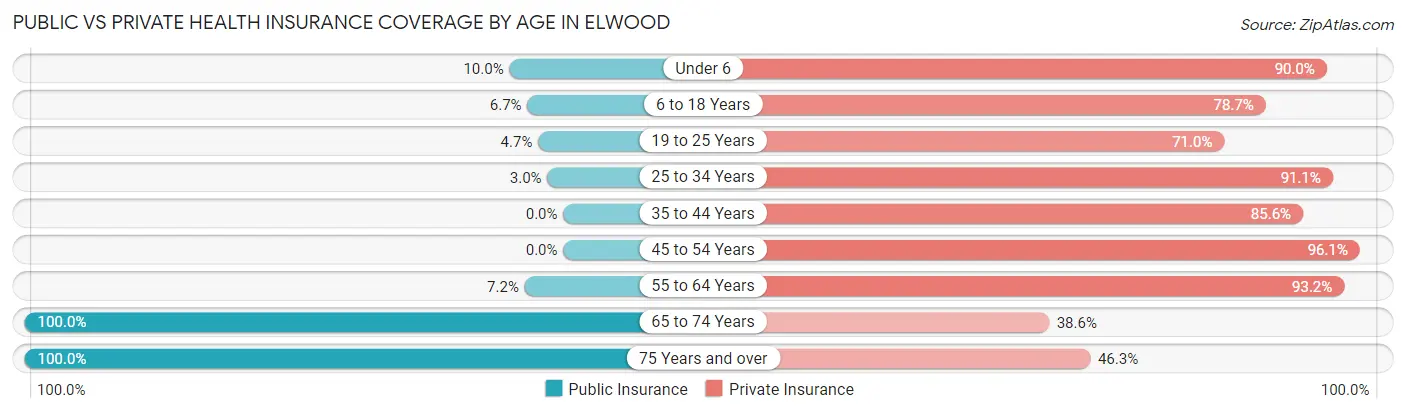
| Age Bracket | Public Insurance | Private Insurance |
| Under 6 | 8 (10.0%) | 72 (90.0%) |
| 6 to 18 Years | 25 (6.7%) | 295 (78.7%) |
| 19 to 25 Years | 9 (4.7%) | 137 (71.0%) |
| 25 to 34 Years | 4 (3.0%) | 123 (91.1%) |
| 35 to 44 Years | 0 (0.0%) | 184 (85.6%) |
| 45 to 54 Years | 0 (0.0%) | 149 (96.1%) |
| 55 to 64 Years | 18 (7.2%) | 234 (93.2%) |
| 65 to 74 Years | 114 (100.0%) | 44 (38.6%) |
| 75 Years and over | 80 (100.0%) | 37 (46.3%) |
| Total | 258 (16.2%) | 1,275 (79.8%) |
Disability Status by Sex by Age in Elwood
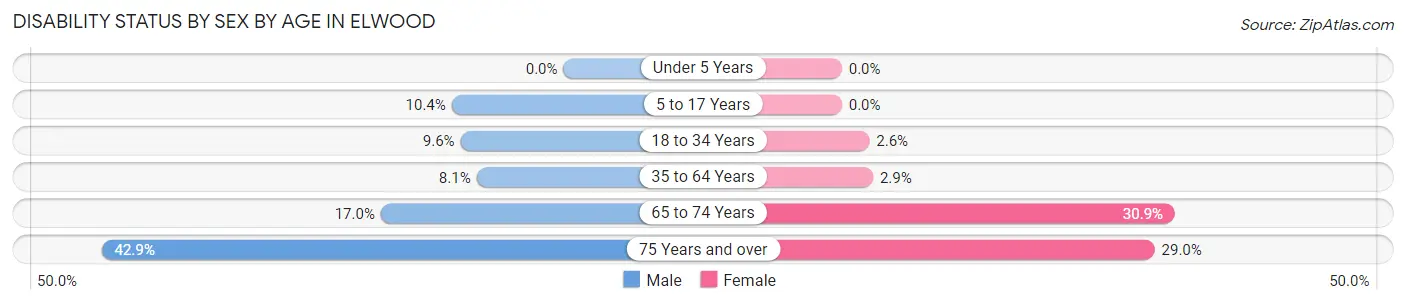
| Age Bracket | Male | Female |
| Under 5 Years | 0 (0.0%) | 0 (0.0%) |
| 5 to 17 Years | 17 (10.4%) | 0 (0.0%) |
| 18 to 34 Years | 15 (9.6%) | 5 (2.6%) |
| 35 to 64 Years | 25 (8.1%) | 9 (2.9%) |
| 65 to 74 Years | 10 (17.0%) | 17 (30.9%) |
| 75 Years and over | 21 (42.9%) | 9 (29.0%) |
Disability Class by Sex by Age in Elwood
Disability Class: Hearing Difficulty
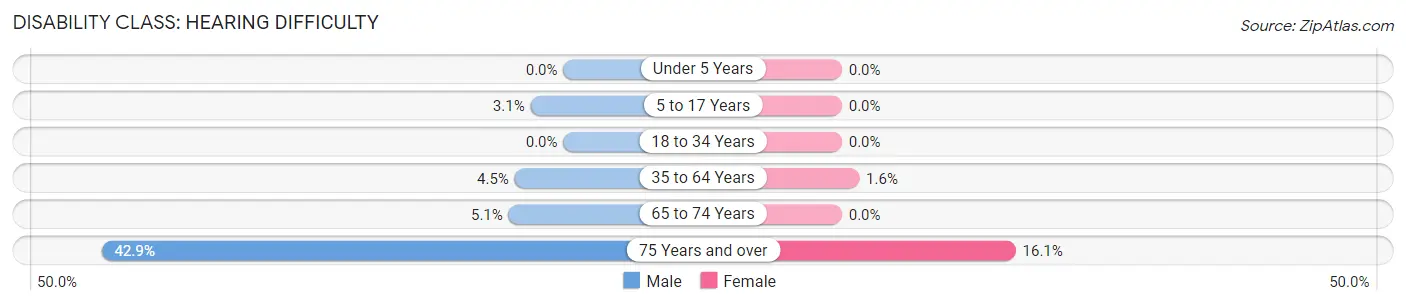
| Age Bracket | Male | Female |
| Under 5 Years | 0 (0.0%) | 0 (0.0%) |
| 5 to 17 Years | 5 (3.0%) | 0 (0.0%) |
| 18 to 34 Years | 0 (0.0%) | 0 (0.0%) |
| 35 to 64 Years | 14 (4.5%) | 5 (1.6%) |
| 65 to 74 Years | 3 (5.1%) | 0 (0.0%) |
| 75 Years and over | 21 (42.9%) | 5 (16.1%) |
Disability Class: Vision Difficulty
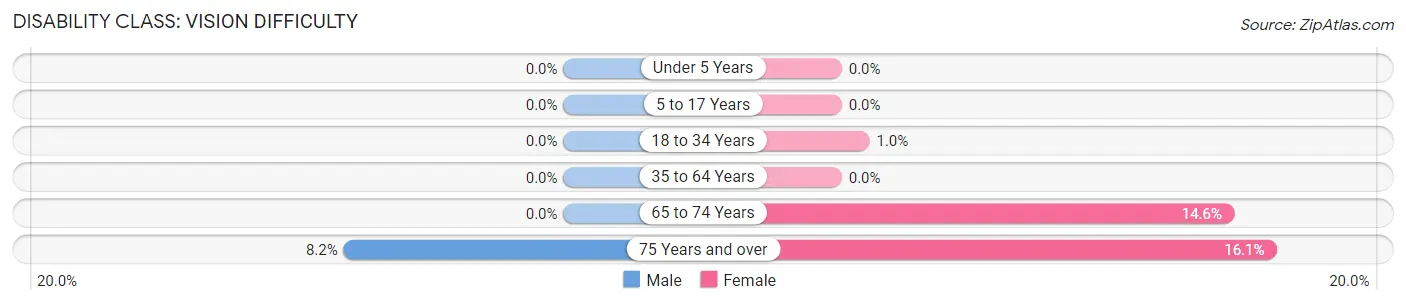
| Age Bracket | Male | Female |
| Under 5 Years | 0 (0.0%) | 0 (0.0%) |
| 5 to 17 Years | 0 (0.0%) | 0 (0.0%) |
| 18 to 34 Years | 0 (0.0%) | 2 (1.0%) |
| 35 to 64 Years | 0 (0.0%) | 0 (0.0%) |
| 65 to 74 Years | 0 (0.0%) | 8 (14.5%) |
| 75 Years and over | 4 (8.2%) | 5 (16.1%) |
Disability Class: Cognitive Difficulty
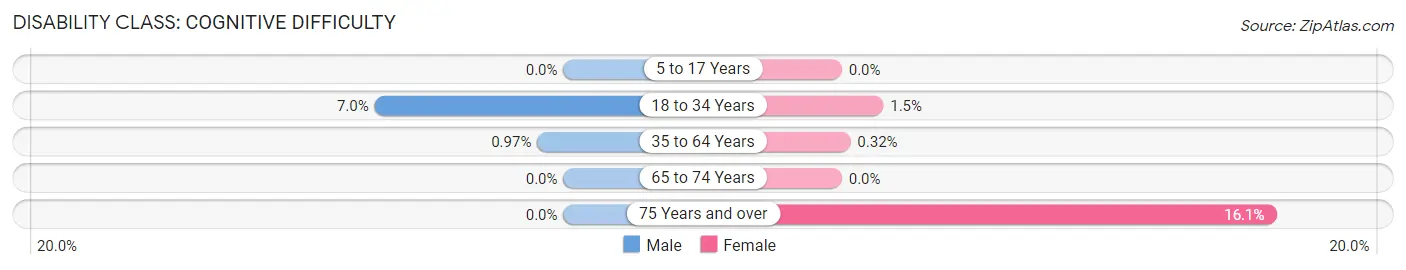
| Age Bracket | Male | Female |
| 5 to 17 Years | 0 (0.0%) | 0 (0.0%) |
| 18 to 34 Years | 11 (7.0%) | 3 (1.5%) |
| 35 to 64 Years | 3 (1.0%) | 1 (0.3%) |
| 65 to 74 Years | 0 (0.0%) | 0 (0.0%) |
| 75 Years and over | 0 (0.0%) | 5 (16.1%) |
Disability Class: Ambulatory Difficulty
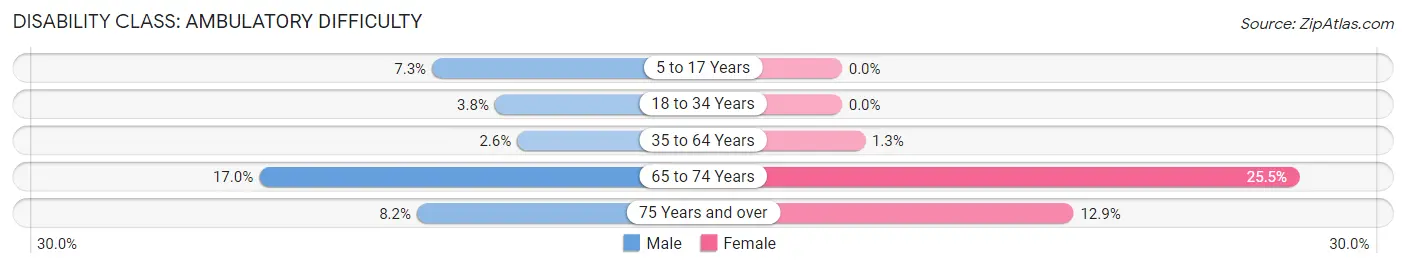
| Age Bracket | Male | Female |
| 5 to 17 Years | 12 (7.3%) | 0 (0.0%) |
| 18 to 34 Years | 6 (3.8%) | 0 (0.0%) |
| 35 to 64 Years | 8 (2.6%) | 4 (1.3%) |
| 65 to 74 Years | 10 (17.0%) | 14 (25.5%) |
| 75 Years and over | 4 (8.2%) | 4 (12.9%) |
Disability Class: Self-Care Difficulty
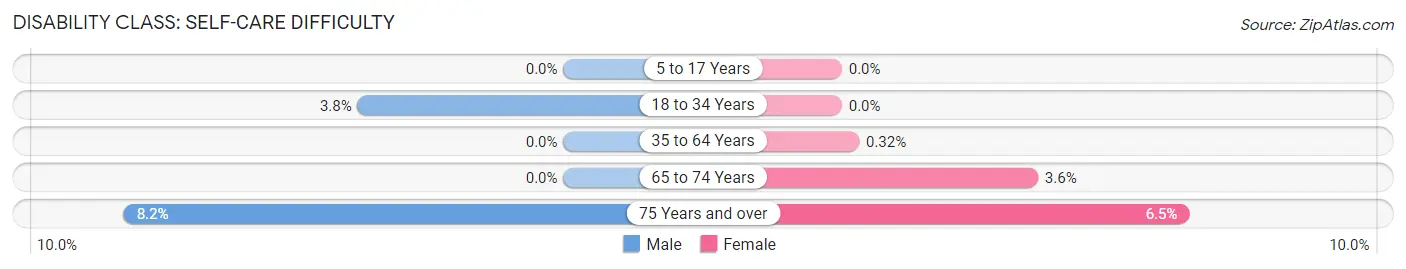
| Age Bracket | Male | Female |
| 5 to 17 Years | 0 (0.0%) | 0 (0.0%) |
| 18 to 34 Years | 6 (3.8%) | 0 (0.0%) |
| 35 to 64 Years | 0 (0.0%) | 1 (0.3%) |
| 65 to 74 Years | 0 (0.0%) | 2 (3.6%) |
| 75 Years and over | 4 (8.2%) | 2 (6.5%) |
Technology Access in Elwood
Computing Device Access in Elwood
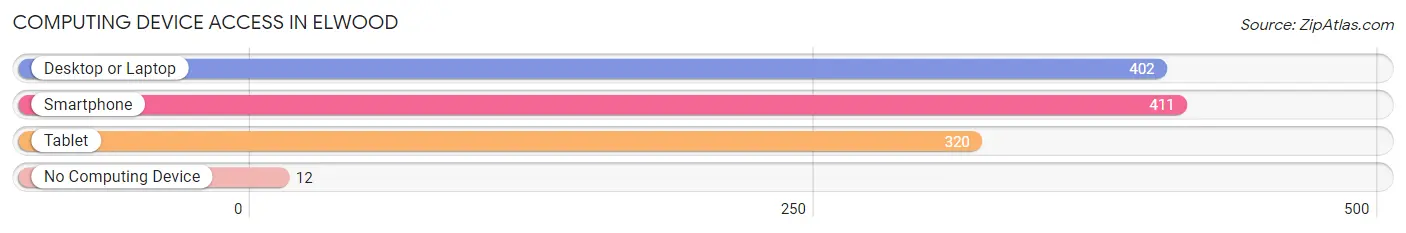
| Device Type | # Households | % Households |
| Desktop or Laptop | 402 | 91.2% |
| Smartphone | 411 | 93.2% |
| Tablet | 320 | 72.6% |
| No Computing Device | 12 | 2.7% |
| Total | 441 | 100.0% |
Internet Access in Elwood
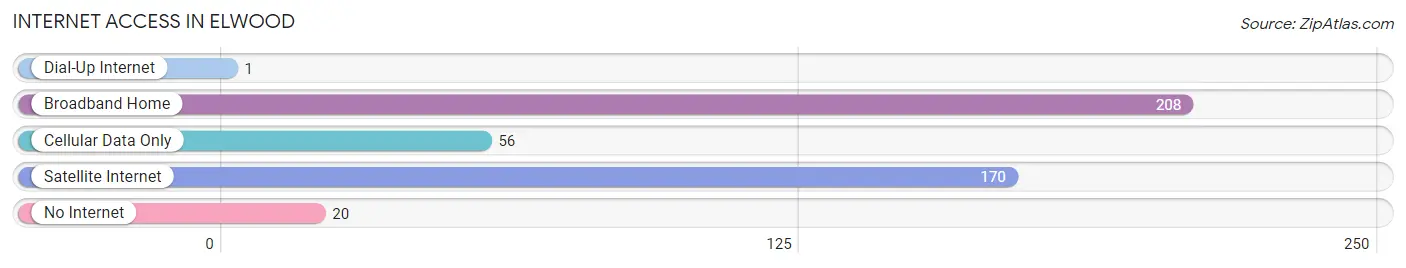
| Internet Type | # Households | % Households |
| Dial-Up Internet | 1 | 0.2% |
| Broadband Home | 208 | 47.2% |
| Cellular Data Only | 56 | 12.7% |
| Satellite Internet | 170 | 38.6% |
| No Internet | 20 | 4.5% |
| Total | 441 | 100.0% |
Elwood Summary
Elwood is a small town located in Box Elder County, Utah, United States. It is situated in the northern part of the state, about 20 miles north of Brigham City and about 40 miles west of the Idaho border. The population of Elwood was estimated to be 1,072 in 2019.
History
Elwood was first settled in 1864 by a group of Mormon pioneers led by William Elwood. The town was originally named Elwood City, but the name was later shortened to Elwood. The town was incorporated in 1891.
Elwood was a farming community for many years, but in the early 20th century, the town began to diversify its economy. The Elwood Canning Company was established in 1910, and the Elwood Creamery was established in 1912. The Elwood Mercantile Company was established in 1915, and the Elwood Lumber Company was established in 1916.
Geography
Elwood is located in the northern part of Box Elder County, Utah, about 20 miles north of Brigham City and about 40 miles west of the Idaho border. The town is situated at an elevation of 4,717 feet above sea level.
The town is located in a semi-arid climate zone, with hot summers and cold winters. The average annual temperature is 48.3°F, and the average annual precipitation is 11.3 inches.
Economy
Elwood’s economy is largely based on agriculture and manufacturing. The town is home to several food processing plants, including the Elwood Canning Company, the Elwood Creamery, and the Elwood Mercantile Company. The Elwood Lumber Company is also located in the town.
In addition to these businesses, Elwood is home to several small businesses, including restaurants, retail stores, and service providers. The town also has a small airport, which serves as a hub for private and commercial flights.
Demographics
As of 2019, the population of Elwood was estimated to be 1,072. The racial makeup of the town was 95.2% White, 0.9% Native American, 0.7% Asian, 0.3% Black, 0.2% Pacific Islander, and 2.7% from other races. The median household income was $45,938, and the median family income was $50,938. The median age was 33.7 years.
Conclusion
Elwood is a small town located in Box Elder County, Utah, United States. It was first settled in 1864 by a group of Mormon pioneers, and the town was incorporated in 1891. Elwood’s economy is largely based on agriculture and manufacturing, and the town is home to several small businesses. The population of Elwood was estimated to be 1,072 in 2019, and the median household income was $45,938.
Common Questions
What is the Total Population of Elwood?
Total Population of Elwood is 1,598.
What is the Total Male Population of Elwood?
Total Male Population of Elwood is 764.
What is the Total Female Population of Elwood?
Total Female Population of Elwood is 834.
What is the Ratio of Males per 100 Females in Elwood?
There are 91.61 Males per 100 Females in Elwood.
What is the Ratio of Females per 100 Males in Elwood?
There are 109.16 Females per 100 Males in Elwood.
What is the Median Population Age in Elwood?
Median Population Age in Elwood is 37.1 Years.
What is the Average Family Size in Elwood
Average Family Size in Elwood is 3.9 People.
What is the Average Household Size in Elwood
Average Household Size in Elwood is 3.6 People.
What is Per Capita Income in Elwood?
Per Capita income in Elwood is $35,280.
What is the Median Family Income in Elwood?
Median Family Income in Elwood is $101,125.
What is the Median Household income in Elwood?
Median Household Income in Elwood is $98,309.
What is Income or Wage Gap in Elwood?
Income or Wage Gap in Elwood is 56.3%.
Women in Elwood earn 43.7 cents for every dollar earned by a man.
What is Inequality or Gini Index in Elwood?
Inequality or Gini Index in Elwood is 0.35.
How Large is the Labor Force in Elwood?
There are 894 People in the Labor Forcein in Elwood.
What is the Percentage of People in the Labor Force in Elwood?
71.9% of People are in the Labor Force in Elwood.
What is the Unemployment Rate in Elwood?
Unemployment Rate in Elwood is 5.8%.