Apple Valley, UT
Apple Valley Map
Apple Valley Overview
1,233
TOTAL POPULATION
683
MALE POPULATION
550
FEMALE POPULATION
124.18
MALES / 100 FEMALES
80.53
FEMALES / 100 MALES
41.5
MEDIAN AGE
3.5
AVG FAMILY SIZE
3.1
AVG HOUSEHOLD SIZE
$29,054
PER CAPITA INCOME
$96,563
AVG FAMILY INCOME
$80,893
AVG HOUSEHOLD INCOME
53.4%
WAGE / INCOME GAP [ % ]
46.6¢/ $1
WAGE / INCOME GAP [ $ ]
0.32
INEQUALITY / GINI INDEX
602
LABOR FORCE [ PEOPLE ]
66.1%
PERCENT IN LABOR FORCE
6.8%
UNEMPLOYMENT RATE
Apple Valley Area Codes
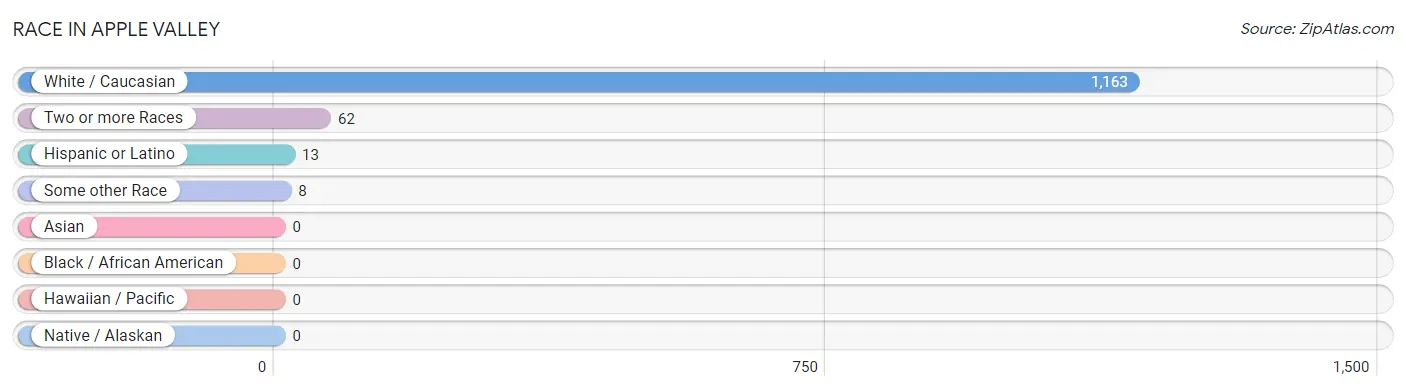
Race in Apple Valley
The most populous races in Apple Valley are White / Caucasian (1,163 | 94.3%), Two or more Races (62 | 5.0%), and Hispanic or Latino (13 | 1.1%).
| Race | # Population | % Population |
| Asian | 0 | 0.0% |
| Black / African American | 0 | 0.0% |
| Hawaiian / Pacific | 0 | 0.0% |
| Hispanic or Latino | 13 | 1.1% |
| Native / Alaskan | 0 | 0.0% |
| White / Caucasian | 1,163 | 94.3% |
| Two or more Races | 62 | 5.0% |
| Some other Race | 8 | 0.6% |
| Total | 1,233 | 100.0% |
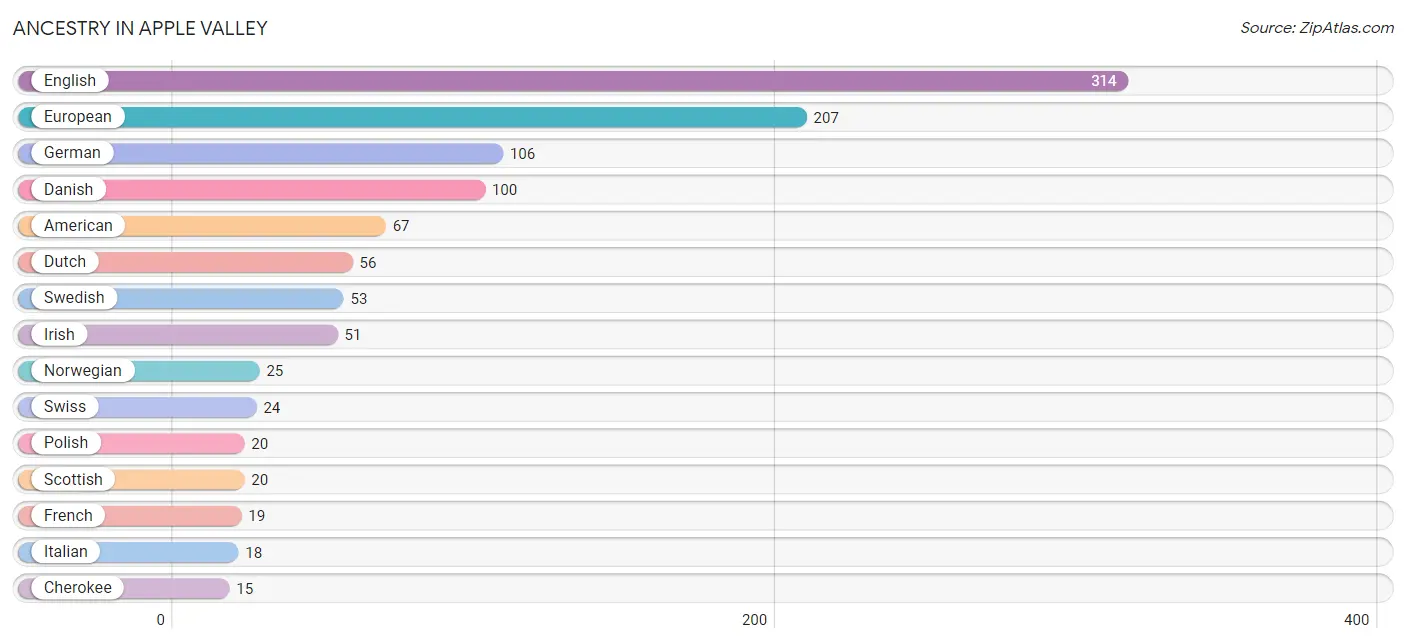
Ancestry in Apple Valley
The most populous ancestries reported in Apple Valley are English (314 | 25.5%), European (207 | 16.8%), German (106 | 8.6%), Danish (100 | 8.1%), and American (67 | 5.4%), together accounting for 64.4% of all Apple Valley residents.
| Ancestry | # Population | % Population |
| American | 67 | 5.4% |
| British | 8 | 0.6% |
| Cherokee | 15 | 1.2% |
| Czech | 9 | 0.7% |
| Danish | 100 | 8.1% |
| Dutch | 56 | 4.5% |
| English | 314 | 25.5% |
| European | 207 | 16.8% |
| French | 19 | 1.5% |
| French Canadian | 9 | 0.7% |
| German | 106 | 8.6% |
| Irish | 51 | 4.1% |
| Italian | 18 | 1.5% |
| Mexican | 8 | 0.6% |
| Navajo | 6 | 0.5% |
| Norwegian | 25 | 2.0% |
| Polish | 20 | 1.6% |
| Russian | 2 | 0.2% |
| Scandinavian | 4 | 0.3% |
| Scotch-Irish | 9 | 0.7% |
| Scottish | 20 | 1.6% |
| Slovene | 2 | 0.2% |
| Spaniard | 5 | 0.4% |
| Swedish | 53 | 4.3% |
| Swiss | 24 | 1.9% |
| Welsh | 7 | 0.6% | View All 26 Rows |
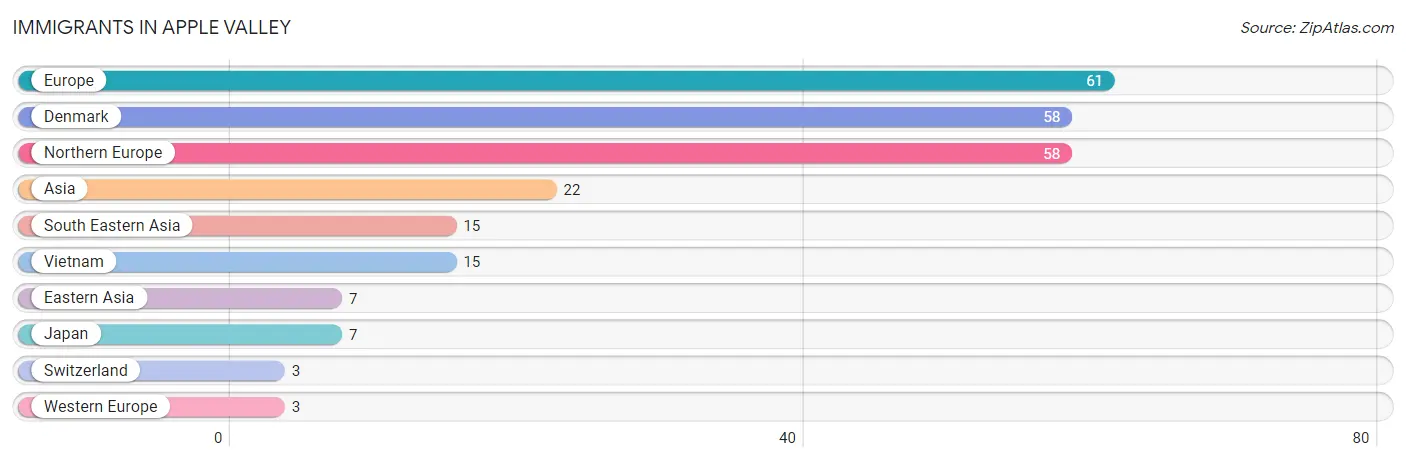
Immigrants in Apple Valley
The most numerous immigrant groups reported in Apple Valley came from Europe (61 | 5.0%), Denmark (58 | 4.7%), Northern Europe (58 | 4.7%), Asia (22 | 1.8%), and South Eastern Asia (15 | 1.2%), together accounting for 17.4% of all Apple Valley residents.
| Immigration Origin | # Population | % Population |
| Asia | 22 | 1.8% |
| Denmark | 58 | 4.7% |
| Eastern Asia | 7 | 0.6% |
| Europe | 61 | 5.0% |
| Japan | 7 | 0.6% |
| Northern Europe | 58 | 4.7% |
| South Eastern Asia | 15 | 1.2% |
| Switzerland | 3 | 0.2% |
| Vietnam | 15 | 1.2% |
| Western Europe | 3 | 0.2% | View All 10 Rows |
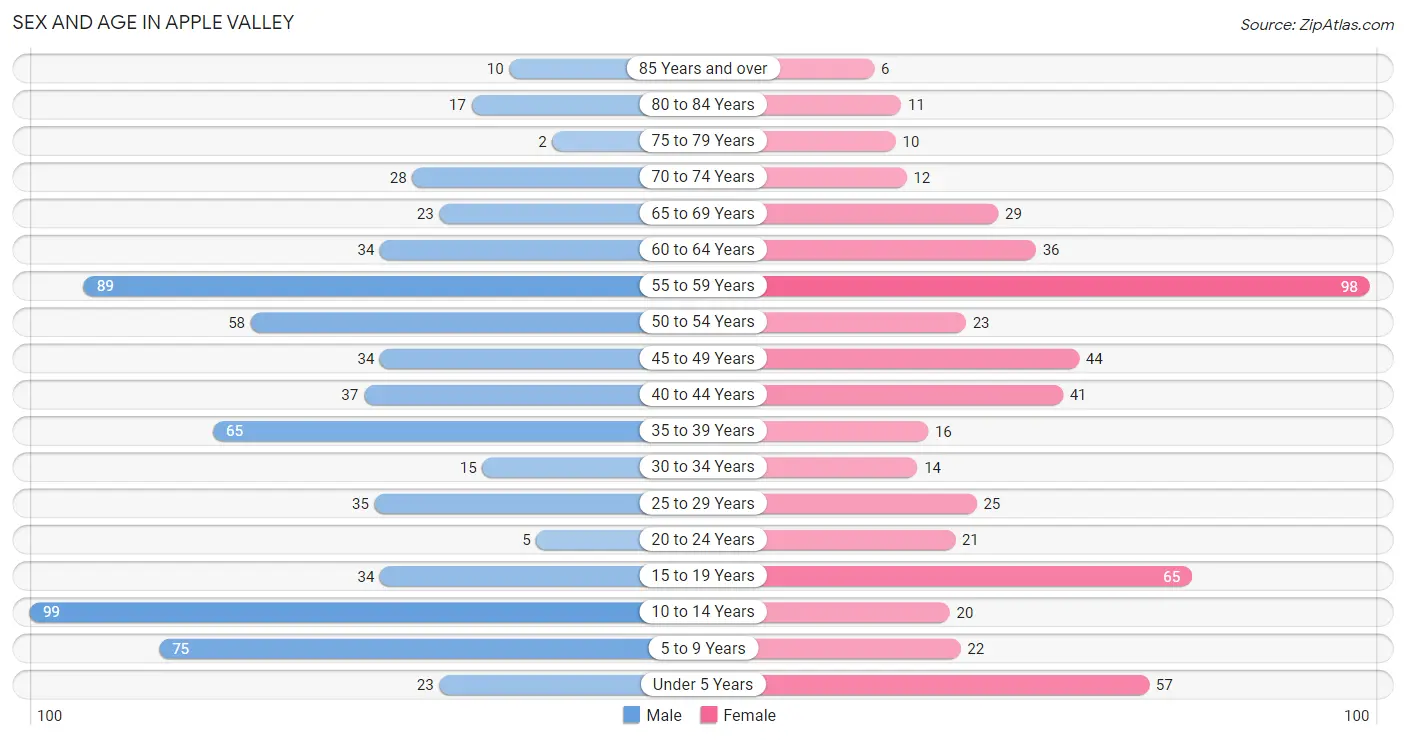
Sex and Age in Apple Valley
Sex and Age in Apple Valley
The most populous age groups in Apple Valley are 10 to 14 Years (99 | 14.5%) for men and 55 to 59 Years (98 | 17.8%) for women.
| Age Bracket | Male | Female |
| Under 5 Years | 23 (3.4%) | 57 (10.4%) |
| 5 to 9 Years | 75 (11.0%) | 22 (4.0%) |
| 10 to 14 Years | 99 (14.5%) | 20 (3.6%) |
| 15 to 19 Years | 34 (5.0%) | 65 (11.8%) |
| 20 to 24 Years | 5 (0.7%) | 21 (3.8%) |
| 25 to 29 Years | 35 (5.1%) | 25 (4.5%) |
| 30 to 34 Years | 15 (2.2%) | 14 (2.5%) |
| 35 to 39 Years | 65 (9.5%) | 16 (2.9%) |
| 40 to 44 Years | 37 (5.4%) | 41 (7.4%) |
| 45 to 49 Years | 34 (5.0%) | 44 (8.0%) |
| 50 to 54 Years | 58 (8.5%) | 23 (4.2%) |
| 55 to 59 Years | 89 (13.0%) | 98 (17.8%) |
| 60 to 64 Years | 34 (5.0%) | 36 (6.6%) |
| 65 to 69 Years | 23 (3.4%) | 29 (5.3%) |
| 70 to 74 Years | 28 (4.1%) | 12 (2.2%) |
| 75 to 79 Years | 2 (0.3%) | 10 (1.8%) |
| 80 to 84 Years | 17 (2.5%) | 11 (2.0%) |
| 85 Years and over | 10 (1.5%) | 6 (1.1%) |
| Total | 683 (100.0%) | 550 (100.0%) |
Families and Households in Apple Valley
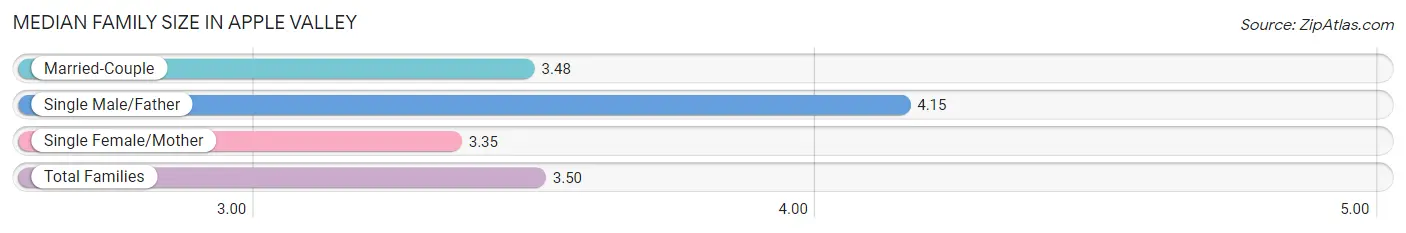
Median Family Size in Apple Valley
The median family size in Apple Valley is 3.50 persons per family, with single male/father families (13 | 4.1%) accounting for the largest median family size of 4.15 persons per family. On the other hand, single female/mother families (23 | 7.3%) represent the smallest median family size with 3.35 persons per family.
| Family Type | # Families | Family Size |
| Married-Couple | 281 (88.6%) | 3.48 |
| Single Male/Father | 13 (4.1%) | 4.15 |
| Single Female/Mother | 23 (7.3%) | 3.35 |
| Total Families | 317 (100.0%) | 3.50 |
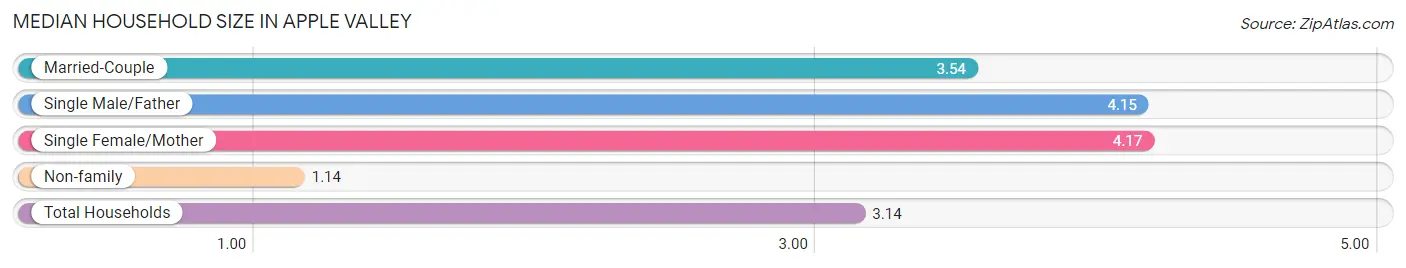
Median Household Size in Apple Valley
The median household size in Apple Valley is 3.14 persons per household, with single female/mother households (23 | 5.9%) accounting for the largest median household size of 4.17 persons per household. non-family households (76 | 19.3%) represent the smallest median household size with 1.14 persons per household.
| Household Type | # Households | Household Size |
| Married-Couple | 281 (71.5%) | 3.54 |
| Single Male/Father | 13 (3.3%) | 4.15 |
| Single Female/Mother | 23 (5.9%) | 4.17 |
| Non-family | 76 (19.3%) | 1.14 |
| Total Households | 393 (100.0%) | 3.14 |
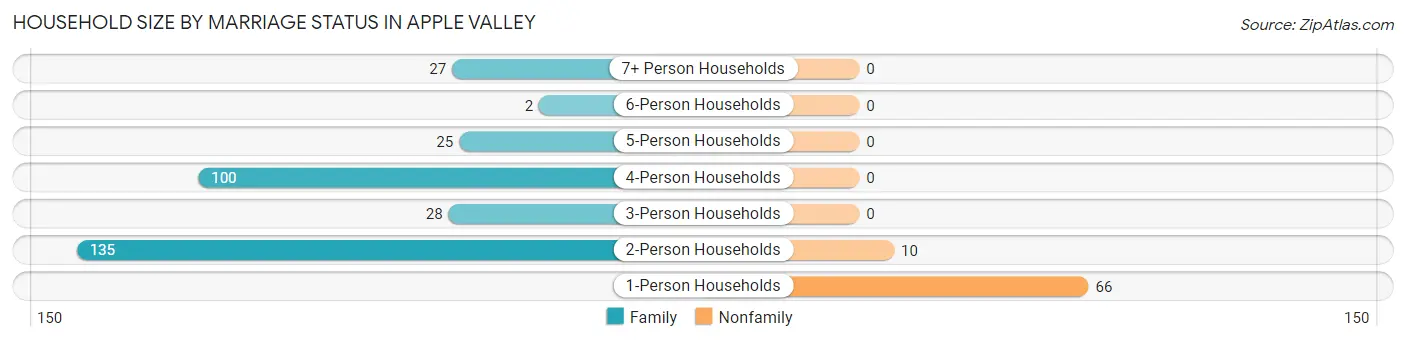
Household Size by Marriage Status in Apple Valley
Out of a total of 393 households in Apple Valley, 317 (80.7%) are family households, while 76 (19.3%) are nonfamily households. The most numerous type of family households are 2-person households, comprising 135, and the most common type of nonfamily households are 1-person households, comprising 66.
| Household Size | Family Households | Nonfamily Households |
| 1-Person Households | - | 66 (16.8%) |
| 2-Person Households | 135 (34.4%) | 10 (2.5%) |
| 3-Person Households | 28 (7.1%) | 0 (0.0%) |
| 4-Person Households | 100 (25.5%) | 0 (0.0%) |
| 5-Person Households | 25 (6.4%) | 0 (0.0%) |
| 6-Person Households | 2 (0.5%) | 0 (0.0%) |
| 7+ Person Households | 27 (6.9%) | 0 (0.0%) |
| Total | 317 (80.7%) | 76 (19.3%) |
Female Fertility in Apple Valley
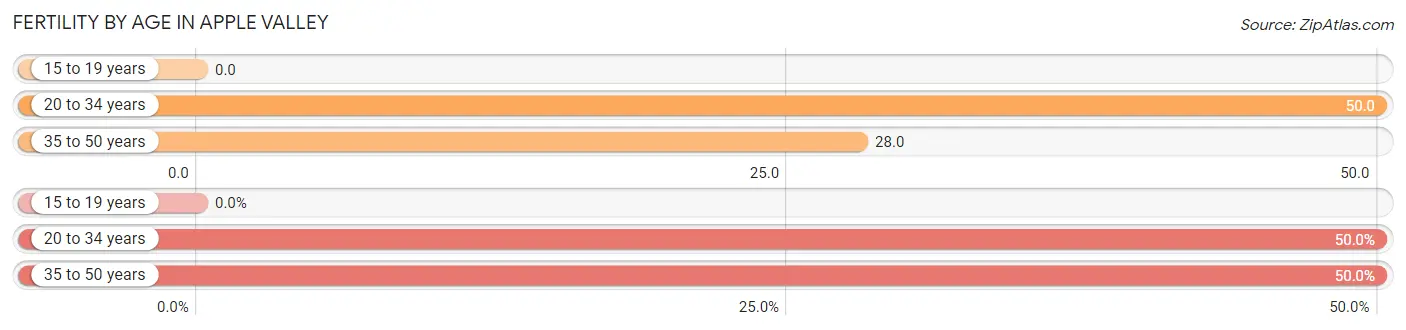
Fertility by Age in Apple Valley
Average fertility rate in Apple Valley is 26.0 births per 1,000 women. Women in the age bracket of 20 to 34 years have the highest fertility rate with 50.0 births per 1,000 women. Women in the age bracket of 20 to 34 years acount for 50.0% of all women with births.
| Age Bracket | Women with Births | Births / 1,000 Women |
| 15 to 19 years | 0 (0.0%) | 0.0 |
| 20 to 34 years | 3 (50.0%) | 50.0 |
| 35 to 50 years | 3 (50.0%) | 28.0 |
| Total | 6 (100.0%) | 26.0 |
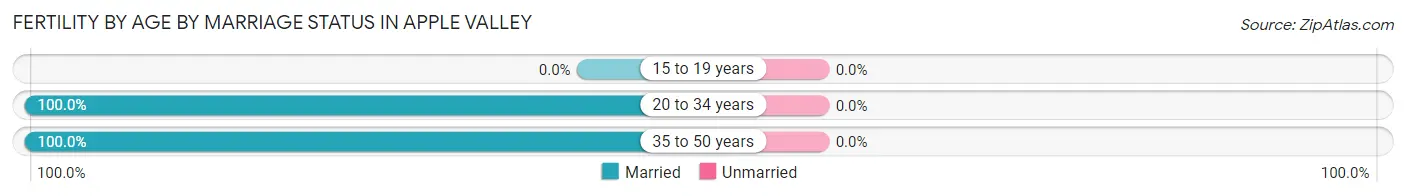
Fertility by Age by Marriage Status in Apple Valley
| Age Bracket | Married | Unmarried |
| 15 to 19 years | 0 (0.0%) | 0 (0.0%) |
| 20 to 34 years | 3 (100.0%) | 0 (0.0%) |
| 35 to 50 years | 3 (100.0%) | 0 (0.0%) |
| Total | 6 (100.0%) | 0 (0.0%) |
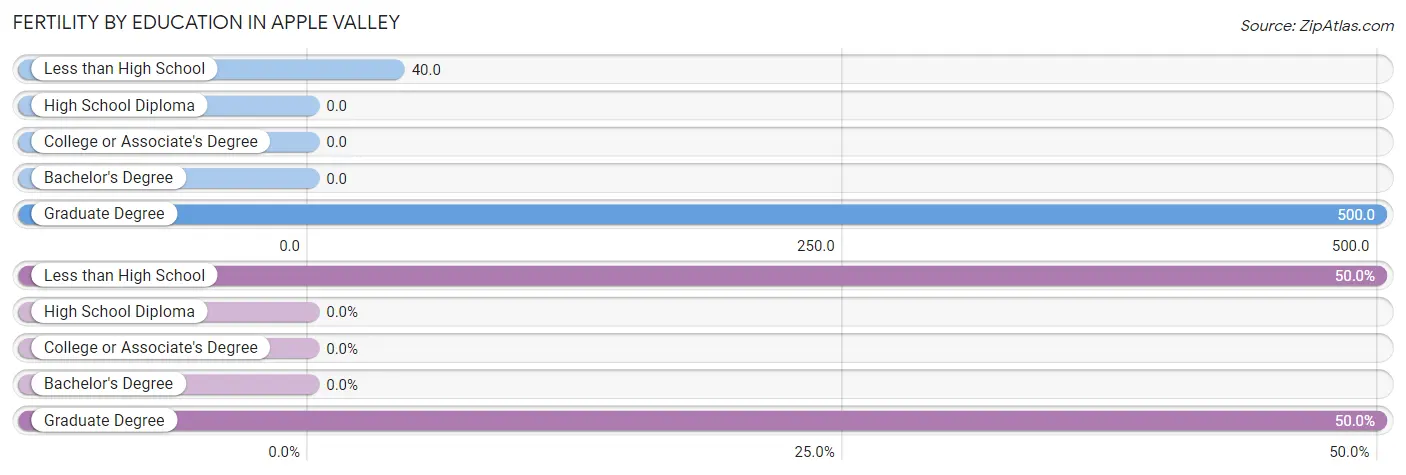
Fertility by Education in Apple Valley
| Educational Attainment | Women with Births | Births / 1,000 Women |
| Less than High School | 3 (50.0%) | 40.0 |
| High School Diploma | 0 (0.0%) | 0.0 |
| College or Associate's Degree | 0 (0.0%) | 0.0 |
| Bachelor's Degree | 0 (0.0%) | 0.0 |
| Graduate Degree | 3 (50.0%) | 500.0 |
| Total | 6 (100.0%) | 26.0 |
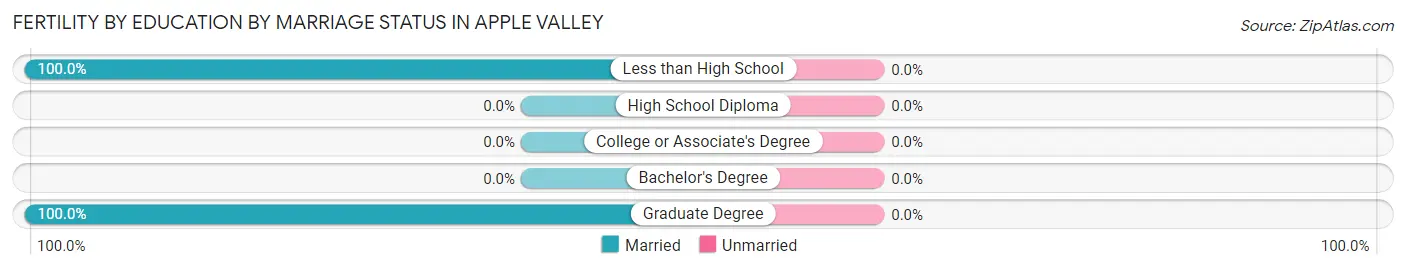
Fertility by Education by Marriage Status in Apple Valley
| Educational Attainment | Married | Unmarried |
| Less than High School | 3 (100.0%) | 0 (0.0%) |
| High School Diploma | 0 (0.0%) | 0 (0.0%) |
| College or Associate's Degree | 0 (0.0%) | 0 (0.0%) |
| Bachelor's Degree | 0 (0.0%) | 0 (0.0%) |
| Graduate Degree | 3 (100.0%) | 0 (0.0%) |
| Total | 6 (100.0%) | 0 (0.0%) |
Income in Apple Valley
Income Overview in Apple Valley
Per Capita Income in Apple Valley is $29,054, while median incomes of families and households are $96,563 and $80,893 respectively.
| Characteristic | Number | Measure |
| Per Capita Income | 1,233 | $29,054 |
| Median Family Income | 317 | $96,563 |
| Mean Family Income | 317 | $91,920 |
| Median Household Income | 393 | $80,893 |
| Mean Household Income | 393 | $88,134 |
| Income Deficit | 317 | $0 |
| Wage / Income Gap (%) | 1,233 | 53.41% |
| Wage / Income Gap ($) | 1,233 | 46.59¢ per $1 |
| Gini / Inequality Index | 1,233 | 0.32 |
Earnings by Sex in Apple Valley
Average Earnings in Apple Valley are $33,050, $46,339 for men and $21,591 for women, a difference of 53.4%.
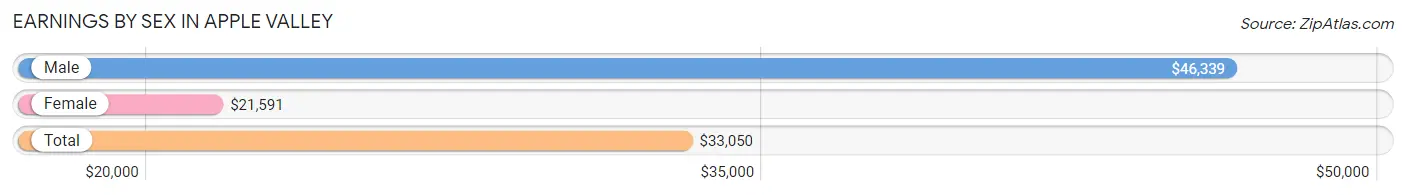
| Sex | Number | Average Earnings |
| Male | 371 (60.5%) | $46,339 |
| Female | 242 (39.5%) | $21,591 |
| Total | 613 (100.0%) | $33,050 |
Earnings by Sex by Income Bracket in Apple Valley
The most common earnings brackets in Apple Valley are $100,000+ for men (76 | 20.5%) and $20,000 to $22,499 for women (33 | 13.6%).
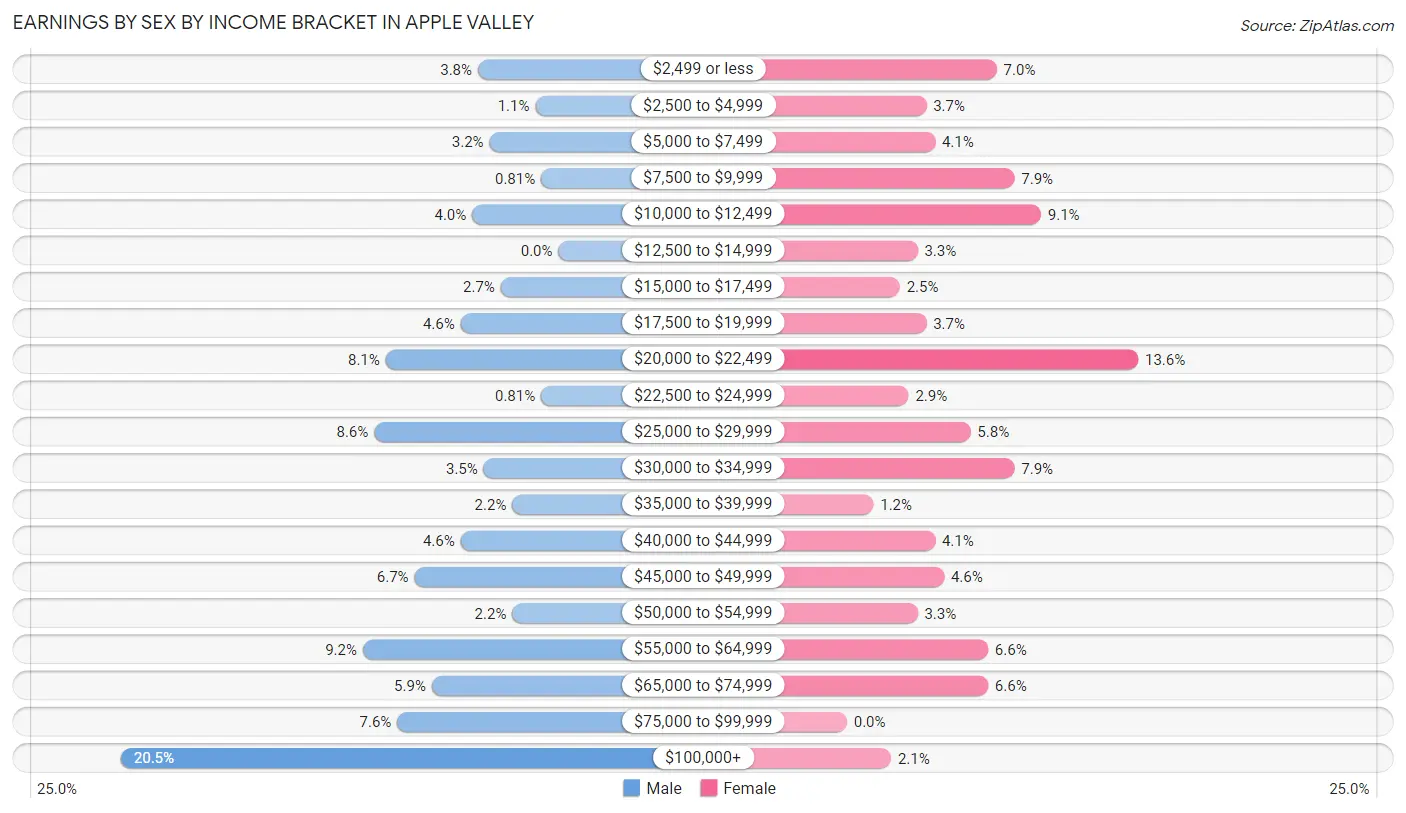
| Income | Male | Female |
| $2,499 or less | 14 (3.8%) | 17 (7.0%) |
| $2,500 to $4,999 | 4 (1.1%) | 9 (3.7%) |
| $5,000 to $7,499 | 12 (3.2%) | 10 (4.1%) |
| $7,500 to $9,999 | 3 (0.8%) | 19 (7.9%) |
| $10,000 to $12,499 | 15 (4.0%) | 22 (9.1%) |
| $12,500 to $14,999 | 0 (0.0%) | 8 (3.3%) |
| $15,000 to $17,499 | 10 (2.7%) | 6 (2.5%) |
| $17,500 to $19,999 | 17 (4.6%) | 9 (3.7%) |
| $20,000 to $22,499 | 30 (8.1%) | 33 (13.6%) |
| $22,500 to $24,999 | 3 (0.8%) | 7 (2.9%) |
| $25,000 to $29,999 | 32 (8.6%) | 14 (5.8%) |
| $30,000 to $34,999 | 13 (3.5%) | 19 (7.9%) |
| $35,000 to $39,999 | 8 (2.2%) | 3 (1.2%) |
| $40,000 to $44,999 | 17 (4.6%) | 10 (4.1%) |
| $45,000 to $49,999 | 25 (6.7%) | 11 (4.5%) |
| $50,000 to $54,999 | 8 (2.2%) | 8 (3.3%) |
| $55,000 to $64,999 | 34 (9.2%) | 16 (6.6%) |
| $65,000 to $74,999 | 22 (5.9%) | 16 (6.6%) |
| $75,000 to $99,999 | 28 (7.5%) | 0 (0.0%) |
| $100,000+ | 76 (20.5%) | 5 (2.1%) |
| Total | 371 (100.0%) | 242 (100.0%) |
Earnings by Sex by Educational Attainment in Apple Valley
Average earnings in Apple Valley are $48,977 for men and $28,295 for women, a difference of 42.2%. Men with an educational attainment of less than high school enjoy the highest average annual earnings of $60,333, while those with high school diploma education earn the least with $41,250. Women with an educational attainment of graduate degree earn the most with the average annual earnings of $70,833, while those with college or associate's degree education have the smallest earnings of $24,286.
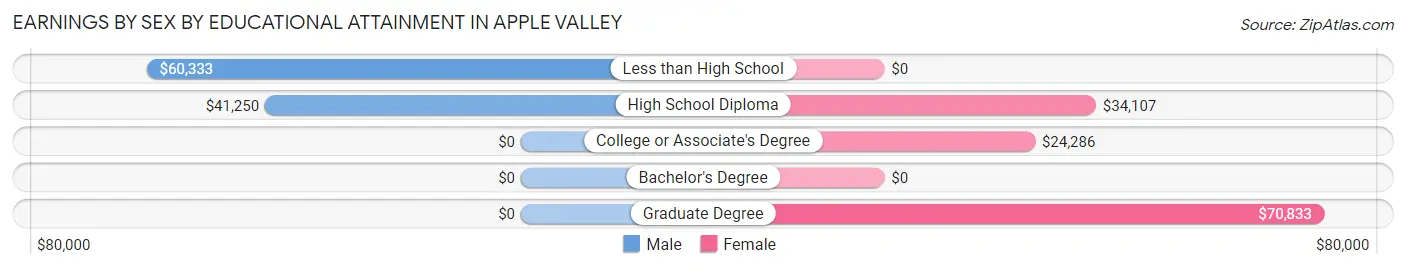
| Educational Attainment | Male Income | Female Income |
| Less than High School | $60,333 | $0 |
| High School Diploma | $41,250 | $34,107 |
| College or Associate's Degree | - | - |
| Bachelor's Degree | - | - |
| Graduate Degree | - | - |
| Total | $48,977 | $28,295 |
Family Income in Apple Valley
Family Income Brackets in Apple Valley
According to the Apple Valley family income data, there are 124 families falling into the $100,000 to $149,999 income range, which is the most common income bracket and makes up 39.1% of all families.
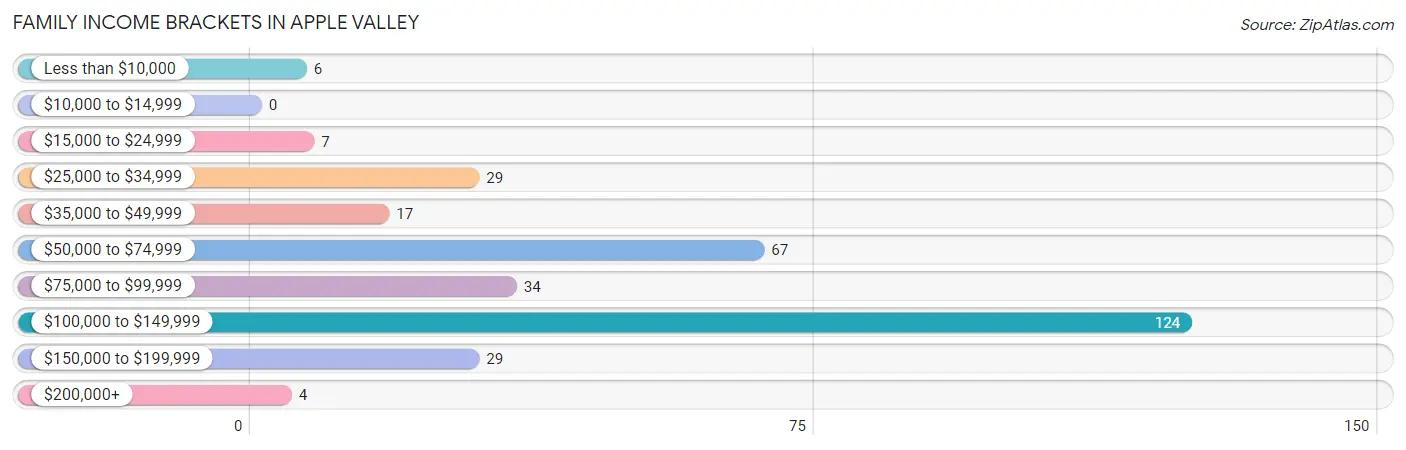
| Income Bracket | # Families | % Families |
| Less than $10,000 | 6 | 1.9% |
| $10,000 to $14,999 | 0 | 0.0% |
| $15,000 to $24,999 | 7 | 2.2% |
| $25,000 to $34,999 | 29 | 9.1% |
| $35,000 to $49,999 | 17 | 5.4% |
| $50,000 to $74,999 | 67 | 21.1% |
| $75,000 to $99,999 | 34 | 10.7% |
| $100,000 to $149,999 | 124 | 39.1% |
| $150,000 to $199,999 | 29 | 9.1% |
| $200,000+ | 4 | 1.3% |
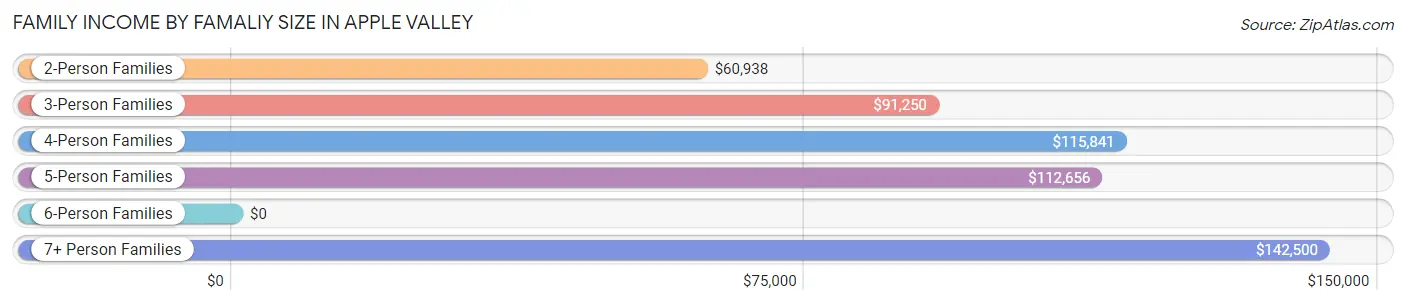
Family Income by Famaliy Size in Apple Valley
7+ person families (24 | 7.6%) account for the highest median family income in Apple Valley with $142,500 per family, while 2-person families (145 | 45.7%) have the highest median income of $30,469 per family member.
| Income Bracket | # Families | Median Income |
| 2-Person Families | 145 (45.7%) | $60,938 |
| 3-Person Families | 25 (7.9%) | $91,250 |
| 4-Person Families | 93 (29.3%) | $115,841 |
| 5-Person Families | 25 (7.9%) | $112,656 |
| 6-Person Families | 5 (1.6%) | $0 |
| 7+ Person Families | 24 (7.6%) | $142,500 |
| Total | 317 (100.0%) | $96,563 |
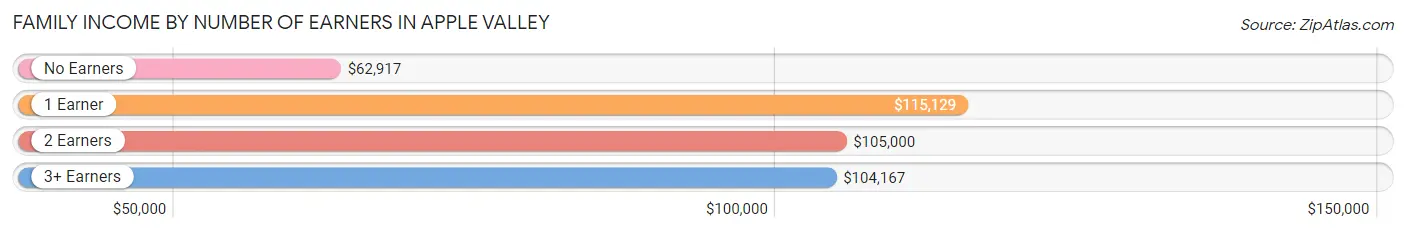
Family Income by Number of Earners in Apple Valley
The median family income in Apple Valley is $96,563, with families comprising 1 earner (128) having the highest median family income of $115,129, while families with no earners (51) have the lowest median family income of $62,917, accounting for 40.4% and 16.1% of families, respectively.
| Number of Earners | # Families | Median Income |
| No Earners | 51 (16.1%) | $62,917 |
| 1 Earner | 128 (40.4%) | $115,129 |
| 2 Earners | 82 (25.9%) | $105,000 |
| 3+ Earners | 56 (17.7%) | $104,167 |
| Total | 317 (100.0%) | $96,563 |
Household Income in Apple Valley
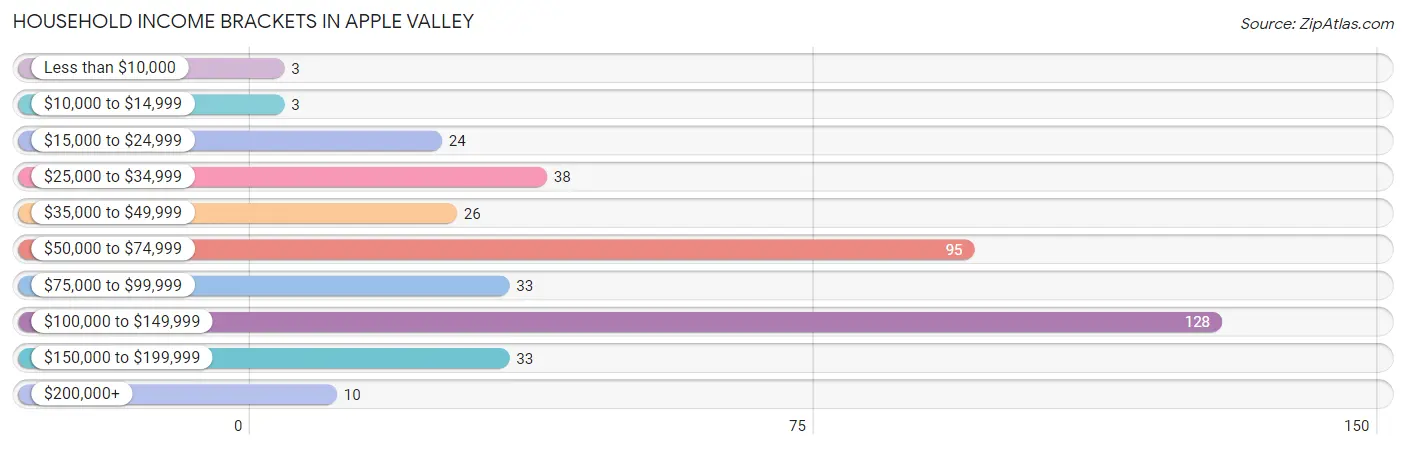
Household Income Brackets in Apple Valley
With 128 households falling in the category, the $100,000 to $149,999 income range is the most frequent in Apple Valley, accounting for 32.6% of all households. In contrast, only 3 households (0.8%) fall into the less than $10,000 income bracket, making it the least populous group.
| Income Bracket | # Households | % Households |
| Less than $10,000 | 3 | 0.8% |
| $10,000 to $14,999 | 3 | 0.8% |
| $15,000 to $24,999 | 24 | 6.1% |
| $25,000 to $34,999 | 38 | 9.7% |
| $35,000 to $49,999 | 26 | 6.6% |
| $50,000 to $74,999 | 95 | 24.2% |
| $75,000 to $99,999 | 33 | 8.4% |
| $100,000 to $149,999 | 128 | 32.6% |
| $150,000 to $199,999 | 33 | 8.4% |
| $200,000+ | 10 | 2.5% |
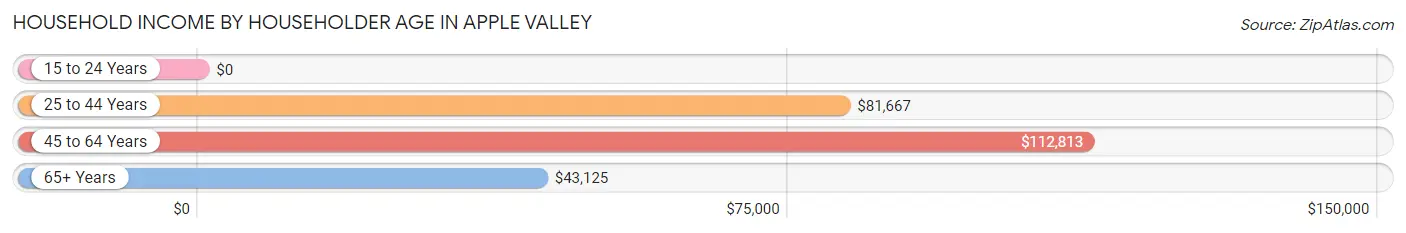
Household Income by Householder Age in Apple Valley
The median household income in Apple Valley is $80,893, with the highest median household income of $112,813 found in the 45 to 64 years age bracket for the primary householder. A total of 228 households (58.0%) fall into this category.
| Income Bracket | # Households | Median Income |
| 15 to 24 Years | 0 (0.0%) | $0 |
| 25 to 44 Years | 90 (22.9%) | $81,667 |
| 45 to 64 Years | 228 (58.0%) | $112,813 |
| 65+ Years | 75 (19.1%) | $43,125 |
| Total | 393 (100.0%) | $80,893 |
Poverty in Apple Valley
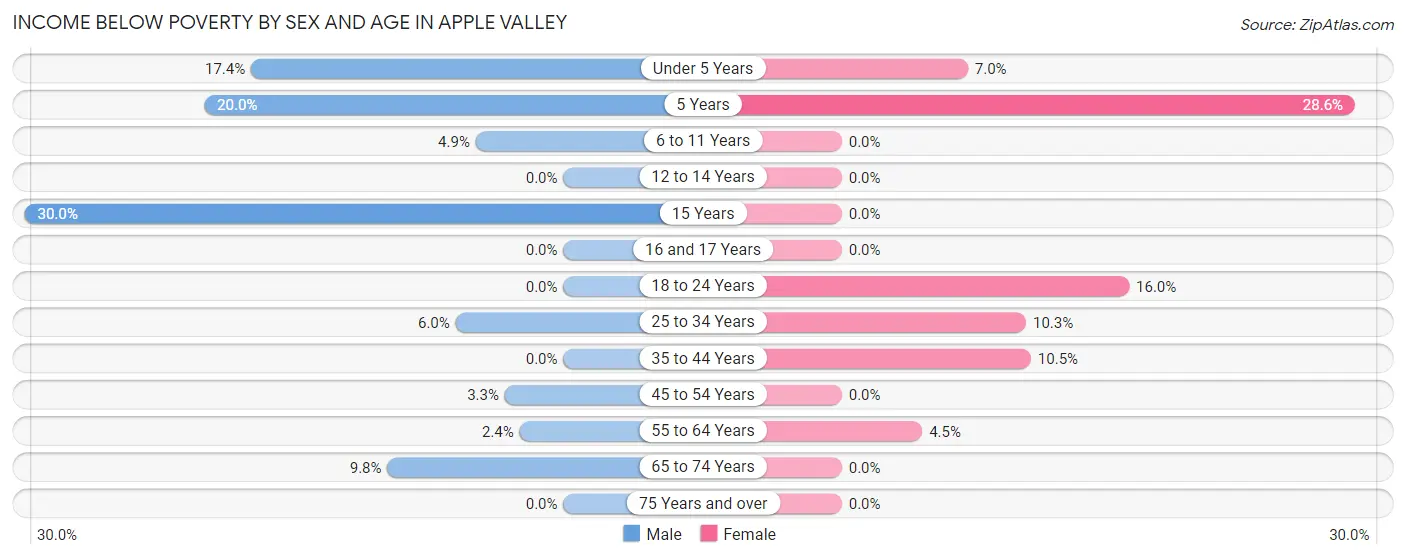
Income Below Poverty by Sex and Age in Apple Valley
With 4.3% poverty level for males and 5.4% for females among the residents of Apple Valley, 15 year old males and 5 year old females are the most vulnerable to poverty, with 3 males (30.0%) and 2 females (28.6%) in their respective age groups living below the poverty level.
| Age Bracket | Male | Female |
| Under 5 Years | 4 (17.4%) | 4 (7.0%) |
| 5 Years | 2 (20.0%) | 2 (28.6%) |
| 6 to 11 Years | 6 (4.9%) | 0 (0.0%) |
| 12 to 14 Years | 0 (0.0%) | 0 (0.0%) |
| 15 Years | 3 (30.0%) | 0 (0.0%) |
| 16 and 17 Years | 0 (0.0%) | 0 (0.0%) |
| 18 to 24 Years | 0 (0.0%) | 8 (16.0%) |
| 25 to 34 Years | 3 (6.0%) | 4 (10.3%) |
| 35 to 44 Years | 0 (0.0%) | 6 (10.5%) |
| 45 to 54 Years | 3 (3.3%) | 0 (0.0%) |
| 55 to 64 Years | 3 (2.4%) | 6 (4.5%) |
| 65 to 74 Years | 5 (9.8%) | 0 (0.0%) |
| 75 Years and over | 0 (0.0%) | 0 (0.0%) |
| Total | 29 (4.3%) | 30 (5.4%) |
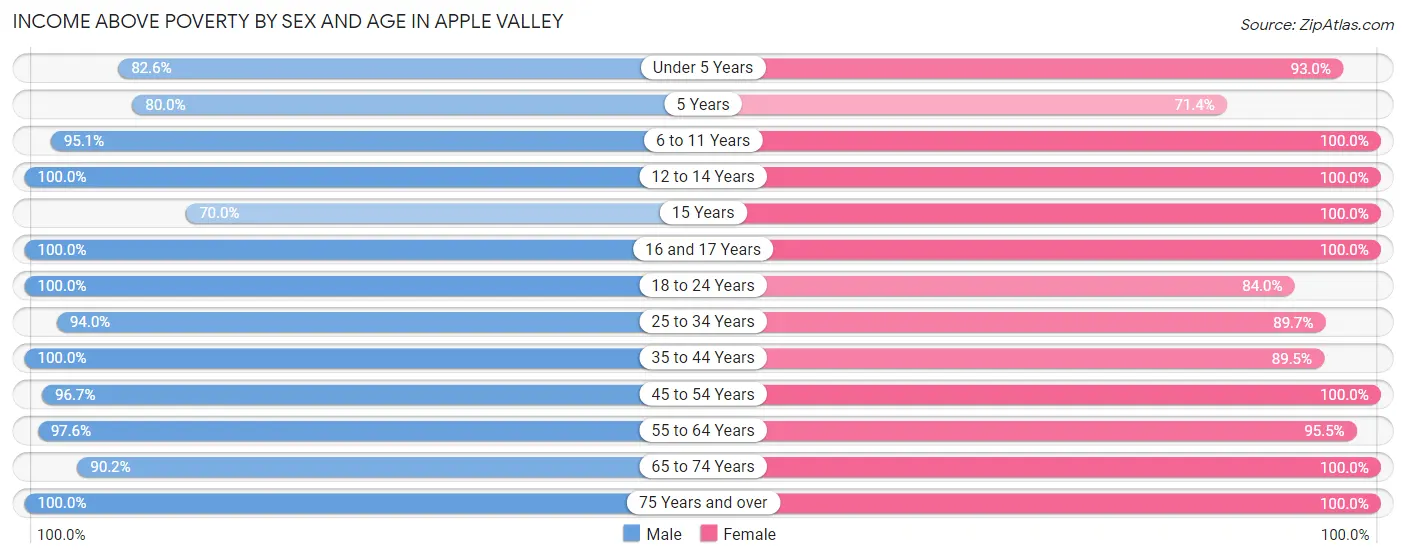
Income Above Poverty by Sex and Age in Apple Valley
According to the poverty statistics in Apple Valley, males aged 12 to 14 years and females aged 6 to 11 years are the age groups that are most secure financially, with 100.0% of males and 100.0% of females in these age groups living above the poverty line.
| Age Bracket | Male | Female |
| Under 5 Years | 19 (82.6%) | 53 (93.0%) |
| 5 Years | 8 (80.0%) | 5 (71.4%) |
| 6 to 11 Years | 117 (95.1%) | 28 (100.0%) |
| 12 to 14 Years | 41 (100.0%) | 7 (100.0%) |
| 15 Years | 7 (70.0%) | 16 (100.0%) |
| 16 and 17 Years | 12 (100.0%) | 20 (100.0%) |
| 18 to 24 Years | 17 (100.0%) | 42 (84.0%) |
| 25 to 34 Years | 47 (94.0%) | 35 (89.7%) |
| 35 to 44 Years | 102 (100.0%) | 51 (89.5%) |
| 45 to 54 Years | 89 (96.7%) | 67 (100.0%) |
| 55 to 64 Years | 120 (97.6%) | 128 (95.5%) |
| 65 to 74 Years | 46 (90.2%) | 41 (100.0%) |
| 75 Years and over | 29 (100.0%) | 27 (100.0%) |
| Total | 654 (95.8%) | 520 (94.6%) |
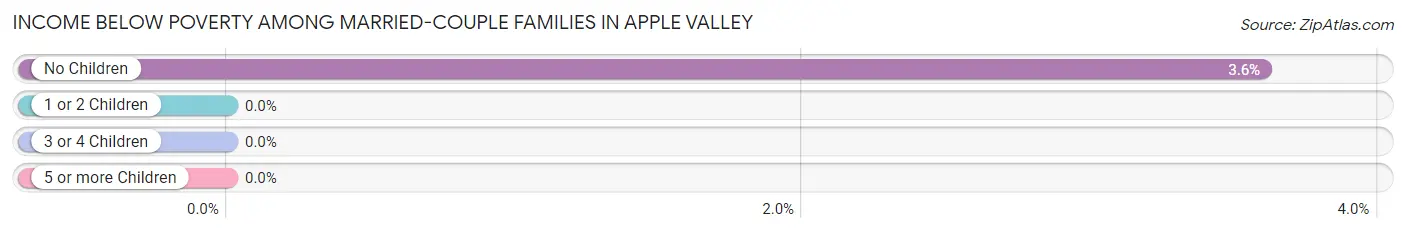
Income Below Poverty Among Married-Couple Families in Apple Valley
The poverty statistics for married-couple families in Apple Valley show that 1.8% or 5 of the total 281 families live below the poverty line. Families with no children have the highest poverty rate of 3.6%, comprising of 5 families. On the other hand, families with 1 or 2 children have the lowest poverty rate of 0.0%, which includes 0 families.
| Children | Above Poverty | Below Poverty |
| No Children | 134 (96.4%) | 5 (3.6%) |
| 1 or 2 Children | 116 (100.0%) | 0 (0.0%) |
| 3 or 4 Children | 20 (100.0%) | 0 (0.0%) |
| 5 or more Children | 6 (100.0%) | 0 (0.0%) |
| Total | 276 (98.2%) | 5 (1.8%) |
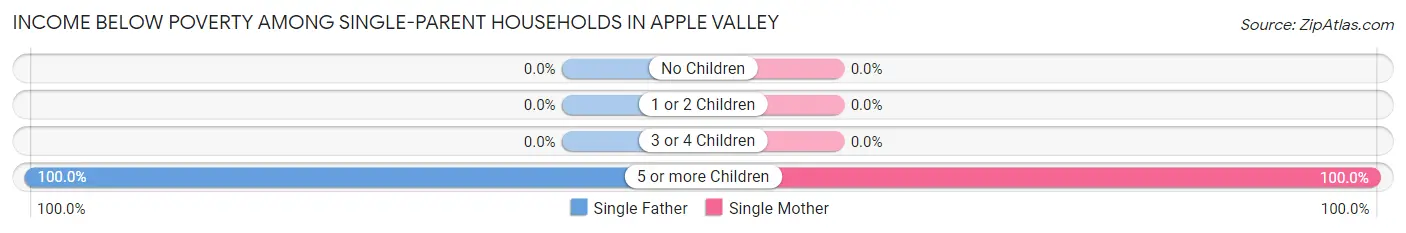
Income Below Poverty Among Single-Parent Households in Apple Valley
According to the poverty data in Apple Valley, 23.1% or 3 single-father households and 13.0% or 3 single-mother households are living below the poverty line. Among single-father households, those with 5 or more children have the highest poverty rate, with 3 households (100.0%) experiencing poverty. Likewise, among single-mother households, those with 5 or more children have the highest poverty rate, with 3 households (100.0%) falling below the poverty line.
| Children | Single Father | Single Mother |
| No Children | 0 (0.0%) | 0 (0.0%) |
| 1 or 2 Children | 0 (0.0%) | 0 (0.0%) |
| 3 or 4 Children | 0 (0.0%) | 0 (0.0%) |
| 5 or more Children | 3 (100.0%) | 3 (100.0%) |
| Total | 3 (23.1%) | 3 (13.0%) |
Income Below Poverty Among Married-Couple vs Single-Parent Households in Apple Valley
The poverty data for Apple Valley shows that 5 of the married-couple family households (1.8%) and 6 of the single-parent households (16.7%) are living below the poverty level. Within the married-couple family households, those with no children have the highest poverty rate, with 5 households (3.6%) falling below the poverty line. Among the single-parent households, those with 5 or more children have the highest poverty rate, with 6 household (100.0%) living below poverty.
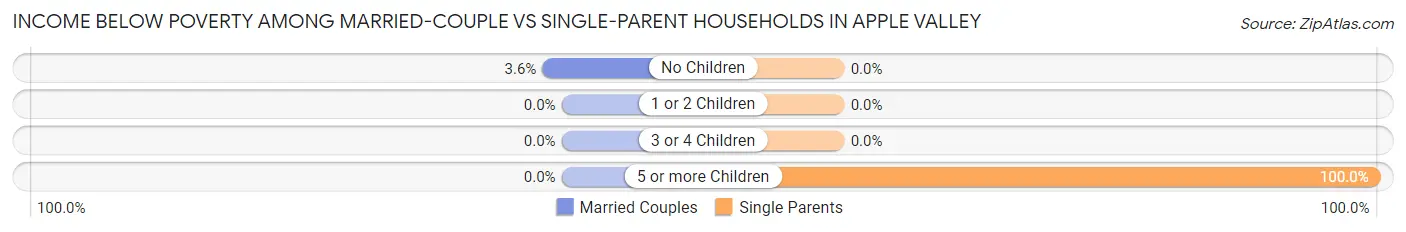
| Children | Married-Couple Families | Single-Parent Households |
| No Children | 5 (3.6%) | 0 (0.0%) |
| 1 or 2 Children | 0 (0.0%) | 0 (0.0%) |
| 3 or 4 Children | 0 (0.0%) | 0 (0.0%) |
| 5 or more Children | 0 (0.0%) | 6 (100.0%) |
| Total | 5 (1.8%) | 6 (16.7%) |
Employment Characteristics in Apple Valley
Employment by Class of Employer in Apple Valley
Among the 520 employed individuals in Apple Valley, private company employees (333 | 64.0%), local government employees (66 | 12.7%), and self-employed (incorporated) (43 | 8.3%) make up the most common classes of employment.
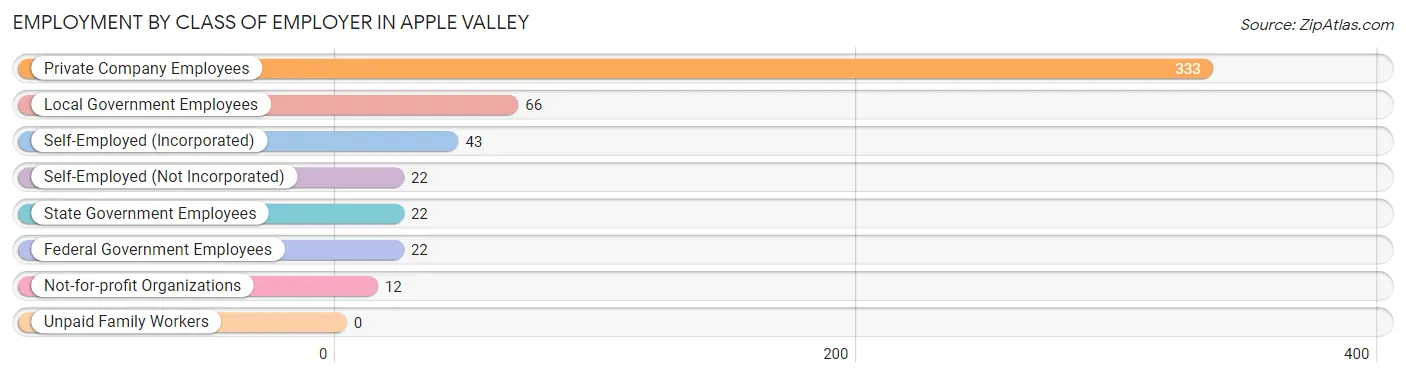
| Employer Class | # Employees | % Employees |
| Private Company Employees | 333 | 64.0% |
| Self-Employed (Incorporated) | 43 | 8.3% |
| Self-Employed (Not Incorporated) | 22 | 4.2% |
| Not-for-profit Organizations | 12 | 2.3% |
| Local Government Employees | 66 | 12.7% |
| State Government Employees | 22 | 4.2% |
| Federal Government Employees | 22 | 4.2% |
| Unpaid Family Workers | 0 | 0.0% |
| Total | 520 | 100.0% |
Employment Status by Age in Apple Valley
According to the labor force statistics for Apple Valley, out of the total population over 16 years of age (911), 66.1% or 602 individuals are in the labor force, with 6.8% or 41 of them unemployed. The age group with the highest labor force participation rate is 20 to 24 years, with 100.0% or 26 individuals in the labor force. Within the labor force, the 16 to 19 years age range has the highest percentage of unemployed individuals, with 29.1% or 16 of them being unemployed.
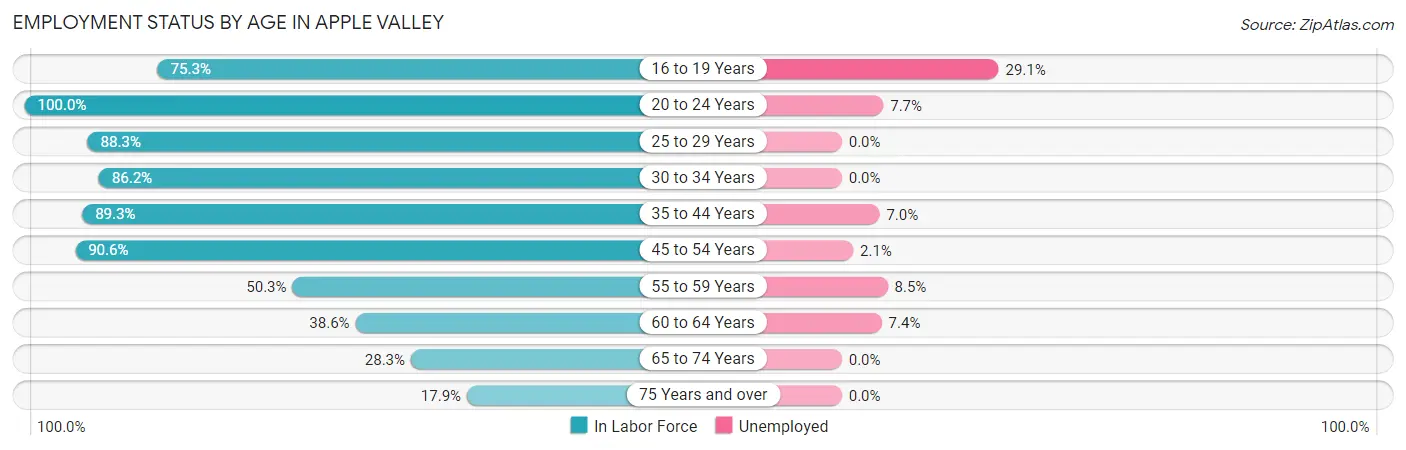
| Age Bracket | In Labor Force | Unemployed |
| 16 to 19 Years | 55 (75.3%) | 16 (29.1%) |
| 20 to 24 Years | 26 (100.0%) | 2 (7.7%) |
| 25 to 29 Years | 53 (88.3%) | 0 (0.0%) |
| 30 to 34 Years | 25 (86.2%) | 0 (0.0%) |
| 35 to 44 Years | 142 (89.3%) | 10 (7.0%) |
| 45 to 54 Years | 144 (90.6%) | 3 (2.1%) |
| 55 to 59 Years | 94 (50.3%) | 8 (8.5%) |
| 60 to 64 Years | 27 (38.6%) | 2 (7.4%) |
| 65 to 74 Years | 26 (28.3%) | 0 (0.0%) |
| 75 Years and over | 10 (17.9%) | 0 (0.0%) |
| Total | 602 (66.1%) | 41 (6.8%) |
Employment Status by Educational Attainment in Apple Valley
According to labor force statistics for Apple Valley, 73.0% of individuals (485) out of the total population between 25 and 64 years of age (664) are in the labor force, with 4.7% or 23 of them being unemployed. The group with the highest labor force participation rate are those with the educational attainment of less than high school, with 90.4% or 75 individuals in the labor force. Within the labor force, individuals with less than high school education have the highest percentage of unemployment, with 14.7% or 11 of them being unemployed.
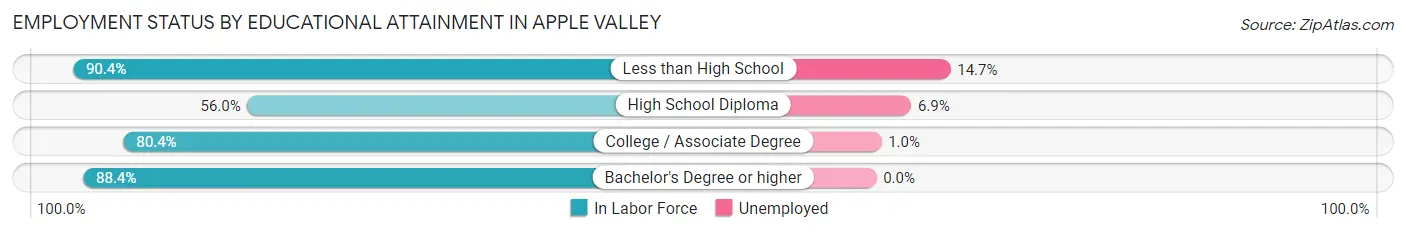
| Educational Attainment | In Labor Force | Unemployed |
| Less than High School | 75 (90.4%) | 12 (14.7%) |
| High School Diploma | 144 (56.0%) | 18 (6.9%) |
| College / Associate Degree | 205 (80.4%) | 3 (1.0%) |
| Bachelor's Degree or higher | 61 (88.4%) | 0 (0.0%) |
| Total | 485 (73.0%) | 31 (4.7%) |
Employment Occupations by Sex in Apple Valley
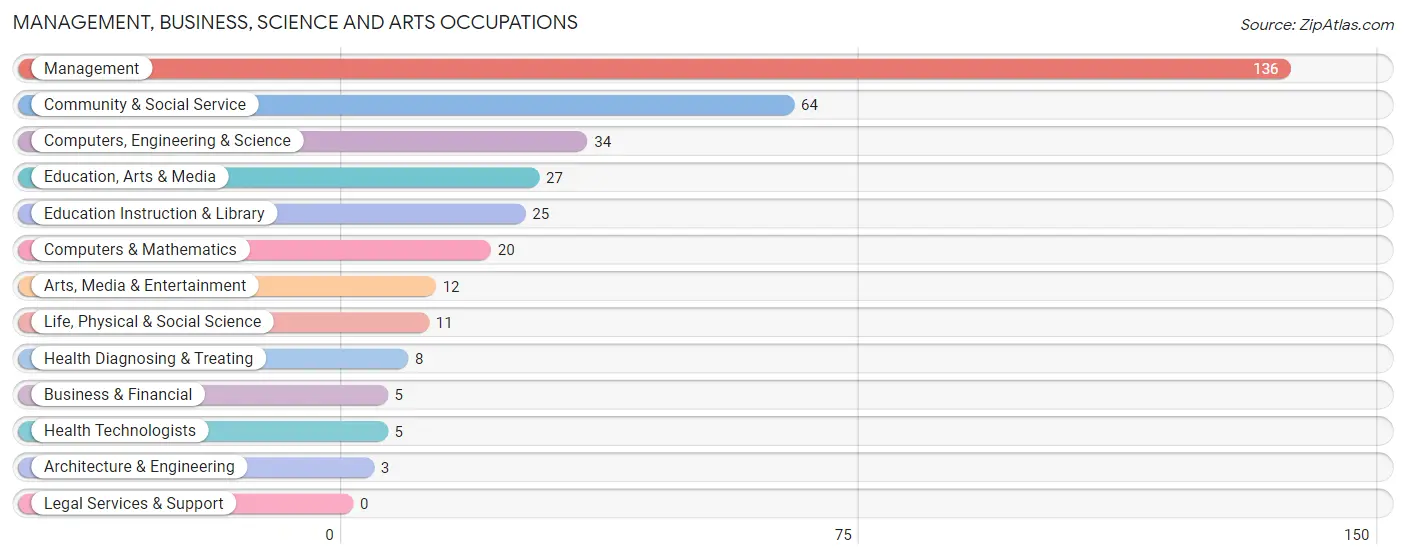
Management, Business, Science and Arts Occupations
The most common Management, Business, Science and Arts occupations in Apple Valley are Management (136 | 24.2%), Community & Social Service (64 | 11.4%), Computers, Engineering & Science (34 | 6.1%), Education, Arts & Media (27 | 4.8%), and Education Instruction & Library (25 | 4.5%).
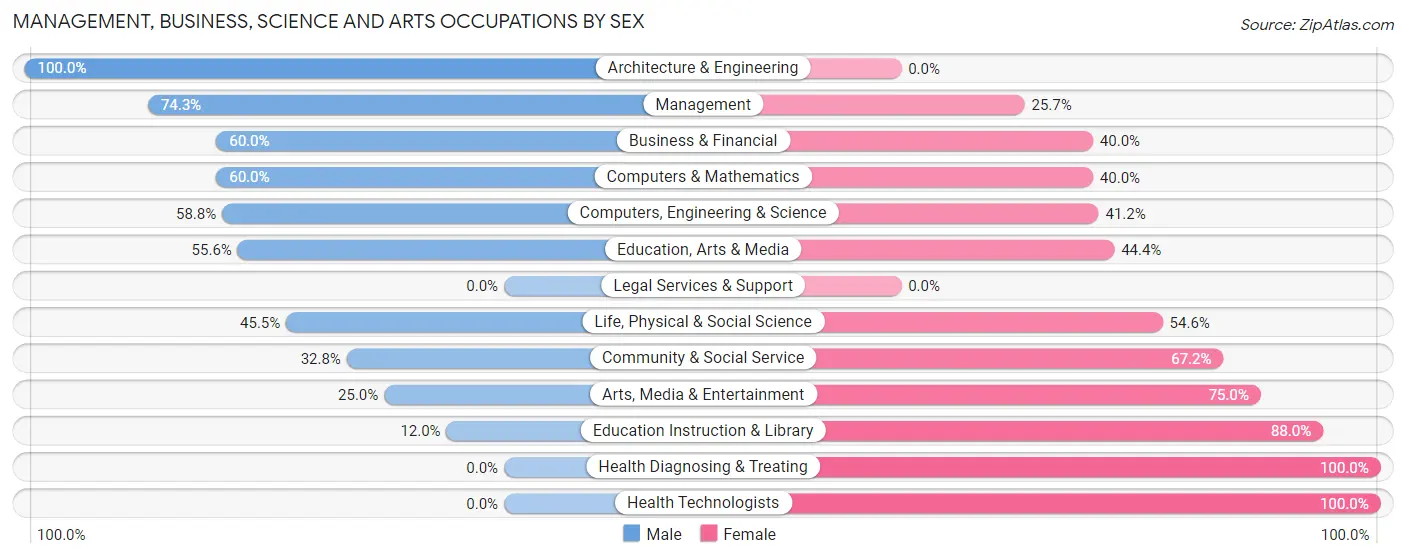
Management, Business, Science and Arts Occupations by Sex
Within the Management, Business, Science and Arts occupations in Apple Valley, the most male-oriented occupations are Architecture & Engineering (100.0%), Management (74.3%), and Business & Financial (60.0%), while the most female-oriented occupations are Health Diagnosing & Treating (100.0%), Health Technologists (100.0%), and Education Instruction & Library (88.0%).
| Occupation | Male | Female |
| Management | 101 (74.3%) | 35 (25.7%) |
| Business & Financial | 3 (60.0%) | 2 (40.0%) |
| Computers, Engineering & Science | 20 (58.8%) | 14 (41.2%) |
| Computers & Mathematics | 12 (60.0%) | 8 (40.0%) |
| Architecture & Engineering | 3 (100.0%) | 0 (0.0%) |
| Life, Physical & Social Science | 5 (45.5%) | 6 (54.5%) |
| Community & Social Service | 21 (32.8%) | 43 (67.2%) |
| Education, Arts & Media | 15 (55.6%) | 12 (44.4%) |
| Legal Services & Support | 0 (0.0%) | 0 (0.0%) |
| Education Instruction & Library | 3 (12.0%) | 22 (88.0%) |
| Arts, Media & Entertainment | 3 (25.0%) | 9 (75.0%) |
| Health Diagnosing & Treating | 0 (0.0%) | 8 (100.0%) |
| Health Technologists | 0 (0.0%) | 5 (100.0%) |
| Total (Category) | 145 (58.7%) | 102 (41.3%) |
| Total (Overall) | 336 (59.9%) | 225 (40.1%) |
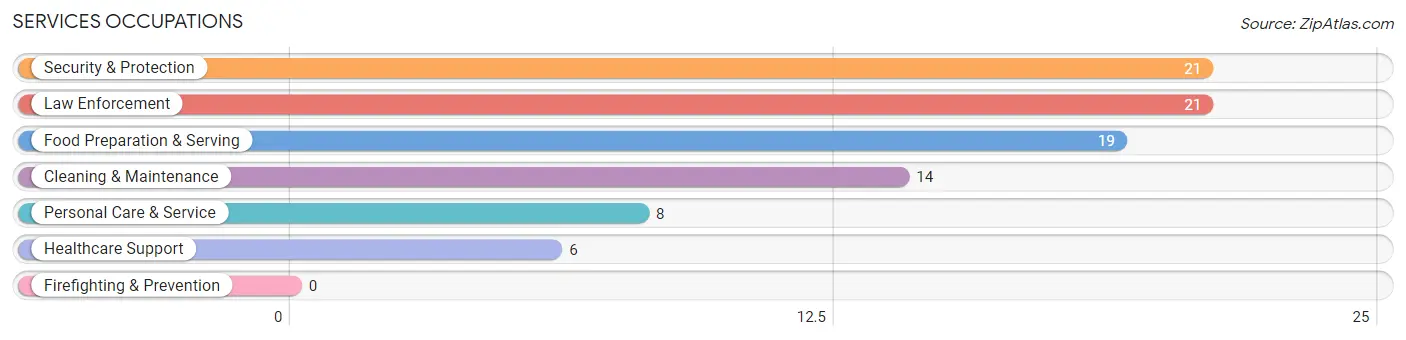
Services Occupations
The most common Services occupations in Apple Valley are Security & Protection (21 | 3.7%), Law Enforcement (21 | 3.7%), Food Preparation & Serving (19 | 3.4%), Cleaning & Maintenance (14 | 2.5%), and Personal Care & Service (8 | 1.4%).
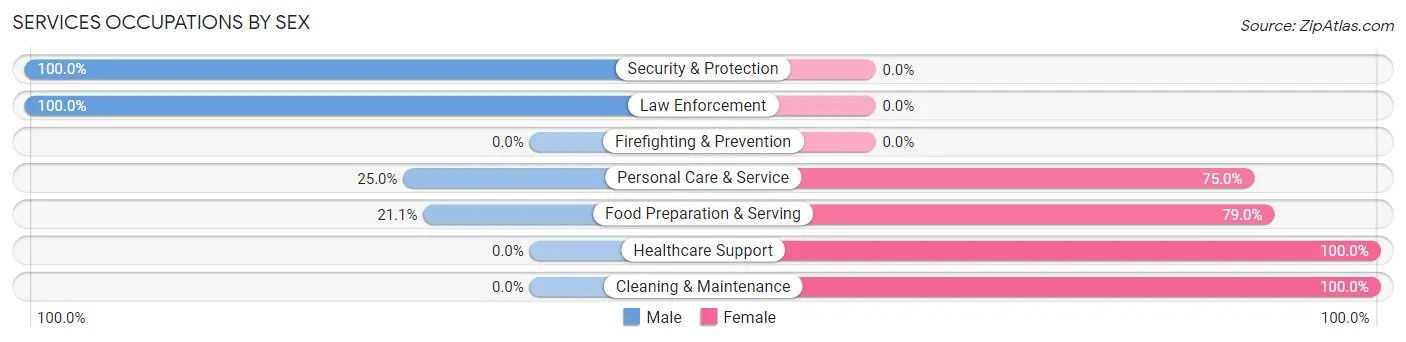
Services Occupations by Sex
Within the Services occupations in Apple Valley, the most male-oriented occupations are Security & Protection (100.0%), Law Enforcement (100.0%), and Personal Care & Service (25.0%), while the most female-oriented occupations are Healthcare Support (100.0%), Cleaning & Maintenance (100.0%), and Food Preparation & Serving (78.9%).
| Occupation | Male | Female |
| Healthcare Support | 0 (0.0%) | 6 (100.0%) |
| Security & Protection | 21 (100.0%) | 0 (0.0%) |
| Firefighting & Prevention | 0 (0.0%) | 0 (0.0%) |
| Law Enforcement | 21 (100.0%) | 0 (0.0%) |
| Food Preparation & Serving | 4 (21.0%) | 15 (78.9%) |
| Cleaning & Maintenance | 0 (0.0%) | 14 (100.0%) |
| Personal Care & Service | 2 (25.0%) | 6 (75.0%) |
| Total (Category) | 27 (39.7%) | 41 (60.3%) |
| Total (Overall) | 336 (59.9%) | 225 (40.1%) |
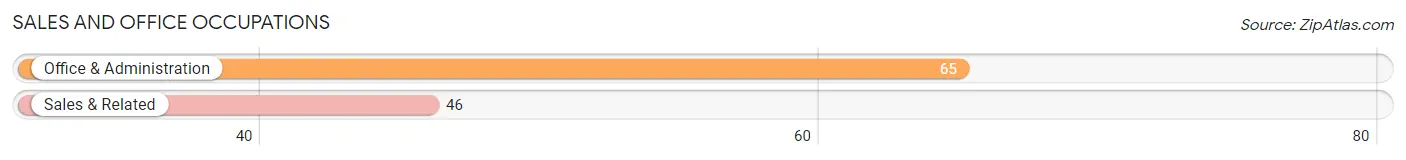
Sales and Office Occupations
The most common Sales and Office occupations in Apple Valley are Office & Administration (65 | 11.6%), and Sales & Related (46 | 8.2%).
Sales and Office Occupations by Sex
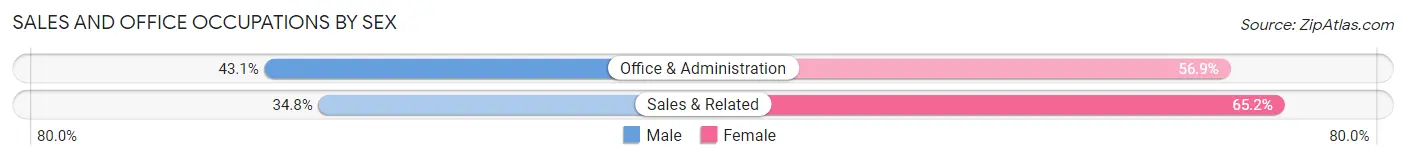
| Occupation | Male | Female |
| Sales & Related | 16 (34.8%) | 30 (65.2%) |
| Office & Administration | 28 (43.1%) | 37 (56.9%) |
| Total (Category) | 44 (39.6%) | 67 (60.4%) |
| Total (Overall) | 336 (59.9%) | 225 (40.1%) |
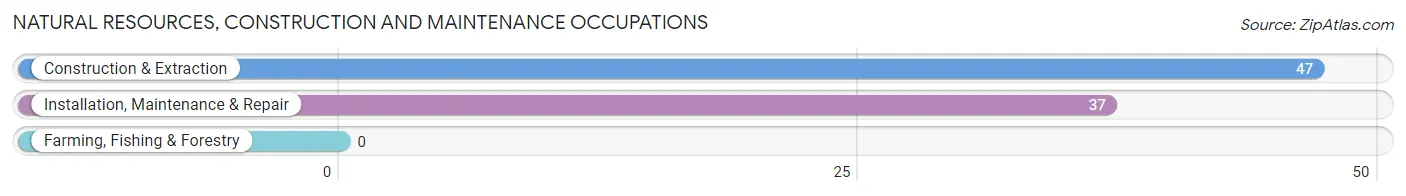
Natural Resources, Construction and Maintenance Occupations
The most common Natural Resources, Construction and Maintenance occupations in Apple Valley are Construction & Extraction (47 | 8.4%), and Installation, Maintenance & Repair (37 | 6.6%).
Natural Resources, Construction and Maintenance Occupations by Sex
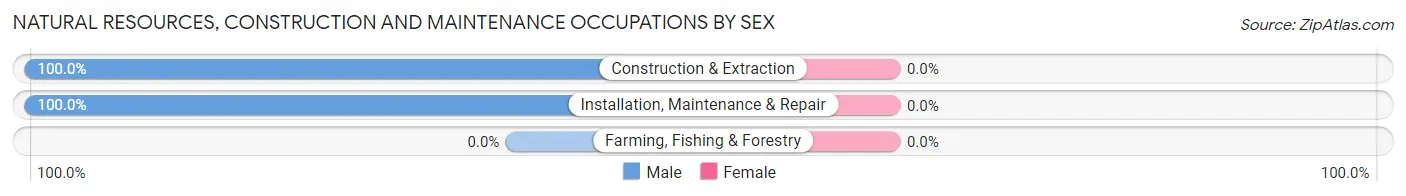
| Occupation | Male | Female |
| Farming, Fishing & Forestry | 0 (0.0%) | 0 (0.0%) |
| Construction & Extraction | 47 (100.0%) | 0 (0.0%) |
| Installation, Maintenance & Repair | 37 (100.0%) | 0 (0.0%) |
| Total (Category) | 84 (100.0%) | 0 (0.0%) |
| Total (Overall) | 336 (59.9%) | 225 (40.1%) |
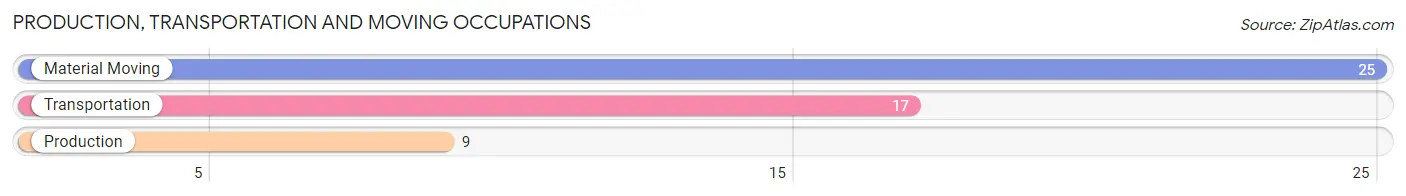
Production, Transportation and Moving Occupations
The most common Production, Transportation and Moving occupations in Apple Valley are Material Moving (25 | 4.5%), Transportation (17 | 3.0%), and Production (9 | 1.6%).
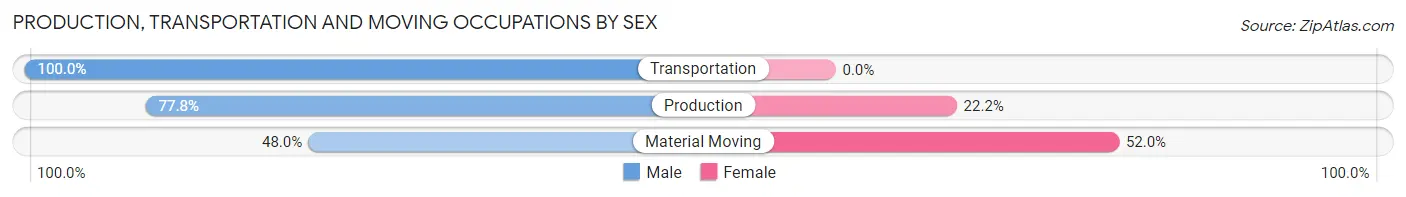
Production, Transportation and Moving Occupations by Sex
| Occupation | Male | Female |
| Production | 7 (77.8%) | 2 (22.2%) |
| Transportation | 17 (100.0%) | 0 (0.0%) |
| Material Moving | 12 (48.0%) | 13 (52.0%) |
| Total (Category) | 36 (70.6%) | 15 (29.4%) |
| Total (Overall) | 336 (59.9%) | 225 (40.1%) |
Employment Industries by Sex in Apple Valley
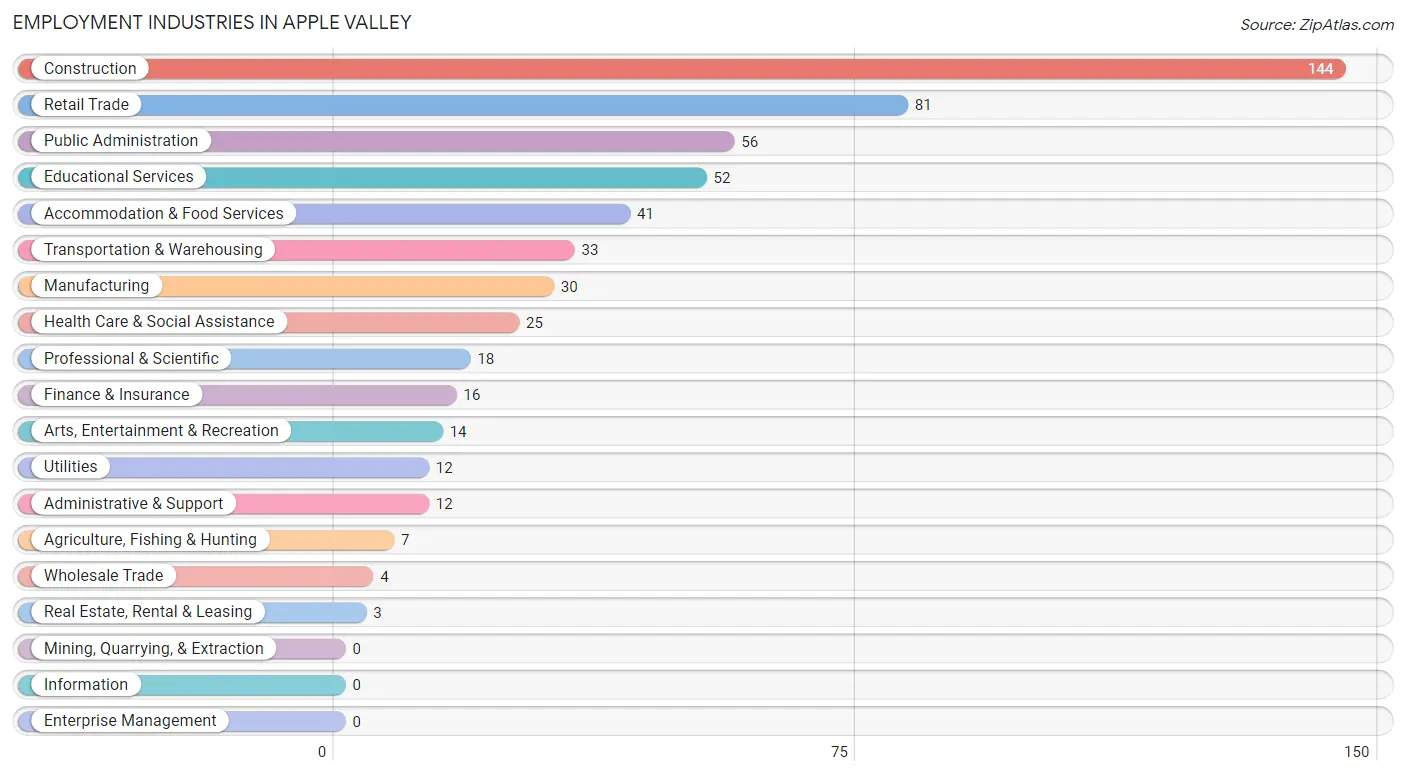
Employment Industries in Apple Valley
The major employment industries in Apple Valley include Construction (144 | 25.7%), Retail Trade (81 | 14.4%), Public Administration (56 | 10.0%), Educational Services (52 | 9.3%), and Accommodation & Food Services (41 | 7.3%).
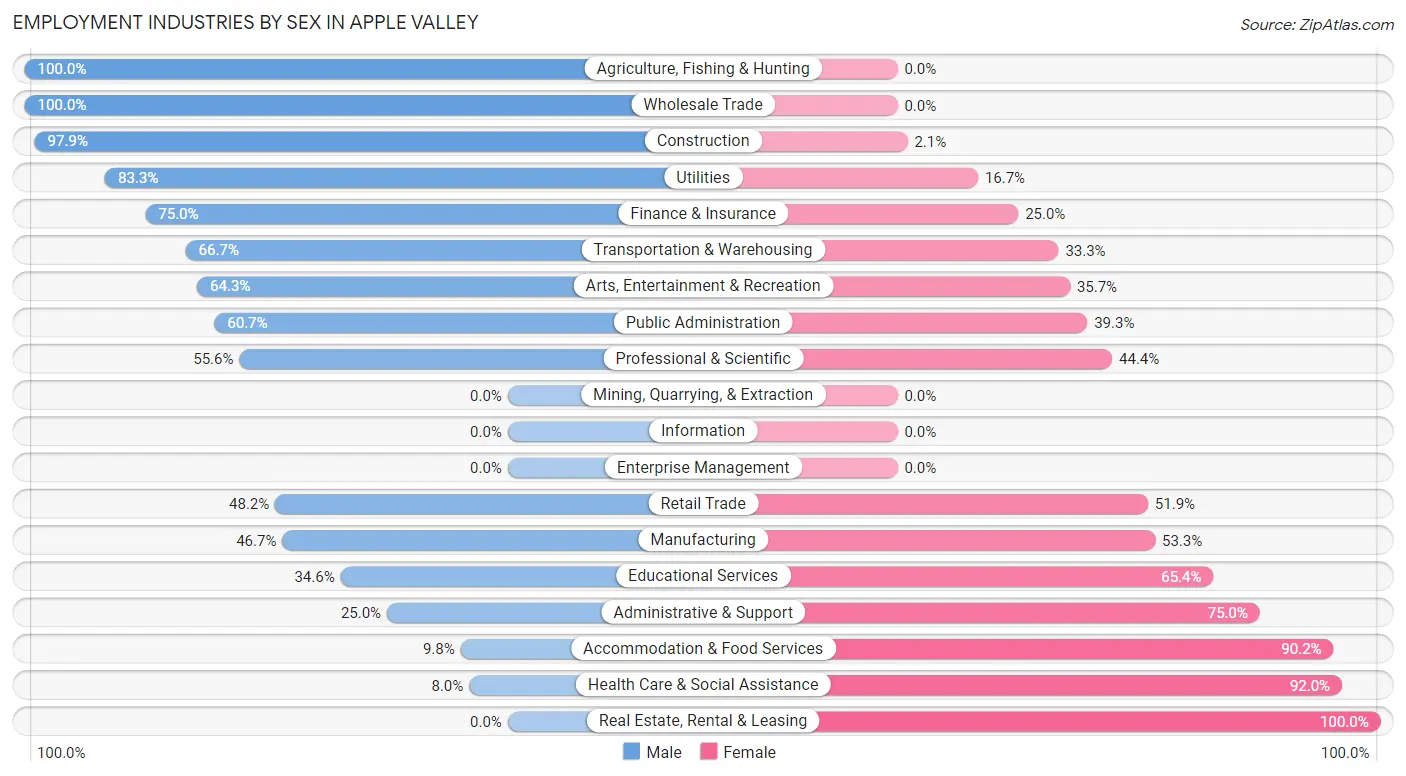
Employment Industries by Sex in Apple Valley
The Apple Valley industries that see more men than women are Agriculture, Fishing & Hunting (100.0%), Wholesale Trade (100.0%), and Construction (97.9%), whereas the industries that tend to have a higher number of women are Real Estate, Rental & Leasing (100.0%), Health Care & Social Assistance (92.0%), and Accommodation & Food Services (90.2%).
| Industry | Male | Female |
| Agriculture, Fishing & Hunting | 7 (100.0%) | 0 (0.0%) |
| Mining, Quarrying, & Extraction | 0 (0.0%) | 0 (0.0%) |
| Construction | 141 (97.9%) | 3 (2.1%) |
| Manufacturing | 14 (46.7%) | 16 (53.3%) |
| Wholesale Trade | 4 (100.0%) | 0 (0.0%) |
| Retail Trade | 39 (48.1%) | 42 (51.8%) |
| Transportation & Warehousing | 22 (66.7%) | 11 (33.3%) |
| Utilities | 10 (83.3%) | 2 (16.7%) |
| Information | 0 (0.0%) | 0 (0.0%) |
| Finance & Insurance | 12 (75.0%) | 4 (25.0%) |
| Real Estate, Rental & Leasing | 0 (0.0%) | 3 (100.0%) |
| Professional & Scientific | 10 (55.6%) | 8 (44.4%) |
| Enterprise Management | 0 (0.0%) | 0 (0.0%) |
| Administrative & Support | 3 (25.0%) | 9 (75.0%) |
| Educational Services | 18 (34.6%) | 34 (65.4%) |
| Health Care & Social Assistance | 2 (8.0%) | 23 (92.0%) |
| Arts, Entertainment & Recreation | 9 (64.3%) | 5 (35.7%) |
| Accommodation & Food Services | 4 (9.8%) | 37 (90.2%) |
| Public Administration | 34 (60.7%) | 22 (39.3%) |
| Total | 336 (59.9%) | 225 (40.1%) |
Education in Apple Valley
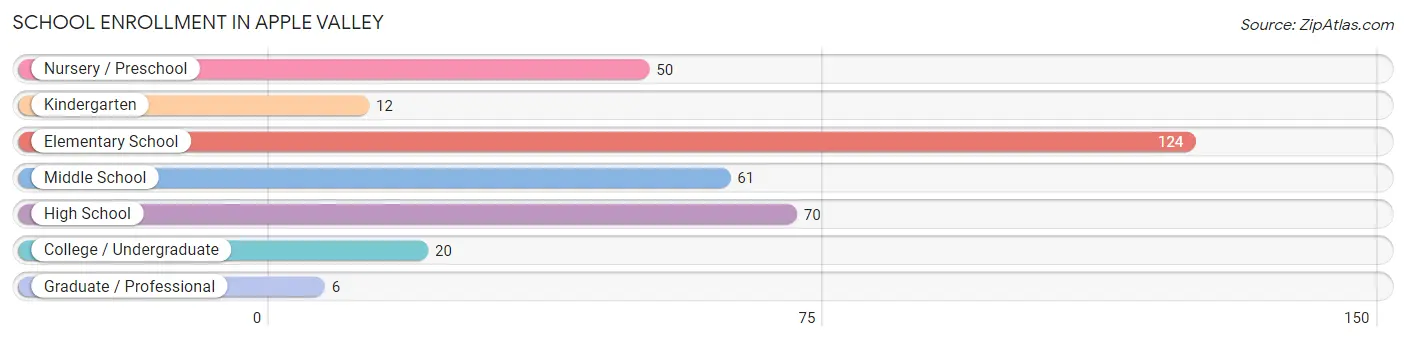
School Enrollment in Apple Valley
The most common levels of schooling among the 343 students in Apple Valley are elementary school (124 | 36.1%), high school (70 | 20.4%), and middle school (61 | 17.8%).
| School Level | # Students | % Students |
| Nursery / Preschool | 50 | 14.6% |
| Kindergarten | 12 | 3.5% |
| Elementary School | 124 | 36.1% |
| Middle School | 61 | 17.8% |
| High School | 70 | 20.4% |
| College / Undergraduate | 20 | 5.8% |
| Graduate / Professional | 6 | 1.8% |
| Total | 343 | 100.0% |
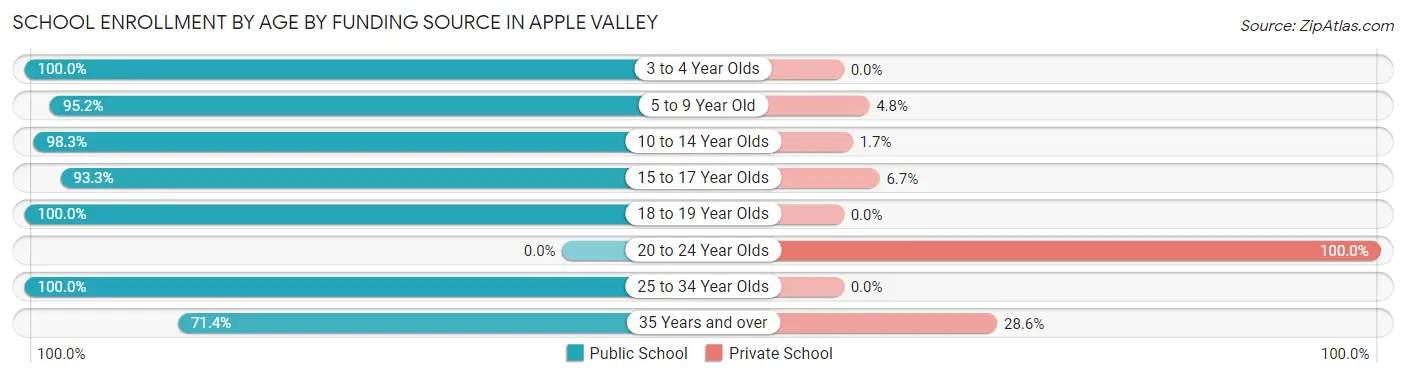
School Enrollment by Age by Funding Source in Apple Valley
Out of a total of 343 students who are enrolled in schools in Apple Valley, 22 (6.4%) attend a private institution, while the remaining 321 (93.6%) are enrolled in public schools. The age group of 20 to 24 year olds has the highest likelihood of being enrolled in private schools, with 7 (100.0% in the age bracket) enrolled. Conversely, the age group of 3 to 4 year olds has the lowest likelihood of being enrolled in a private school, with 50 (100.0% in the age bracket) attending a public institution.
| Age Bracket | Public School | Private School |
| 3 to 4 Year Olds | 50 (100.0%) | 0 (0.0%) |
| 5 to 9 Year Old | 80 (95.2%) | 4 (4.8%) |
| 10 to 14 Year Olds | 117 (98.3%) | 2 (1.7%) |
| 15 to 17 Year Olds | 42 (93.3%) | 3 (6.7%) |
| 18 to 19 Year Olds | 13 (100.0%) | 0 (0.0%) |
| 20 to 24 Year Olds | 0 (0.0%) | 7 (100.0%) |
| 25 to 34 Year Olds | 4 (100.0%) | 0 (0.0%) |
| 35 Years and over | 15 (71.4%) | 6 (28.6%) |
| Total | 321 (93.6%) | 22 (6.4%) |
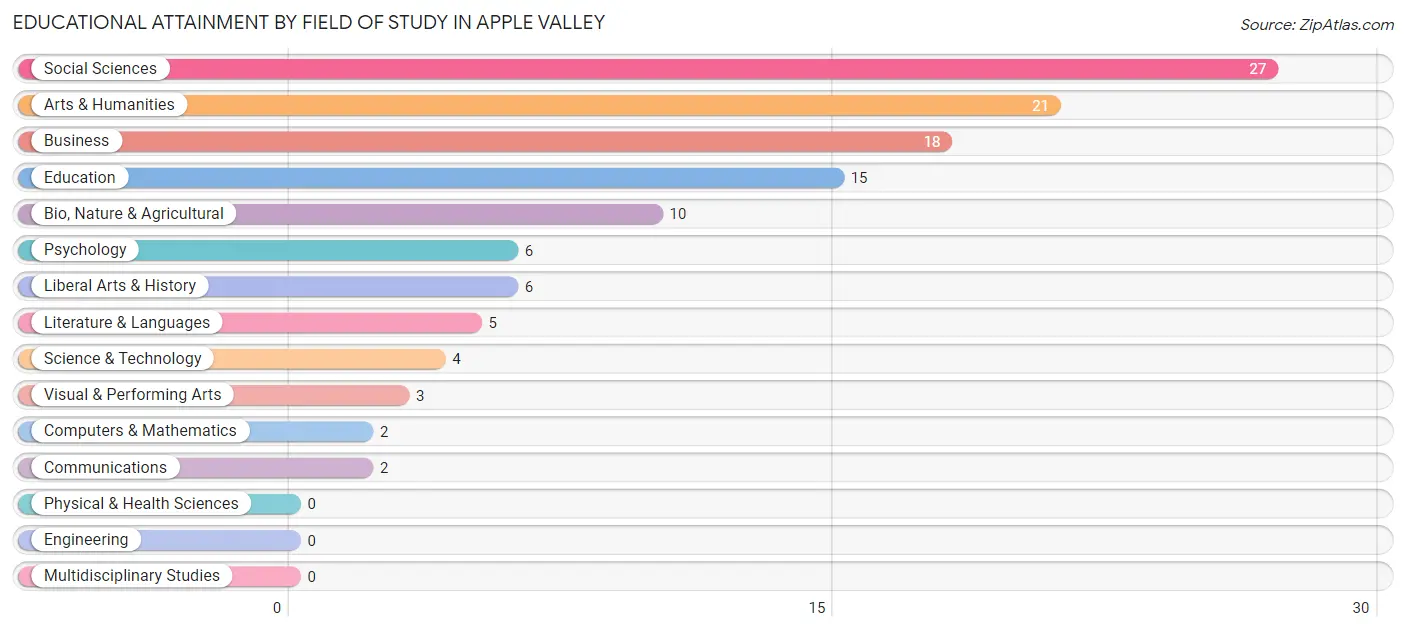
Educational Attainment by Field of Study in Apple Valley
Social sciences (27 | 22.7%), arts & humanities (21 | 17.6%), business (18 | 15.1%), education (15 | 12.6%), and bio, nature & agricultural (10 | 8.4%) are the most common fields of study among 119 individuals in Apple Valley who have obtained a bachelor's degree or higher.
| Field of Study | # Graduates | % Graduates |
| Computers & Mathematics | 2 | 1.7% |
| Bio, Nature & Agricultural | 10 | 8.4% |
| Physical & Health Sciences | 0 | 0.0% |
| Psychology | 6 | 5.0% |
| Social Sciences | 27 | 22.7% |
| Engineering | 0 | 0.0% |
| Multidisciplinary Studies | 0 | 0.0% |
| Science & Technology | 4 | 3.4% |
| Business | 18 | 15.1% |
| Education | 15 | 12.6% |
| Literature & Languages | 5 | 4.2% |
| Liberal Arts & History | 6 | 5.0% |
| Visual & Performing Arts | 3 | 2.5% |
| Communications | 2 | 1.7% |
| Arts & Humanities | 21 | 17.6% |
| Total | 119 | 100.0% |
Transportation & Commute in Apple Valley
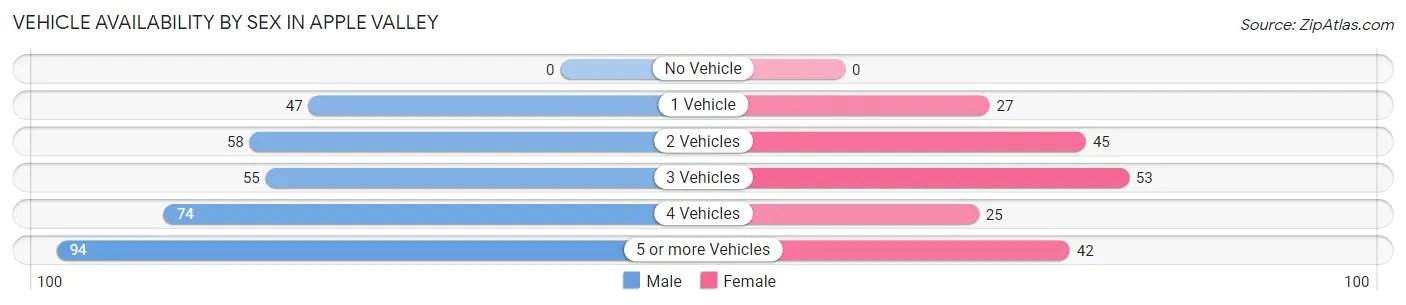
Vehicle Availability by Sex in Apple Valley
The most prevalent vehicle ownership categories in Apple Valley are males with 5 or more vehicles (94, accounting for 28.7%) and females with 5 or more vehicles (42, making up 49.0%).
| Vehicles Available | Male | Female |
| No Vehicle | 0 (0.0%) | 0 (0.0%) |
| 1 Vehicle | 47 (14.3%) | 27 (14.1%) |
| 2 Vehicles | 58 (17.7%) | 45 (23.4%) |
| 3 Vehicles | 55 (16.8%) | 53 (27.6%) |
| 4 Vehicles | 74 (22.6%) | 25 (13.0%) |
| 5 or more Vehicles | 94 (28.7%) | 42 (21.9%) |
| Total | 328 (100.0%) | 192 (100.0%) |
Commute Time in Apple Valley
The most frequently occuring commute durations in Apple Valley are 45 to 59 minutes (87 commuters, 20.0%), 25 to 29 minutes (65 commuters, 14.9%), and 30 to 34 minutes (59 commuters, 13.6%).
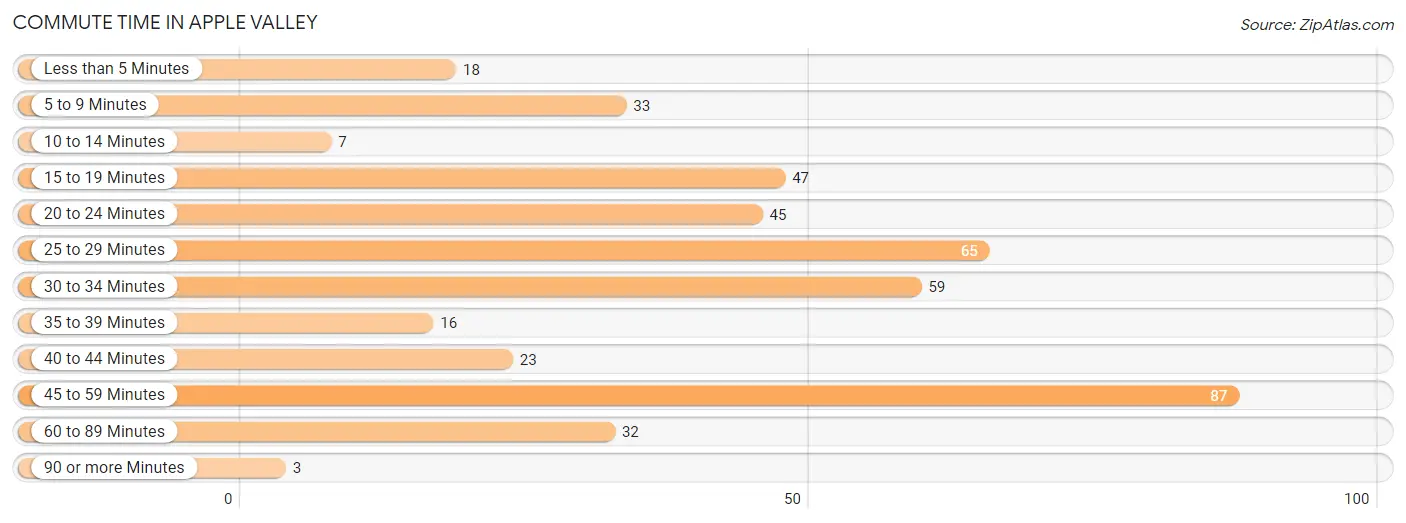
| Commute Time | # Commuters | % Commuters |
| Less than 5 Minutes | 18 | 4.1% |
| 5 to 9 Minutes | 33 | 7.6% |
| 10 to 14 Minutes | 7 | 1.6% |
| 15 to 19 Minutes | 47 | 10.8% |
| 20 to 24 Minutes | 45 | 10.3% |
| 25 to 29 Minutes | 65 | 14.9% |
| 30 to 34 Minutes | 59 | 13.6% |
| 35 to 39 Minutes | 16 | 3.7% |
| 40 to 44 Minutes | 23 | 5.3% |
| 45 to 59 Minutes | 87 | 20.0% |
| 60 to 89 Minutes | 32 | 7.4% |
| 90 or more Minutes | 3 | 0.7% |
Commute Time by Sex in Apple Valley
The most common commute times in Apple Valley are 25 to 29 minutes (61 commuters, 21.9%) for males and 45 to 59 minutes (37 commuters, 23.7%) for females.
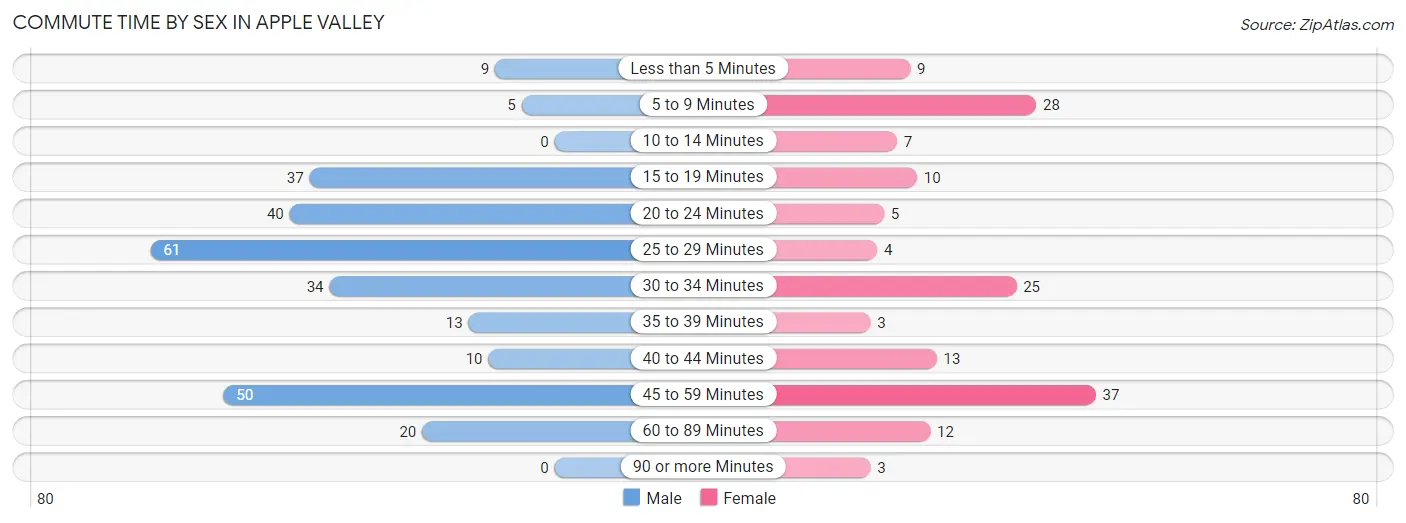
| Commute Time | Male | Female |
| Less than 5 Minutes | 9 (3.2%) | 9 (5.8%) |
| 5 to 9 Minutes | 5 (1.8%) | 28 (17.9%) |
| 10 to 14 Minutes | 0 (0.0%) | 7 (4.5%) |
| 15 to 19 Minutes | 37 (13.3%) | 10 (6.4%) |
| 20 to 24 Minutes | 40 (14.3%) | 5 (3.2%) |
| 25 to 29 Minutes | 61 (21.9%) | 4 (2.6%) |
| 30 to 34 Minutes | 34 (12.2%) | 25 (16.0%) |
| 35 to 39 Minutes | 13 (4.7%) | 3 (1.9%) |
| 40 to 44 Minutes | 10 (3.6%) | 13 (8.3%) |
| 45 to 59 Minutes | 50 (17.9%) | 37 (23.7%) |
| 60 to 89 Minutes | 20 (7.2%) | 12 (7.7%) |
| 90 or more Minutes | 0 (0.0%) | 3 (1.9%) |
Time of Departure to Work by Sex in Apple Valley
The most frequent times of departure to work in Apple Valley are 8:00 AM to 8:29 AM (85, 30.5%) for males and 5:00 AM to 5:29 AM (23, 14.7%) for females.
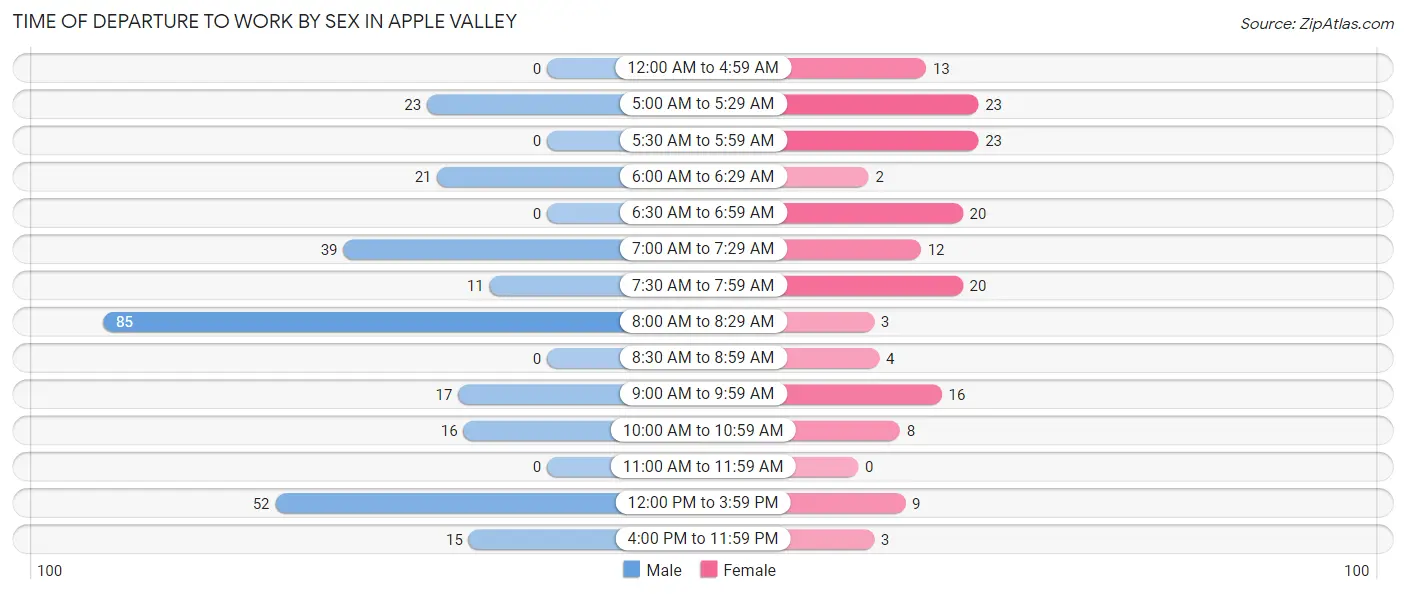
| Time of Departure | Male | Female |
| 12:00 AM to 4:59 AM | 0 (0.0%) | 13 (8.3%) |
| 5:00 AM to 5:29 AM | 23 (8.2%) | 23 (14.7%) |
| 5:30 AM to 5:59 AM | 0 (0.0%) | 23 (14.7%) |
| 6:00 AM to 6:29 AM | 21 (7.5%) | 2 (1.3%) |
| 6:30 AM to 6:59 AM | 0 (0.0%) | 20 (12.8%) |
| 7:00 AM to 7:29 AM | 39 (14.0%) | 12 (7.7%) |
| 7:30 AM to 7:59 AM | 11 (3.9%) | 20 (12.8%) |
| 8:00 AM to 8:29 AM | 85 (30.5%) | 3 (1.9%) |
| 8:30 AM to 8:59 AM | 0 (0.0%) | 4 (2.6%) |
| 9:00 AM to 9:59 AM | 17 (6.1%) | 16 (10.3%) |
| 10:00 AM to 10:59 AM | 16 (5.7%) | 8 (5.1%) |
| 11:00 AM to 11:59 AM | 0 (0.0%) | 0 (0.0%) |
| 12:00 PM to 3:59 PM | 52 (18.6%) | 9 (5.8%) |
| 4:00 PM to 11:59 PM | 15 (5.4%) | 3 (1.9%) |
| Total | 279 (100.0%) | 156 (100.0%) |
Housing Occupancy in Apple Valley
Occupancy by Ownership in Apple Valley
Of the total 393 dwellings in Apple Valley, owner-occupied units account for 374 (95.2%), while renter-occupied units make up 19 (4.8%).
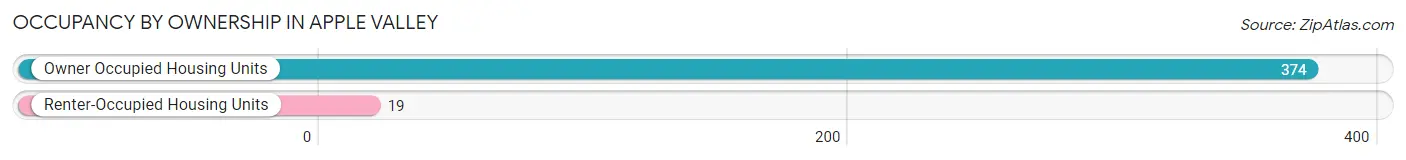
| Occupancy | # Housing Units | % Housing Units |
| Owner Occupied Housing Units | 374 | 95.2% |
| Renter-Occupied Housing Units | 19 | 4.8% |
| Total Occupied Housing Units | 393 | 100.0% |
Occupancy by Household Size in Apple Valley
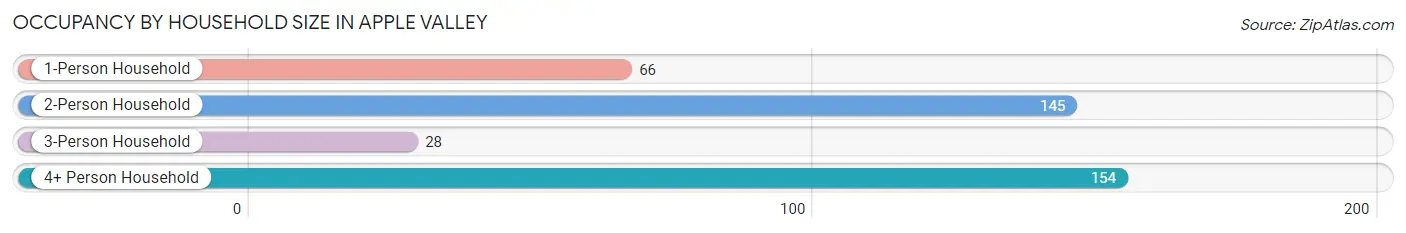
| Household Size | # Housing Units | % Housing Units |
| 1-Person Household | 66 | 16.8% |
| 2-Person Household | 145 | 36.9% |
| 3-Person Household | 28 | 7.1% |
| 4+ Person Household | 154 | 39.2% |
| Total Housing Units | 393 | 100.0% |
Occupancy by Ownership by Household Size in Apple Valley
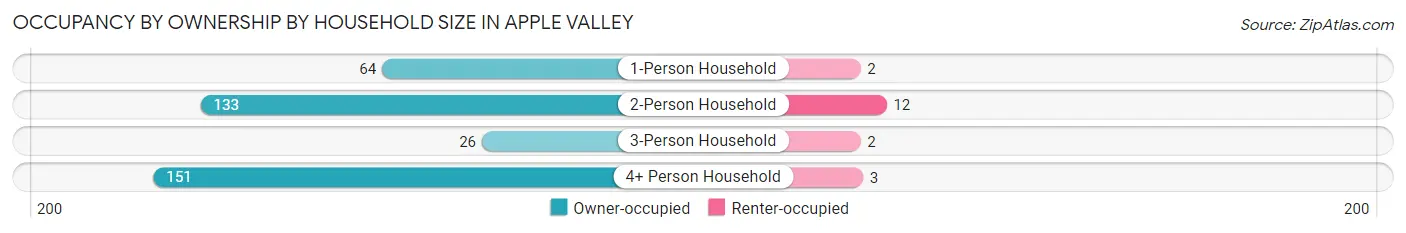
| Household Size | Owner-occupied | Renter-occupied |
| 1-Person Household | 64 (97.0%) | 2 (3.0%) |
| 2-Person Household | 133 (91.7%) | 12 (8.3%) |
| 3-Person Household | 26 (92.9%) | 2 (7.1%) |
| 4+ Person Household | 151 (98.1%) | 3 (1.9%) |
| Total Housing Units | 374 (95.2%) | 19 (4.8%) |
Occupancy by Educational Attainment in Apple Valley
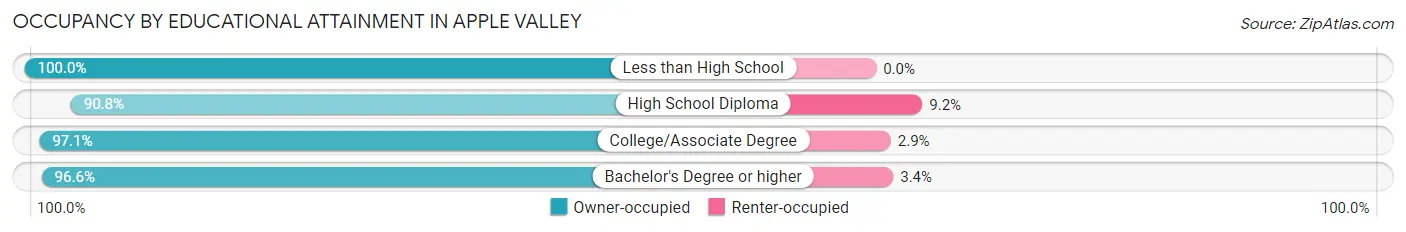
| Household Size | Owner-occupied | Renter-occupied |
| Less than High School | 31 (100.0%) | 0 (0.0%) |
| High School Diploma | 119 (90.8%) | 12 (9.2%) |
| College/Associate Degree | 167 (97.1%) | 5 (2.9%) |
| Bachelor's Degree or higher | 57 (96.6%) | 2 (3.4%) |
Occupancy by Age of Householder in Apple Valley
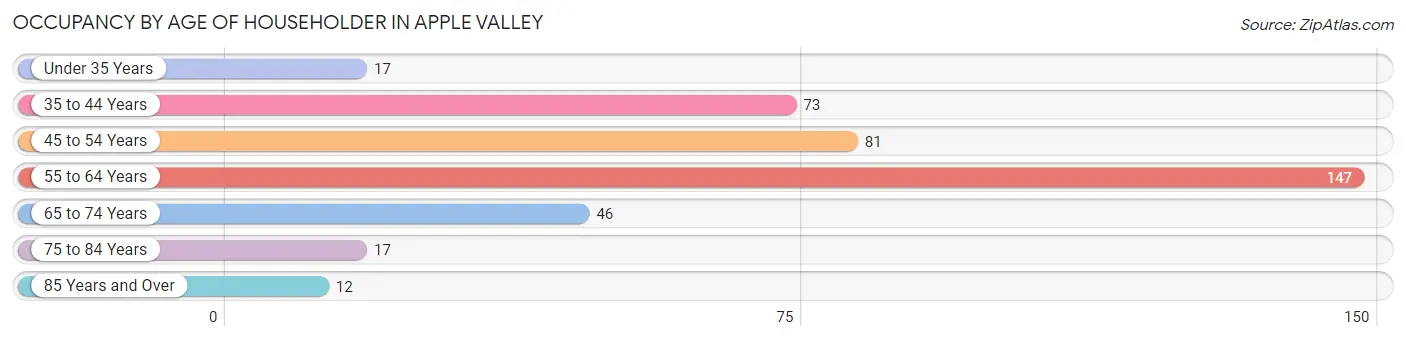
| Age Bracket | # Households | % Households |
| Under 35 Years | 17 | 4.3% |
| 35 to 44 Years | 73 | 18.6% |
| 45 to 54 Years | 81 | 20.6% |
| 55 to 64 Years | 147 | 37.4% |
| 65 to 74 Years | 46 | 11.7% |
| 75 to 84 Years | 17 | 4.3% |
| 85 Years and Over | 12 | 3.0% |
| Total | 393 | 100.0% |
Housing Finances in Apple Valley
Median Income by Occupancy in Apple Valley
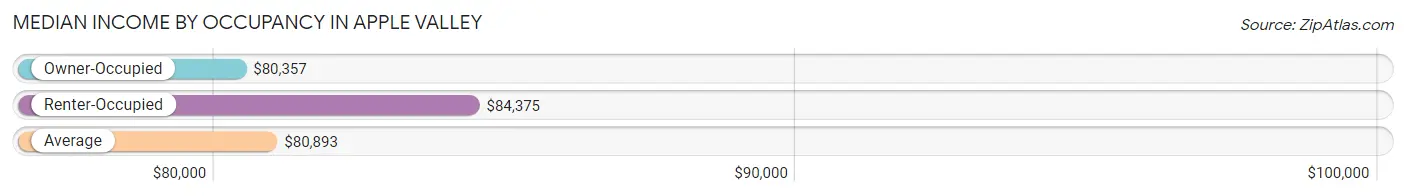
| Occupancy Type | # Households | Median Income |
| Owner-Occupied | 374 (95.2%) | $80,357 |
| Renter-Occupied | 19 (4.8%) | $84,375 |
| Average | 393 (100.0%) | $80,893 |
Occupancy by Householder Income Bracket in Apple Valley
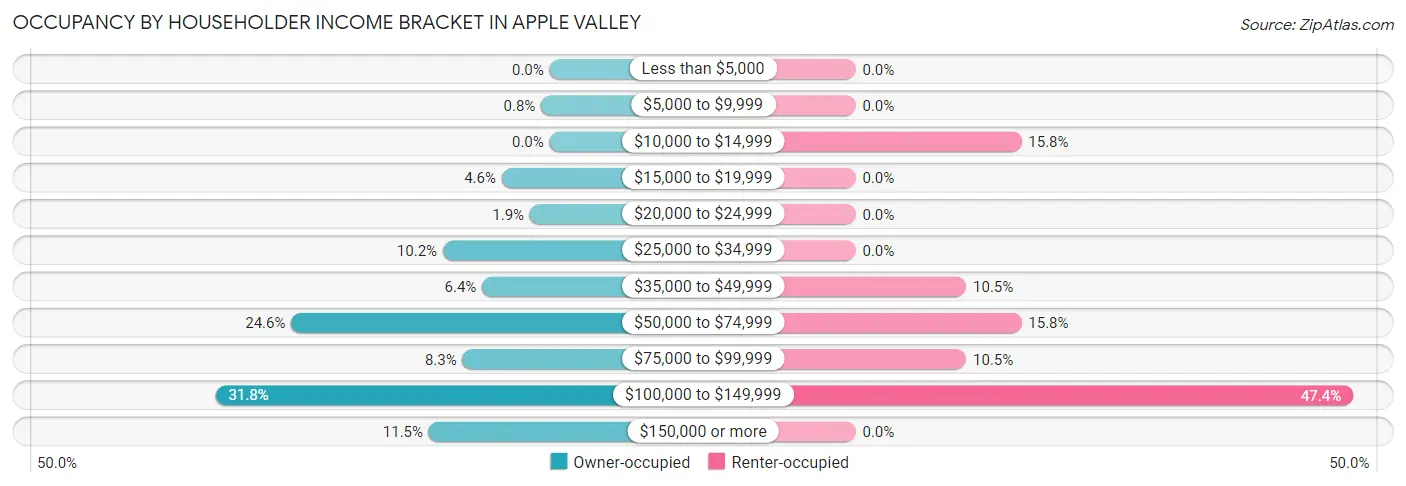
| Income Bracket | Owner-occupied | Renter-occupied |
| Less than $5,000 | 0 (0.0%) | 0 (0.0%) |
| $5,000 to $9,999 | 3 (0.8%) | 0 (0.0%) |
| $10,000 to $14,999 | 0 (0.0%) | 3 (15.8%) |
| $15,000 to $19,999 | 17 (4.5%) | 0 (0.0%) |
| $20,000 to $24,999 | 7 (1.9%) | 0 (0.0%) |
| $25,000 to $34,999 | 38 (10.2%) | 0 (0.0%) |
| $35,000 to $49,999 | 24 (6.4%) | 2 (10.5%) |
| $50,000 to $74,999 | 92 (24.6%) | 3 (15.8%) |
| $75,000 to $99,999 | 31 (8.3%) | 2 (10.5%) |
| $100,000 to $149,999 | 119 (31.8%) | 9 (47.4%) |
| $150,000 or more | 43 (11.5%) | 0 (0.0%) |
| Total | 374 (100.0%) | 19 (100.0%) |
Monthly Housing Cost Tiers in Apple Valley
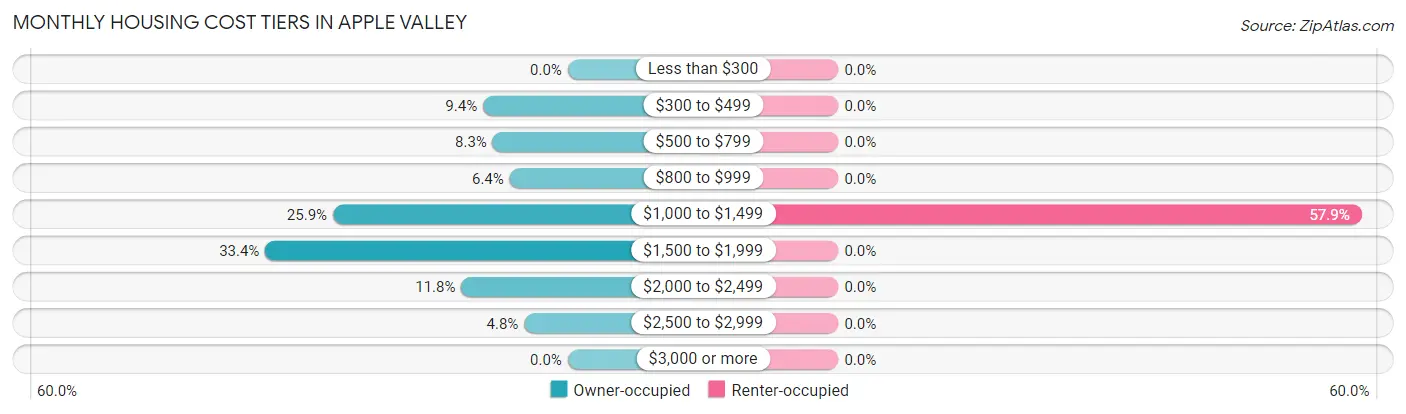
| Monthly Cost | Owner-occupied | Renter-occupied |
| Less than $300 | 0 (0.0%) | 0 (0.0%) |
| $300 to $499 | 35 (9.4%) | 0 (0.0%) |
| $500 to $799 | 31 (8.3%) | 0 (0.0%) |
| $800 to $999 | 24 (6.4%) | 0 (0.0%) |
| $1,000 to $1,499 | 97 (25.9%) | 11 (57.9%) |
| $1,500 to $1,999 | 125 (33.4%) | 0 (0.0%) |
| $2,000 to $2,499 | 44 (11.8%) | 0 (0.0%) |
| $2,500 to $2,999 | 18 (4.8%) | 0 (0.0%) |
| $3,000 or more | 0 (0.0%) | 0 (0.0%) |
| Total | 374 (100.0%) | 19 (100.0%) |
Physical Housing Characteristics in Apple Valley
Housing Structures in Apple Valley
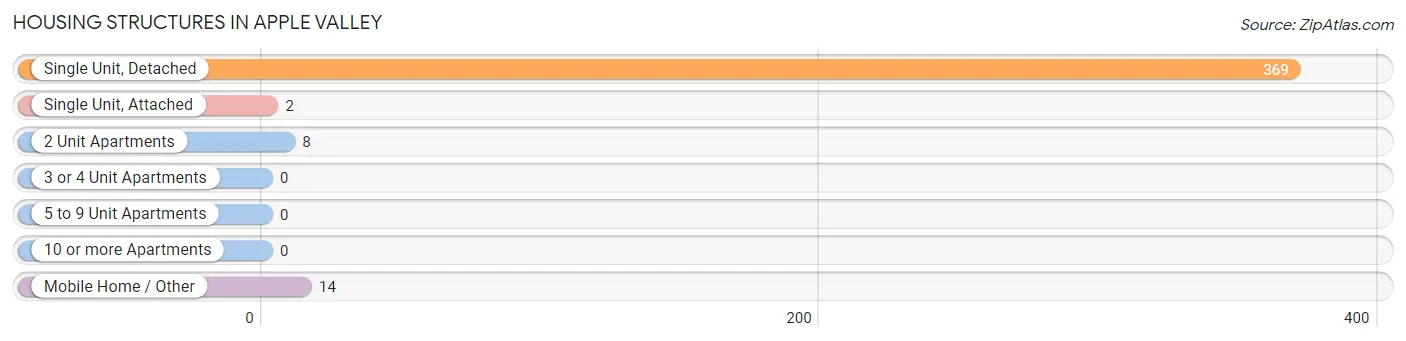
| Structure Type | # Housing Units | % Housing Units |
| Single Unit, Detached | 369 | 93.9% |
| Single Unit, Attached | 2 | 0.5% |
| 2 Unit Apartments | 8 | 2.0% |
| 3 or 4 Unit Apartments | 0 | 0.0% |
| 5 to 9 Unit Apartments | 0 | 0.0% |
| 10 or more Apartments | 0 | 0.0% |
| Mobile Home / Other | 14 | 3.6% |
| Total | 393 | 100.0% |
Housing Structures by Occupancy in Apple Valley
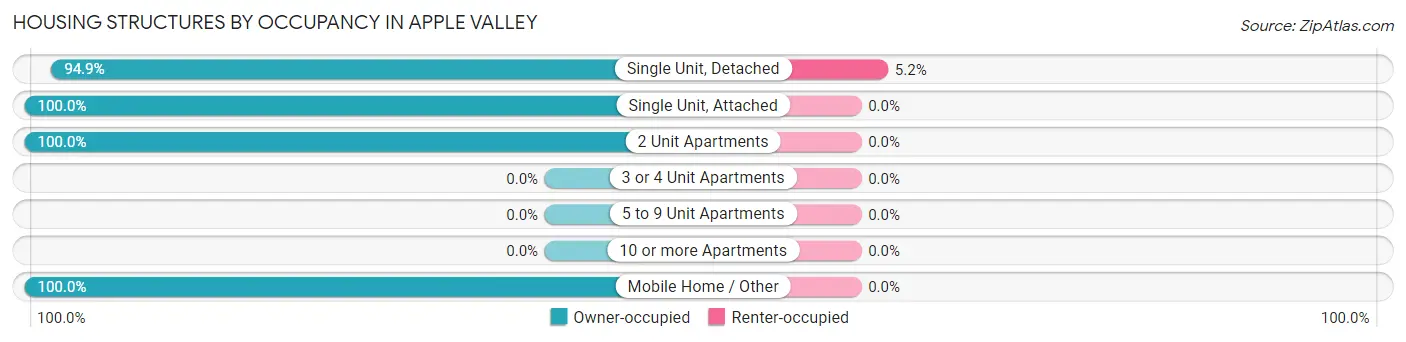
| Structure Type | Owner-occupied | Renter-occupied |
| Single Unit, Detached | 350 (94.9%) | 19 (5.1%) |
| Single Unit, Attached | 2 (100.0%) | 0 (0.0%) |
| 2 Unit Apartments | 8 (100.0%) | 0 (0.0%) |
| 3 or 4 Unit Apartments | 0 (0.0%) | 0 (0.0%) |
| 5 to 9 Unit Apartments | 0 (0.0%) | 0 (0.0%) |
| 10 or more Apartments | 0 (0.0%) | 0 (0.0%) |
| Mobile Home / Other | 14 (100.0%) | 0 (0.0%) |
| Total | 374 (95.2%) | 19 (4.8%) |
Housing Structures by Number of Rooms in Apple Valley
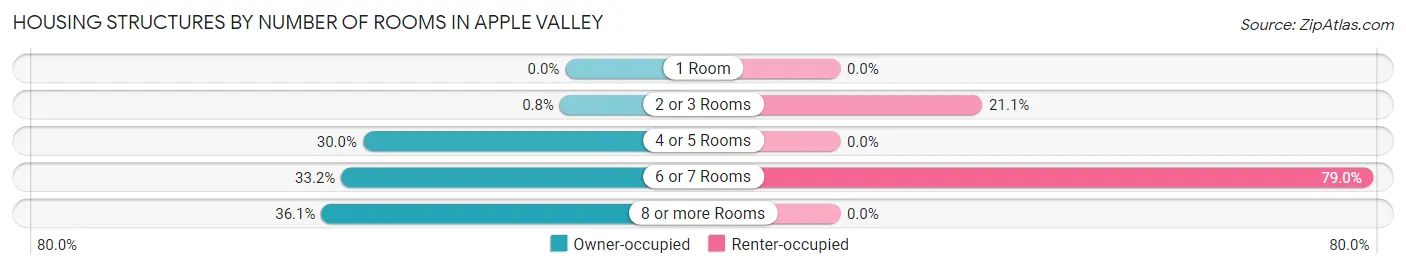
| Number of Rooms | Owner-occupied | Renter-occupied |
| 1 Room | 0 (0.0%) | 0 (0.0%) |
| 2 or 3 Rooms | 3 (0.8%) | 4 (21.0%) |
| 4 or 5 Rooms | 112 (29.9%) | 0 (0.0%) |
| 6 or 7 Rooms | 124 (33.2%) | 15 (78.9%) |
| 8 or more Rooms | 135 (36.1%) | 0 (0.0%) |
| Total | 374 (100.0%) | 19 (100.0%) |
Housing Structure by Heating Type in Apple Valley
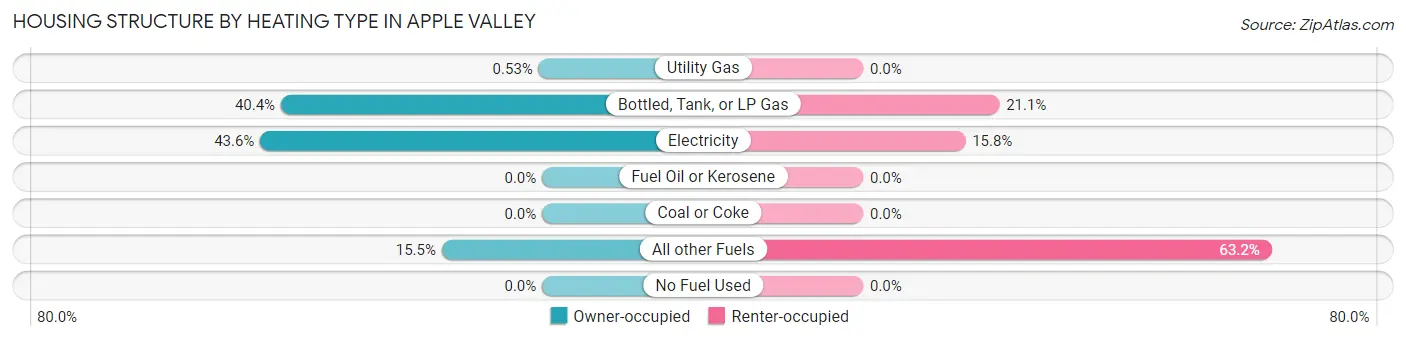
| Heating Type | Owner-occupied | Renter-occupied |
| Utility Gas | 2 (0.5%) | 0 (0.0%) |
| Bottled, Tank, or LP Gas | 151 (40.4%) | 4 (21.0%) |
| Electricity | 163 (43.6%) | 3 (15.8%) |
| Fuel Oil or Kerosene | 0 (0.0%) | 0 (0.0%) |
| Coal or Coke | 0 (0.0%) | 0 (0.0%) |
| All other Fuels | 58 (15.5%) | 12 (63.2%) |
| No Fuel Used | 0 (0.0%) | 0 (0.0%) |
| Total | 374 (100.0%) | 19 (100.0%) |
Household Vehicle Usage in Apple Valley
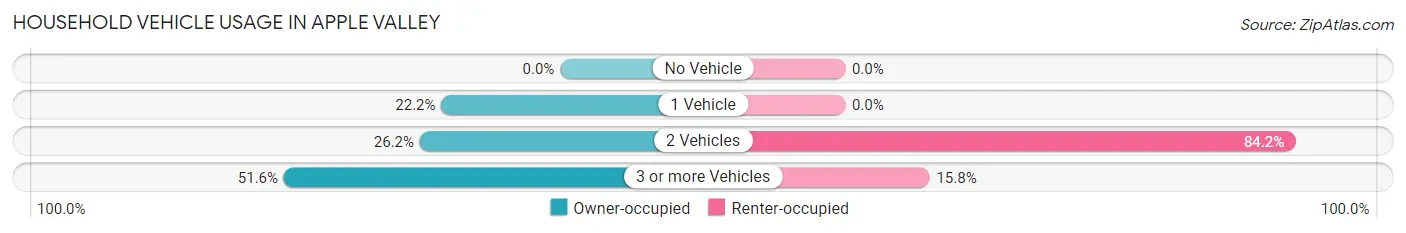
| Vehicles per Household | Owner-occupied | Renter-occupied |
| No Vehicle | 0 (0.0%) | 0 (0.0%) |
| 1 Vehicle | 83 (22.2%) | 0 (0.0%) |
| 2 Vehicles | 98 (26.2%) | 16 (84.2%) |
| 3 or more Vehicles | 193 (51.6%) | 3 (15.8%) |
| Total | 374 (100.0%) | 19 (100.0%) |
Real Estate & Mortgages in Apple Valley
Real Estate and Mortgage Overview in Apple Valley
| Characteristic | Without Mortgage | With Mortgage |
| Housing Units | 87 | 287 |
| Median Property Value | $438,200 | $440,200 |
| Median Household Income | $60,417 | $17 |
| Monthly Housing Costs | $635 | $0 |
| Real Estate Taxes | $2,013 | $11 |
Property Value by Mortgage Status in Apple Valley
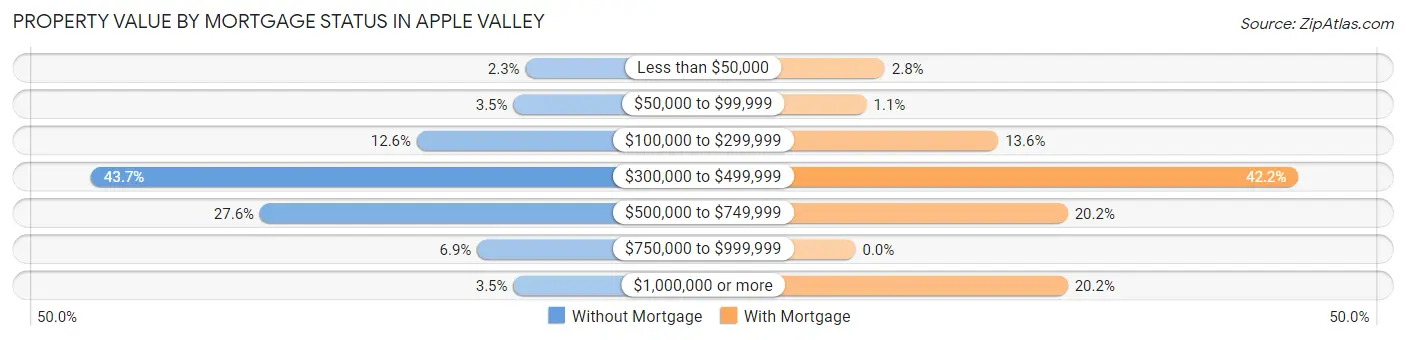
| Property Value | Without Mortgage | With Mortgage |
| Less than $50,000 | 2 (2.3%) | 8 (2.8%) |
| $50,000 to $99,999 | 3 (3.5%) | 3 (1.1%) |
| $100,000 to $299,999 | 11 (12.6%) | 39 (13.6%) |
| $300,000 to $499,999 | 38 (43.7%) | 121 (42.2%) |
| $500,000 to $749,999 | 24 (27.6%) | 58 (20.2%) |
| $750,000 to $999,999 | 6 (6.9%) | 0 (0.0%) |
| $1,000,000 or more | 3 (3.5%) | 58 (20.2%) |
| Total | 87 (100.0%) | 287 (100.0%) |
Household Income by Mortgage Status in Apple Valley
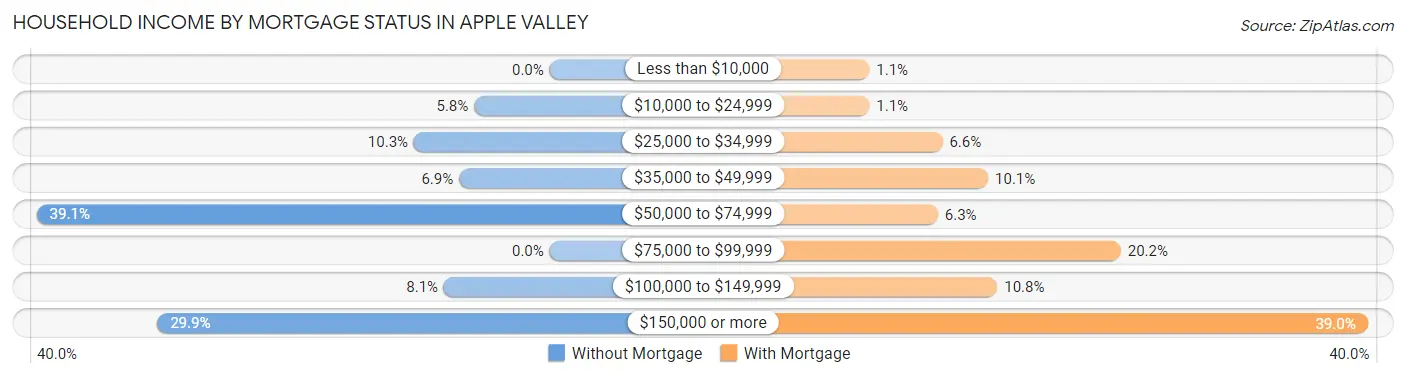
| Household Income | Without Mortgage | With Mortgage |
| Less than $10,000 | 0 (0.0%) | 3 (1.1%) |
| $10,000 to $24,999 | 5 (5.8%) | 3 (1.1%) |
| $25,000 to $34,999 | 9 (10.3%) | 19 (6.6%) |
| $35,000 to $49,999 | 6 (6.9%) | 29 (10.1%) |
| $50,000 to $74,999 | 34 (39.1%) | 18 (6.3%) |
| $75,000 to $99,999 | 0 (0.0%) | 58 (20.2%) |
| $100,000 to $149,999 | 7 (8.1%) | 31 (10.8%) |
| $150,000 or more | 26 (29.9%) | 112 (39.0%) |
| Total | 87 (100.0%) | 287 (100.0%) |
Property Value to Household Income Ratio in Apple Valley
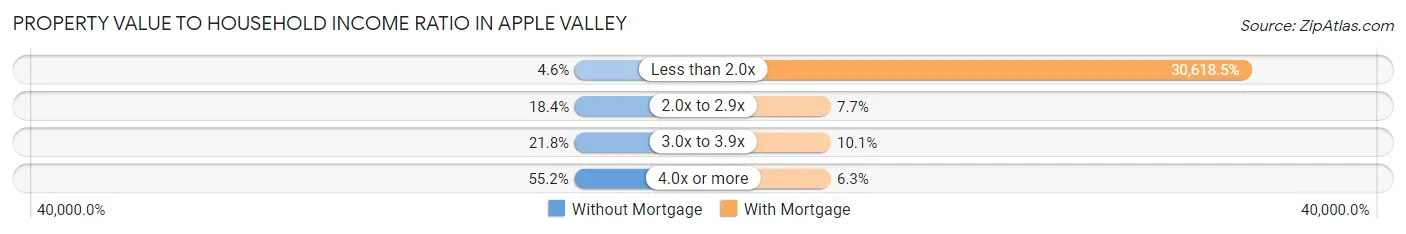
| Value-to-Income Ratio | Without Mortgage | With Mortgage |
| Less than 2.0x | 4 (4.6%) | 87,875 (30,618.5%) |
| 2.0x to 2.9x | 16 (18.4%) | 22 (7.7%) |
| 3.0x to 3.9x | 19 (21.8%) | 29 (10.1%) |
| 4.0x or more | 48 (55.2%) | 18 (6.3%) |
| Total | 87 (100.0%) | 287 (100.0%) |
Real Estate Taxes by Mortgage Status in Apple Valley
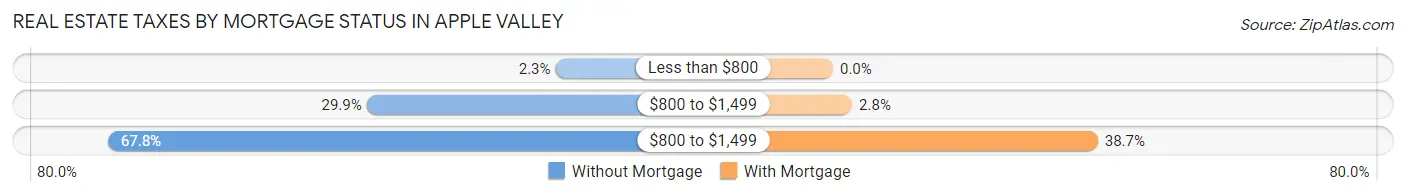
| Property Taxes | Without Mortgage | With Mortgage |
| Less than $800 | 2 (2.3%) | 0 (0.0%) |
| $800 to $1,499 | 26 (29.9%) | 8 (2.8%) |
| $800 to $1,499 | 59 (67.8%) | 111 (38.7%) |
| Total | 87 (100.0%) | 287 (100.0%) |
Health & Disability in Apple Valley
Health Insurance Coverage by Age in Apple Valley
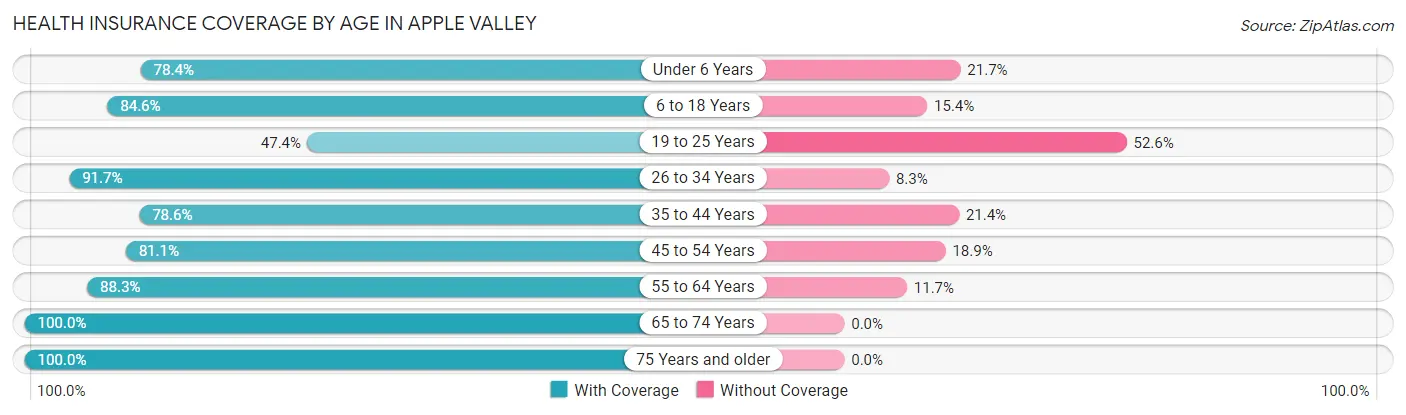
| Age Bracket | With Coverage | Without Coverage |
| Under 6 Years | 76 (78.3%) | 21 (21.6%) |
| 6 to 18 Years | 230 (84.6%) | 42 (15.4%) |
| 19 to 25 Years | 27 (47.4%) | 30 (52.6%) |
| 26 to 34 Years | 77 (91.7%) | 7 (8.3%) |
| 35 to 44 Years | 125 (78.6%) | 34 (21.4%) |
| 45 to 54 Years | 129 (81.1%) | 30 (18.9%) |
| 55 to 64 Years | 227 (88.3%) | 30 (11.7%) |
| 65 to 74 Years | 92 (100.0%) | 0 (0.0%) |
| 75 Years and older | 56 (100.0%) | 0 (0.0%) |
| Total | 1,039 (84.3%) | 194 (15.7%) |
Health Insurance Coverage by Citizenship Status in Apple Valley
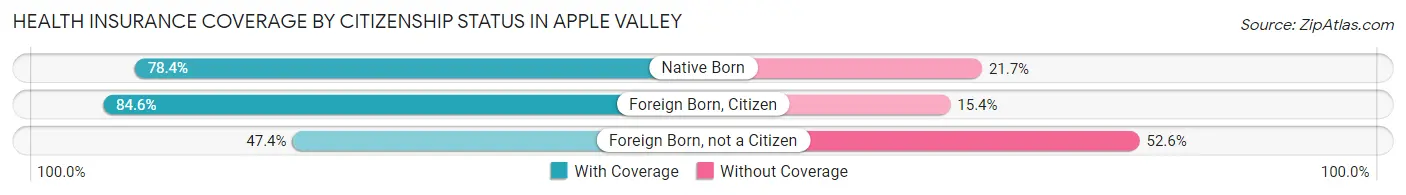
| Citizenship Status | With Coverage | Without Coverage |
| Native Born | 76 (78.3%) | 21 (21.6%) |
| Foreign Born, Citizen | 230 (84.6%) | 42 (15.4%) |
| Foreign Born, not a Citizen | 27 (47.4%) | 30 (52.6%) |
Health Insurance Coverage by Household Income in Apple Valley
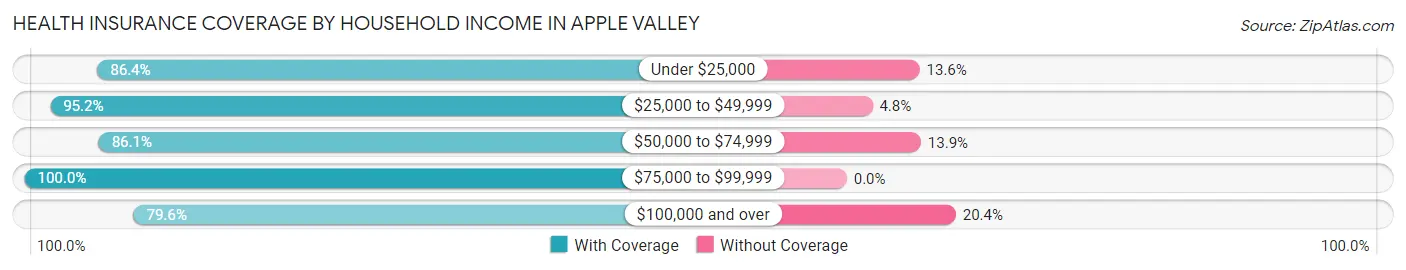
| Household Income | With Coverage | Without Coverage |
| Under $25,000 | 57 (86.4%) | 9 (13.6%) |
| $25,000 to $49,999 | 99 (95.2%) | 5 (4.8%) |
| $50,000 to $74,999 | 217 (86.1%) | 35 (13.9%) |
| $75,000 to $99,999 | 101 (100.0%) | 0 (0.0%) |
| $100,000 and over | 565 (79.6%) | 145 (20.4%) |
Public vs Private Health Insurance Coverage by Age in Apple Valley
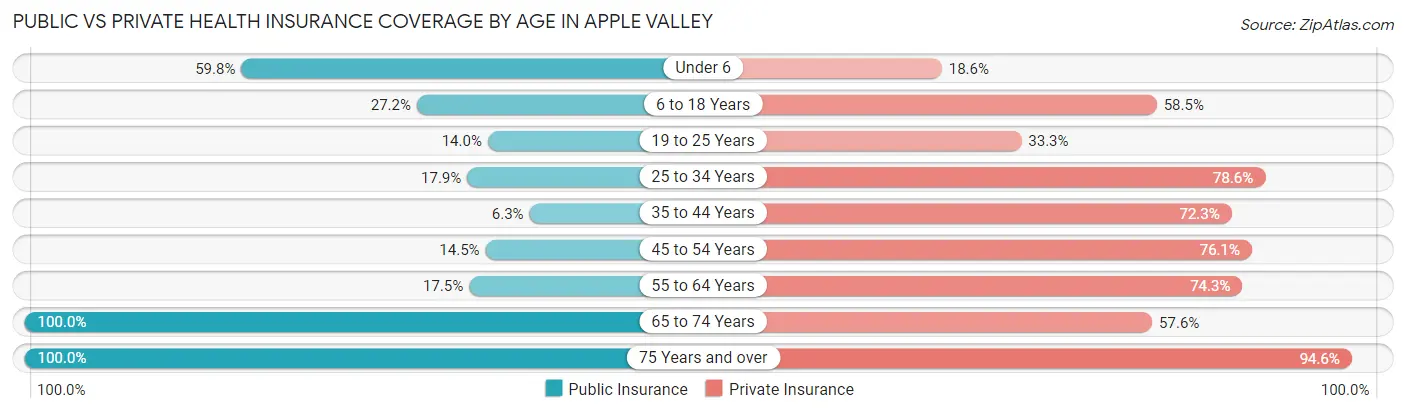
| Age Bracket | Public Insurance | Private Insurance |
| Under 6 | 58 (59.8%) | 18 (18.6%) |
| 6 to 18 Years | 74 (27.2%) | 159 (58.5%) |
| 19 to 25 Years | 8 (14.0%) | 19 (33.3%) |
| 25 to 34 Years | 15 (17.9%) | 66 (78.6%) |
| 35 to 44 Years | 10 (6.3%) | 115 (72.3%) |
| 45 to 54 Years | 23 (14.5%) | 121 (76.1%) |
| 55 to 64 Years | 45 (17.5%) | 191 (74.3%) |
| 65 to 74 Years | 92 (100.0%) | 53 (57.6%) |
| 75 Years and over | 56 (100.0%) | 53 (94.6%) |
| Total | 381 (30.9%) | 795 (64.5%) |
Disability Status by Sex by Age in Apple Valley
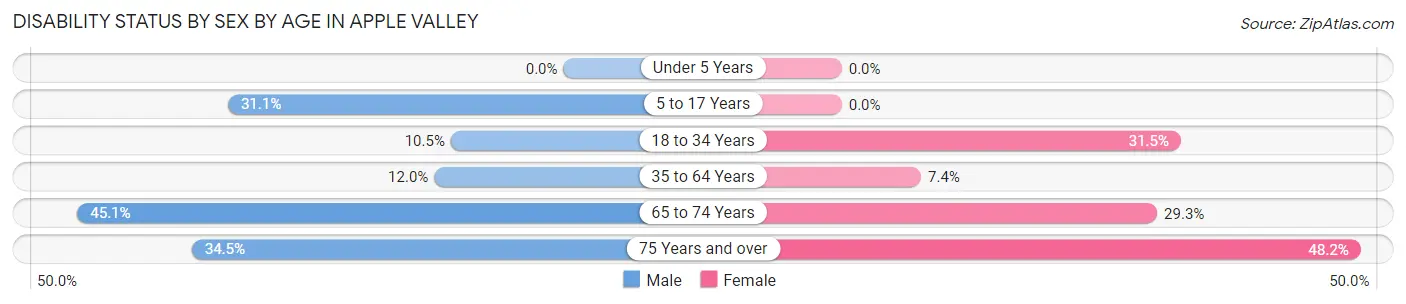
| Age Bracket | Male | Female |
| Under 5 Years | 0 (0.0%) | 0 (0.0%) |
| 5 to 17 Years | 61 (31.1%) | 0 (0.0%) |
| 18 to 34 Years | 7 (10.4%) | 28 (31.5%) |
| 35 to 64 Years | 38 (12.0%) | 19 (7.4%) |
| 65 to 74 Years | 23 (45.1%) | 12 (29.3%) |
| 75 Years and over | 10 (34.5%) | 13 (48.1%) |
Disability Class by Sex by Age in Apple Valley
Disability Class: Hearing Difficulty
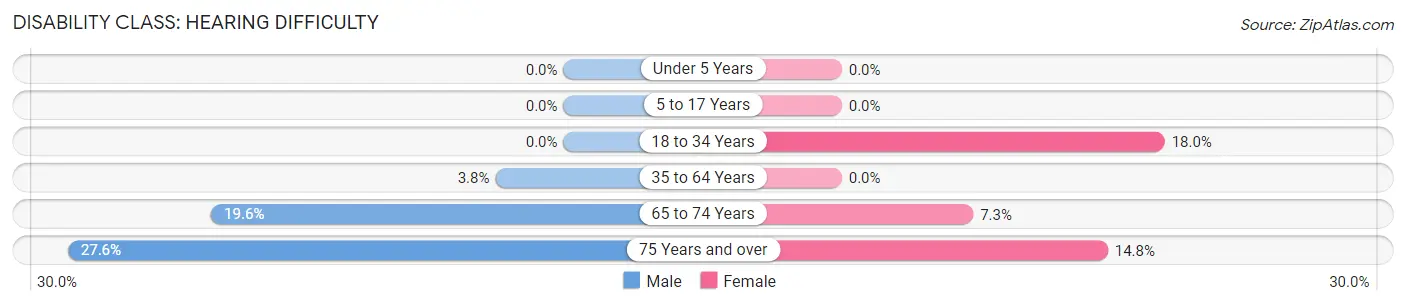
| Age Bracket | Male | Female |
| Under 5 Years | 0 (0.0%) | 0 (0.0%) |
| 5 to 17 Years | 0 (0.0%) | 0 (0.0%) |
| 18 to 34 Years | 0 (0.0%) | 16 (18.0%) |
| 35 to 64 Years | 12 (3.8%) | 0 (0.0%) |
| 65 to 74 Years | 10 (19.6%) | 3 (7.3%) |
| 75 Years and over | 8 (27.6%) | 4 (14.8%) |
Disability Class: Vision Difficulty
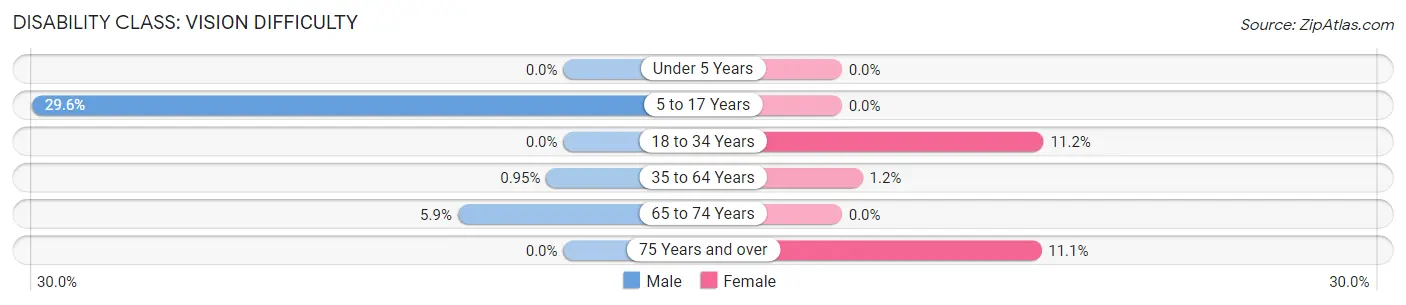
| Age Bracket | Male | Female |
| Under 5 Years | 0 (0.0%) | 0 (0.0%) |
| 5 to 17 Years | 58 (29.6%) | 0 (0.0%) |
| 18 to 34 Years | 0 (0.0%) | 10 (11.2%) |
| 35 to 64 Years | 3 (0.9%) | 3 (1.2%) |
| 65 to 74 Years | 3 (5.9%) | 0 (0.0%) |
| 75 Years and over | 0 (0.0%) | 3 (11.1%) |
Disability Class: Cognitive Difficulty
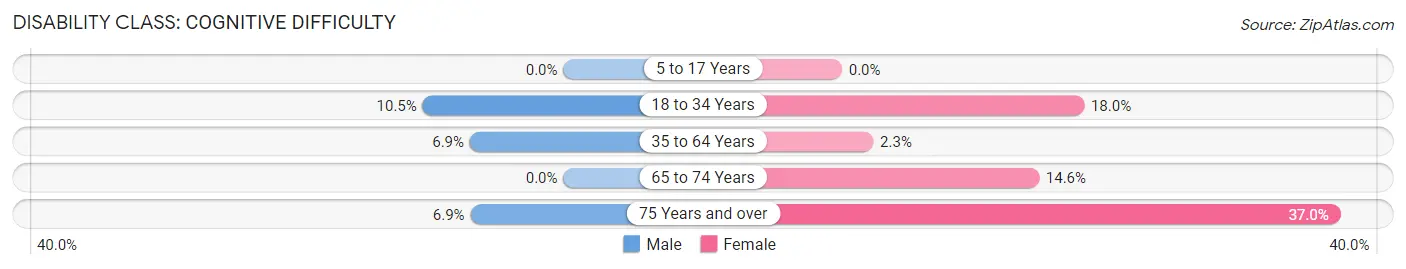
| Age Bracket | Male | Female |
| 5 to 17 Years | 0 (0.0%) | 0 (0.0%) |
| 18 to 34 Years | 7 (10.4%) | 16 (18.0%) |
| 35 to 64 Years | 22 (6.9%) | 6 (2.3%) |
| 65 to 74 Years | 0 (0.0%) | 6 (14.6%) |
| 75 Years and over | 2 (6.9%) | 10 (37.0%) |
Disability Class: Ambulatory Difficulty
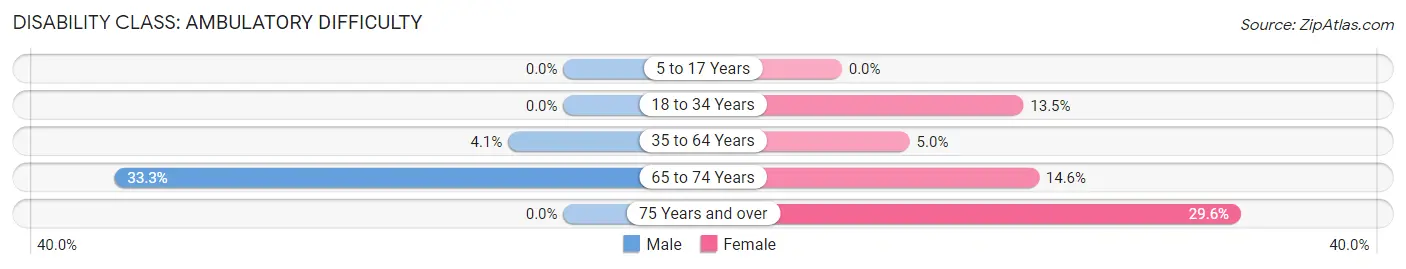
| Age Bracket | Male | Female |
| 5 to 17 Years | 0 (0.0%) | 0 (0.0%) |
| 18 to 34 Years | 0 (0.0%) | 12 (13.5%) |
| 35 to 64 Years | 13 (4.1%) | 13 (5.0%) |
| 65 to 74 Years | 17 (33.3%) | 6 (14.6%) |
| 75 Years and over | 0 (0.0%) | 8 (29.6%) |
Disability Class: Self-Care Difficulty
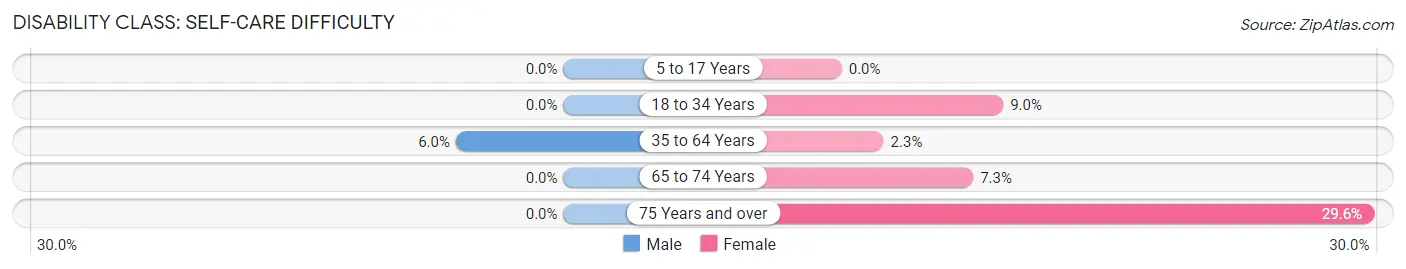
| Age Bracket | Male | Female |
| 5 to 17 Years | 0 (0.0%) | 0 (0.0%) |
| 18 to 34 Years | 0 (0.0%) | 8 (9.0%) |
| 35 to 64 Years | 19 (6.0%) | 6 (2.3%) |
| 65 to 74 Years | 0 (0.0%) | 3 (7.3%) |
| 75 Years and over | 0 (0.0%) | 8 (29.6%) |
Technology Access in Apple Valley
Computing Device Access in Apple Valley
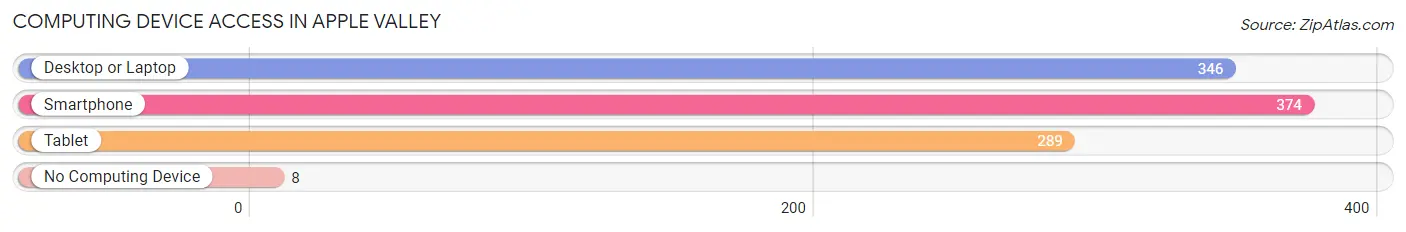
| Device Type | # Households | % Households |
| Desktop or Laptop | 346 | 88.0% |
| Smartphone | 374 | 95.2% |
| Tablet | 289 | 73.5% |
| No Computing Device | 8 | 2.0% |
| Total | 393 | 100.0% |
Internet Access in Apple Valley
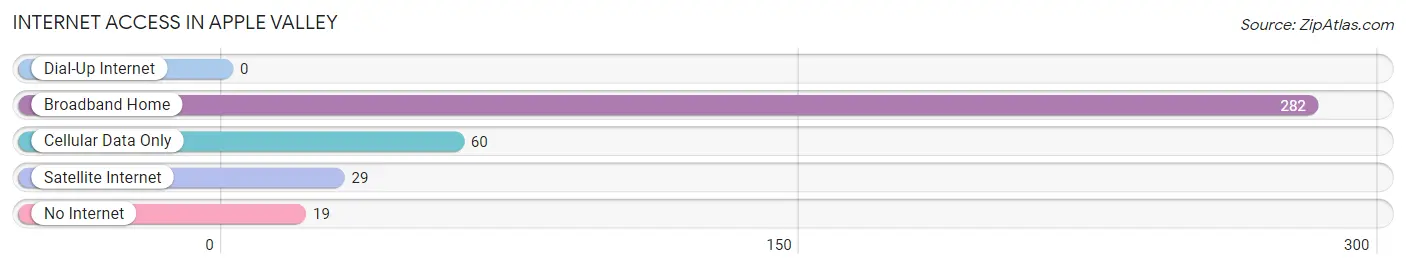
| Internet Type | # Households | % Households |
| Dial-Up Internet | 0 | 0.0% |
| Broadband Home | 282 | 71.8% |
| Cellular Data Only | 60 | 15.3% |
| Satellite Internet | 29 | 7.4% |
| No Internet | 19 | 4.8% |
| Total | 393 | 100.0% |
Apple Valley Summary
Apple Valley is a small town located in southwestern Utah, in the heart of the Mojave Desert. It is situated in Washington County, approximately 20 miles north of St. George and about 30 miles south of Zion National Park. The town is home to a population of just over 1,000 people, and is known for its rural charm and stunning desert landscape.
History
Apple Valley was first settled in the late 1800s by Mormon pioneers, who were drawn to the area by its fertile soil and abundant water sources. The town was originally known as “Apple Valley Station”, and was a stop on the Utah Southern Railroad. In the early 1900s, the town was renamed “Apple Valley”, and the first post office was established in 1910.
The town grew slowly over the years, and by the 1950s, it had become a popular destination for tourists and outdoor enthusiasts. In the 1960s, the town was incorporated, and the population began to grow steadily. Today, Apple Valley is a thriving community, with a variety of businesses, restaurants, and recreational activities.
Geography
Apple Valley is located in the Mojave Desert, at an elevation of 3,400 feet. The town is situated in a valley surrounded by the Red Cliffs National Conservation Area, which is home to a variety of wildlife and plant species. The area is known for its stunning desert landscape, with red sandstone cliffs, canyons, and mesas.
The climate in Apple Valley is arid and hot, with temperatures reaching over 100 degrees Fahrenheit in the summer months. Winters are mild, with temperatures rarely dropping below freezing. The area receives an average of 8 inches of precipitation per year, mostly in the form of snow.
Economy
Apple Valley’s economy is largely based on tourism and outdoor recreation. The town is home to a variety of businesses, including restaurants, hotels, and retail stores. The town is also home to a number of outdoor recreation activities, such as hiking, camping, and horseback riding.
The town is also home to a number of agricultural operations, including cattle ranches and apple orchards. The area is known for its production of apples, which are sold in local markets and shipped to other parts of the state.
Demographics
As of the 2010 census, Apple Valley had a population of 1,072 people. The racial makeup of the town was 94.3% White, 0.7% African American, 0.3% Native American, 0.2% Asian, 0.1% Pacific Islander, and 4.4% from other races. The median household income was $41,250, and the median age was 37.
Apple Valley is a small, rural town with a close-knit community. The town is known for its friendly atmosphere and welcoming attitude towards visitors. The town is also home to a variety of churches, including the Church of Jesus Christ of Latter-day Saints, the Catholic Church, and the United Methodist Church.
Common Questions
What is the Total Population of Apple Valley?
Total Population of Apple Valley is 1,233.
What is the Total Male Population of Apple Valley?
Total Male Population of Apple Valley is 683.
What is the Total Female Population of Apple Valley?
Total Female Population of Apple Valley is 550.
What is the Ratio of Males per 100 Females in Apple Valley?
There are 124.18 Males per 100 Females in Apple Valley.
What is the Ratio of Females per 100 Males in Apple Valley?
There are 80.53 Females per 100 Males in Apple Valley.
What is the Median Population Age in Apple Valley?
Median Population Age in Apple Valley is 41.5 Years.
What is the Average Family Size in Apple Valley
Average Family Size in Apple Valley is 3.5 People.
What is the Average Household Size in Apple Valley
Average Household Size in Apple Valley is 3.1 People.
What is Per Capita Income in Apple Valley?
Per Capita income in Apple Valley is $29,054.
What is the Median Family Income in Apple Valley?
Median Family Income in Apple Valley is $96,563.
What is the Median Household income in Apple Valley?
Median Household Income in Apple Valley is $80,893.
What is Income or Wage Gap in Apple Valley?
Income or Wage Gap in Apple Valley is 53.4%.
Women in Apple Valley earn 46.6 cents for every dollar earned by a man.
What is Inequality or Gini Index in Apple Valley?
Inequality or Gini Index in Apple Valley is 0.32.
How Large is the Labor Force in Apple Valley?
There are 602 People in the Labor Forcein in Apple Valley.
What is the Percentage of People in the Labor Force in Apple Valley?
66.1% of People are in the Labor Force in Apple Valley.
What is the Unemployment Rate in Apple Valley?
Unemployment Rate in Apple Valley is 6.8%.