Heber, UT
Heber Map
Heber Overview
16,943
TOTAL POPULATION
8,506
MALE POPULATION
8,437
FEMALE POPULATION
100.82
MALES / 100 FEMALES
99.19
FEMALES / 100 MALES
28.7
MEDIAN AGE
3.9
AVG FAMILY SIZE
3.4
AVG HOUSEHOLD SIZE
$35,858
PER CAPITA INCOME
$104,537
AVG FAMILY INCOME
$98,934
AVG HOUSEHOLD INCOME
51.4%
WAGE / INCOME GAP [ % ]
48.6¢/ $1
WAGE / INCOME GAP [ $ ]
0.38
INEQUALITY / GINI INDEX
9,056
LABOR FORCE [ PEOPLE ]
74.8%
PERCENT IN LABOR FORCE
2.9%
UNEMPLOYMENT RATE
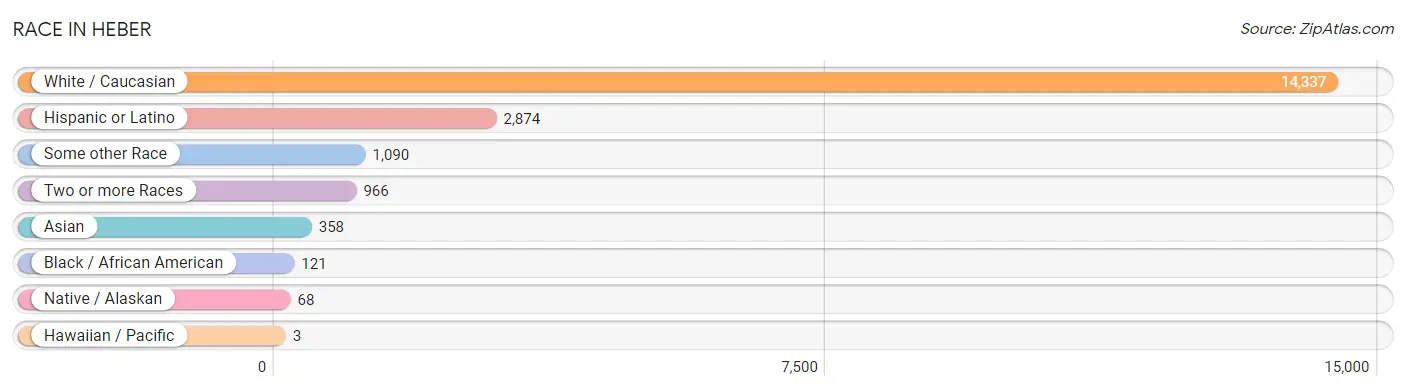
Race in Heber
The most populous races in Heber are White / Caucasian (14,337 | 84.6%), Hispanic or Latino (2,874 | 17.0%), and Some other Race (1,090 | 6.4%).
| Race | # Population | % Population |
| Asian | 358 | 2.1% |
| Black / African American | 121 | 0.7% |
| Hawaiian / Pacific | 3 | 0.0% |
| Hispanic or Latino | 2,874 | 17.0% |
| Native / Alaskan | 68 | 0.4% |
| White / Caucasian | 14,337 | 84.6% |
| Two or more Races | 966 | 5.7% |
| Some other Race | 1,090 | 6.4% |
| Total | 16,943 | 100.0% |
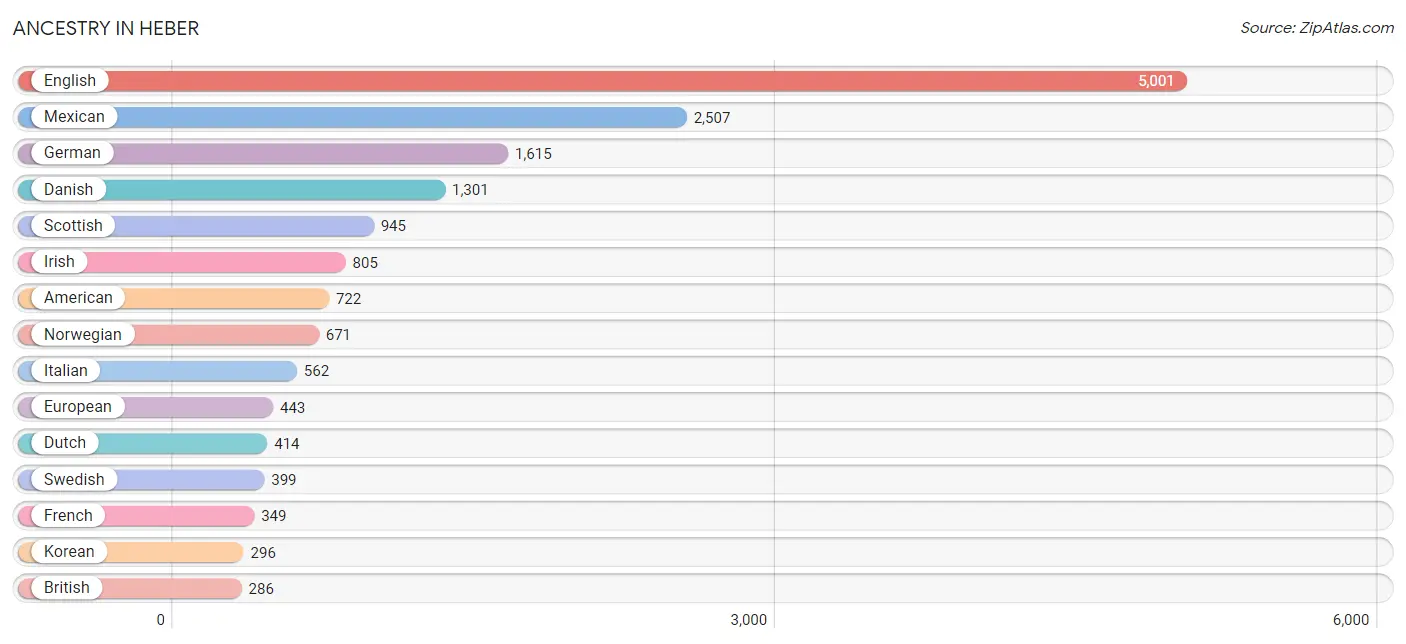
Ancestry in Heber
The most populous ancestries reported in Heber are English (5,001 | 29.5%), Mexican (2,507 | 14.8%), German (1,615 | 9.5%), Danish (1,301 | 7.7%), and Scottish (945 | 5.6%), together accounting for 67.1% of all Heber residents.
| Ancestry | # Population | % Population |
| African | 36 | 0.2% |
| American | 722 | 4.3% |
| Arab | 24 | 0.1% |
| Armenian | 21 | 0.1% |
| Austrian | 30 | 0.2% |
| Basque | 19 | 0.1% |
| Bhutanese | 71 | 0.4% |
| Brazilian | 56 | 0.3% |
| British | 286 | 1.7% |
| Burmese | 30 | 0.2% |
| Canadian | 12 | 0.1% |
| Central American | 12 | 0.1% |
| Chilean | 100 | 0.6% |
| Choctaw | 36 | 0.2% |
| Colombian | 103 | 0.6% |
| Croatian | 28 | 0.2% |
| Cuban | 11 | 0.1% |
| Czech | 21 | 0.1% |
| Danish | 1,301 | 7.7% |
| Dutch | 414 | 2.4% |
| Eastern European | 12 | 0.1% |
| Ecuadorian | 36 | 0.2% |
| English | 5,001 | 29.5% |
| European | 443 | 2.6% |
| Finnish | 58 | 0.3% |
| French | 349 | 2.1% |
| French Canadian | 25 | 0.2% |
| German | 1,615 | 9.5% |
| Icelander | 14 | 0.1% |
| Indian (Asian) | 159 | 0.9% |
| Irish | 805 | 4.8% |
| Italian | 562 | 3.3% |
| Japanese | 77 | 0.4% |
| Korean | 296 | 1.8% |
| Lebanese | 4 | 0.0% |
| Mexican | 2,507 | 14.8% |
| Northern European | 35 | 0.2% |
| Norwegian | 671 | 4.0% |
| Peruvian | 23 | 0.1% |
| Polish | 66 | 0.4% |
| Puerto Rican | 13 | 0.1% |
| Romanian | 4 | 0.0% |
| Russian | 34 | 0.2% |
| Salvadoran | 12 | 0.1% |
| Samoan | 3 | 0.0% |
| Scandinavian | 109 | 0.6% |
| Scotch-Irish | 194 | 1.1% |
| Scottish | 945 | 5.6% |
| Shoshone | 4 | 0.0% |
| Sioux | 58 | 0.3% |
| South American | 262 | 1.5% |
| Spaniard | 19 | 0.1% |
| Spanish | 28 | 0.2% |
| Subsaharan African | 36 | 0.2% |
| Swedish | 399 | 2.4% |
| Swiss | 126 | 0.7% |
| Thai | 25 | 0.2% |
| Ute | 6 | 0.0% |
| Welsh | 204 | 1.2% | View All 59 Rows |
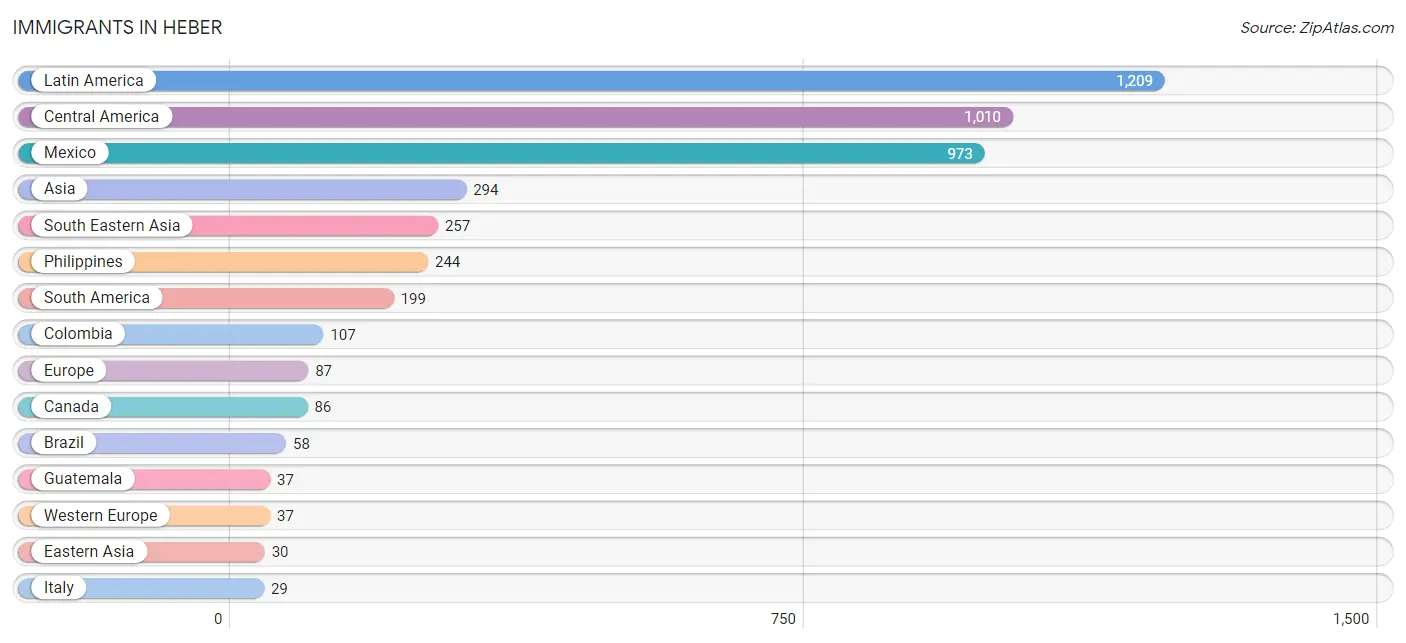
Immigrants in Heber
The most numerous immigrant groups reported in Heber came from Latin America (1,209 | 7.1%), Central America (1,010 | 6.0%), Mexico (973 | 5.7%), Asia (294 | 1.7%), and South Eastern Asia (257 | 1.5%), together accounting for 22.1% of all Heber residents.
| Immigration Origin | # Population | % Population |
| Asia | 294 | 1.7% |
| Australia | 14 | 0.1% |
| Brazil | 58 | 0.3% |
| Cambodia | 13 | 0.1% |
| Canada | 86 | 0.5% |
| Central America | 1,010 | 6.0% |
| Chile | 11 | 0.1% |
| China | 27 | 0.2% |
| Colombia | 107 | 0.6% |
| Eastern Asia | 30 | 0.2% |
| Eastern Europe | 21 | 0.1% |
| Europe | 87 | 0.5% |
| Germany | 12 | 0.1% |
| Guatemala | 37 | 0.2% |
| Hong Kong | 22 | 0.1% |
| Italy | 29 | 0.2% |
| Japan | 3 | 0.0% |
| Latin America | 1,209 | 7.1% |
| Mexico | 973 | 5.7% |
| Netherlands | 25 | 0.2% |
| Oceania | 14 | 0.1% |
| Peru | 23 | 0.1% |
| Philippines | 244 | 1.4% |
| Russia | 21 | 0.1% |
| South America | 199 | 1.2% |
| South Eastern Asia | 257 | 1.5% |
| Southern Europe | 29 | 0.2% |
| Turkey | 7 | 0.0% |
| Western Asia | 7 | 0.0% |
| Western Europe | 37 | 0.2% | View All 30 Rows |
Sex and Age in Heber
Sex and Age in Heber
The most populous age groups in Heber are 10 to 14 Years (931 | 11.0%) for men and 10 to 14 Years (926 | 11.0%) for women.
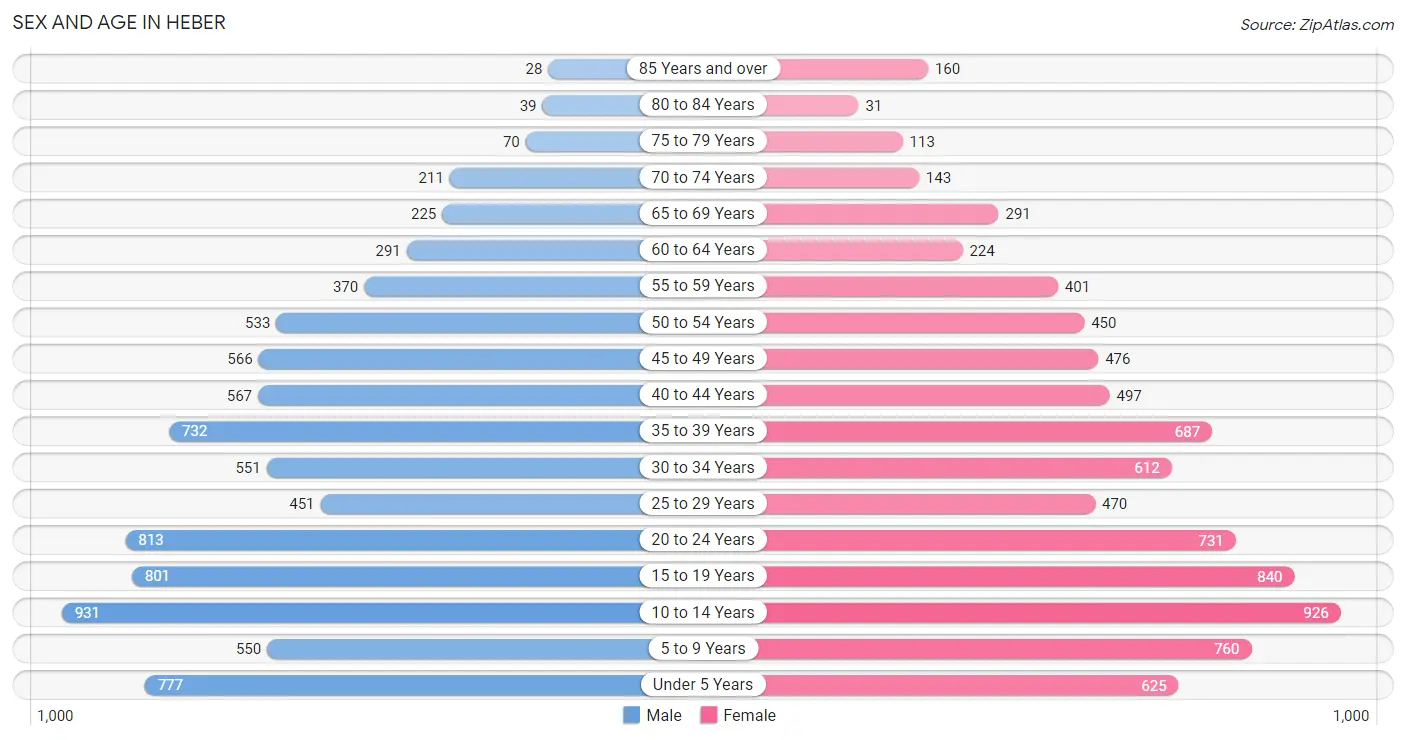
| Age Bracket | Male | Female |
| Under 5 Years | 777 (9.1%) | 625 (7.4%) |
| 5 to 9 Years | 550 (6.5%) | 760 (9.0%) |
| 10 to 14 Years | 931 (11.0%) | 926 (11.0%) |
| 15 to 19 Years | 801 (9.4%) | 840 (10.0%) |
| 20 to 24 Years | 813 (9.6%) | 731 (8.7%) |
| 25 to 29 Years | 451 (5.3%) | 470 (5.6%) |
| 30 to 34 Years | 551 (6.5%) | 612 (7.2%) |
| 35 to 39 Years | 732 (8.6%) | 687 (8.1%) |
| 40 to 44 Years | 567 (6.7%) | 497 (5.9%) |
| 45 to 49 Years | 566 (6.7%) | 476 (5.6%) |
| 50 to 54 Years | 533 (6.3%) | 450 (5.3%) |
| 55 to 59 Years | 370 (4.3%) | 401 (4.8%) |
| 60 to 64 Years | 291 (3.4%) | 224 (2.6%) |
| 65 to 69 Years | 225 (2.6%) | 291 (3.5%) |
| 70 to 74 Years | 211 (2.5%) | 143 (1.7%) |
| 75 to 79 Years | 70 (0.8%) | 113 (1.3%) |
| 80 to 84 Years | 39 (0.5%) | 31 (0.4%) |
| 85 Years and over | 28 (0.3%) | 160 (1.9%) |
| Total | 8,506 (100.0%) | 8,437 (100.0%) |
Families and Households in Heber
Median Family Size in Heber
The median family size in Heber is 3.90 persons per family, with single female/mother families (360 | 9.4%) accounting for the largest median family size of 4.56 persons per family. On the other hand, single male/father families (263 | 6.8%) represent the smallest median family size with 2.78 persons per family.
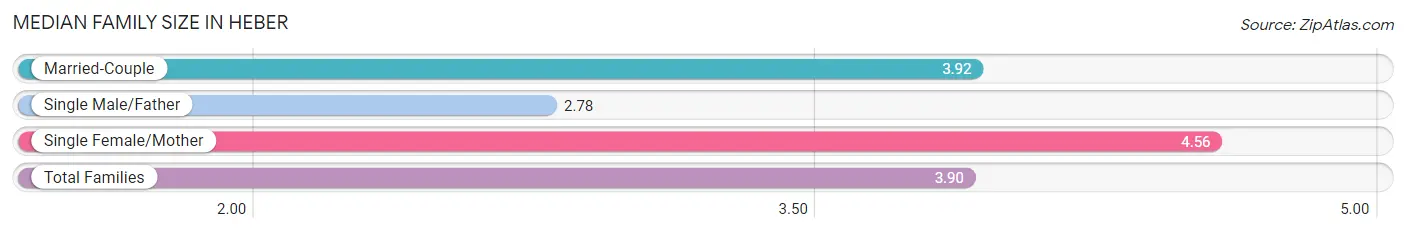
| Family Type | # Families | Family Size |
| Married-Couple | 3,224 (83.8%) | 3.92 |
| Single Male/Father | 263 (6.8%) | 2.78 |
| Single Female/Mother | 360 (9.4%) | 4.56 |
| Total Families | 3,847 (100.0%) | 3.90 |
Median Household Size in Heber
The median household size in Heber is 3.36 persons per household, with single female/mother households (360 | 7.2%) accounting for the largest median household size of 4.97 persons per household. non-family households (1,133 | 22.8%) represent the smallest median household size with 1.14 persons per household.
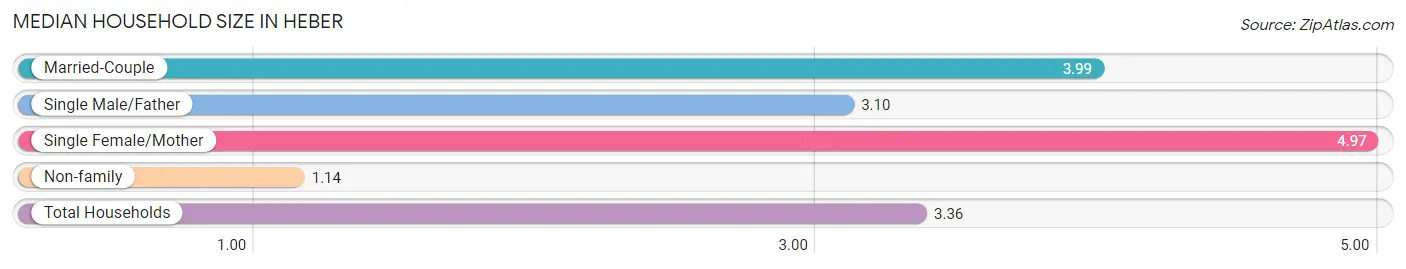
| Household Type | # Households | Household Size |
| Married-Couple | 3,224 (64.7%) | 3.99 |
| Single Male/Father | 263 (5.3%) | 3.10 |
| Single Female/Mother | 360 (7.2%) | 4.97 |
| Non-family | 1,133 (22.8%) | 1.14 |
| Total Households | 4,980 (100.0%) | 3.36 |
Household Size by Marriage Status in Heber
Out of a total of 4,980 households in Heber, 3,847 (77.2%) are family households, while 1,133 (22.8%) are nonfamily households. The most numerous type of family households are 2-person households, comprising 894, and the most common type of nonfamily households are 1-person households, comprising 1,035.
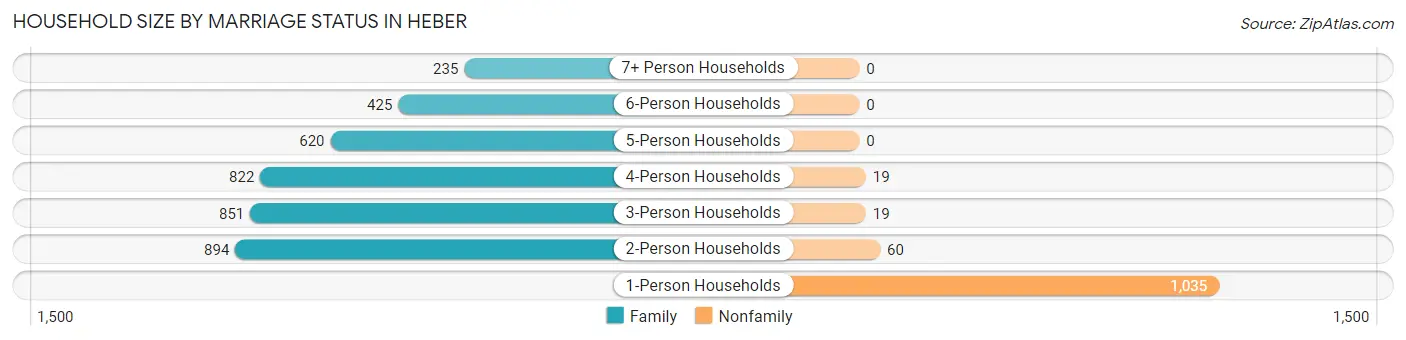
| Household Size | Family Households | Nonfamily Households |
| 1-Person Households | - | 1,035 (20.8%) |
| 2-Person Households | 894 (17.9%) | 60 (1.2%) |
| 3-Person Households | 851 (17.1%) | 19 (0.4%) |
| 4-Person Households | 822 (16.5%) | 19 (0.4%) |
| 5-Person Households | 620 (12.4%) | 0 (0.0%) |
| 6-Person Households | 425 (8.5%) | 0 (0.0%) |
| 7+ Person Households | 235 (4.7%) | 0 (0.0%) |
| Total | 3,847 (77.2%) | 1,133 (22.8%) |
Female Fertility in Heber
Fertility by Age in Heber
Average fertility rate in Heber is 71.0 births per 1,000 women. Women in the age bracket of 20 to 34 years have the highest fertility rate with 124.0 births per 1,000 women. Women in the age bracket of 20 to 34 years acount for 70.5% of all women with births.
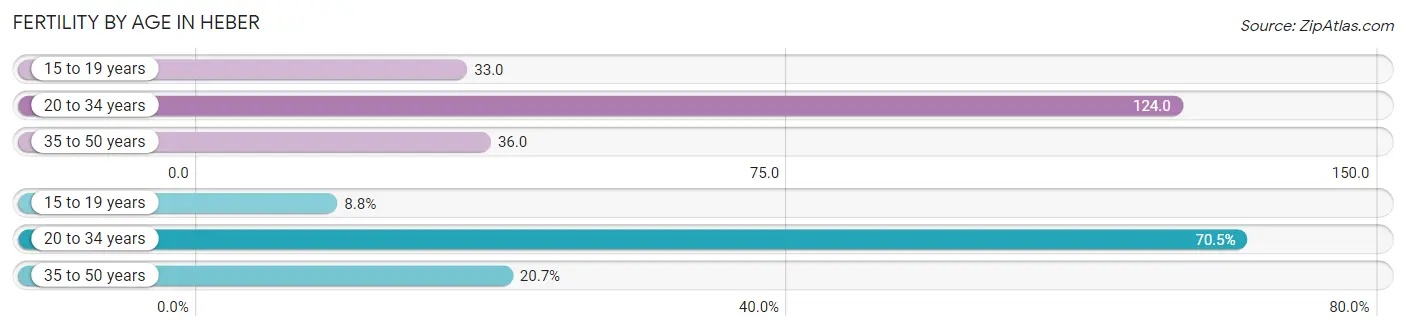
| Age Bracket | Women with Births | Births / 1,000 Women |
| 15 to 19 years | 28 (8.8%) | 33.0 |
| 20 to 34 years | 225 (70.5%) | 124.0 |
| 35 to 50 years | 66 (20.7%) | 36.0 |
| Total | 319 (100.0%) | 71.0 |
Fertility by Age by Marriage Status in Heber
64.9% of women with births (319) in Heber are married. The highest percentage of unmarried women with births falls into 15 to 19 years age bracket with 100.0% of them unmarried at the time of birth, while the lowest percentage of unmarried women with births belong to 35 to 50 years age bracket with 0.0% of them unmarried.
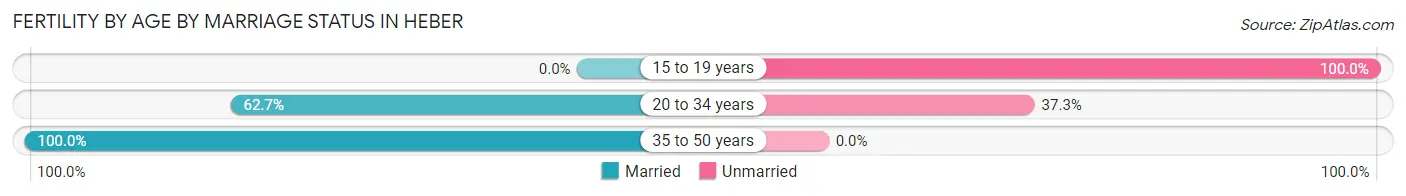
| Age Bracket | Married | Unmarried |
| 15 to 19 years | 0 (0.0%) | 28 (100.0%) |
| 20 to 34 years | 141 (62.7%) | 84 (37.3%) |
| 35 to 50 years | 66 (100.0%) | 0 (0.0%) |
| Total | 207 (64.9%) | 112 (35.1%) |
Fertility by Education in Heber
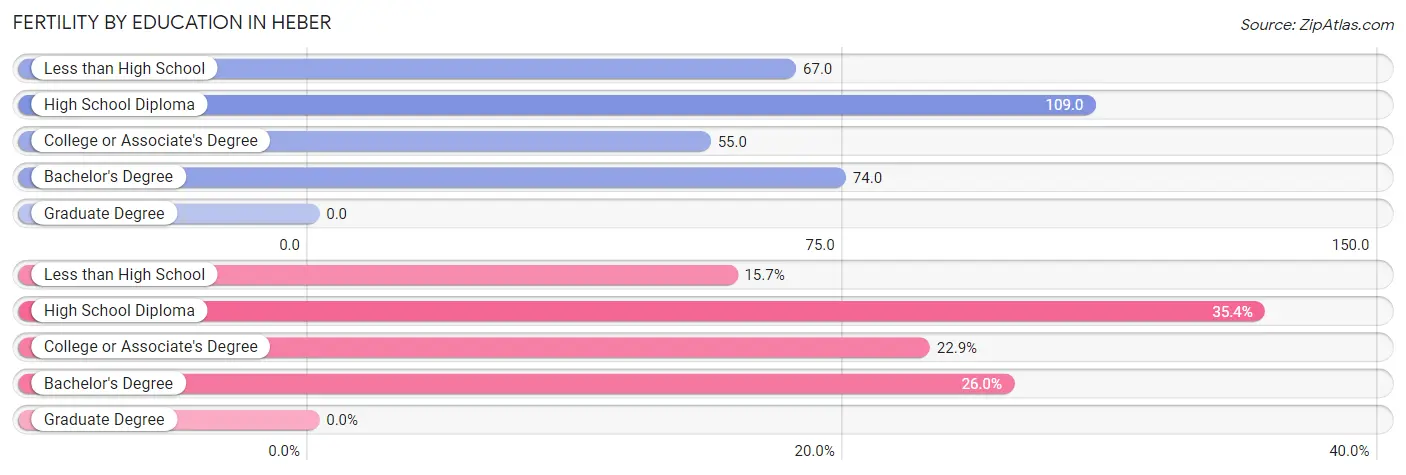
| Educational Attainment | Women with Births | Births / 1,000 Women |
| Less than High School | 50 (15.7%) | 67.0 |
| High School Diploma | 113 (35.4%) | 109.0 |
| College or Associate's Degree | 73 (22.9%) | 55.0 |
| Bachelor's Degree | 83 (26.0%) | 74.0 |
| Graduate Degree | 0 (0.0%) | 0.0 |
| Total | 319 (100.0%) | 71.0 |
Fertility by Education by Marriage Status in Heber
35.1% of women with births in Heber are unmarried. Women with the educational attainment of bachelor's degree are most likely to be married with 100.0% of them married at childbirth, while women with the educational attainment of high school diploma are least likely to be married with 59.3% of them unmarried at childbirth.
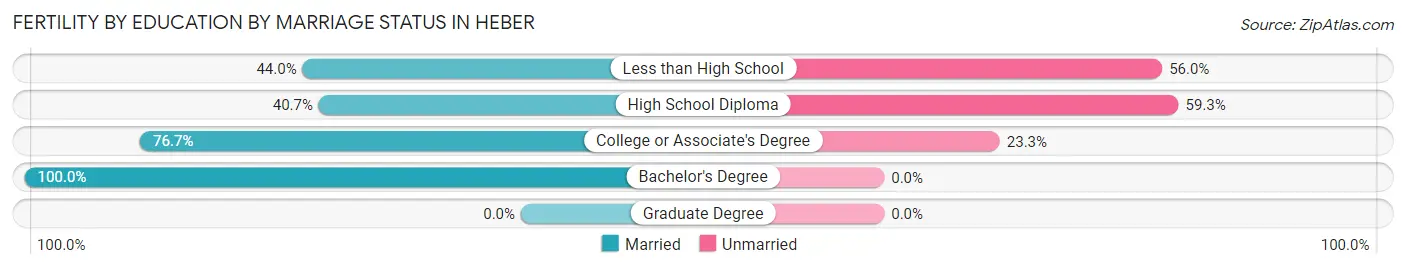
| Educational Attainment | Married | Unmarried |
| Less than High School | 22 (44.0%) | 28 (56.0%) |
| High School Diploma | 46 (40.7%) | 67 (59.3%) |
| College or Associate's Degree | 56 (76.7%) | 17 (23.3%) |
| Bachelor's Degree | 83 (100.0%) | 0 (0.0%) |
| Graduate Degree | 0 (0.0%) | 0 (0.0%) |
| Total | 207 (64.9%) | 112 (35.1%) |
Income in Heber
Income Overview in Heber
Per Capita Income in Heber is $35,858, while median incomes of families and households are $104,537 and $98,934 respectively.
| Characteristic | Number | Measure |
| Per Capita Income | 16,943 | $35,858 |
| Median Family Income | 3,847 | $104,537 |
| Mean Family Income | 3,847 | $125,755 |
| Median Household Income | 4,980 | $98,934 |
| Mean Household Income | 4,980 | $114,830 |
| Income Deficit | 3,847 | $0 |
| Wage / Income Gap (%) | 16,943 | 51.36% |
| Wage / Income Gap ($) | 16,943 | 48.64¢ per $1 |
| Gini / Inequality Index | 16,943 | 0.38 |
Earnings by Sex in Heber
Average Earnings in Heber are $40,780, $54,591 for men and $26,552 for women, a difference of 51.4%.
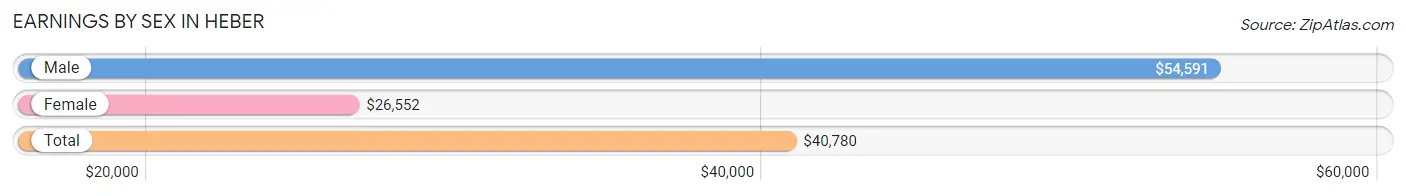
| Sex | Number | Average Earnings |
| Male | 5,449 (57.3%) | $54,591 |
| Female | 4,054 (42.7%) | $26,552 |
| Total | 9,503 (100.0%) | $40,780 |
Earnings by Sex by Income Bracket in Heber
The most common earnings brackets in Heber are $100,000+ for men (1,164 | 21.4%) and $12,500 to $14,999 for women (406 | 10.0%).
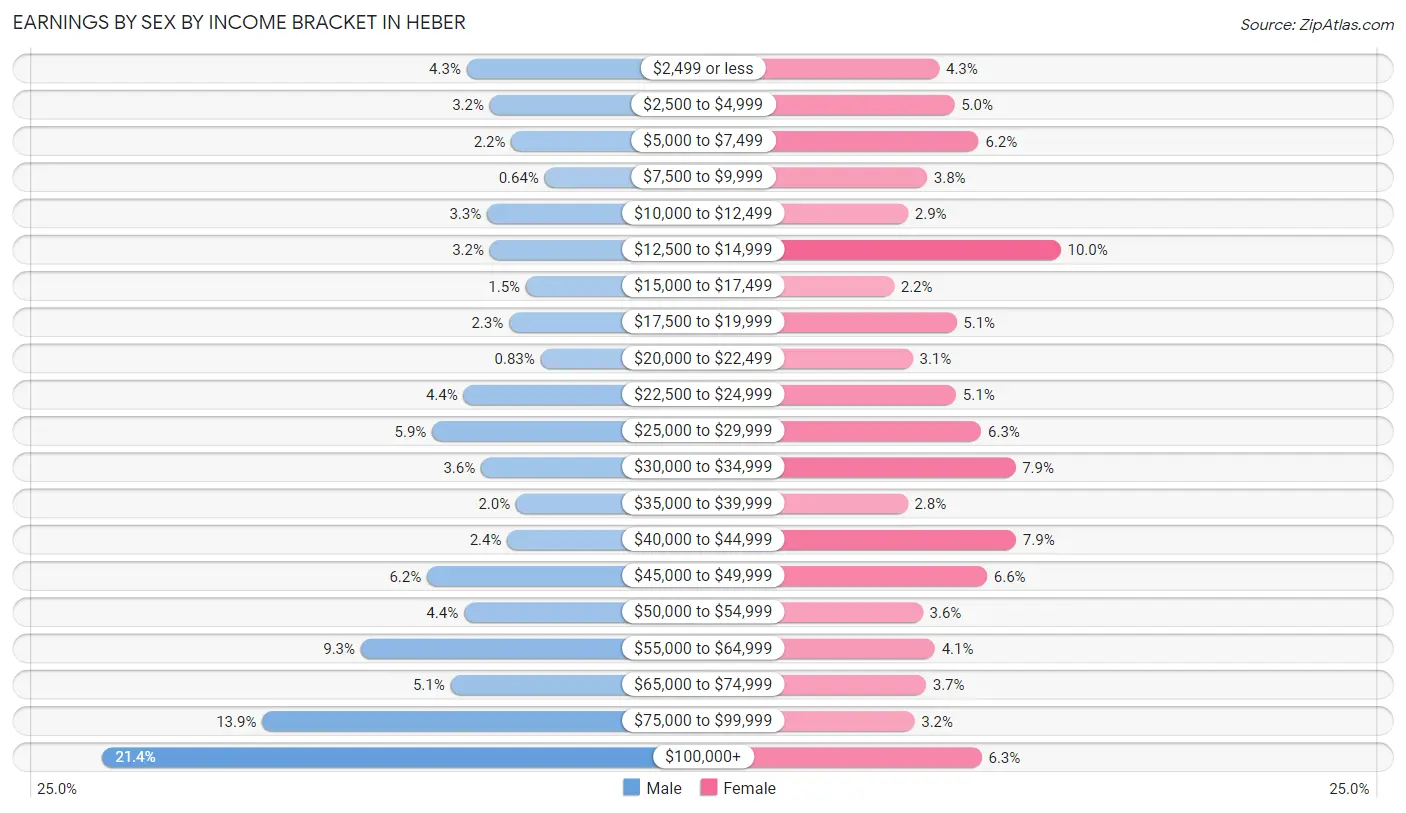
| Income | Male | Female |
| $2,499 or less | 234 (4.3%) | 175 (4.3%) |
| $2,500 to $4,999 | 175 (3.2%) | 204 (5.0%) |
| $5,000 to $7,499 | 120 (2.2%) | 250 (6.2%) |
| $7,500 to $9,999 | 35 (0.6%) | 152 (3.7%) |
| $10,000 to $12,499 | 182 (3.3%) | 116 (2.9%) |
| $12,500 to $14,999 | 175 (3.2%) | 406 (10.0%) |
| $15,000 to $17,499 | 83 (1.5%) | 89 (2.2%) |
| $17,500 to $19,999 | 126 (2.3%) | 208 (5.1%) |
| $20,000 to $22,499 | 45 (0.8%) | 125 (3.1%) |
| $22,500 to $24,999 | 242 (4.4%) | 207 (5.1%) |
| $25,000 to $29,999 | 322 (5.9%) | 255 (6.3%) |
| $30,000 to $34,999 | 197 (3.6%) | 320 (7.9%) |
| $35,000 to $39,999 | 108 (2.0%) | 115 (2.8%) |
| $40,000 to $44,999 | 130 (2.4%) | 321 (7.9%) |
| $45,000 to $49,999 | 335 (6.1%) | 266 (6.6%) |
| $50,000 to $54,999 | 241 (4.4%) | 144 (3.5%) |
| $55,000 to $64,999 | 504 (9.2%) | 167 (4.1%) |
| $65,000 to $74,999 | 275 (5.1%) | 150 (3.7%) |
| $75,000 to $99,999 | 756 (13.9%) | 128 (3.2%) |
| $100,000+ | 1,164 (21.4%) | 256 (6.3%) |
| Total | 5,449 (100.0%) | 4,054 (100.0%) |
Earnings by Sex by Educational Attainment in Heber
Average earnings in Heber are $66,975 for men and $31,432 for women, a difference of 53.1%. Men with an educational attainment of bachelor's degree enjoy the highest average annual earnings of $96,903, while those with high school diploma education earn the least with $39,405. Women with an educational attainment of graduate degree earn the most with the average annual earnings of $50,929, while those with college or associate's degree education have the smallest earnings of $25,617.
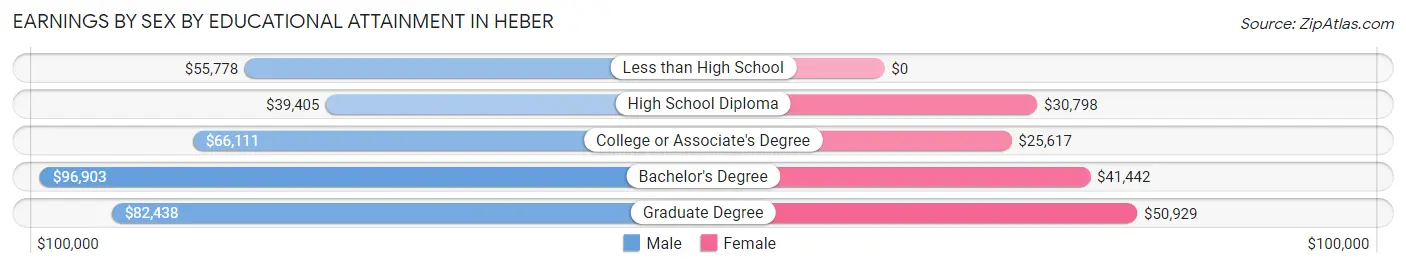
| Educational Attainment | Male Income | Female Income |
| Less than High School | $55,778 | $0 |
| High School Diploma | $39,405 | $30,798 |
| College or Associate's Degree | $66,111 | $25,617 |
| Bachelor's Degree | $96,903 | $41,442 |
| Graduate Degree | $82,438 | $50,929 |
| Total | $66,975 | $31,432 |
Family Income in Heber
Family Income Brackets in Heber
According to the Heber family income data, there are 1,019 families falling into the $100,000 to $149,999 income range, which is the most common income bracket and makes up 26.5% of all families. Conversely, the $15,000 to $24,999 income bracket is the least frequent group with only 35 families (0.9%) belonging to this category.
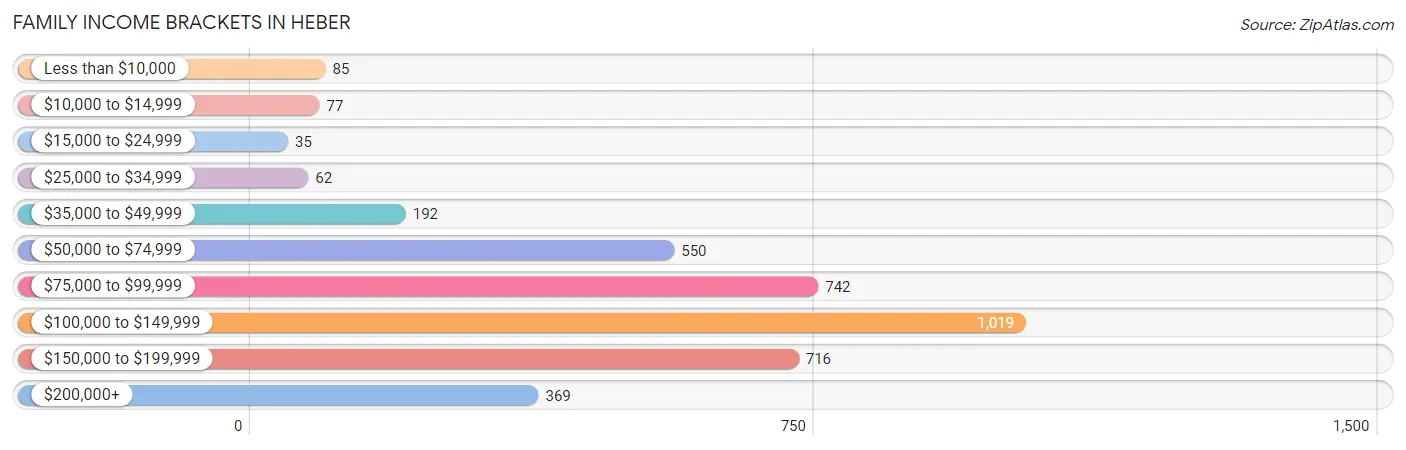
| Income Bracket | # Families | % Families |
| Less than $10,000 | 85 | 2.2% |
| $10,000 to $14,999 | 77 | 2.0% |
| $15,000 to $24,999 | 35 | 0.9% |
| $25,000 to $34,999 | 62 | 1.6% |
| $35,000 to $49,999 | 192 | 5.0% |
| $50,000 to $74,999 | 550 | 14.3% |
| $75,000 to $99,999 | 742 | 19.3% |
| $100,000 to $149,999 | 1,019 | 26.5% |
| $150,000 to $199,999 | 716 | 18.6% |
| $200,000+ | 369 | 9.6% |
Family Income by Famaliy Size in Heber
5-person families (553 | 14.4%) account for the highest median family income in Heber with $129,125 per family, while 2-person families (1,033 | 26.9%) have the highest median income of $38,916 per family member.
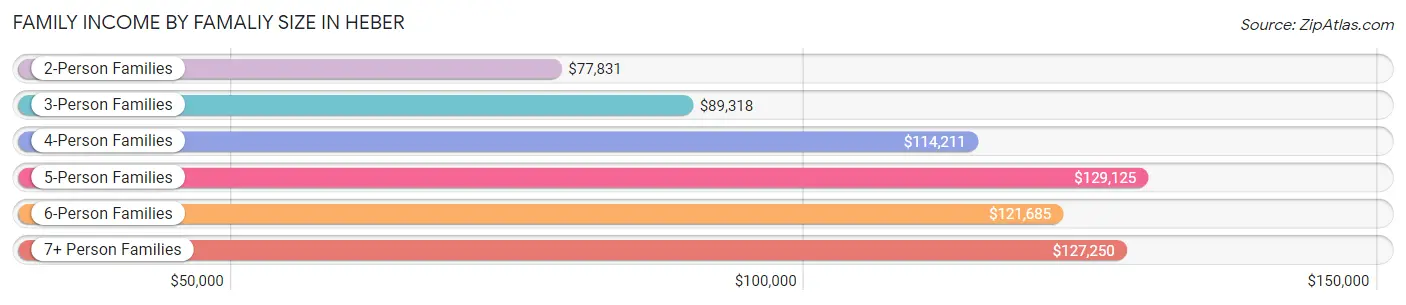
| Income Bracket | # Families | Median Income |
| 2-Person Families | 1,033 (26.9%) | $77,831 |
| 3-Person Families | 840 (21.8%) | $89,318 |
| 4-Person Families | 782 (20.3%) | $114,211 |
| 5-Person Families | 553 (14.4%) | $129,125 |
| 6-Person Families | 413 (10.7%) | $121,685 |
| 7+ Person Families | 226 (5.9%) | $127,250 |
| Total | 3,847 (100.0%) | $104,537 |
Family Income by Number of Earners in Heber
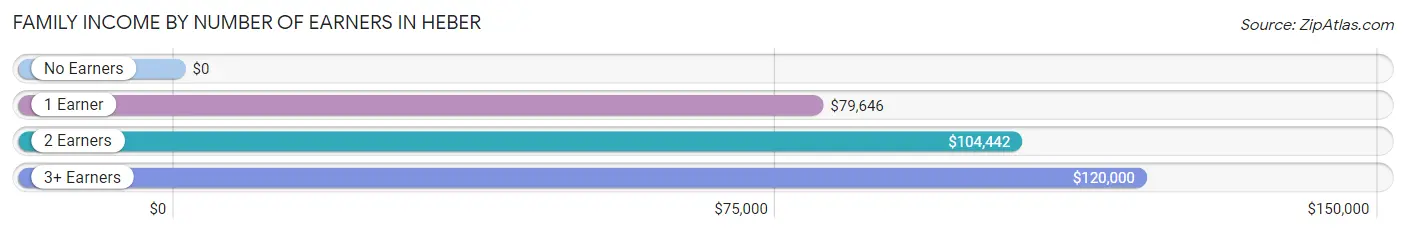
| Number of Earners | # Families | Median Income |
| No Earners | 156 (4.1%) | $0 |
| 1 Earner | 897 (23.3%) | $79,646 |
| 2 Earners | 2,040 (53.0%) | $104,442 |
| 3+ Earners | 754 (19.6%) | $120,000 |
| Total | 3,847 (100.0%) | $104,537 |
Household Income in Heber
Household Income Brackets in Heber
With 1,195 households falling in the category, the $100,000 to $149,999 income range is the most frequent in Heber, accounting for 24.0% of all households. In contrast, only 100 households (2.0%) fall into the less than $10,000 income bracket, making it the least populous group.
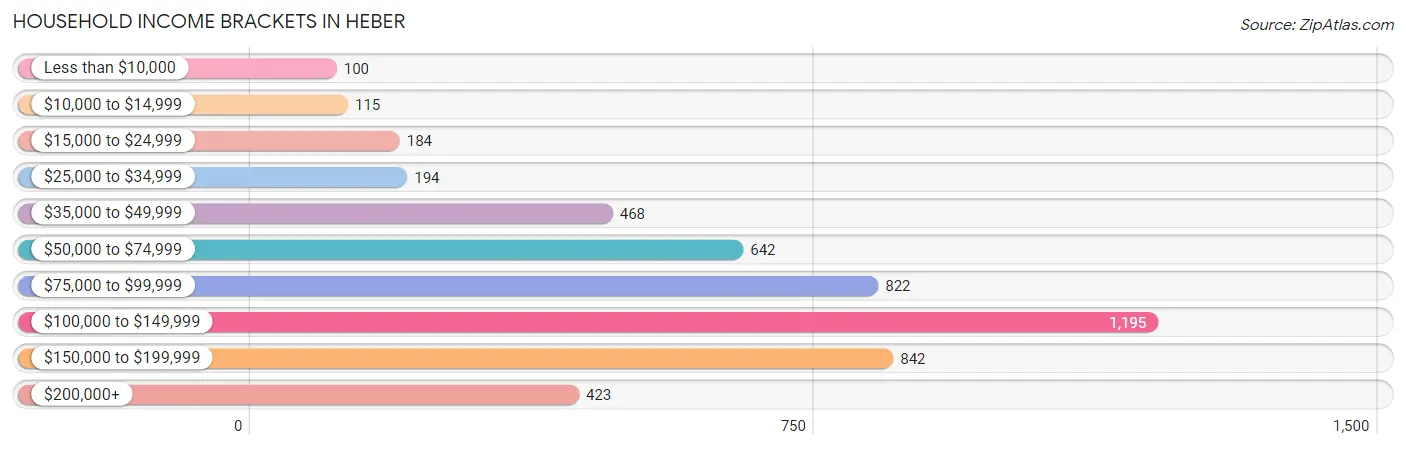
| Income Bracket | # Households | % Households |
| Less than $10,000 | 100 | 2.0% |
| $10,000 to $14,999 | 115 | 2.3% |
| $15,000 to $24,999 | 184 | 3.7% |
| $25,000 to $34,999 | 194 | 3.9% |
| $35,000 to $49,999 | 468 | 9.4% |
| $50,000 to $74,999 | 642 | 12.9% |
| $75,000 to $99,999 | 822 | 16.5% |
| $100,000 to $149,999 | 1,195 | 24.0% |
| $150,000 to $199,999 | 842 | 16.9% |
| $200,000+ | 423 | 8.5% |
Household Income by Householder Age in Heber
The median household income in Heber is $98,934, with the highest median household income of $106,250 found in the 25 to 44 years age bracket for the primary householder. A total of 1,908 households (38.3%) fall into this category. Meanwhile, the 15 to 24 years age bracket for the primary householder has the lowest median household income of $58,673, with 543 households (10.9%) in this group.
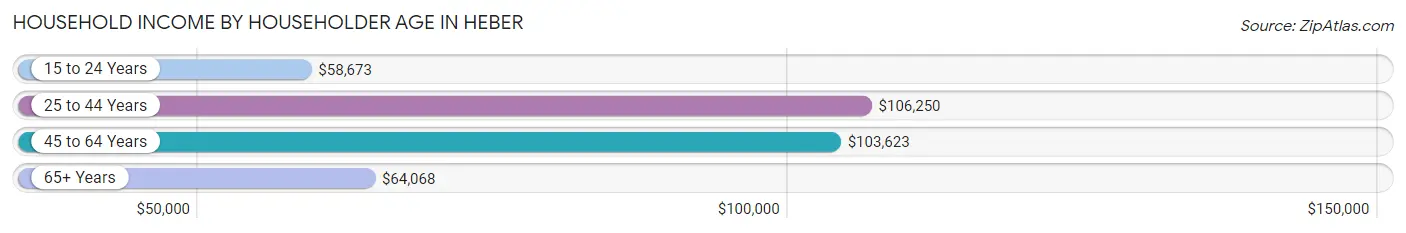
| Income Bracket | # Households | Median Income |
| 15 to 24 Years | 543 (10.9%) | $58,673 |
| 25 to 44 Years | 1,908 (38.3%) | $106,250 |
| 45 to 64 Years | 1,699 (34.1%) | $103,623 |
| 65+ Years | 830 (16.7%) | $64,068 |
| Total | 4,980 (100.0%) | $98,934 |
Poverty in Heber
Income Below Poverty by Sex and Age in Heber
With 5.5% poverty level for males and 5.5% for females among the residents of Heber, 5 year old males and 16 and 17 year old females are the most vulnerable to poverty, with 13 males (16.3%) and 37 females (12.3%) in their respective age groups living below the poverty level.
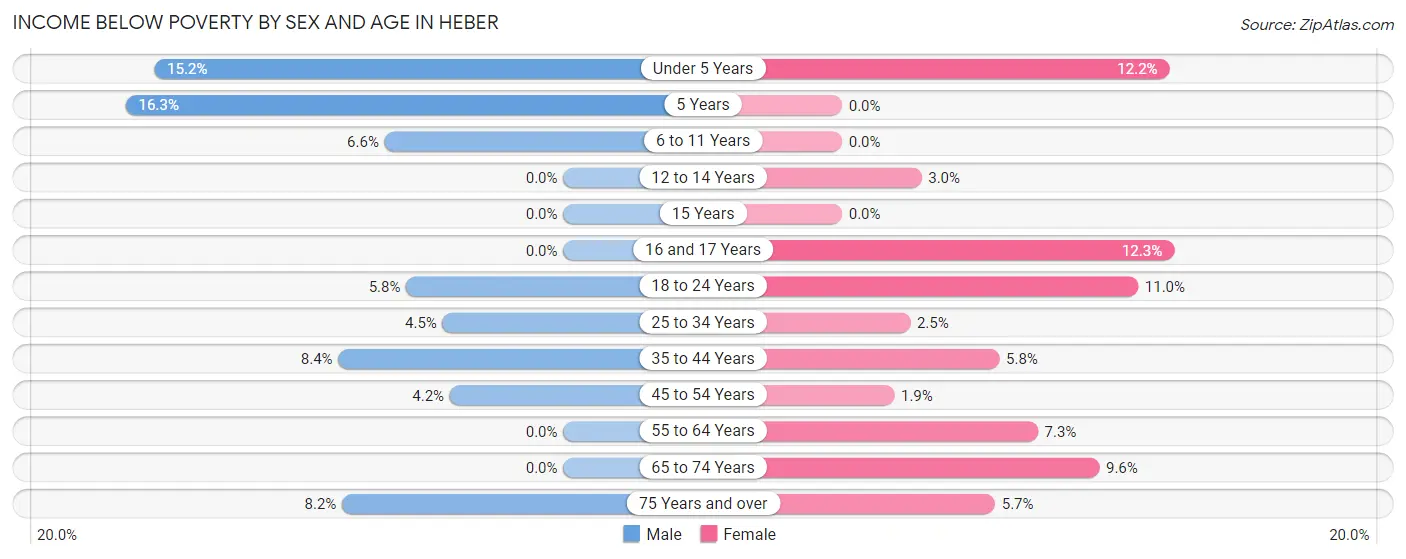
| Age Bracket | Male | Female |
| Under 5 Years | 118 (15.2%) | 76 (12.2%) |
| 5 Years | 13 (16.3%) | 0 (0.0%) |
| 6 to 11 Years | 59 (6.6%) | 0 (0.0%) |
| 12 to 14 Years | 0 (0.0%) | 17 (2.9%) |
| 15 Years | 0 (0.0%) | 0 (0.0%) |
| 16 and 17 Years | 0 (0.0%) | 37 (12.3%) |
| 18 to 24 Years | 66 (5.8%) | 117 (11.0%) |
| 25 to 34 Years | 44 (4.5%) | 27 (2.5%) |
| 35 to 44 Years | 108 (8.4%) | 69 (5.8%) |
| 45 to 54 Years | 46 (4.2%) | 18 (1.9%) |
| 55 to 64 Years | 0 (0.0%) | 44 (7.3%) |
| 65 to 74 Years | 0 (0.0%) | 40 (9.6%) |
| 75 Years and over | 11 (8.2%) | 15 (5.7%) |
| Total | 465 (5.5%) | 460 (5.5%) |
Income Above Poverty by Sex and Age in Heber
According to the poverty statistics in Heber, males aged 12 to 14 years and females aged 5 years are the age groups that are most secure financially, with 100.0% of males and 100.0% of females in these age groups living above the poverty line.
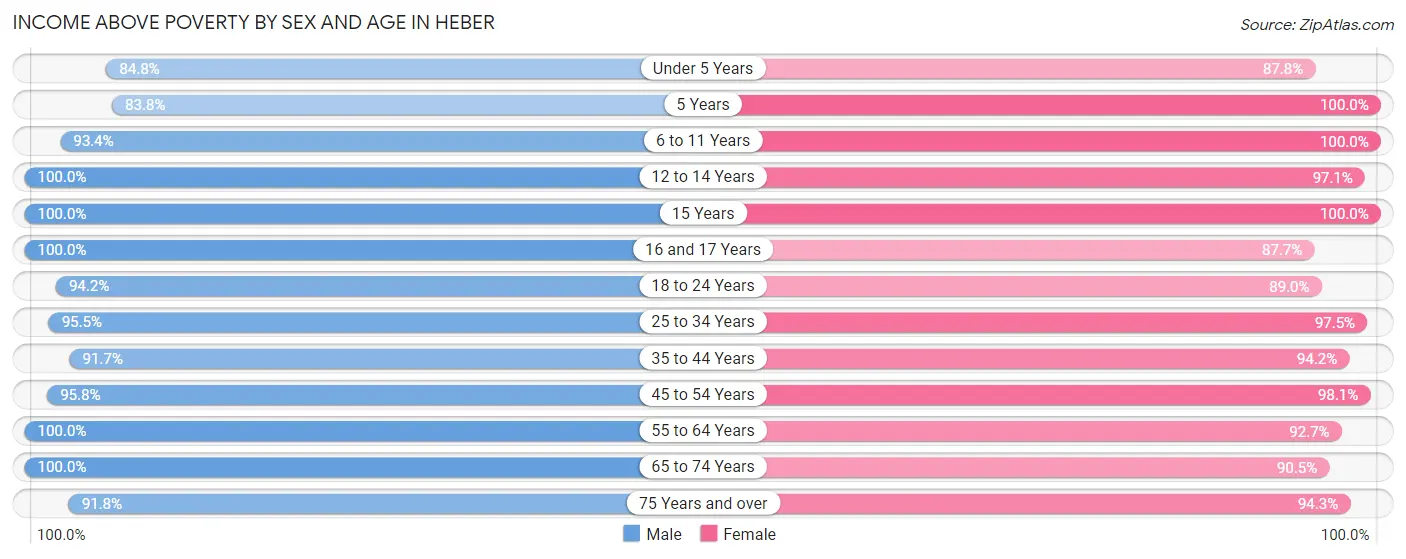
| Age Bracket | Male | Female |
| Under 5 Years | 659 (84.8%) | 549 (87.8%) |
| 5 Years | 67 (83.8%) | 110 (100.0%) |
| 6 to 11 Years | 831 (93.4%) | 987 (100.0%) |
| 12 to 14 Years | 511 (100.0%) | 560 (97.1%) |
| 15 Years | 66 (100.0%) | 201 (100.0%) |
| 16 and 17 Years | 415 (100.0%) | 263 (87.7%) |
| 18 to 24 Years | 1,067 (94.2%) | 948 (89.0%) |
| 25 to 34 Years | 939 (95.5%) | 1,041 (97.5%) |
| 35 to 44 Years | 1,185 (91.6%) | 1,112 (94.2%) |
| 45 to 54 Years | 1,046 (95.8%) | 908 (98.1%) |
| 55 to 64 Years | 653 (100.0%) | 561 (92.7%) |
| 65 to 74 Years | 428 (100.0%) | 379 (90.4%) |
| 75 Years and over | 123 (91.8%) | 249 (94.3%) |
| Total | 7,990 (94.5%) | 7,868 (94.5%) |
Income Below Poverty Among Married-Couple Families in Heber
The poverty statistics for married-couple families in Heber show that 2.4% or 76 of the total 3,224 families live below the poverty line. Families with 3 or 4 children have the highest poverty rate of 4.9%, comprising of 42 families. On the other hand, families with no children have the lowest poverty rate of 0.0%, which includes 0 families.
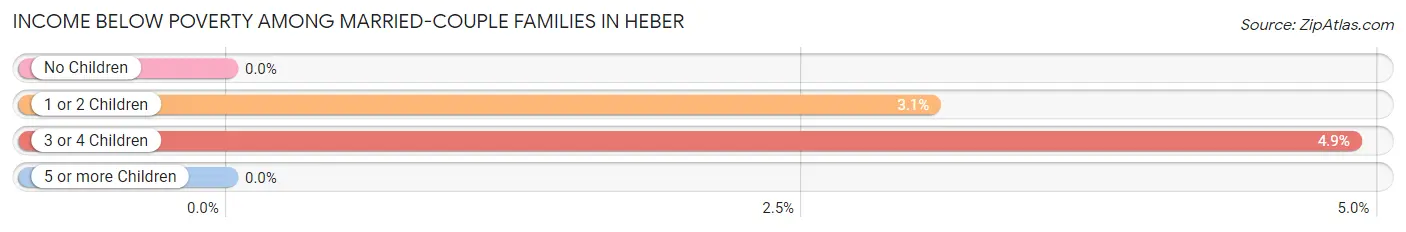
| Children | Above Poverty | Below Poverty |
| No Children | 1,189 (100.0%) | 0 (0.0%) |
| 1 or 2 Children | 1,076 (96.9%) | 34 (3.1%) |
| 3 or 4 Children | 817 (95.1%) | 42 (4.9%) |
| 5 or more Children | 66 (100.0%) | 0 (0.0%) |
| Total | 3,148 (97.6%) | 76 (2.4%) |
Income Below Poverty Among Single-Parent Households in Heber
According to the poverty data in Heber, 25.1% or 66 single-father households and 15.0% or 54 single-mother households are living below the poverty line. Among single-father households, those with no children have the highest poverty rate, with 66 households (76.7%) experiencing poverty. Likewise, among single-mother households, those with 1 or 2 children have the highest poverty rate, with 54 households (23.1%) falling below the poverty line.
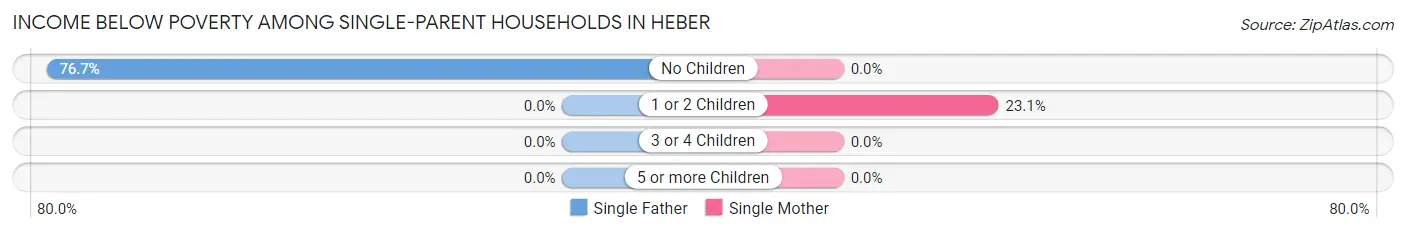
| Children | Single Father | Single Mother |
| No Children | 66 (76.7%) | 0 (0.0%) |
| 1 or 2 Children | 0 (0.0%) | 54 (23.1%) |
| 3 or 4 Children | 0 (0.0%) | 0 (0.0%) |
| 5 or more Children | 0 (0.0%) | 0 (0.0%) |
| Total | 66 (25.1%) | 54 (15.0%) |
Income Below Poverty Among Married-Couple vs Single-Parent Households in Heber
The poverty data for Heber shows that 76 of the married-couple family households (2.4%) and 120 of the single-parent households (19.3%) are living below the poverty level. Within the married-couple family households, those with 3 or 4 children have the highest poverty rate, with 42 households (4.9%) falling below the poverty line. Among the single-parent households, those with no children have the highest poverty rate, with 66 household (41.8%) living below poverty.
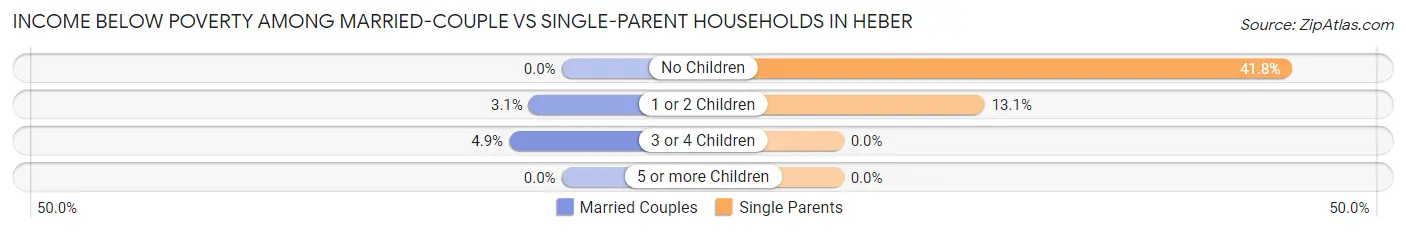
| Children | Married-Couple Families | Single-Parent Households |
| No Children | 0 (0.0%) | 66 (41.8%) |
| 1 or 2 Children | 34 (3.1%) | 54 (13.1%) |
| 3 or 4 Children | 42 (4.9%) | 0 (0.0%) |
| 5 or more Children | 0 (0.0%) | 0 (0.0%) |
| Total | 76 (2.4%) | 120 (19.3%) |
Employment Characteristics in Heber
Employment by Class of Employer in Heber
Among the 8,593 employed individuals in Heber, private company employees (5,500 | 64.0%), local government employees (1,040 | 12.1%), and self-employed (not incorporated) (606 | 7.0%) make up the most common classes of employment.
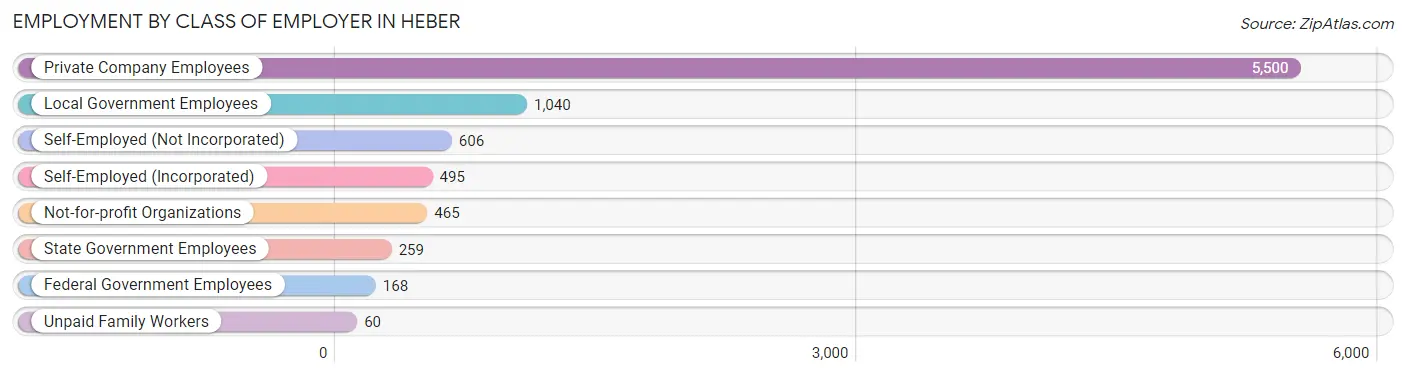
| Employer Class | # Employees | % Employees |
| Private Company Employees | 5,500 | 64.0% |
| Self-Employed (Incorporated) | 495 | 5.8% |
| Self-Employed (Not Incorporated) | 606 | 7.0% |
| Not-for-profit Organizations | 465 | 5.4% |
| Local Government Employees | 1,040 | 12.1% |
| State Government Employees | 259 | 3.0% |
| Federal Government Employees | 168 | 2.0% |
| Unpaid Family Workers | 60 | 0.7% |
| Total | 8,593 | 100.0% |
Employment Status by Age in Heber
According to the labor force statistics for Heber, out of the total population over 16 years of age (12,107), 74.8% or 9,056 individuals are in the labor force, with 2.9% or 263 of them unemployed. The age group with the highest labor force participation rate is 45 to 54 years, with 89.0% or 1,802 individuals in the labor force. Within the labor force, the 16 to 19 years age range has the highest percentage of unemployed individuals, with 21.4% or 179 of them being unemployed.
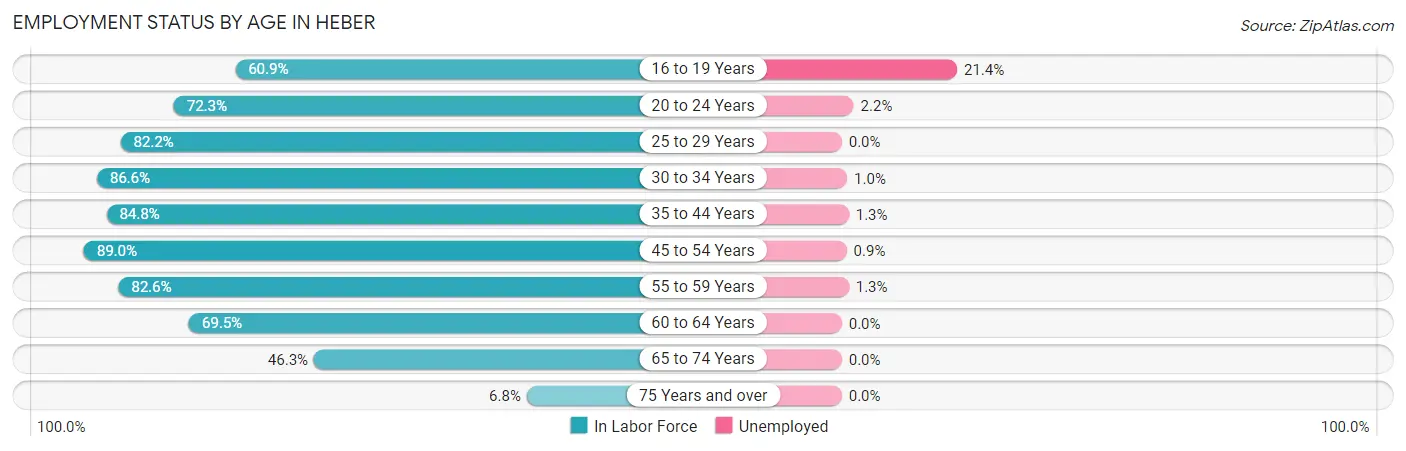
| Age Bracket | In Labor Force | Unemployed |
| 16 to 19 Years | 837 (60.9%) | 179 (21.4%) |
| 20 to 24 Years | 1,116 (72.3%) | 25 (2.2%) |
| 25 to 29 Years | 757 (82.2%) | 0 (0.0%) |
| 30 to 34 Years | 1,007 (86.6%) | 10 (1.0%) |
| 35 to 44 Years | 2,106 (84.8%) | 27 (1.3%) |
| 45 to 54 Years | 1,802 (89.0%) | 16 (0.9%) |
| 55 to 59 Years | 637 (82.6%) | 8 (1.3%) |
| 60 to 64 Years | 358 (69.5%) | 0 (0.0%) |
| 65 to 74 Years | 403 (46.3%) | 0 (0.0%) |
| 75 Years and over | 30 (6.8%) | 0 (0.0%) |
| Total | 9,056 (74.8%) | 263 (2.9%) |
Employment Status by Educational Attainment in Heber
According to labor force statistics for Heber, 84.6% of individuals (6,665) out of the total population between 25 and 64 years of age (7,878) are in the labor force, with 0.9% or 60 of them being unemployed. The group with the highest labor force participation rate are those with the educational attainment of high school diploma, with 86.6% or 1,394 individuals in the labor force. Within the labor force, individuals with less than high school education have the highest percentage of unemployment, with 6.4% or 27 of them being unemployed.
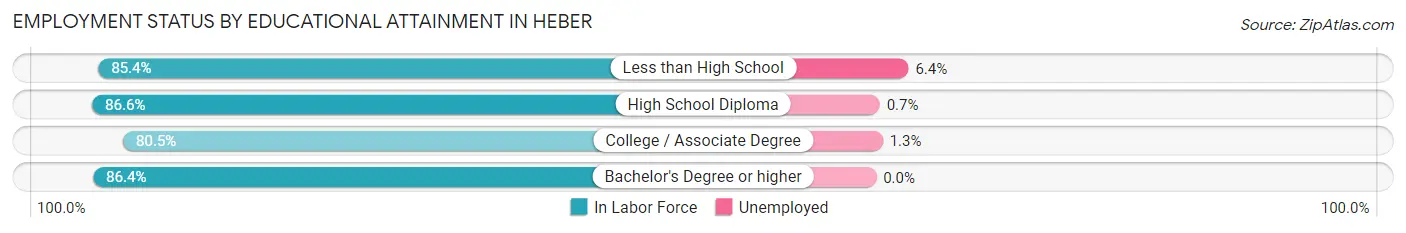
| Educational Attainment | In Labor Force | Unemployed |
| Less than High School | 421 (85.4%) | 32 (6.4%) |
| High School Diploma | 1,394 (86.6%) | 11 (0.7%) |
| College / Associate Degree | 1,899 (80.5%) | 31 (1.3%) |
| Bachelor's Degree or higher | 2,951 (86.4%) | 0 (0.0%) |
| Total | 6,665 (84.6%) | 71 (0.9%) |
Employment Occupations by Sex in Heber
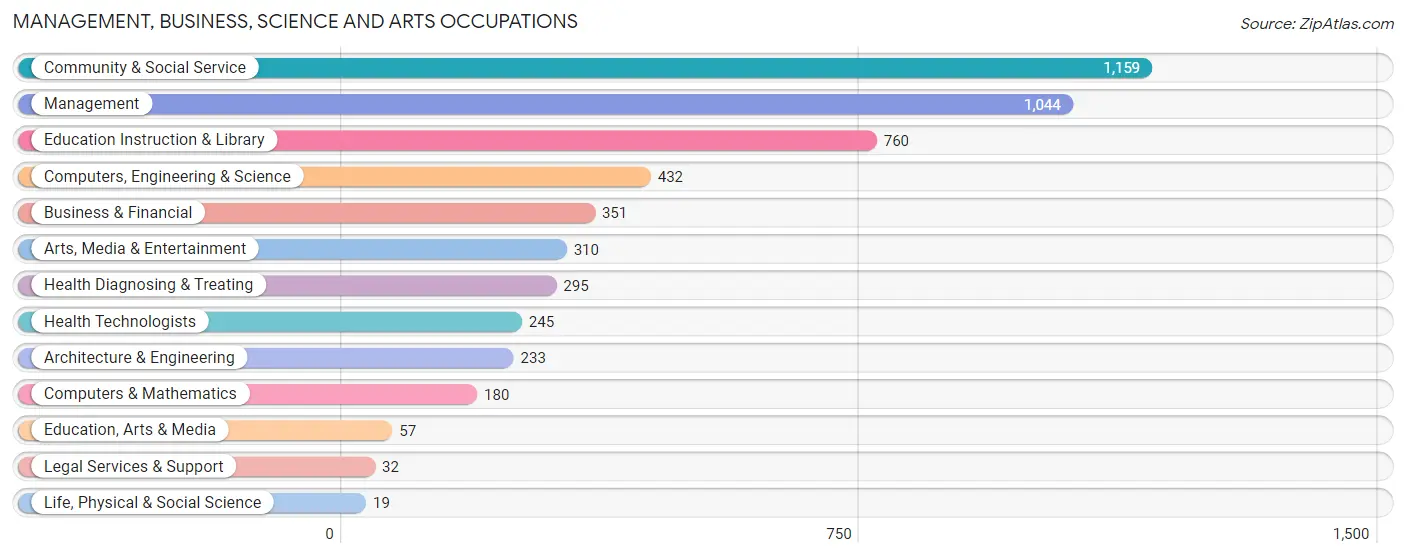
Management, Business, Science and Arts Occupations
The most common Management, Business, Science and Arts occupations in Heber are Community & Social Service (1,159 | 13.3%), Management (1,044 | 11.9%), Education Instruction & Library (760 | 8.7%), Computers, Engineering & Science (432 | 4.9%), and Business & Financial (351 | 4.0%).
Management, Business, Science and Arts Occupations by Sex
Within the Management, Business, Science and Arts occupations in Heber, the most male-oriented occupations are Computers & Mathematics (100.0%), Architecture & Engineering (100.0%), and Computers, Engineering & Science (98.2%), while the most female-oriented occupations are Legal Services & Support (100.0%), Education Instruction & Library (73.4%), and Community & Social Service (71.8%).
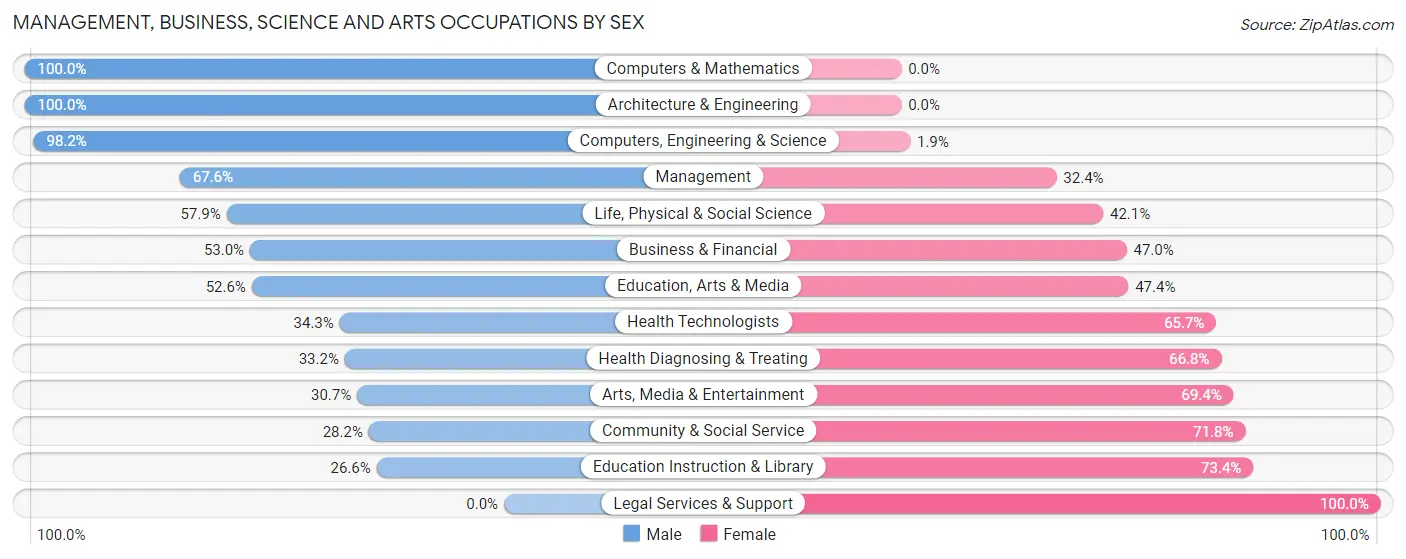
| Occupation | Male | Female |
| Management | 706 (67.6%) | 338 (32.4%) |
| Business & Financial | 186 (53.0%) | 165 (47.0%) |
| Computers, Engineering & Science | 424 (98.2%) | 8 (1.8%) |
| Computers & Mathematics | 180 (100.0%) | 0 (0.0%) |
| Architecture & Engineering | 233 (100.0%) | 0 (0.0%) |
| Life, Physical & Social Science | 11 (57.9%) | 8 (42.1%) |
| Community & Social Service | 327 (28.2%) | 832 (71.8%) |
| Education, Arts & Media | 30 (52.6%) | 27 (47.4%) |
| Legal Services & Support | 0 (0.0%) | 32 (100.0%) |
| Education Instruction & Library | 202 (26.6%) | 558 (73.4%) |
| Arts, Media & Entertainment | 95 (30.6%) | 215 (69.4%) |
| Health Diagnosing & Treating | 98 (33.2%) | 197 (66.8%) |
| Health Technologists | 84 (34.3%) | 161 (65.7%) |
| Total (Category) | 1,741 (53.1%) | 1,540 (46.9%) |
| Total (Overall) | 4,955 (56.7%) | 3,783 (43.3%) |
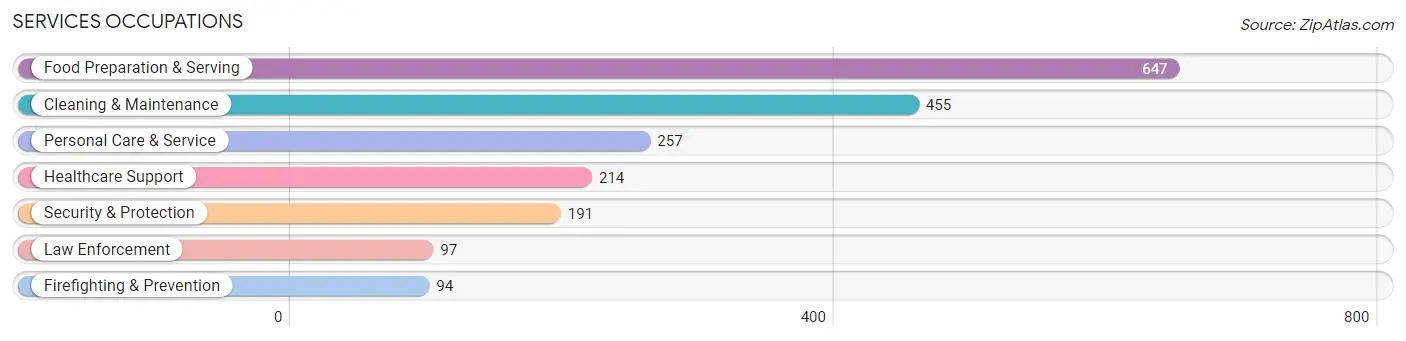
Services Occupations
The most common Services occupations in Heber are Food Preparation & Serving (647 | 7.4%), Cleaning & Maintenance (455 | 5.2%), Personal Care & Service (257 | 2.9%), Healthcare Support (214 | 2.5%), and Security & Protection (191 | 2.2%).
Services Occupations by Sex
Within the Services occupations in Heber, the most male-oriented occupations are Law Enforcement (100.0%), Security & Protection (85.9%), and Firefighting & Prevention (71.3%), while the most female-oriented occupations are Healthcare Support (80.4%), Personal Care & Service (67.3%), and Food Preparation & Serving (58.7%).
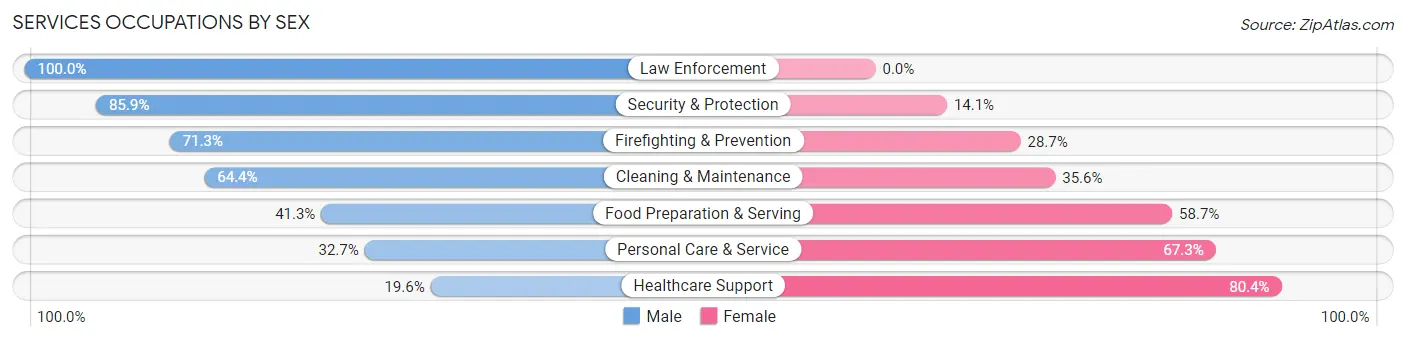
| Occupation | Male | Female |
| Healthcare Support | 42 (19.6%) | 172 (80.4%) |
| Security & Protection | 164 (85.9%) | 27 (14.1%) |
| Firefighting & Prevention | 67 (71.3%) | 27 (28.7%) |
| Law Enforcement | 97 (100.0%) | 0 (0.0%) |
| Food Preparation & Serving | 267 (41.3%) | 380 (58.7%) |
| Cleaning & Maintenance | 293 (64.4%) | 162 (35.6%) |
| Personal Care & Service | 84 (32.7%) | 173 (67.3%) |
| Total (Category) | 850 (48.2%) | 914 (51.8%) |
| Total (Overall) | 4,955 (56.7%) | 3,783 (43.3%) |
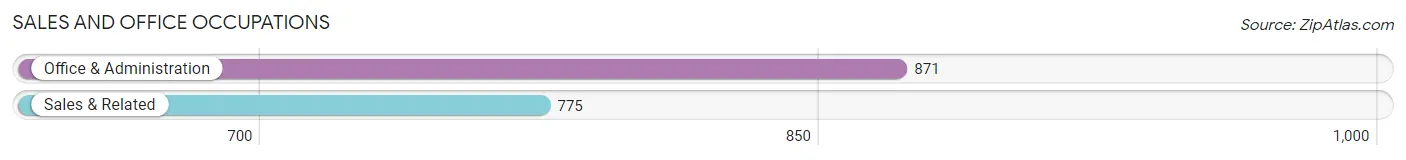
Sales and Office Occupations
The most common Sales and Office occupations in Heber are Office & Administration (871 | 10.0%), and Sales & Related (775 | 8.9%).
Sales and Office Occupations by Sex
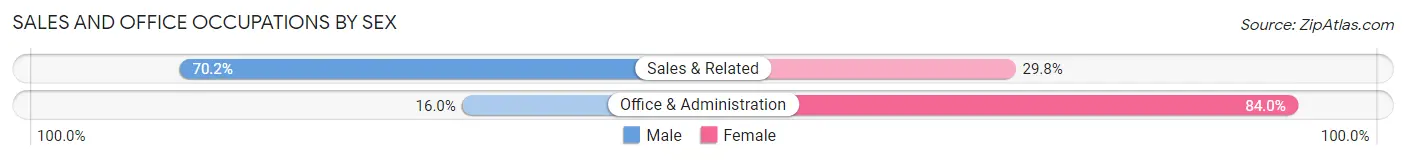
| Occupation | Male | Female |
| Sales & Related | 544 (70.2%) | 231 (29.8%) |
| Office & Administration | 139 (16.0%) | 732 (84.0%) |
| Total (Category) | 683 (41.5%) | 963 (58.5%) |
| Total (Overall) | 4,955 (56.7%) | 3,783 (43.3%) |
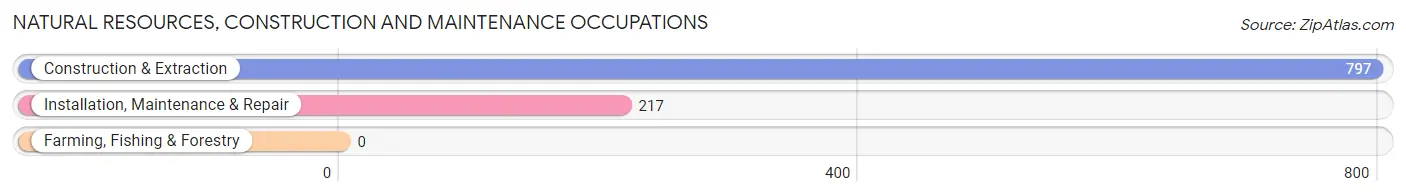
Natural Resources, Construction and Maintenance Occupations
The most common Natural Resources, Construction and Maintenance occupations in Heber are Construction & Extraction (797 | 9.1%), and Installation, Maintenance & Repair (217 | 2.5%).
Natural Resources, Construction and Maintenance Occupations by Sex
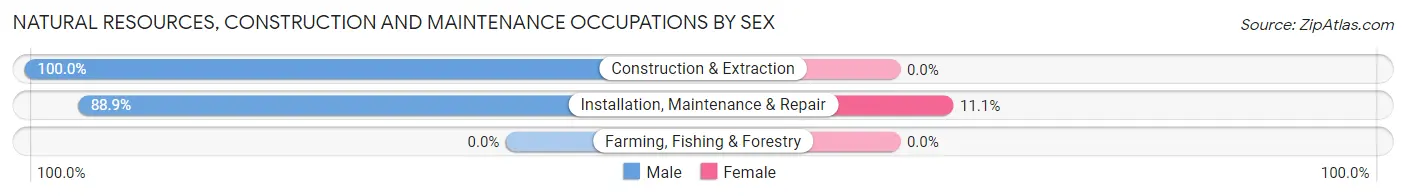
| Occupation | Male | Female |
| Farming, Fishing & Forestry | 0 (0.0%) | 0 (0.0%) |
| Construction & Extraction | 797 (100.0%) | 0 (0.0%) |
| Installation, Maintenance & Repair | 193 (88.9%) | 24 (11.1%) |
| Total (Category) | 990 (97.6%) | 24 (2.4%) |
| Total (Overall) | 4,955 (56.7%) | 3,783 (43.3%) |
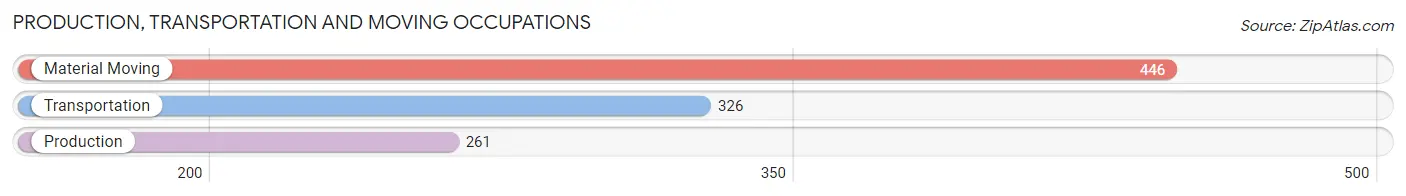
Production, Transportation and Moving Occupations
The most common Production, Transportation and Moving occupations in Heber are Material Moving (446 | 5.1%), Transportation (326 | 3.7%), and Production (261 | 3.0%).
Production, Transportation and Moving Occupations by Sex
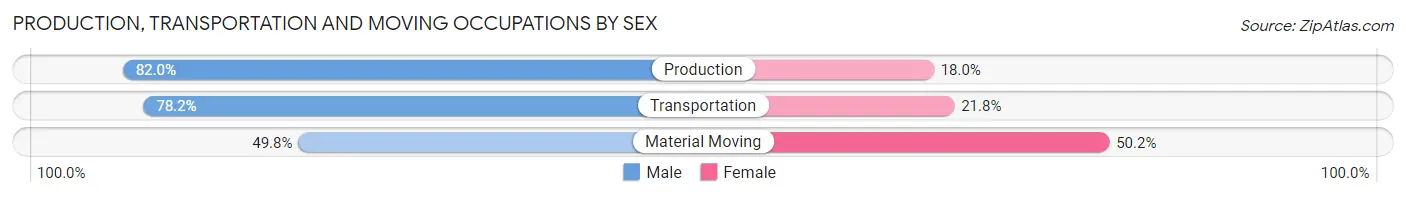
| Occupation | Male | Female |
| Production | 214 (82.0%) | 47 (18.0%) |
| Transportation | 255 (78.2%) | 71 (21.8%) |
| Material Moving | 222 (49.8%) | 224 (50.2%) |
| Total (Category) | 691 (66.9%) | 342 (33.1%) |
| Total (Overall) | 4,955 (56.7%) | 3,783 (43.3%) |
Employment Industries by Sex in Heber
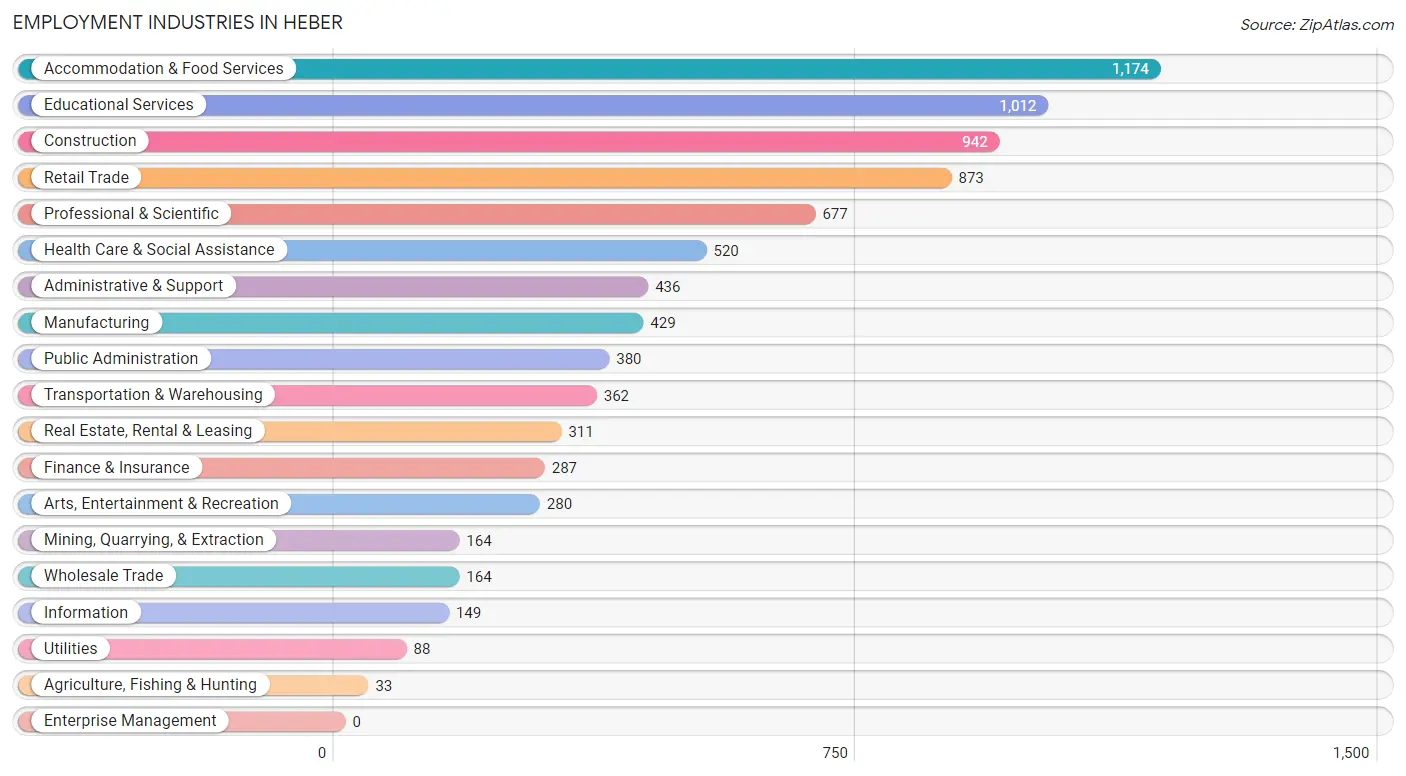
Employment Industries in Heber
The major employment industries in Heber include Accommodation & Food Services (1,174 | 13.4%), Educational Services (1,012 | 11.6%), Construction (942 | 10.8%), Retail Trade (873 | 10.0%), and Professional & Scientific (677 | 7.7%).
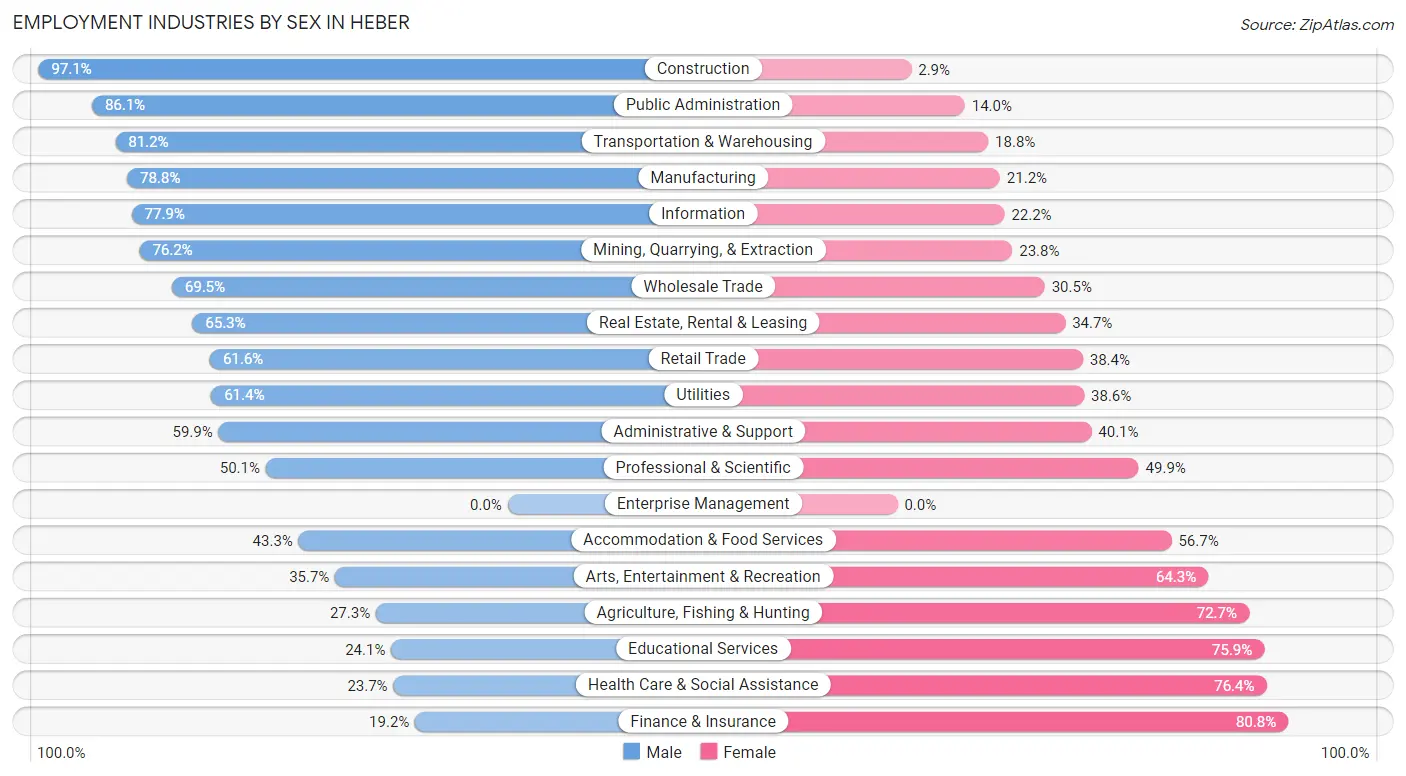
Employment Industries by Sex in Heber
The Heber industries that see more men than women are Construction (97.1%), Public Administration (86.1%), and Transportation & Warehousing (81.2%), whereas the industries that tend to have a higher number of women are Finance & Insurance (80.8%), Health Care & Social Assistance (76.3%), and Educational Services (75.9%).
| Industry | Male | Female |
| Agriculture, Fishing & Hunting | 9 (27.3%) | 24 (72.7%) |
| Mining, Quarrying, & Extraction | 125 (76.2%) | 39 (23.8%) |
| Construction | 915 (97.1%) | 27 (2.9%) |
| Manufacturing | 338 (78.8%) | 91 (21.2%) |
| Wholesale Trade | 114 (69.5%) | 50 (30.5%) |
| Retail Trade | 538 (61.6%) | 335 (38.4%) |
| Transportation & Warehousing | 294 (81.2%) | 68 (18.8%) |
| Utilities | 54 (61.4%) | 34 (38.6%) |
| Information | 116 (77.8%) | 33 (22.2%) |
| Finance & Insurance | 55 (19.2%) | 232 (80.8%) |
| Real Estate, Rental & Leasing | 203 (65.3%) | 108 (34.7%) |
| Professional & Scientific | 339 (50.1%) | 338 (49.9%) |
| Enterprise Management | 0 (0.0%) | 0 (0.0%) |
| Administrative & Support | 261 (59.9%) | 175 (40.1%) |
| Educational Services | 244 (24.1%) | 768 (75.9%) |
| Health Care & Social Assistance | 123 (23.6%) | 397 (76.3%) |
| Arts, Entertainment & Recreation | 100 (35.7%) | 180 (64.3%) |
| Accommodation & Food Services | 508 (43.3%) | 666 (56.7%) |
| Public Administration | 327 (86.1%) | 53 (14.0%) |
| Total | 4,955 (56.7%) | 3,783 (43.3%) |
Education in Heber
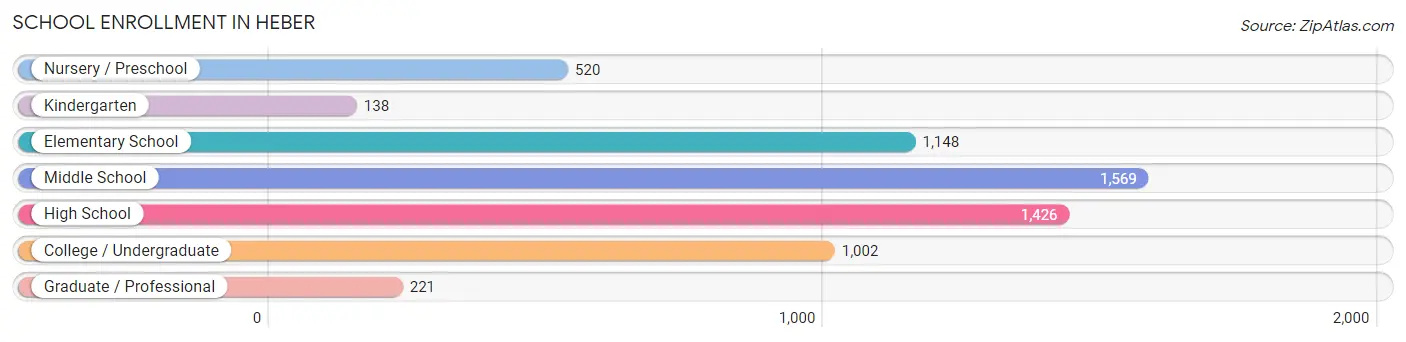
School Enrollment in Heber
The most common levels of schooling among the 6,024 students in Heber are middle school (1,569 | 26.1%), high school (1,426 | 23.7%), and elementary school (1,148 | 19.1%).
| School Level | # Students | % Students |
| Nursery / Preschool | 520 | 8.6% |
| Kindergarten | 138 | 2.3% |
| Elementary School | 1,148 | 19.1% |
| Middle School | 1,569 | 26.1% |
| High School | 1,426 | 23.7% |
| College / Undergraduate | 1,002 | 16.6% |
| Graduate / Professional | 221 | 3.7% |
| Total | 6,024 | 100.0% |
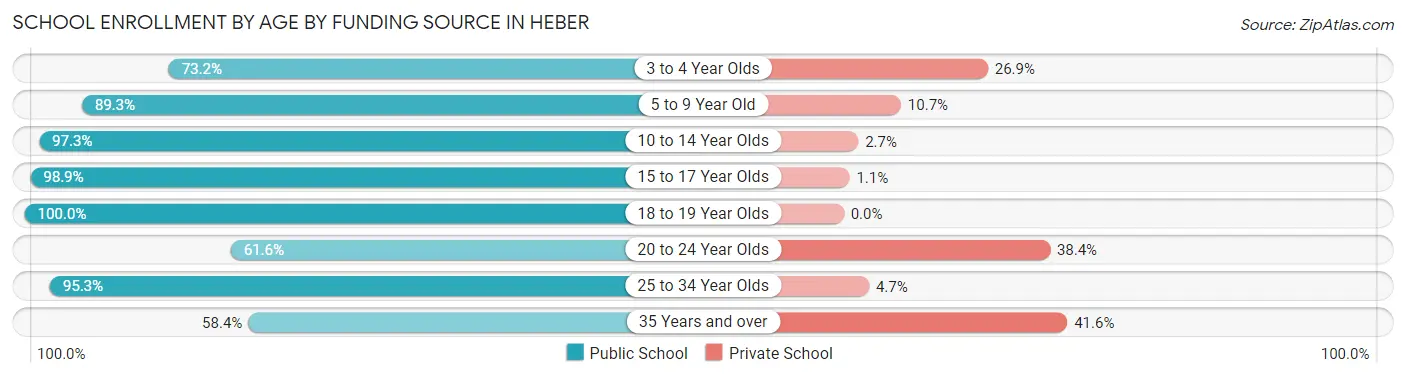
School Enrollment by Age by Funding Source in Heber
Out of a total of 6,024 students who are enrolled in schools in Heber, 657 (10.9%) attend a private institution, while the remaining 5,367 (89.1%) are enrolled in public schools. The age group of 35 years and over has the highest likelihood of being enrolled in private schools, with 112 (41.6% in the age bracket) enrolled. Conversely, the age group of 18 to 19 year olds has the lowest likelihood of being enrolled in a private school, with 457 (100.0% in the age bracket) attending a public institution.
| Age Bracket | Public School | Private School |
| 3 to 4 Year Olds | 327 (73.2%) | 120 (26.9%) |
| 5 to 9 Year Old | 1,106 (89.3%) | 132 (10.7%) |
| 10 to 14 Year Olds | 1,794 (97.3%) | 50 (2.7%) |
| 15 to 17 Year Olds | 913 (98.9%) | 10 (1.1%) |
| 18 to 19 Year Olds | 457 (100.0%) | 0 (0.0%) |
| 20 to 24 Year Olds | 351 (61.6%) | 219 (38.4%) |
| 25 to 34 Year Olds | 263 (95.3%) | 13 (4.7%) |
| 35 Years and over | 157 (58.4%) | 112 (41.6%) |
| Total | 5,367 (89.1%) | 657 (10.9%) |
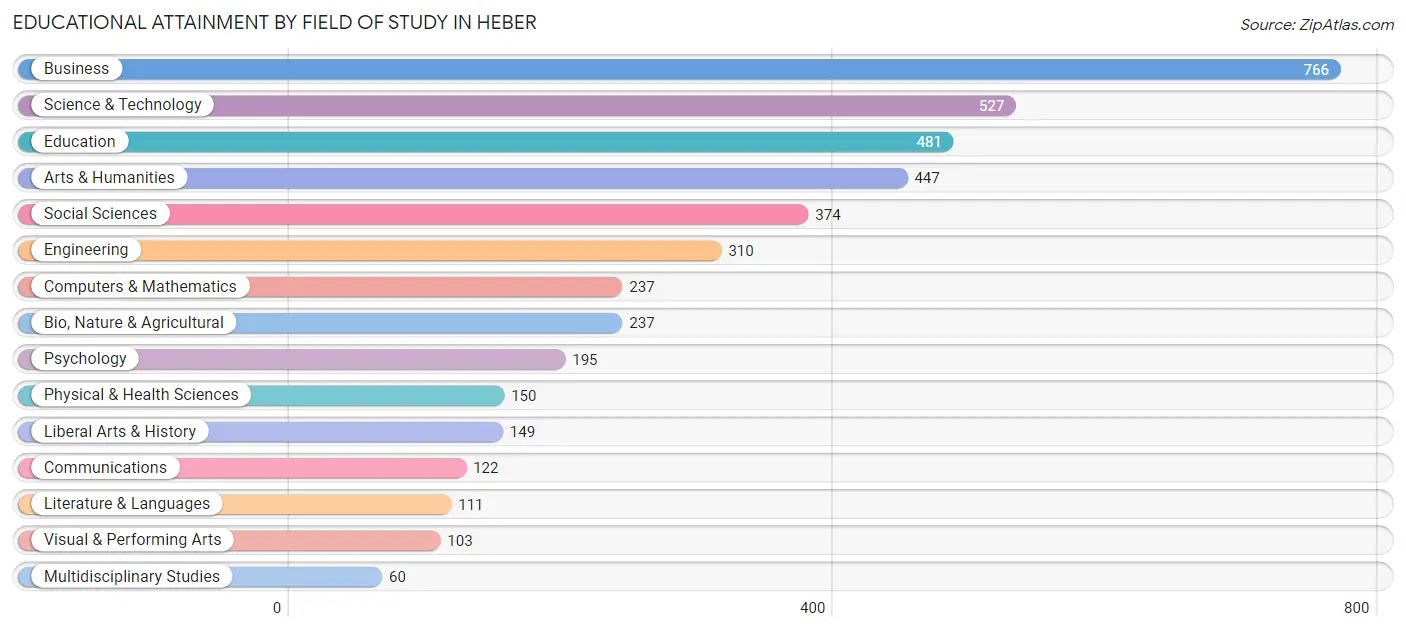
Educational Attainment by Field of Study in Heber
Business (766 | 17.9%), science & technology (527 | 12.3%), education (481 | 11.3%), arts & humanities (447 | 10.5%), and social sciences (374 | 8.8%) are the most common fields of study among 4,269 individuals in Heber who have obtained a bachelor's degree or higher.
| Field of Study | # Graduates | % Graduates |
| Computers & Mathematics | 237 | 5.6% |
| Bio, Nature & Agricultural | 237 | 5.6% |
| Physical & Health Sciences | 150 | 3.5% |
| Psychology | 195 | 4.6% |
| Social Sciences | 374 | 8.8% |
| Engineering | 310 | 7.3% |
| Multidisciplinary Studies | 60 | 1.4% |
| Science & Technology | 527 | 12.3% |
| Business | 766 | 17.9% |
| Education | 481 | 11.3% |
| Literature & Languages | 111 | 2.6% |
| Liberal Arts & History | 149 | 3.5% |
| Visual & Performing Arts | 103 | 2.4% |
| Communications | 122 | 2.9% |
| Arts & Humanities | 447 | 10.5% |
| Total | 4,269 | 100.0% |
Transportation & Commute in Heber
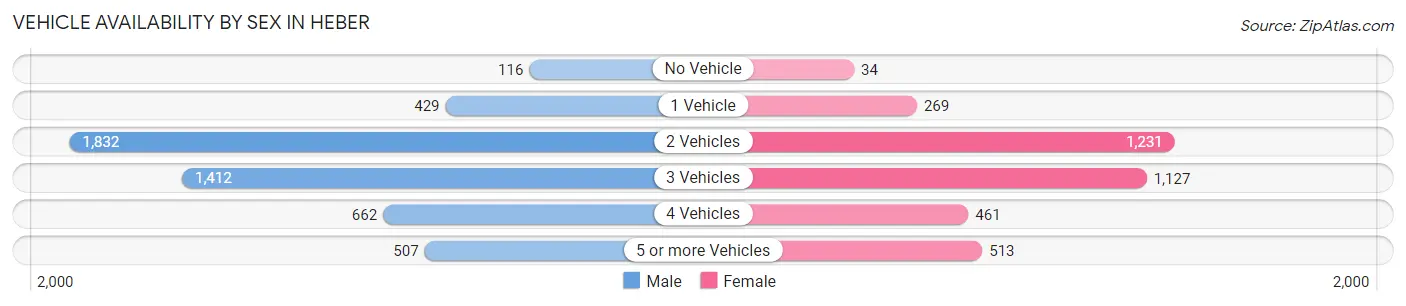
Vehicle Availability by Sex in Heber
The most prevalent vehicle ownership categories in Heber are males with 2 vehicles (1,832, accounting for 36.9%) and females with 2 vehicles (1,231, making up 50.4%).
| Vehicles Available | Male | Female |
| No Vehicle | 116 (2.3%) | 34 (0.9%) |
| 1 Vehicle | 429 (8.6%) | 269 (7.4%) |
| 2 Vehicles | 1,832 (36.9%) | 1,231 (33.9%) |
| 3 Vehicles | 1,412 (28.5%) | 1,127 (31.0%) |
| 4 Vehicles | 662 (13.4%) | 461 (12.7%) |
| 5 or more Vehicles | 507 (10.2%) | 513 (14.1%) |
| Total | 4,958 (100.0%) | 3,635 (100.0%) |
Commute Time in Heber
The most frequently occuring commute durations in Heber are 5 to 9 minutes (1,590 commuters, 20.6%), less than 5 minutes (985 commuters, 12.8%), and 10 to 14 minutes (960 commuters, 12.4%).
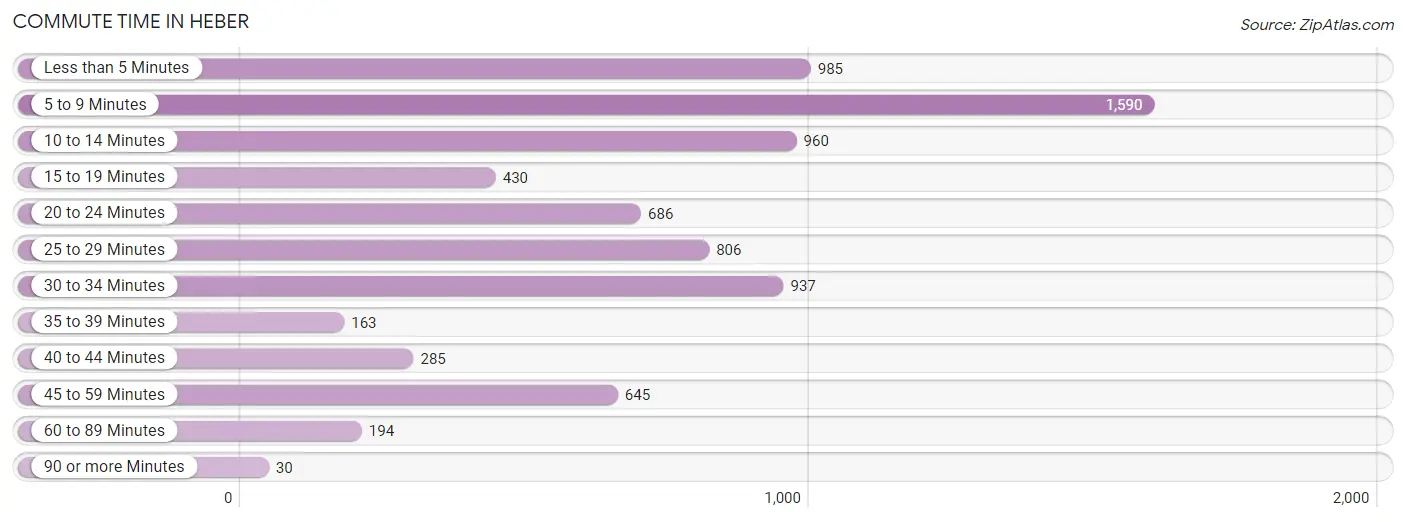
| Commute Time | # Commuters | % Commuters |
| Less than 5 Minutes | 985 | 12.8% |
| 5 to 9 Minutes | 1,590 | 20.6% |
| 10 to 14 Minutes | 960 | 12.4% |
| 15 to 19 Minutes | 430 | 5.6% |
| 20 to 24 Minutes | 686 | 8.9% |
| 25 to 29 Minutes | 806 | 10.4% |
| 30 to 34 Minutes | 937 | 12.1% |
| 35 to 39 Minutes | 163 | 2.1% |
| 40 to 44 Minutes | 285 | 3.7% |
| 45 to 59 Minutes | 645 | 8.4% |
| 60 to 89 Minutes | 194 | 2.5% |
| 90 or more Minutes | 30 | 0.4% |
Commute Time by Sex in Heber
The most common commute times in Heber are 5 to 9 minutes (659 commuters, 14.5%) for males and 5 to 9 minutes (931 commuters, 29.5%) for females.
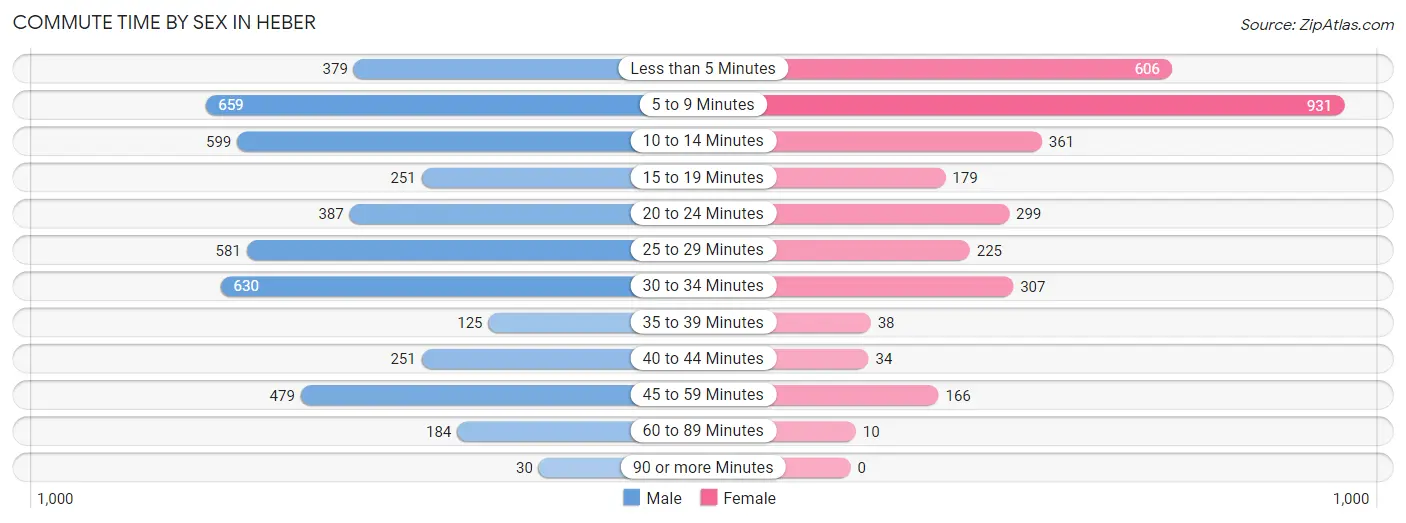
| Commute Time | Male | Female |
| Less than 5 Minutes | 379 (8.3%) | 606 (19.2%) |
| 5 to 9 Minutes | 659 (14.5%) | 931 (29.5%) |
| 10 to 14 Minutes | 599 (13.2%) | 361 (11.4%) |
| 15 to 19 Minutes | 251 (5.5%) | 179 (5.7%) |
| 20 to 24 Minutes | 387 (8.5%) | 299 (9.5%) |
| 25 to 29 Minutes | 581 (12.8%) | 225 (7.1%) |
| 30 to 34 Minutes | 630 (13.8%) | 307 (9.7%) |
| 35 to 39 Minutes | 125 (2.7%) | 38 (1.2%) |
| 40 to 44 Minutes | 251 (5.5%) | 34 (1.1%) |
| 45 to 59 Minutes | 479 (10.5%) | 166 (5.3%) |
| 60 to 89 Minutes | 184 (4.0%) | 10 (0.3%) |
| 90 or more Minutes | 30 (0.7%) | 0 (0.0%) |
Time of Departure to Work by Sex in Heber
The most frequent times of departure to work in Heber are 7:00 AM to 7:29 AM (944, 20.7%) for males and 8:00 AM to 8:29 AM (730, 23.1%) for females.
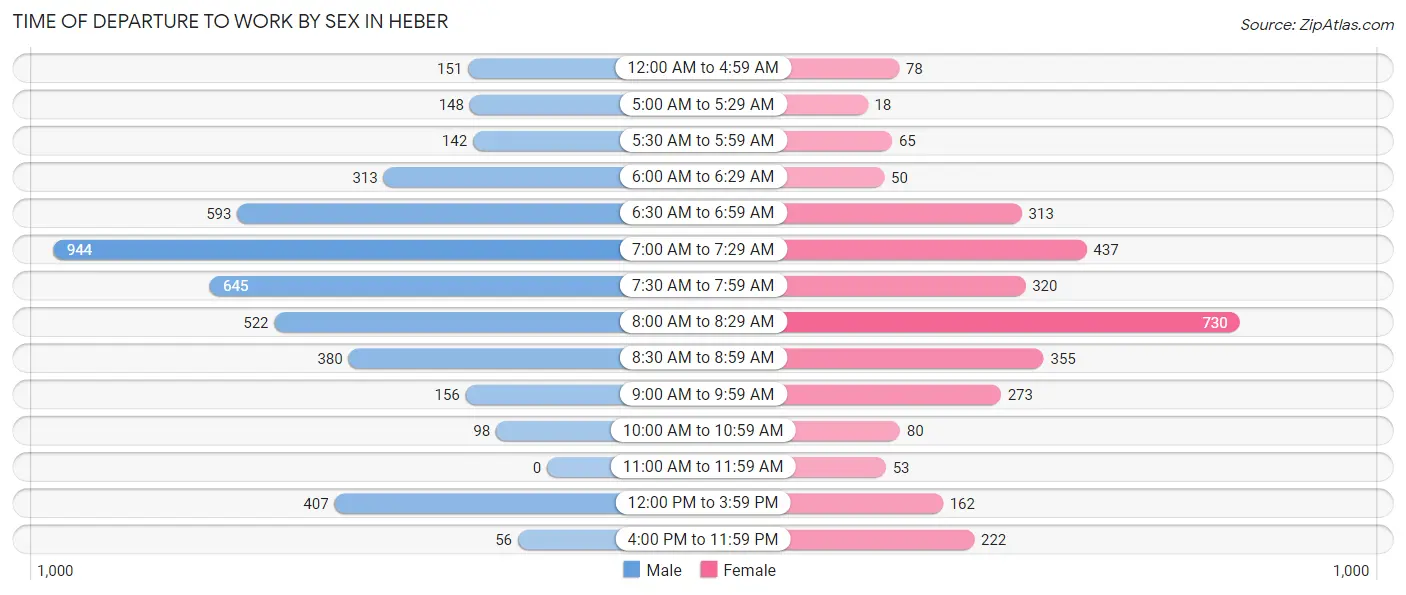
| Time of Departure | Male | Female |
| 12:00 AM to 4:59 AM | 151 (3.3%) | 78 (2.5%) |
| 5:00 AM to 5:29 AM | 148 (3.3%) | 18 (0.6%) |
| 5:30 AM to 5:59 AM | 142 (3.1%) | 65 (2.1%) |
| 6:00 AM to 6:29 AM | 313 (6.9%) | 50 (1.6%) |
| 6:30 AM to 6:59 AM | 593 (13.0%) | 313 (9.9%) |
| 7:00 AM to 7:29 AM | 944 (20.7%) | 437 (13.9%) |
| 7:30 AM to 7:59 AM | 645 (14.2%) | 320 (10.1%) |
| 8:00 AM to 8:29 AM | 522 (11.5%) | 730 (23.1%) |
| 8:30 AM to 8:59 AM | 380 (8.3%) | 355 (11.3%) |
| 9:00 AM to 9:59 AM | 156 (3.4%) | 273 (8.6%) |
| 10:00 AM to 10:59 AM | 98 (2.1%) | 80 (2.5%) |
| 11:00 AM to 11:59 AM | 0 (0.0%) | 53 (1.7%) |
| 12:00 PM to 3:59 PM | 407 (8.9%) | 162 (5.1%) |
| 4:00 PM to 11:59 PM | 56 (1.2%) | 222 (7.0%) |
| Total | 4,555 (100.0%) | 3,156 (100.0%) |
Housing Occupancy in Heber
Occupancy by Ownership in Heber
Of the total 4,980 dwellings in Heber, owner-occupied units account for 3,895 (78.2%), while renter-occupied units make up 1,085 (21.8%).
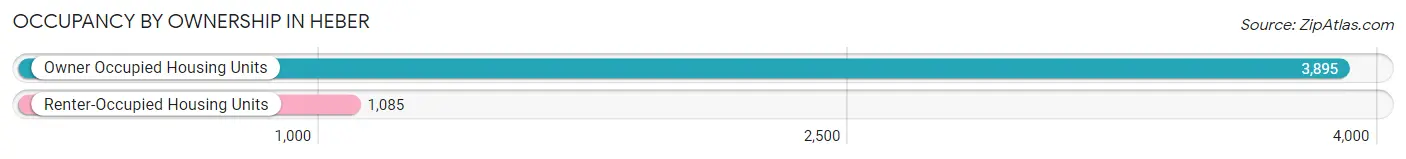
| Occupancy | # Housing Units | % Housing Units |
| Owner Occupied Housing Units | 3,895 | 78.2% |
| Renter-Occupied Housing Units | 1,085 | 21.8% |
| Total Occupied Housing Units | 4,980 | 100.0% |
Occupancy by Household Size in Heber
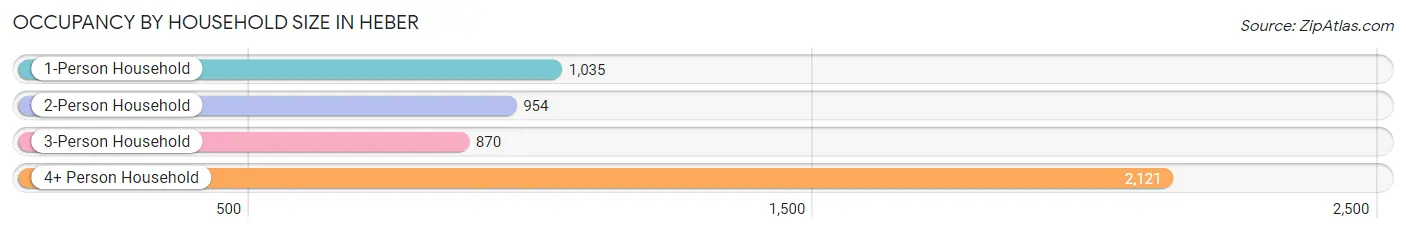
| Household Size | # Housing Units | % Housing Units |
| 1-Person Household | 1,035 | 20.8% |
| 2-Person Household | 954 | 19.2% |
| 3-Person Household | 870 | 17.5% |
| 4+ Person Household | 2,121 | 42.6% |
| Total Housing Units | 4,980 | 100.0% |
Occupancy by Ownership by Household Size in Heber
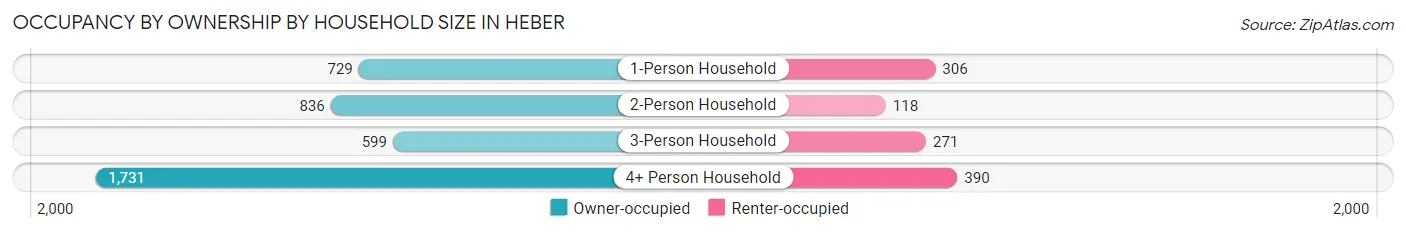
| Household Size | Owner-occupied | Renter-occupied |
| 1-Person Household | 729 (70.4%) | 306 (29.6%) |
| 2-Person Household | 836 (87.6%) | 118 (12.4%) |
| 3-Person Household | 599 (68.9%) | 271 (31.1%) |
| 4+ Person Household | 1,731 (81.6%) | 390 (18.4%) |
| Total Housing Units | 3,895 (78.2%) | 1,085 (21.8%) |
Occupancy by Educational Attainment in Heber
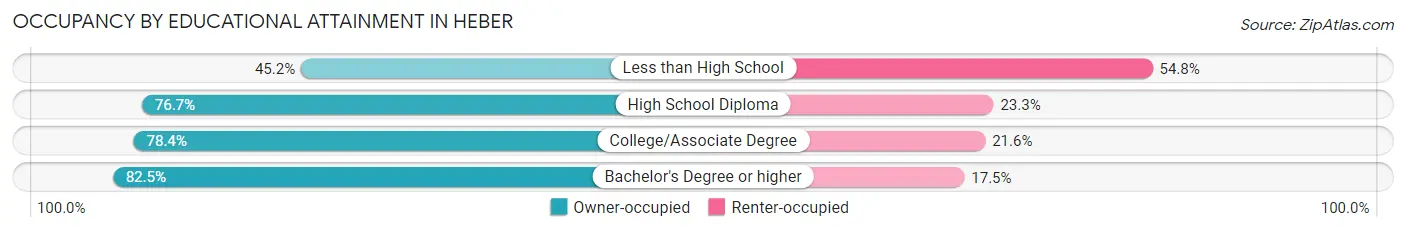
| Household Size | Owner-occupied | Renter-occupied |
| Less than High School | 113 (45.2%) | 137 (54.8%) |
| High School Diploma | 660 (76.7%) | 200 (23.3%) |
| College/Associate Degree | 1,356 (78.4%) | 374 (21.6%) |
| Bachelor's Degree or higher | 1,766 (82.5%) | 374 (17.5%) |
Occupancy by Age of Householder in Heber
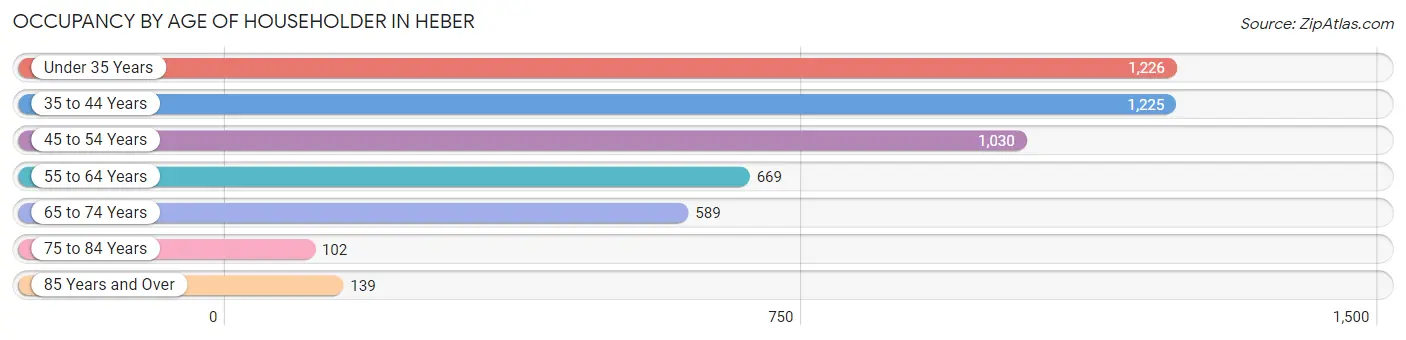
| Age Bracket | # Households | % Households |
| Under 35 Years | 1,226 | 24.6% |
| 35 to 44 Years | 1,225 | 24.6% |
| 45 to 54 Years | 1,030 | 20.7% |
| 55 to 64 Years | 669 | 13.4% |
| 65 to 74 Years | 589 | 11.8% |
| 75 to 84 Years | 102 | 2.1% |
| 85 Years and Over | 139 | 2.8% |
| Total | 4,980 | 100.0% |
Housing Finances in Heber
Median Income by Occupancy in Heber
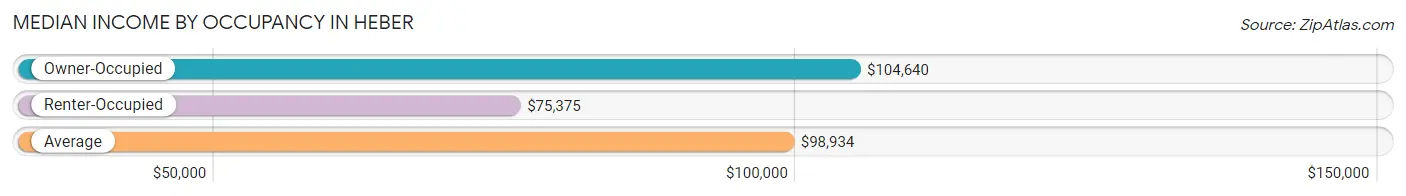
| Occupancy Type | # Households | Median Income |
| Owner-Occupied | 3,895 (78.2%) | $104,640 |
| Renter-Occupied | 1,085 (21.8%) | $75,375 |
| Average | 4,980 (100.0%) | $98,934 |
Occupancy by Householder Income Bracket in Heber
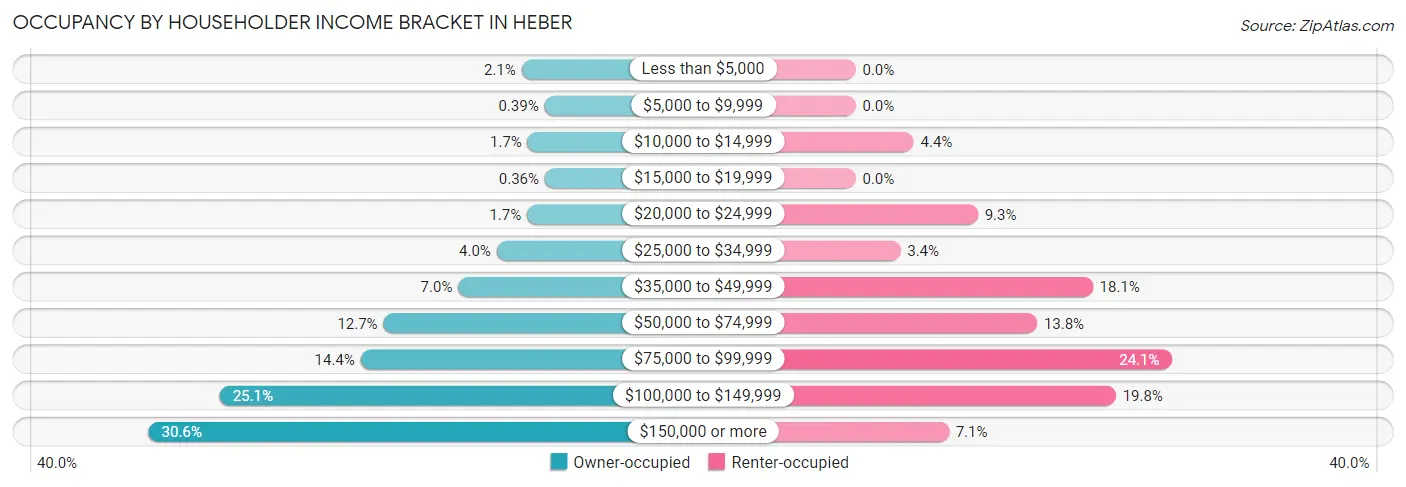
| Income Bracket | Owner-occupied | Renter-occupied |
| Less than $5,000 | 83 (2.1%) | 0 (0.0%) |
| $5,000 to $9,999 | 15 (0.4%) | 0 (0.0%) |
| $10,000 to $14,999 | 65 (1.7%) | 48 (4.4%) |
| $15,000 to $19,999 | 14 (0.4%) | 0 (0.0%) |
| $20,000 to $24,999 | 67 (1.7%) | 101 (9.3%) |
| $25,000 to $34,999 | 157 (4.0%) | 37 (3.4%) |
| $35,000 to $49,999 | 271 (7.0%) | 196 (18.1%) |
| $50,000 to $74,999 | 493 (12.7%) | 150 (13.8%) |
| $75,000 to $99,999 | 561 (14.4%) | 261 (24.1%) |
| $100,000 to $149,999 | 979 (25.1%) | 215 (19.8%) |
| $150,000 or more | 1,190 (30.5%) | 77 (7.1%) |
| Total | 3,895 (100.0%) | 1,085 (100.0%) |
Monthly Housing Cost Tiers in Heber
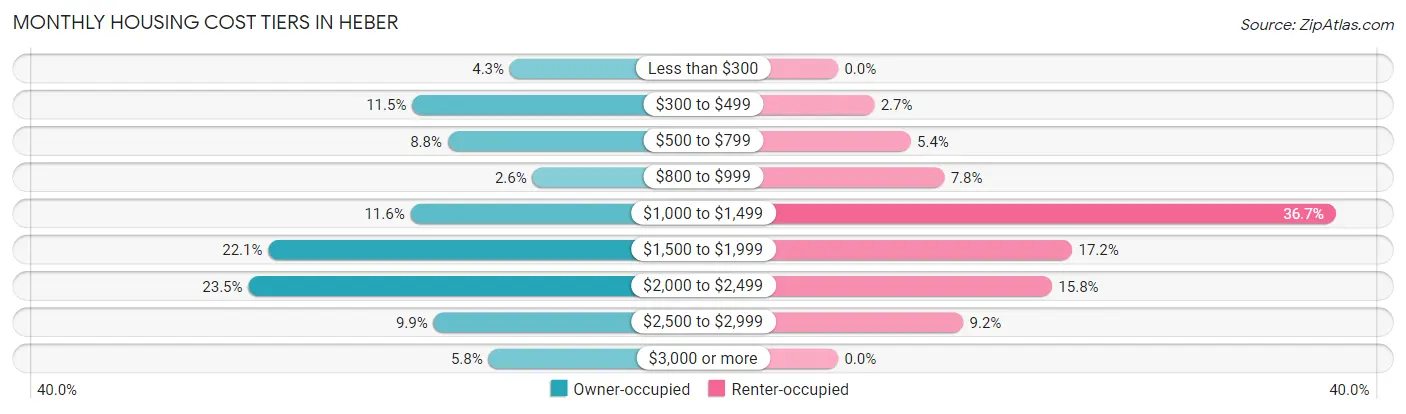
| Monthly Cost | Owner-occupied | Renter-occupied |
| Less than $300 | 166 (4.3%) | 0 (0.0%) |
| $300 to $499 | 446 (11.5%) | 29 (2.7%) |
| $500 to $799 | 344 (8.8%) | 58 (5.3%) |
| $800 to $999 | 101 (2.6%) | 85 (7.8%) |
| $1,000 to $1,499 | 451 (11.6%) | 398 (36.7%) |
| $1,500 to $1,999 | 859 (22.1%) | 187 (17.2%) |
| $2,000 to $2,499 | 916 (23.5%) | 171 (15.8%) |
| $2,500 to $2,999 | 385 (9.9%) | 100 (9.2%) |
| $3,000 or more | 227 (5.8%) | 0 (0.0%) |
| Total | 3,895 (100.0%) | 1,085 (100.0%) |
Physical Housing Characteristics in Heber
Housing Structures in Heber
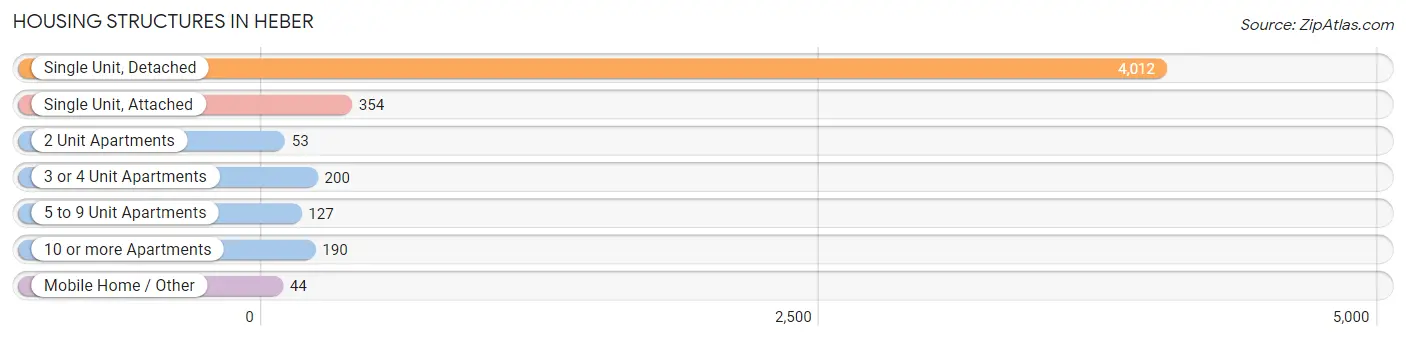
| Structure Type | # Housing Units | % Housing Units |
| Single Unit, Detached | 4,012 | 80.6% |
| Single Unit, Attached | 354 | 7.1% |
| 2 Unit Apartments | 53 | 1.1% |
| 3 or 4 Unit Apartments | 200 | 4.0% |
| 5 to 9 Unit Apartments | 127 | 2.5% |
| 10 or more Apartments | 190 | 3.8% |
| Mobile Home / Other | 44 | 0.9% |
| Total | 4,980 | 100.0% |
Housing Structures by Occupancy in Heber
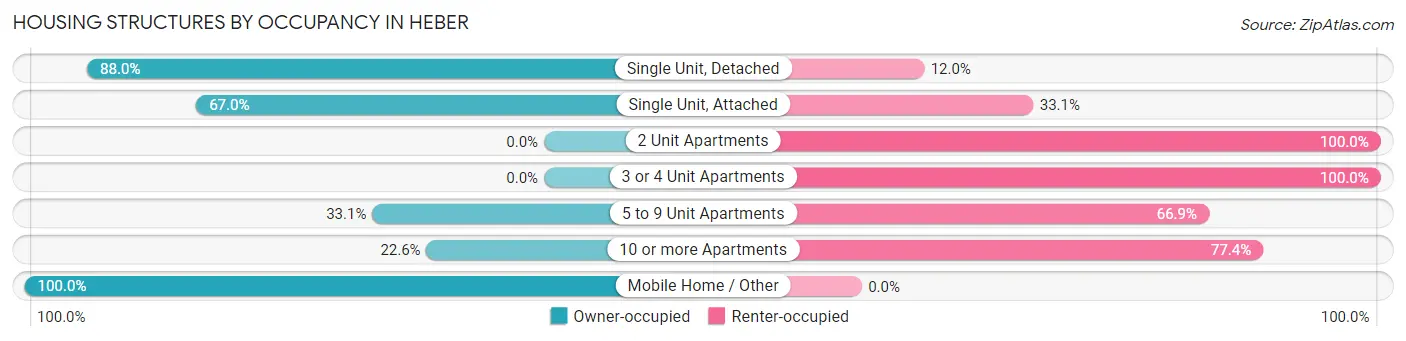
| Structure Type | Owner-occupied | Renter-occupied |
| Single Unit, Detached | 3,529 (88.0%) | 483 (12.0%) |
| Single Unit, Attached | 237 (66.9%) | 117 (33.1%) |
| 2 Unit Apartments | 0 (0.0%) | 53 (100.0%) |
| 3 or 4 Unit Apartments | 0 (0.0%) | 200 (100.0%) |
| 5 to 9 Unit Apartments | 42 (33.1%) | 85 (66.9%) |
| 10 or more Apartments | 43 (22.6%) | 147 (77.4%) |
| Mobile Home / Other | 44 (100.0%) | 0 (0.0%) |
| Total | 3,895 (78.2%) | 1,085 (21.8%) |
Housing Structures by Number of Rooms in Heber
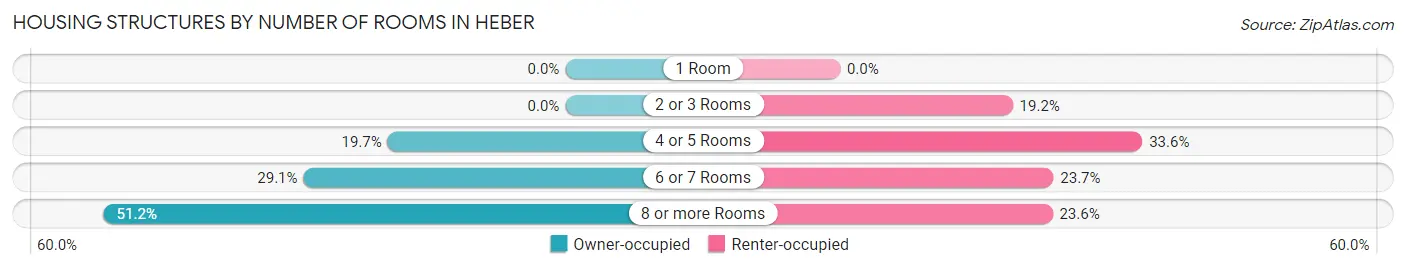
| Number of Rooms | Owner-occupied | Renter-occupied |
| 1 Room | 0 (0.0%) | 0 (0.0%) |
| 2 or 3 Rooms | 0 (0.0%) | 208 (19.2%) |
| 4 or 5 Rooms | 768 (19.7%) | 364 (33.6%) |
| 6 or 7 Rooms | 1,132 (29.1%) | 257 (23.7%) |
| 8 or more Rooms | 1,995 (51.2%) | 256 (23.6%) |
| Total | 3,895 (100.0%) | 1,085 (100.0%) |
Housing Structure by Heating Type in Heber
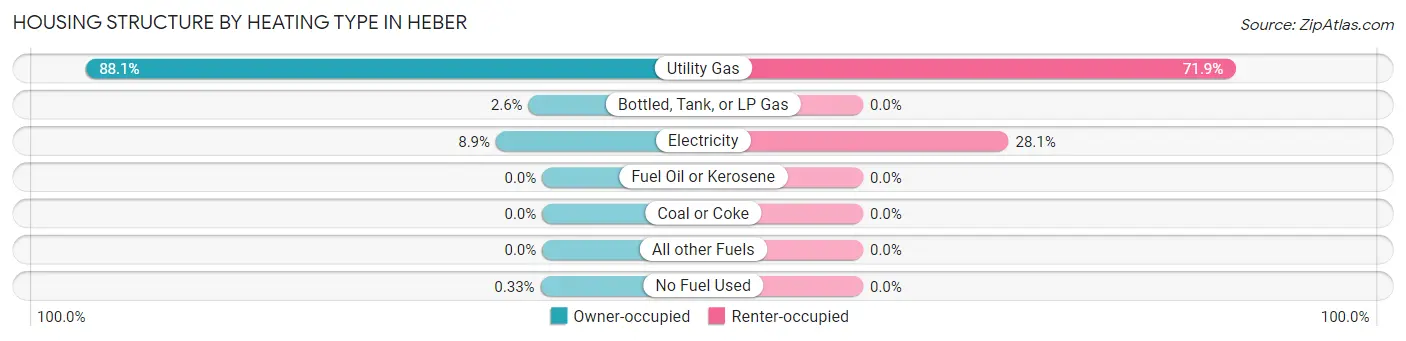
| Heating Type | Owner-occupied | Renter-occupied |
| Utility Gas | 3,431 (88.1%) | 780 (71.9%) |
| Bottled, Tank, or LP Gas | 103 (2.6%) | 0 (0.0%) |
| Electricity | 348 (8.9%) | 305 (28.1%) |
| Fuel Oil or Kerosene | 0 (0.0%) | 0 (0.0%) |
| Coal or Coke | 0 (0.0%) | 0 (0.0%) |
| All other Fuels | 0 (0.0%) | 0 (0.0%) |
| No Fuel Used | 13 (0.3%) | 0 (0.0%) |
| Total | 3,895 (100.0%) | 1,085 (100.0%) |
Household Vehicle Usage in Heber
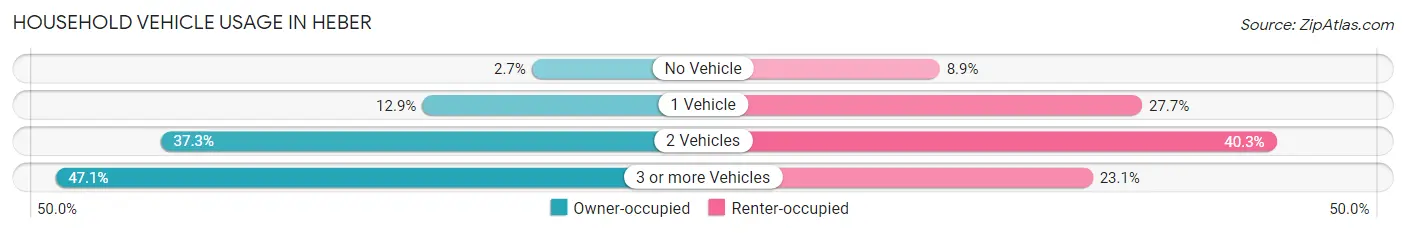
| Vehicles per Household | Owner-occupied | Renter-occupied |
| No Vehicle | 104 (2.7%) | 96 (8.8%) |
| 1 Vehicle | 502 (12.9%) | 301 (27.7%) |
| 2 Vehicles | 1,453 (37.3%) | 437 (40.3%) |
| 3 or more Vehicles | 1,836 (47.1%) | 251 (23.1%) |
| Total | 3,895 (100.0%) | 1,085 (100.0%) |
Real Estate & Mortgages in Heber
Real Estate and Mortgage Overview in Heber
| Characteristic | Without Mortgage | With Mortgage |
| Housing Units | 1,061 | 2,834 |
| Median Property Value | $413,100 | $517,000 |
| Median Household Income | $91,750 | $901 |
| Monthly Housing Costs | $477 | $227 |
| Real Estate Taxes | $2,290 | $127 |
Property Value by Mortgage Status in Heber
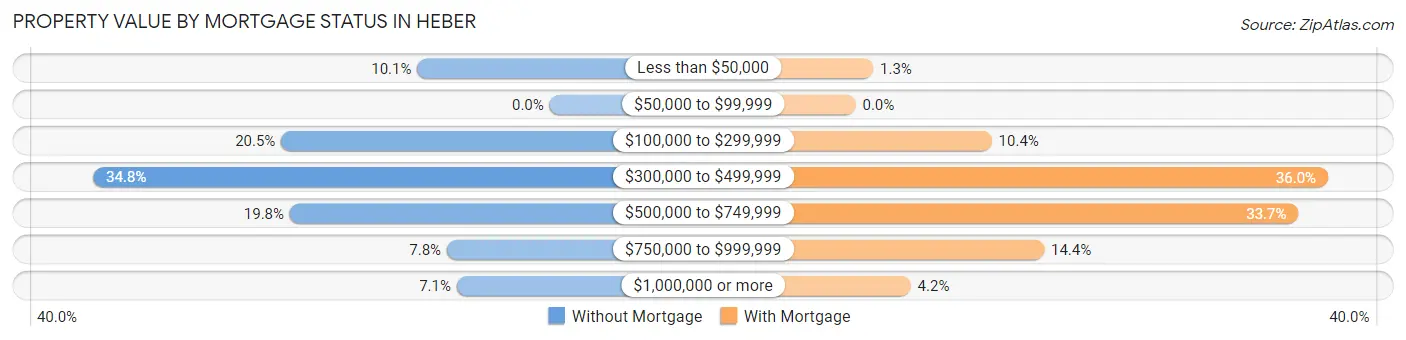
| Property Value | Without Mortgage | With Mortgage |
| Less than $50,000 | 107 (10.1%) | 38 (1.3%) |
| $50,000 to $99,999 | 0 (0.0%) | 0 (0.0%) |
| $100,000 to $299,999 | 217 (20.4%) | 294 (10.4%) |
| $300,000 to $499,999 | 369 (34.8%) | 1,020 (36.0%) |
| $500,000 to $749,999 | 210 (19.8%) | 956 (33.7%) |
| $750,000 to $999,999 | 83 (7.8%) | 407 (14.4%) |
| $1,000,000 or more | 75 (7.1%) | 119 (4.2%) |
| Total | 1,061 (100.0%) | 2,834 (100.0%) |
Household Income by Mortgage Status in Heber
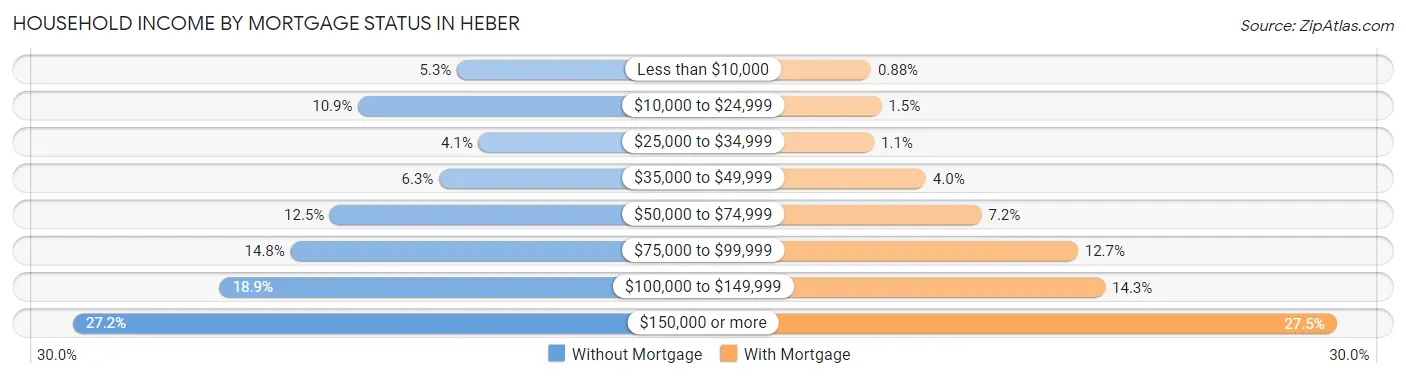
| Household Income | Without Mortgage | With Mortgage |
| Less than $10,000 | 56 (5.3%) | 25 (0.9%) |
| $10,000 to $24,999 | 116 (10.9%) | 42 (1.5%) |
| $25,000 to $34,999 | 43 (4.1%) | 30 (1.1%) |
| $35,000 to $49,999 | 67 (6.3%) | 114 (4.0%) |
| $50,000 to $74,999 | 133 (12.5%) | 204 (7.2%) |
| $75,000 to $99,999 | 157 (14.8%) | 360 (12.7%) |
| $100,000 to $149,999 | 200 (18.9%) | 404 (14.3%) |
| $150,000 or more | 289 (27.2%) | 779 (27.5%) |
| Total | 1,061 (100.0%) | 2,834 (100.0%) |
Property Value to Household Income Ratio in Heber
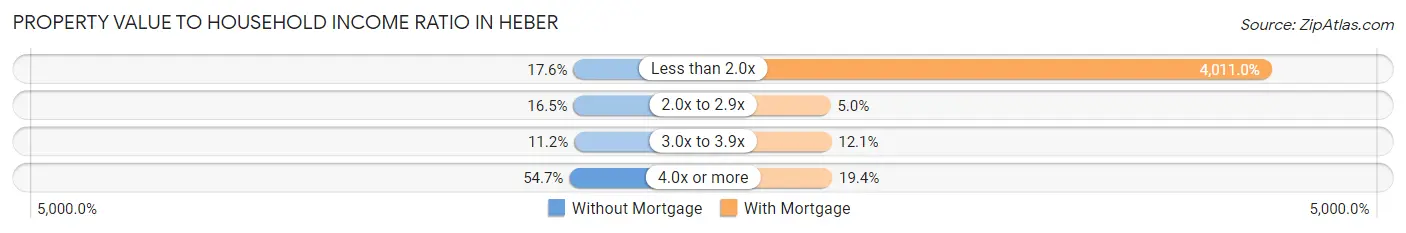
| Value-to-Income Ratio | Without Mortgage | With Mortgage |
| Less than 2.0x | 187 (17.6%) | 113,673 (4,011.0%) |
| 2.0x to 2.9x | 175 (16.5%) | 142 (5.0%) |
| 3.0x to 3.9x | 119 (11.2%) | 343 (12.1%) |
| 4.0x or more | 580 (54.7%) | 551 (19.4%) |
| Total | 1,061 (100.0%) | 2,834 (100.0%) |
Real Estate Taxes by Mortgage Status in Heber
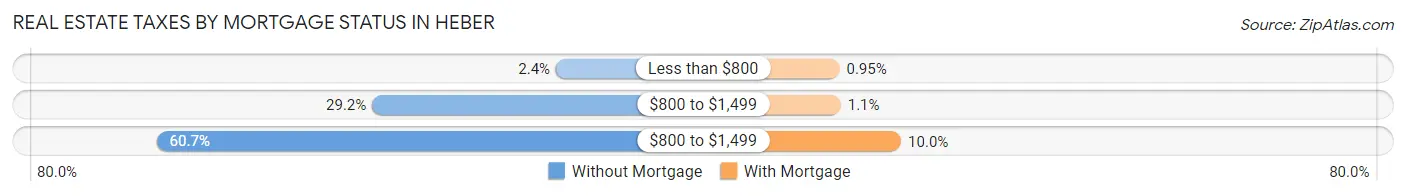
| Property Taxes | Without Mortgage | With Mortgage |
| Less than $800 | 25 (2.4%) | 27 (0.9%) |
| $800 to $1,499 | 310 (29.2%) | 32 (1.1%) |
| $800 to $1,499 | 644 (60.7%) | 282 (10.0%) |
| Total | 1,061 (100.0%) | 2,834 (100.0%) |
Health & Disability in Heber
Health Insurance Coverage by Age in Heber
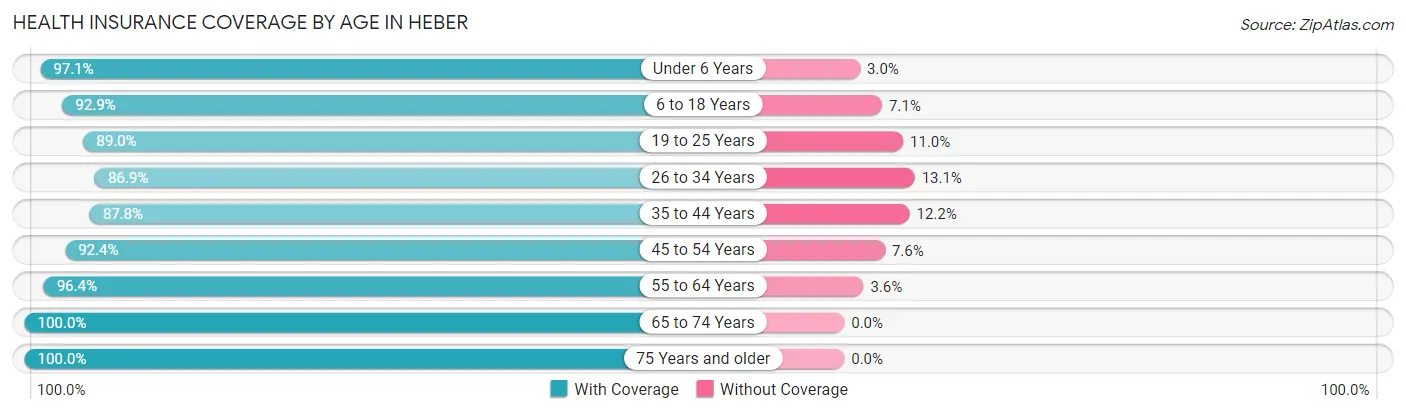
| Age Bracket | With Coverage | Without Coverage |
| Under 6 Years | 1,545 (97.1%) | 47 (2.9%) |
| 6 to 18 Years | 4,108 (92.9%) | 312 (7.1%) |
| 19 to 25 Years | 1,591 (89.0%) | 196 (11.0%) |
| 26 to 34 Years | 1,693 (86.9%) | 256 (13.1%) |
| 35 to 44 Years | 2,173 (87.8%) | 301 (12.2%) |
| 45 to 54 Years | 1,865 (92.4%) | 153 (7.6%) |
| 55 to 64 Years | 1,213 (96.4%) | 45 (3.6%) |
| 65 to 74 Years | 847 (100.0%) | 0 (0.0%) |
| 75 Years and older | 398 (100.0%) | 0 (0.0%) |
| Total | 15,433 (92.2%) | 1,310 (7.8%) |
Health Insurance Coverage by Citizenship Status in Heber
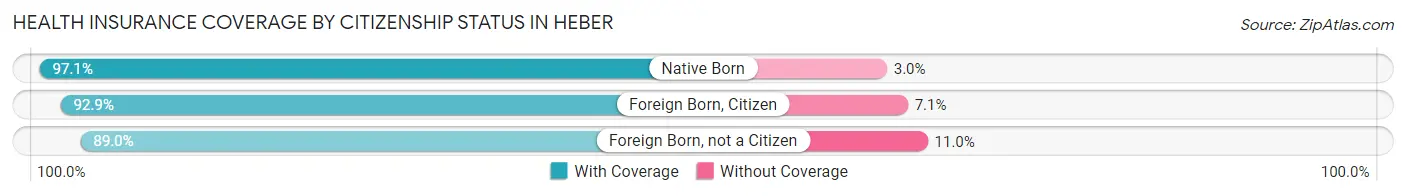
| Citizenship Status | With Coverage | Without Coverage |
| Native Born | 1,545 (97.1%) | 47 (2.9%) |
| Foreign Born, Citizen | 4,108 (92.9%) | 312 (7.1%) |
| Foreign Born, not a Citizen | 1,591 (89.0%) | 196 (11.0%) |
Health Insurance Coverage by Household Income in Heber
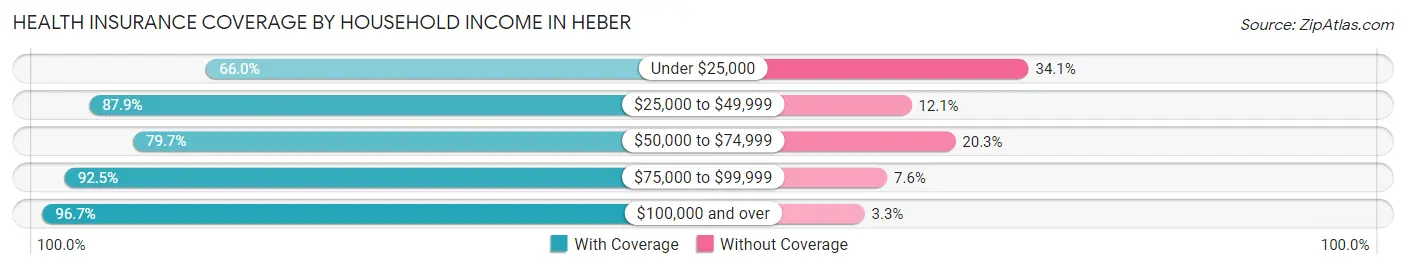
| Household Income | With Coverage | Without Coverage |
| Under $25,000 | 430 (65.9%) | 222 (34.1%) |
| $25,000 to $49,999 | 1,110 (87.9%) | 153 (12.1%) |
| $50,000 to $74,999 | 1,465 (79.7%) | 374 (20.3%) |
| $75,000 to $99,999 | 2,827 (92.4%) | 231 (7.5%) |
| $100,000 and over | 9,561 (96.7%) | 330 (3.3%) |
Public vs Private Health Insurance Coverage by Age in Heber
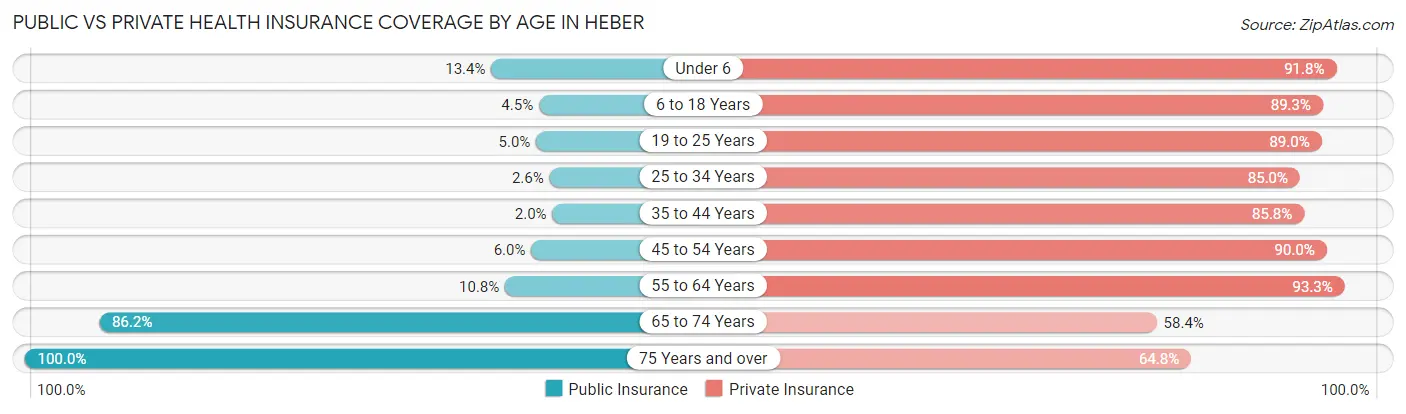
| Age Bracket | Public Insurance | Private Insurance |
| Under 6 | 213 (13.4%) | 1,461 (91.8%) |
| 6 to 18 Years | 200 (4.5%) | 3,946 (89.3%) |
| 19 to 25 Years | 90 (5.0%) | 1,591 (89.0%) |
| 25 to 34 Years | 50 (2.6%) | 1,657 (85.0%) |
| 35 to 44 Years | 50 (2.0%) | 2,123 (85.8%) |
| 45 to 54 Years | 120 (5.9%) | 1,816 (90.0%) |
| 55 to 64 Years | 136 (10.8%) | 1,174 (93.3%) |
| 65 to 74 Years | 730 (86.2%) | 495 (58.4%) |
| 75 Years and over | 398 (100.0%) | 258 (64.8%) |
| Total | 1,987 (11.9%) | 14,521 (86.7%) |
Disability Status by Sex by Age in Heber
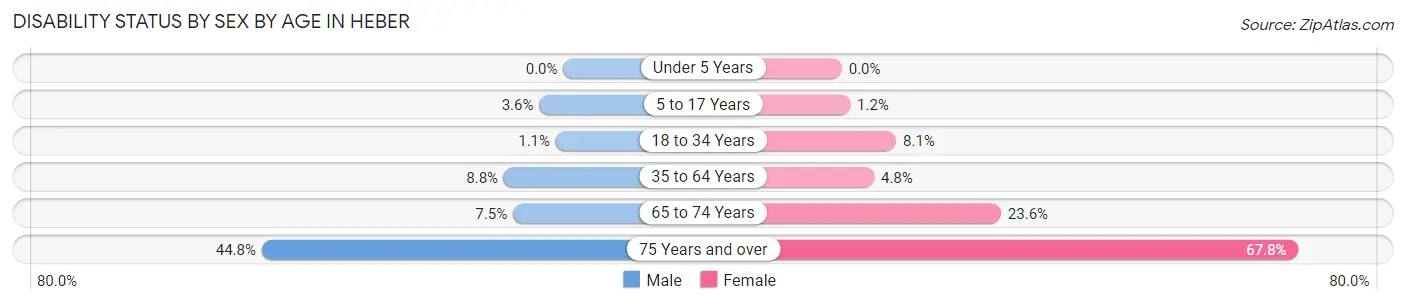
| Age Bracket | Male | Female |
| Under 5 Years | 0 (0.0%) | 0 (0.0%) |
| 5 to 17 Years | 70 (3.6%) | 27 (1.2%) |
| 18 to 34 Years | 23 (1.1%) | 172 (8.1%) |
| 35 to 64 Years | 268 (8.8%) | 130 (4.8%) |
| 65 to 74 Years | 32 (7.5%) | 99 (23.6%) |
| 75 Years and over | 60 (44.8%) | 179 (67.8%) |
Disability Class by Sex by Age in Heber
Disability Class: Hearing Difficulty
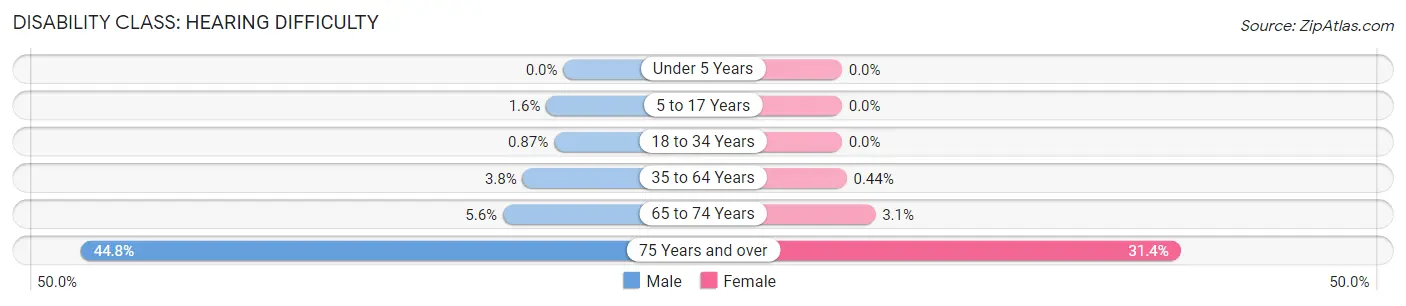
| Age Bracket | Male | Female |
| Under 5 Years | 0 (0.0%) | 0 (0.0%) |
| 5 to 17 Years | 31 (1.6%) | 0 (0.0%) |
| 18 to 34 Years | 18 (0.9%) | 0 (0.0%) |
| 35 to 64 Years | 115 (3.8%) | 12 (0.4%) |
| 65 to 74 Years | 24 (5.6%) | 13 (3.1%) |
| 75 Years and over | 60 (44.8%) | 83 (31.4%) |
Disability Class: Vision Difficulty
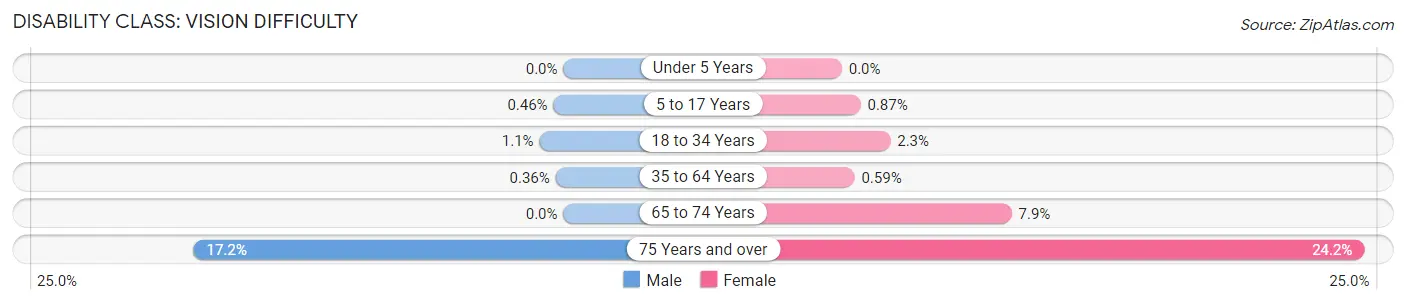
| Age Bracket | Male | Female |
| Under 5 Years | 0 (0.0%) | 0 (0.0%) |
| 5 to 17 Years | 9 (0.5%) | 19 (0.9%) |
| 18 to 34 Years | 23 (1.1%) | 48 (2.2%) |
| 35 to 64 Years | 11 (0.4%) | 16 (0.6%) |
| 65 to 74 Years | 0 (0.0%) | 33 (7.9%) |
| 75 Years and over | 23 (17.2%) | 64 (24.2%) |
Disability Class: Cognitive Difficulty
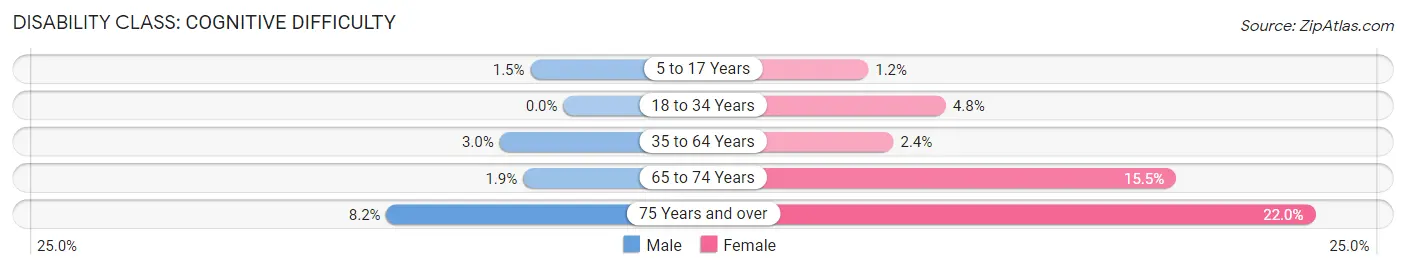
| Age Bracket | Male | Female |
| 5 to 17 Years | 30 (1.5%) | 27 (1.2%) |
| 18 to 34 Years | 0 (0.0%) | 103 (4.8%) |
| 35 to 64 Years | 90 (3.0%) | 65 (2.4%) |
| 65 to 74 Years | 8 (1.9%) | 65 (15.5%) |
| 75 Years and over | 11 (8.2%) | 58 (22.0%) |
Disability Class: Ambulatory Difficulty
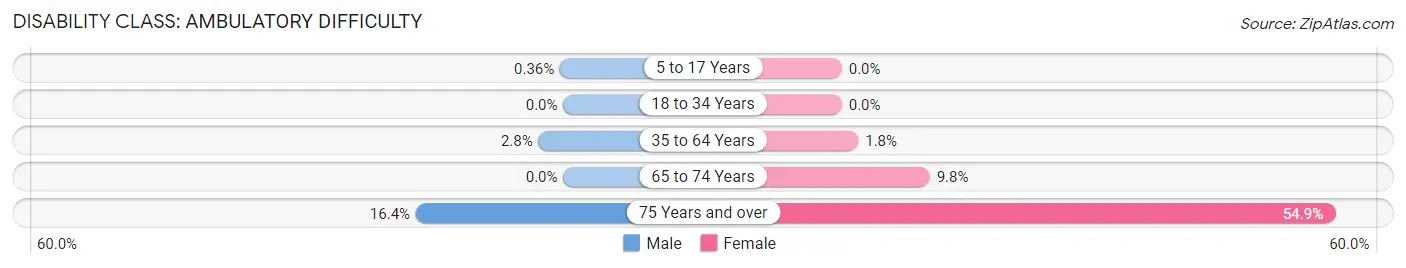
| Age Bracket | Male | Female |
| 5 to 17 Years | 7 (0.4%) | 0 (0.0%) |
| 18 to 34 Years | 0 (0.0%) | 0 (0.0%) |
| 35 to 64 Years | 84 (2.8%) | 50 (1.8%) |
| 65 to 74 Years | 0 (0.0%) | 41 (9.8%) |
| 75 Years and over | 22 (16.4%) | 145 (54.9%) |
Disability Class: Self-Care Difficulty
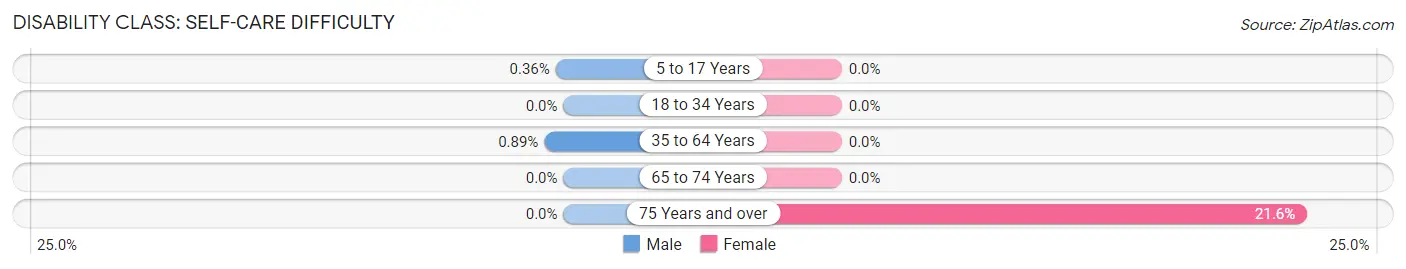
| Age Bracket | Male | Female |
| 5 to 17 Years | 7 (0.4%) | 0 (0.0%) |
| 18 to 34 Years | 0 (0.0%) | 0 (0.0%) |
| 35 to 64 Years | 27 (0.9%) | 0 (0.0%) |
| 65 to 74 Years | 0 (0.0%) | 0 (0.0%) |
| 75 Years and over | 0 (0.0%) | 57 (21.6%) |
Technology Access in Heber
Computing Device Access in Heber
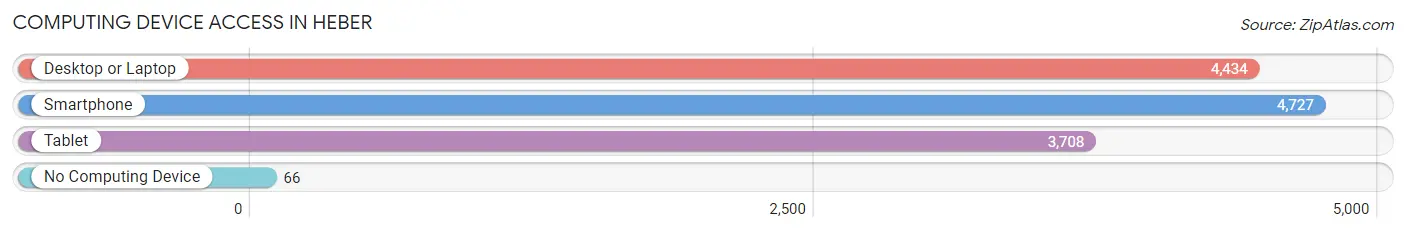
| Device Type | # Households | % Households |
| Desktop or Laptop | 4,434 | 89.0% |
| Smartphone | 4,727 | 94.9% |
| Tablet | 3,708 | 74.5% |
| No Computing Device | 66 | 1.3% |
| Total | 4,980 | 100.0% |
Internet Access in Heber
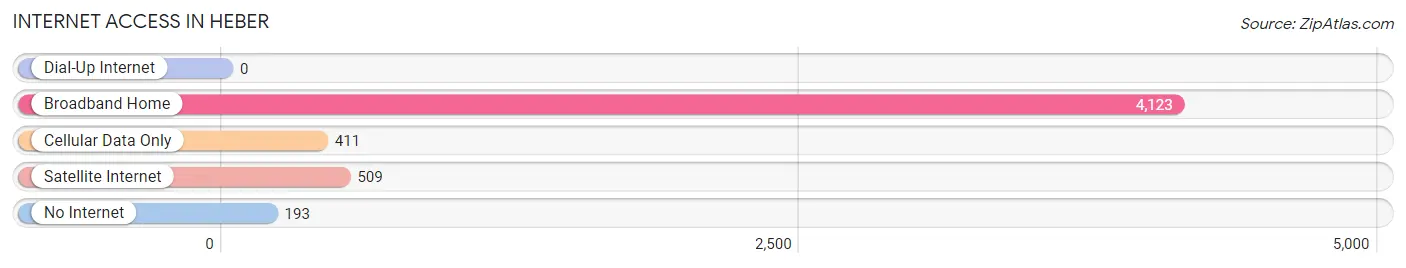
| Internet Type | # Households | % Households |
| Dial-Up Internet | 0 | 0.0% |
| Broadband Home | 4,123 | 82.8% |
| Cellular Data Only | 411 | 8.3% |
| Satellite Internet | 509 | 10.2% |
| No Internet | 193 | 3.9% |
| Total | 4,980 | 100.0% |
Heber Summary
Heber City is a city located in Wasatch County, Utah, United States. It is located in the Heber Valley, about 30 miles southeast of Salt Lake City. The population was 11,362 at the 2010 census, and was estimated to be 12,876 in 2019. Heber City is known for its outdoor recreation opportunities, including fishing, hunting, camping, and skiing.
Geography
Heber City is located in the Heber Valley, at the junction of the Provo and Weber Rivers. The city is situated at an elevation of 5,908 feet (1,800 m). The city is bordered by the Uinta National Forest to the east, the Wasatch Mountains to the west, and the Wasatch Plateau to the south.
Heber City covers an area of 11.3 square miles (29.3 km2). The city is located in the Wasatch Front region of Utah, and is part of the Provo-Orem Metropolitan Statistical Area.
Climate
Heber City has a humid continental climate, with cold, snowy winters and hot, dry summers. The average annual temperature is 43.2 °F (6.2 °C). The average annual precipitation is 17.3 inches (440 mm).
Demographics
As of the 2010 census, there were 11,362 people, 3,845 households, and 2,945 families residing in the city. The population density was 1,006.3 people per square mile (389.2/km2). There were 4,093 housing units at an average density of 361.7 per square mile (140.1/km2). The racial makeup of the city was 91.2% White, 0.4% African American, 0.5% Native American, 0.7% Asian, 0.1% Pacific Islander, 5.2% from other races, and 2.0% from two or more races. Hispanic or Latino of any race were 11.2% of the population.
Economy
Heber City is home to several businesses, including a number of restaurants, retail stores, and service providers. The city is also home to several manufacturing companies, including a plastics manufacturer, a metal fabrication company, and a food processing plant. The city is also home to a number of agricultural operations, including dairy farms, beef cattle ranches, and hay farms.
The city is served by the Heber Valley Railroad, which provides freight and passenger service to the surrounding area. The city is also served by the Heber Valley Airport, which provides general aviation services.
Education
Heber City is served by the Wasatch County School District. The district operates four elementary schools, two middle schools, and one high school. The city is also home to a branch of the Utah Valley University.
Conclusion
Heber City is a city located in Wasatch County, Utah, United States. It is located in the Heber Valley, about 30 miles southeast of Salt Lake City. The population was 11,362 at the 2010 census, and was estimated to be 12,876 in 2019. Heber City is known for its outdoor recreation opportunities, including fishing, hunting, camping, and skiing. The city is served by the Heber Valley Railroad, the Heber Valley Airport, and the Wasatch County School District. The city is home to several businesses, including restaurants, retail stores, and service providers. Heber City is also home to several manufacturing companies, agricultural operations, and a branch of the Utah Valley University.
Common Questions
What is the Total Population of Heber?
Total Population of Heber is 16,943.
What is the Total Male Population of Heber?
Total Male Population of Heber is 8,506.
What is the Total Female Population of Heber?
Total Female Population of Heber is 8,437.
What is the Ratio of Males per 100 Females in Heber?
There are 100.82 Males per 100 Females in Heber.
What is the Ratio of Females per 100 Males in Heber?
There are 99.19 Females per 100 Males in Heber.
What is the Median Population Age in Heber?
Median Population Age in Heber is 28.7 Years.
What is the Average Family Size in Heber
Average Family Size in Heber is 3.9 People.
What is the Average Household Size in Heber
Average Household Size in Heber is 3.4 People.
What is Per Capita Income in Heber?
Per Capita income in Heber is $35,858.
What is the Median Family Income in Heber?
Median Family Income in Heber is $104,537.
What is the Median Household income in Heber?
Median Household Income in Heber is $98,934.
What is Income or Wage Gap in Heber?
Income or Wage Gap in Heber is 51.4%.
Women in Heber earn 48.6 cents for every dollar earned by a man.
What is Inequality or Gini Index in Heber?
Inequality or Gini Index in Heber is 0.38.
How Large is the Labor Force in Heber?
There are 9,056 People in the Labor Forcein in Heber.
What is the Percentage of People in the Labor Force in Heber?
74.8% of People are in the Labor Force in Heber.
What is the Unemployment Rate in Heber?
Unemployment Rate in Heber is 2.9%.