Cedar Hills, UT
Cedar Hills Map
Cedar Hills Overview
9,977
TOTAL POPULATION
5,003
MALE POPULATION
4,974
FEMALE POPULATION
100.58
MALES / 100 FEMALES
99.42
FEMALES / 100 MALES
24.9
MEDIAN AGE
4.3
AVG FAMILY SIZE
4.0
AVG HOUSEHOLD SIZE
$37,410
PER CAPITA INCOME
$133,555
AVG FAMILY INCOME
$130,847
AVG HOUSEHOLD INCOME
70.6%
WAGE / INCOME GAP [ % ]
29.4¢/ $1
WAGE / INCOME GAP [ $ ]
$11,189
FAMILY INCOME DEFICIT
0.38
INEQUALITY / GINI INDEX
4,398
LABOR FORCE [ PEOPLE ]
65.0%
PERCENT IN LABOR FORCE
2.8%
UNEMPLOYMENT RATE
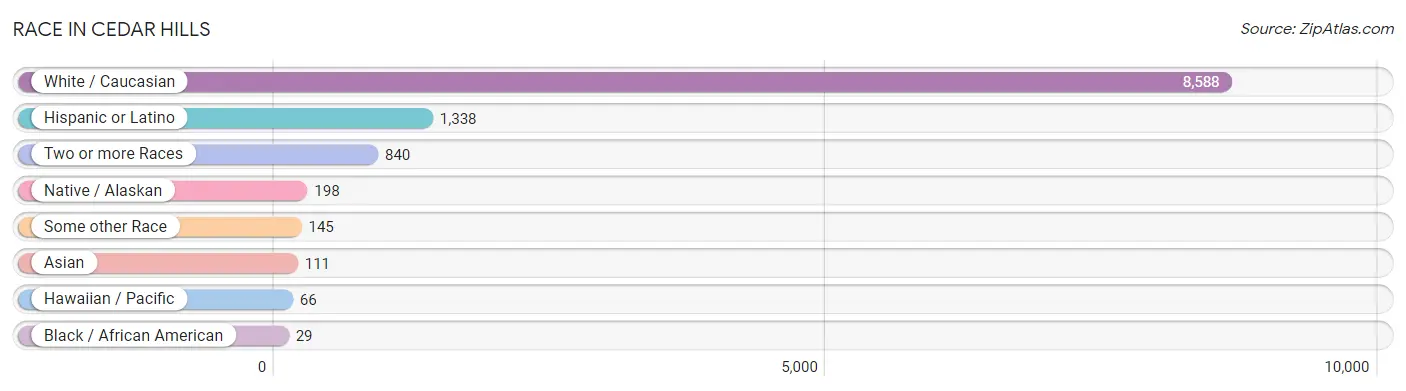
Race in Cedar Hills
The most populous races in Cedar Hills are White / Caucasian (8,588 | 86.1%), Hispanic or Latino (1,338 | 13.4%), and Two or more Races (840 | 8.4%).
| Race | # Population | % Population |
| Asian | 111 | 1.1% |
| Black / African American | 29 | 0.3% |
| Hawaiian / Pacific | 66 | 0.7% |
| Hispanic or Latino | 1,338 | 13.4% |
| Native / Alaskan | 198 | 2.0% |
| White / Caucasian | 8,588 | 86.1% |
| Two or more Races | 840 | 8.4% |
| Some other Race | 145 | 1.5% |
| Total | 9,977 | 100.0% |
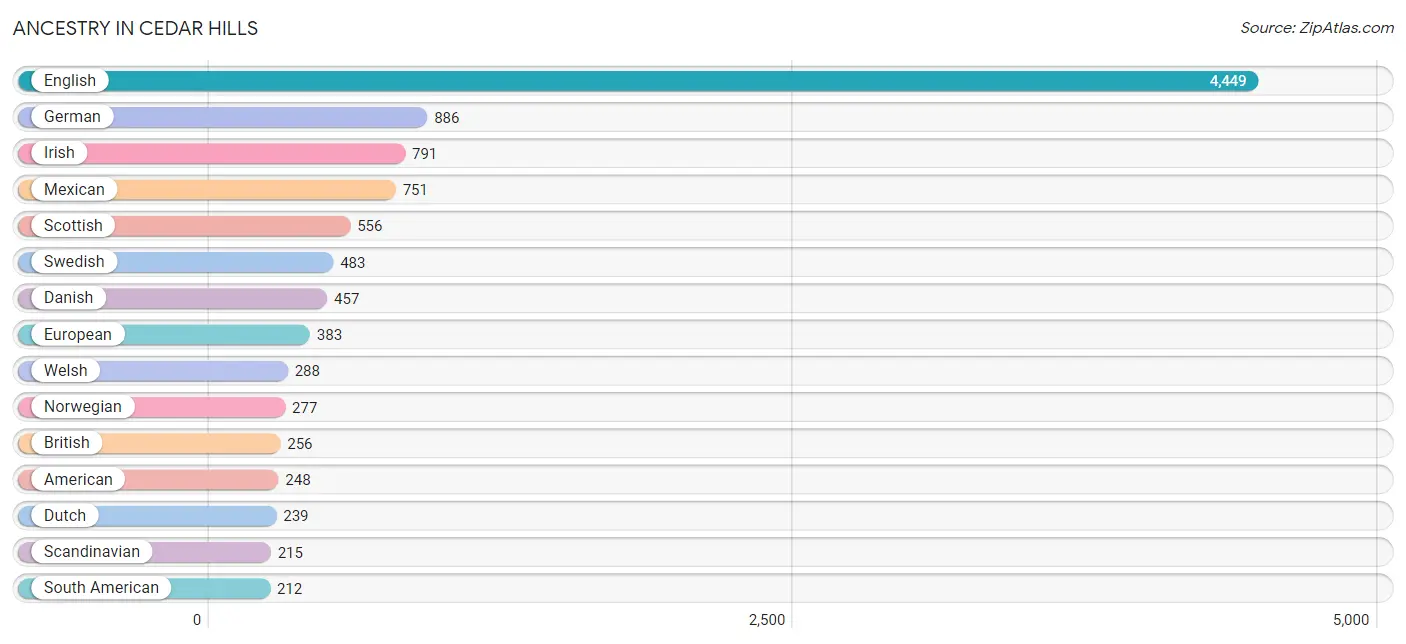
Ancestry in Cedar Hills
The most populous ancestries reported in Cedar Hills are English (4,449 | 44.6%), German (886 | 8.9%), Irish (791 | 7.9%), Mexican (751 | 7.5%), and Scottish (556 | 5.6%), together accounting for 74.5% of all Cedar Hills residents.
| Ancestry | # Population | % Population |
| American | 248 | 2.5% |
| Argentinean | 62 | 0.6% |
| Australian | 16 | 0.2% |
| Belgian | 10 | 0.1% |
| Bhutanese | 67 | 0.7% |
| British | 256 | 2.6% |
| Burmese | 36 | 0.4% |
| Canadian | 91 | 0.9% |
| Central American | 62 | 0.6% |
| Cherokee | 67 | 0.7% |
| Croatian | 26 | 0.3% |
| Czech | 6 | 0.1% |
| Czechoslovakian | 21 | 0.2% |
| Danish | 457 | 4.6% |
| Dominican | 152 | 1.5% |
| Dutch | 239 | 2.4% |
| Ecuadorian | 16 | 0.2% |
| English | 4,449 | 44.6% |
| European | 383 | 3.8% |
| Finnish | 109 | 1.1% |
| French | 106 | 1.1% |
| German | 886 | 8.9% |
| Greek | 72 | 0.7% |
| Icelander | 78 | 0.8% |
| Indian (Asian) | 39 | 0.4% |
| Irish | 791 | 7.9% |
| Iroquois | 20 | 0.2% |
| Italian | 153 | 1.5% |
| Korean | 44 | 0.4% |
| Lithuanian | 30 | 0.3% |
| Mexican | 751 | 7.5% |
| Navajo | 198 | 2.0% |
| Nigerian | 21 | 0.2% |
| Northern European | 72 | 0.7% |
| Norwegian | 277 | 2.8% |
| Pakistani | 6 | 0.1% |
| Peruvian | 123 | 1.2% |
| Polish | 70 | 0.7% |
| Puerto Rican | 13 | 0.1% |
| Russian | 24 | 0.2% |
| Salvadoran | 62 | 0.6% |
| Scandinavian | 215 | 2.1% |
| Scotch-Irish | 75 | 0.7% |
| Scottish | 556 | 5.6% |
| Serbian | 10 | 0.1% |
| Sioux | 14 | 0.1% |
| Slavic | 6 | 0.1% |
| South African | 10 | 0.1% |
| South American | 212 | 2.1% |
| South American Indian | 111 | 1.1% |
| Spaniard | 148 | 1.5% |
| Sri Lankan | 42 | 0.4% |
| Subsaharan African | 31 | 0.3% |
| Swedish | 483 | 4.8% |
| Swiss | 64 | 0.6% |
| Tongan | 66 | 0.7% |
| Ukrainian | 7 | 0.1% |
| Welsh | 288 | 2.9% | View All 58 Rows |
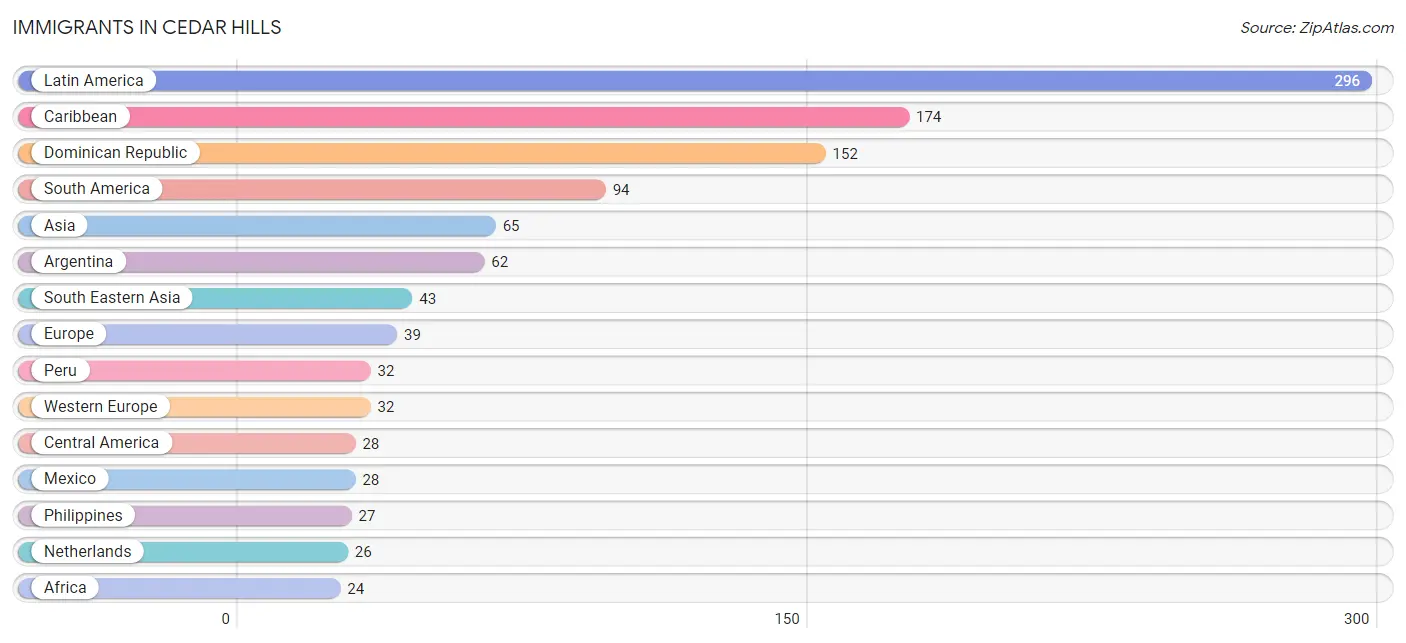
Immigrants in Cedar Hills
The most numerous immigrant groups reported in Cedar Hills came from Latin America (296 | 3.0%), Caribbean (174 | 1.7%), Dominican Republic (152 | 1.5%), South America (94 | 0.9%), and Asia (65 | 0.6%), together accounting for 7.8% of all Cedar Hills residents.
| Immigration Origin | # Population | % Population |
| Africa | 24 | 0.2% |
| Argentina | 62 | 0.6% |
| Asia | 65 | 0.6% |
| Canada | 20 | 0.2% |
| Caribbean | 174 | 1.7% |
| Central America | 28 | 0.3% |
| China | 9 | 0.1% |
| Dominican Republic | 152 | 1.5% |
| Eastern Africa | 12 | 0.1% |
| Eastern Asia | 22 | 0.2% |
| Europe | 39 | 0.4% |
| Germany | 6 | 0.1% |
| Japan | 13 | 0.1% |
| Latin America | 296 | 3.0% |
| Mexico | 28 | 0.3% |
| Netherlands | 26 | 0.3% |
| Northern Europe | 7 | 0.1% |
| Peru | 32 | 0.3% |
| Philippines | 27 | 0.3% |
| South Africa | 12 | 0.1% |
| South America | 94 | 0.9% |
| South Eastern Asia | 43 | 0.4% |
| Sweden | 7 | 0.1% |
| Taiwan | 9 | 0.1% |
| Thailand | 6 | 0.1% |
| Vietnam | 10 | 0.1% |
| Western Europe | 32 | 0.3% |
| Zimbabwe | 12 | 0.1% | View All 28 Rows |
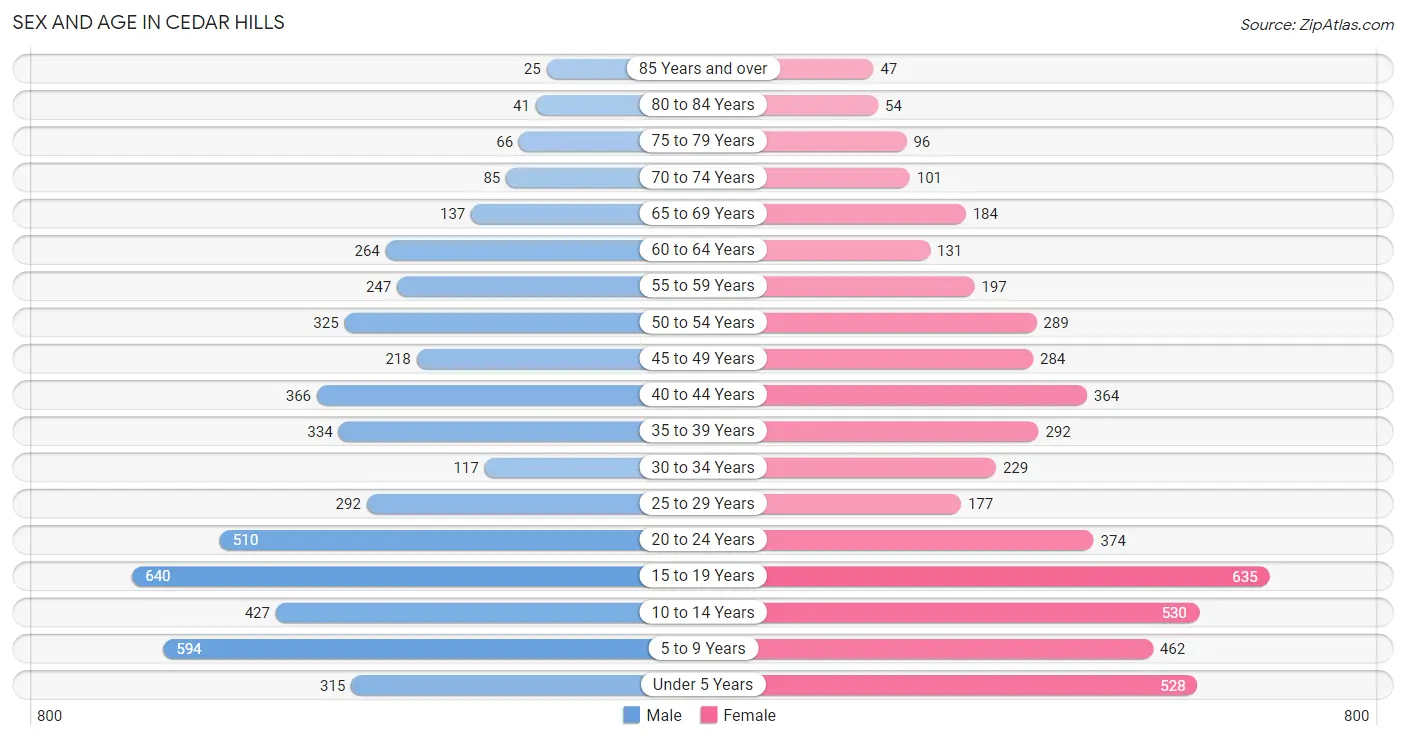
Sex and Age in Cedar Hills
Sex and Age in Cedar Hills
The most populous age groups in Cedar Hills are 15 to 19 Years (640 | 12.8%) for men and 15 to 19 Years (635 | 12.8%) for women.
| Age Bracket | Male | Female |
| Under 5 Years | 315 (6.3%) | 528 (10.6%) |
| 5 to 9 Years | 594 (11.9%) | 462 (9.3%) |
| 10 to 14 Years | 427 (8.5%) | 530 (10.7%) |
| 15 to 19 Years | 640 (12.8%) | 635 (12.8%) |
| 20 to 24 Years | 510 (10.2%) | 374 (7.5%) |
| 25 to 29 Years | 292 (5.8%) | 177 (3.6%) |
| 30 to 34 Years | 117 (2.3%) | 229 (4.6%) |
| 35 to 39 Years | 334 (6.7%) | 292 (5.9%) |
| 40 to 44 Years | 366 (7.3%) | 364 (7.3%) |
| 45 to 49 Years | 218 (4.4%) | 284 (5.7%) |
| 50 to 54 Years | 325 (6.5%) | 289 (5.8%) |
| 55 to 59 Years | 247 (4.9%) | 197 (4.0%) |
| 60 to 64 Years | 264 (5.3%) | 131 (2.6%) |
| 65 to 69 Years | 137 (2.7%) | 184 (3.7%) |
| 70 to 74 Years | 85 (1.7%) | 101 (2.0%) |
| 75 to 79 Years | 66 (1.3%) | 96 (1.9%) |
| 80 to 84 Years | 41 (0.8%) | 54 (1.1%) |
| 85 Years and over | 25 (0.5%) | 47 (0.9%) |
| Total | 5,003 (100.0%) | 4,974 (100.0%) |
Families and Households in Cedar Hills
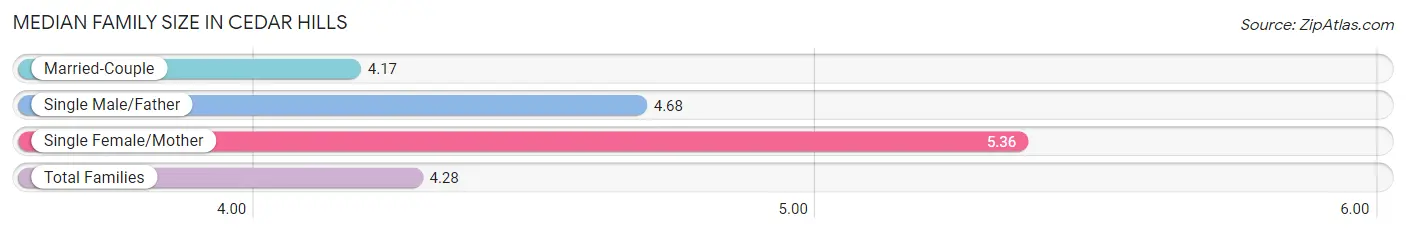
Median Family Size in Cedar Hills
The median family size in Cedar Hills is 4.28 persons per family, with single female/mother families (162 | 7.2%) accounting for the largest median family size of 5.36 persons per family. On the other hand, married-couple families (2,013 | 89.3%) represent the smallest median family size with 4.17 persons per family.
| Family Type | # Families | Family Size |
| Married-Couple | 2,013 (89.3%) | 4.17 |
| Single Male/Father | 78 (3.5%) | 4.68 |
| Single Female/Mother | 162 (7.2%) | 5.36 |
| Total Families | 2,253 (100.0%) | 4.28 |
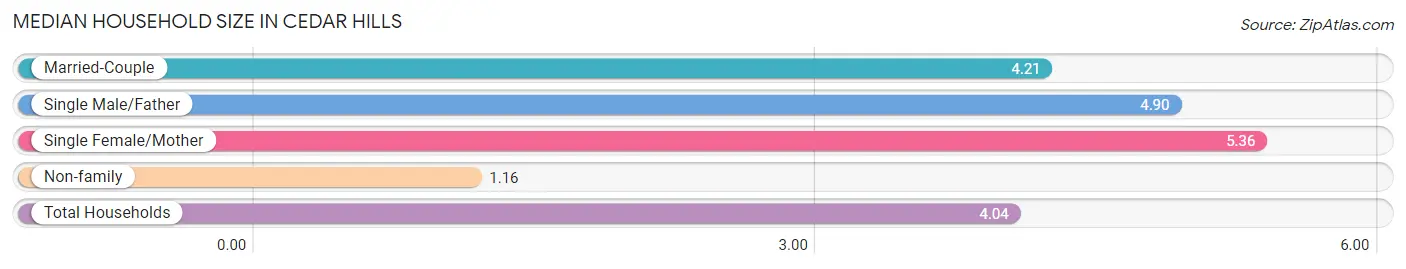
Median Household Size in Cedar Hills
The median household size in Cedar Hills is 4.04 persons per household, with single female/mother households (162 | 6.6%) accounting for the largest median household size of 5.36 persons per household. non-family households (214 | 8.7%) represent the smallest median household size with 1.16 persons per household.
| Household Type | # Households | Household Size |
| Married-Couple | 2,013 (81.6%) | 4.21 |
| Single Male/Father | 78 (3.2%) | 4.90 |
| Single Female/Mother | 162 (6.6%) | 5.36 |
| Non-family | 214 (8.7%) | 1.16 |
| Total Households | 2,467 (100.0%) | 4.04 |
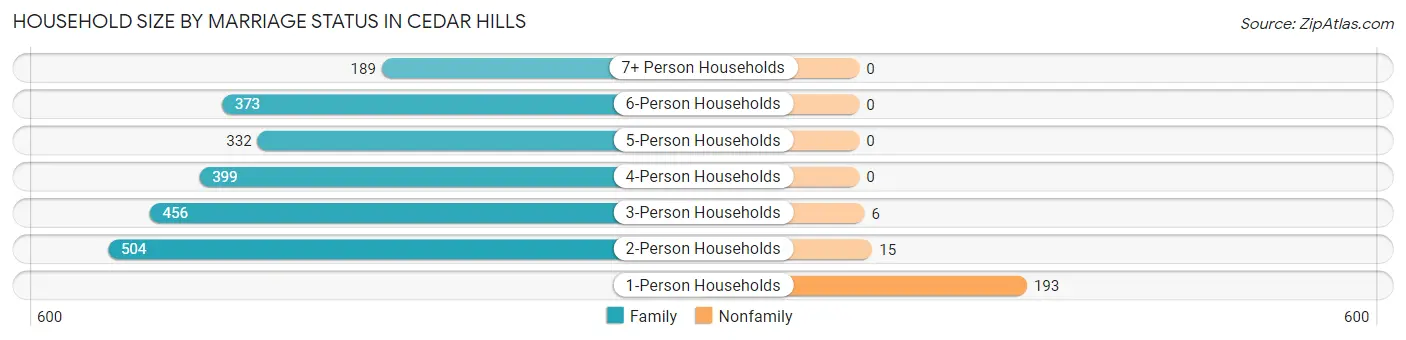
Household Size by Marriage Status in Cedar Hills
Out of a total of 2,467 households in Cedar Hills, 2,253 (91.3%) are family households, while 214 (8.7%) are nonfamily households. The most numerous type of family households are 2-person households, comprising 504, and the most common type of nonfamily households are 1-person households, comprising 193.
| Household Size | Family Households | Nonfamily Households |
| 1-Person Households | - | 193 (7.8%) |
| 2-Person Households | 504 (20.4%) | 15 (0.6%) |
| 3-Person Households | 456 (18.5%) | 6 (0.2%) |
| 4-Person Households | 399 (16.2%) | 0 (0.0%) |
| 5-Person Households | 332 (13.5%) | 0 (0.0%) |
| 6-Person Households | 373 (15.1%) | 0 (0.0%) |
| 7+ Person Households | 189 (7.7%) | 0 (0.0%) |
| Total | 2,253 (91.3%) | 214 (8.7%) |
Female Fertility in Cedar Hills
Fertility by Age in Cedar Hills
Average fertility rate in Cedar Hills is 78.0 births per 1,000 women. Women in the age bracket of 20 to 34 years have the highest fertility rate with 212.0 births per 1,000 women. Women in the age bracket of 20 to 34 years acount for 87.3% of all women with births.
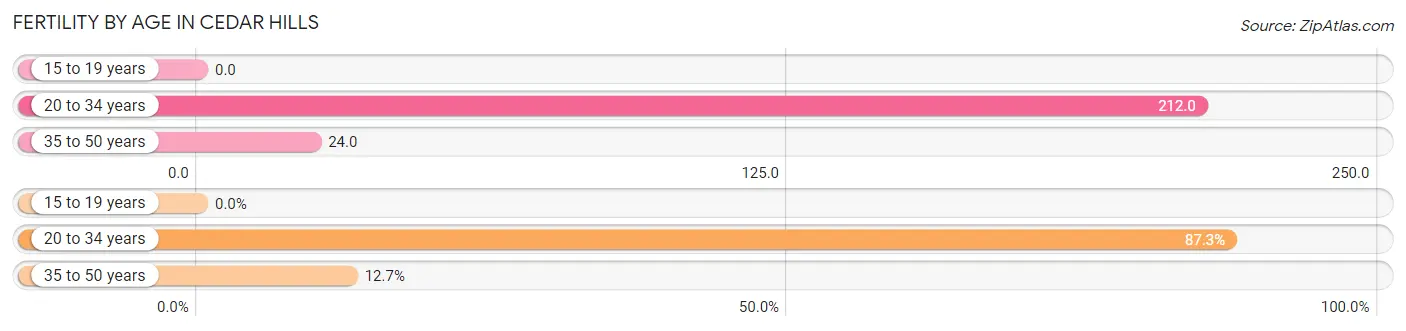
| Age Bracket | Women with Births | Births / 1,000 Women |
| 15 to 19 years | 0 (0.0%) | 0.0 |
| 20 to 34 years | 165 (87.3%) | 212.0 |
| 35 to 50 years | 24 (12.7%) | 24.0 |
| Total | 189 (100.0%) | 78.0 |
Fertility by Age by Marriage Status in Cedar Hills
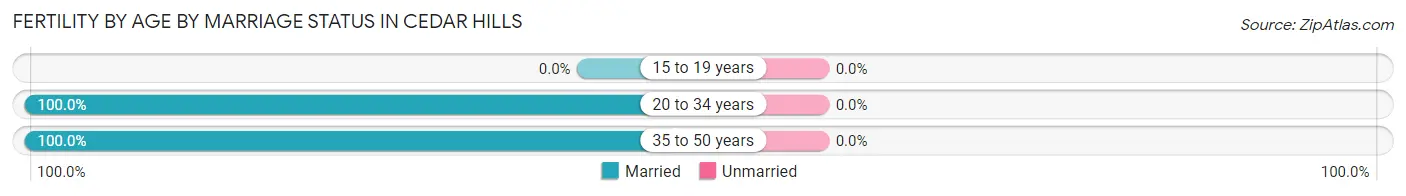
| Age Bracket | Married | Unmarried |
| 15 to 19 years | 0 (0.0%) | 0 (0.0%) |
| 20 to 34 years | 165 (100.0%) | 0 (0.0%) |
| 35 to 50 years | 24 (100.0%) | 0 (0.0%) |
| Total | 189 (100.0%) | 0 (0.0%) |
Fertility by Education in Cedar Hills
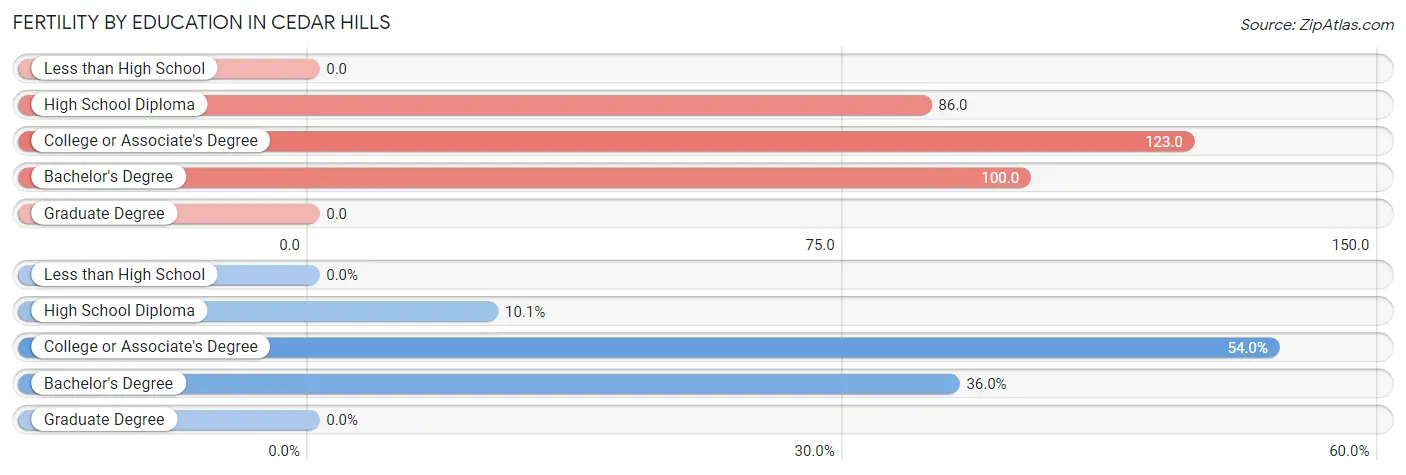
| Educational Attainment | Women with Births | Births / 1,000 Women |
| Less than High School | 0 (0.0%) | 0.0 |
| High School Diploma | 19 (10.1%) | 86.0 |
| College or Associate's Degree | 102 (54.0%) | 123.0 |
| Bachelor's Degree | 68 (36.0%) | 100.0 |
| Graduate Degree | 0 (0.0%) | 0.0 |
| Total | 189 (100.0%) | 78.0 |
Fertility by Education by Marriage Status in Cedar Hills
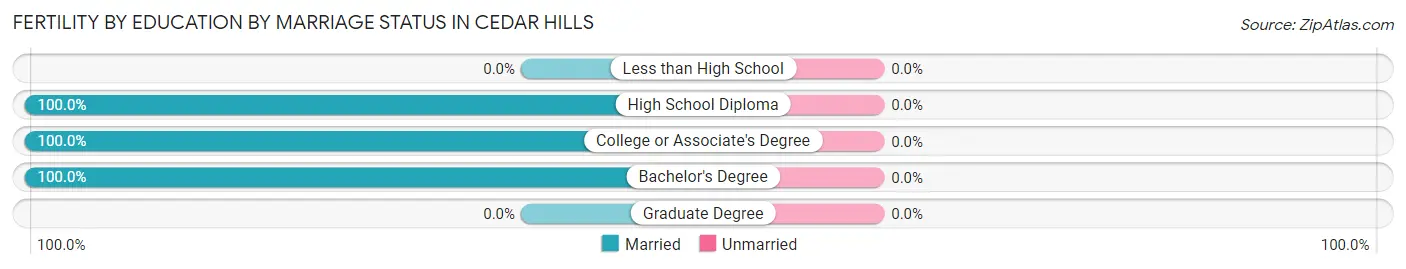
| Educational Attainment | Married | Unmarried |
| Less than High School | 0 (0.0%) | 0 (0.0%) |
| High School Diploma | 19 (100.0%) | 0 (0.0%) |
| College or Associate's Degree | 102 (100.0%) | 0 (0.0%) |
| Bachelor's Degree | 68 (100.0%) | 0 (0.0%) |
| Graduate Degree | 0 (0.0%) | 0 (0.0%) |
| Total | 189 (100.0%) | 0 (0.0%) |
Income in Cedar Hills
Income Overview in Cedar Hills
Per Capita Income in Cedar Hills is $37,410, while median incomes of families and households are $133,555 and $130,847 respectively.
| Characteristic | Number | Measure |
| Per Capita Income | 9,977 | $37,410 |
| Median Family Income | 2,253 | $133,555 |
| Mean Family Income | 2,253 | $156,861 |
| Median Household Income | 2,467 | $130,847 |
| Mean Household Income | 2,467 | $149,229 |
| Income Deficit | 2,253 | $11,189 |
| Wage / Income Gap (%) | 9,977 | 70.65% |
| Wage / Income Gap ($) | 9,977 | 29.35¢ per $1 |
| Gini / Inequality Index | 9,977 | 0.38 |
Earnings by Sex in Cedar Hills
Average Earnings in Cedar Hills are $38,065, $71,633 for men and $21,027 for women, a difference of 70.7%.
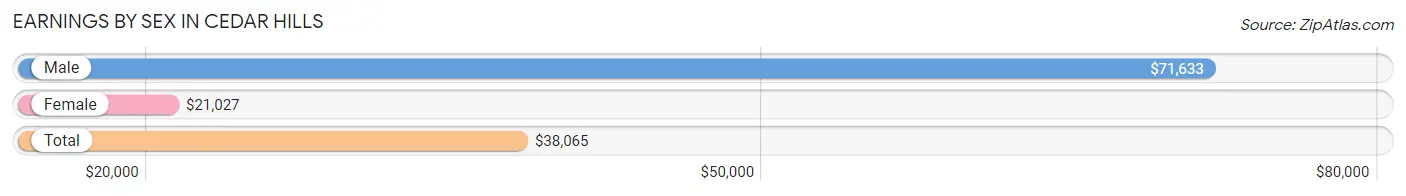
| Sex | Number | Average Earnings |
| Male | 2,910 (62.0%) | $71,633 |
| Female | 1,787 (38.1%) | $21,027 |
| Total | 4,697 (100.0%) | $38,065 |
Earnings by Sex by Income Bracket in Cedar Hills
The most common earnings brackets in Cedar Hills are $100,000+ for men (1,088 | 37.4%) and $2,499 or less for women (276 | 15.4%).
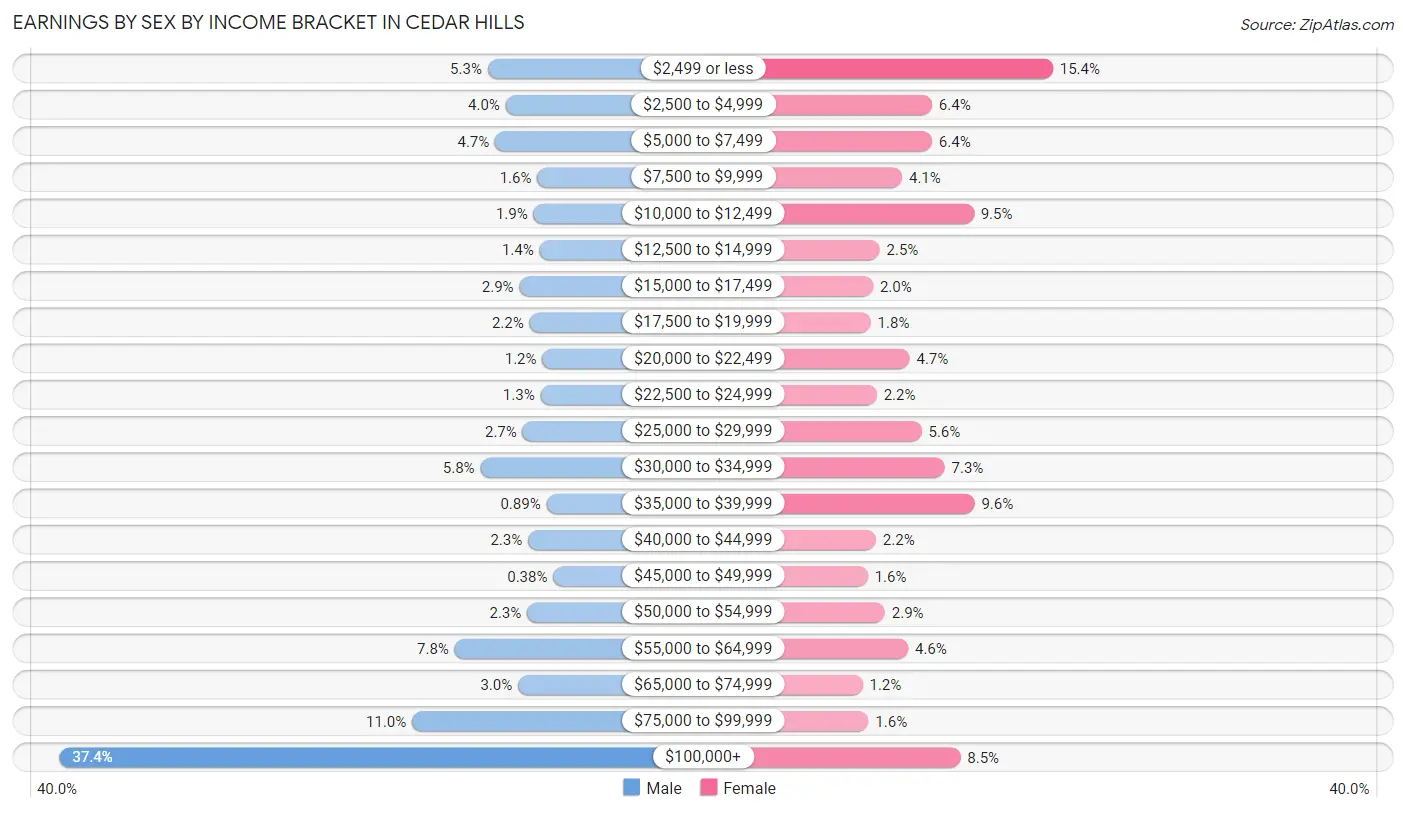
| Income | Male | Female |
| $2,499 or less | 154 (5.3%) | 276 (15.4%) |
| $2,500 to $4,999 | 115 (4.0%) | 114 (6.4%) |
| $5,000 to $7,499 | 138 (4.7%) | 114 (6.4%) |
| $7,500 to $9,999 | 46 (1.6%) | 74 (4.1%) |
| $10,000 to $12,499 | 54 (1.9%) | 170 (9.5%) |
| $12,500 to $14,999 | 41 (1.4%) | 44 (2.5%) |
| $15,000 to $17,499 | 85 (2.9%) | 35 (2.0%) |
| $17,500 to $19,999 | 63 (2.2%) | 32 (1.8%) |
| $20,000 to $22,499 | 35 (1.2%) | 84 (4.7%) |
| $22,500 to $24,999 | 39 (1.3%) | 40 (2.2%) |
| $25,000 to $29,999 | 78 (2.7%) | 100 (5.6%) |
| $30,000 to $34,999 | 170 (5.8%) | 131 (7.3%) |
| $35,000 to $39,999 | 26 (0.9%) | 171 (9.6%) |
| $40,000 to $44,999 | 66 (2.3%) | 39 (2.2%) |
| $45,000 to $49,999 | 11 (0.4%) | 28 (1.6%) |
| $50,000 to $54,999 | 68 (2.3%) | 51 (2.9%) |
| $55,000 to $64,999 | 226 (7.8%) | 82 (4.6%) |
| $65,000 to $74,999 | 88 (3.0%) | 21 (1.2%) |
| $75,000 to $99,999 | 319 (11.0%) | 29 (1.6%) |
| $100,000+ | 1,088 (37.4%) | 152 (8.5%) |
| Total | 2,910 (100.0%) | 1,787 (100.0%) |
Earnings by Sex by Educational Attainment in Cedar Hills
Average earnings in Cedar Hills are $101,298 for men and $28,229 for women, a difference of 72.1%. Men with an educational attainment of graduate degree enjoy the highest average annual earnings of $118,490, while those with college or associate's degree education earn the least with $57,372. Women with an educational attainment of graduate degree earn the most with the average annual earnings of $59,271, while those with high school diploma education have the smallest earnings of $6,094.
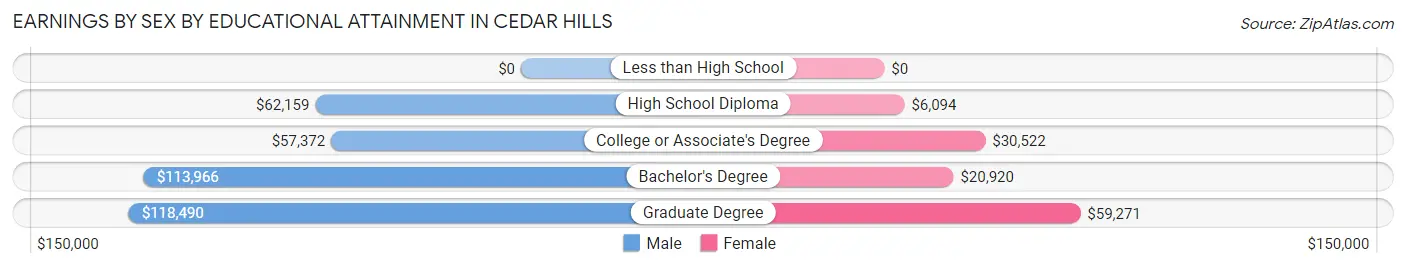
| Educational Attainment | Male Income | Female Income |
| Less than High School | - | - |
| High School Diploma | $62,159 | $6,094 |
| College or Associate's Degree | $57,372 | $30,522 |
| Bachelor's Degree | $113,966 | $20,920 |
| Graduate Degree | $118,490 | $59,271 |
| Total | $101,298 | $28,229 |
Family Income in Cedar Hills
Family Income Brackets in Cedar Hills
According to the Cedar Hills family income data, there are 590 families falling into the $100,000 to $149,999 income range, which is the most common income bracket and makes up 26.2% of all families.
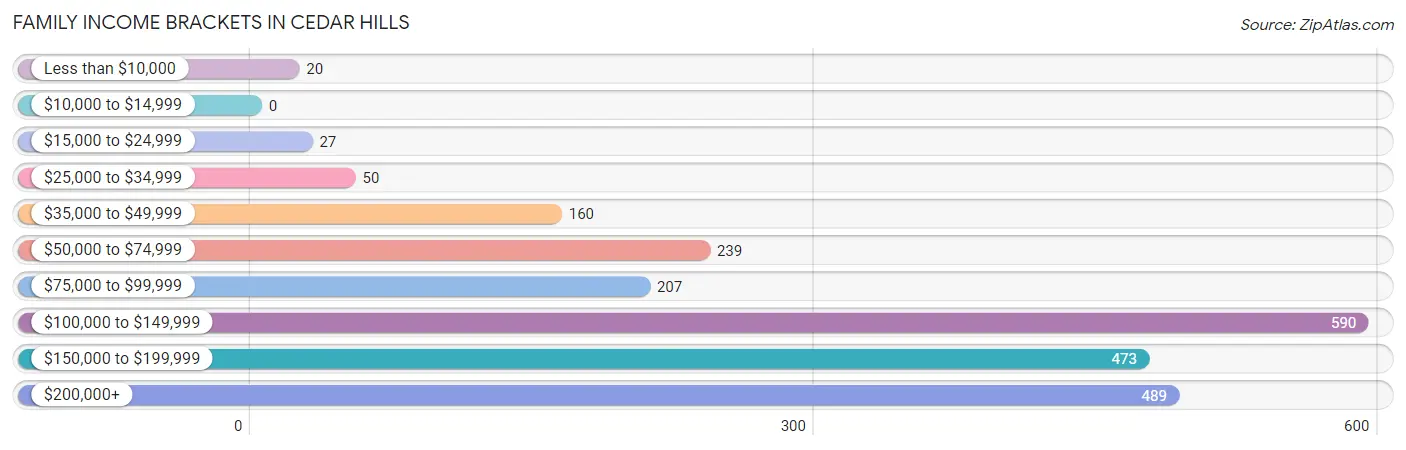
| Income Bracket | # Families | % Families |
| Less than $10,000 | 20 | 0.9% |
| $10,000 to $14,999 | 0 | 0.0% |
| $15,000 to $24,999 | 27 | 1.2% |
| $25,000 to $34,999 | 50 | 2.2% |
| $35,000 to $49,999 | 160 | 7.1% |
| $50,000 to $74,999 | 239 | 10.6% |
| $75,000 to $99,999 | 207 | 9.2% |
| $100,000 to $149,999 | 590 | 26.2% |
| $150,000 to $199,999 | 473 | 21.0% |
| $200,000+ | 489 | 21.7% |
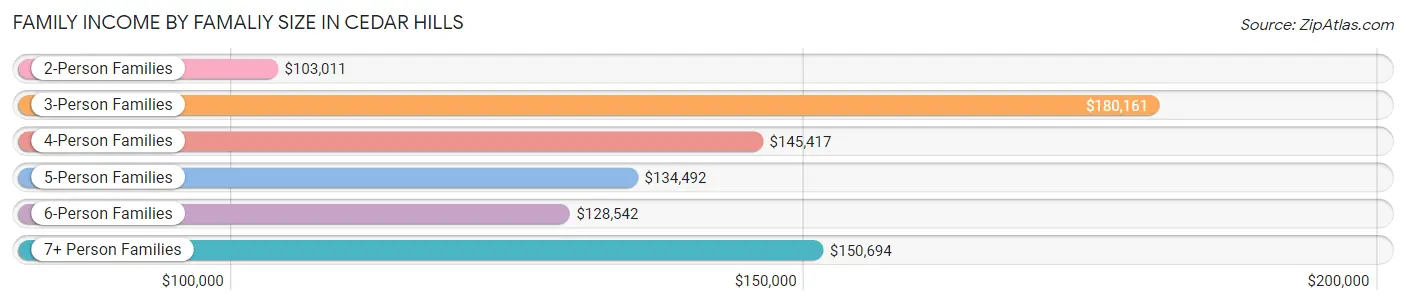
Family Income by Famaliy Size in Cedar Hills
3-person families (452 | 20.1%) account for the highest median family income in Cedar Hills with $180,161 per family, while 3-person families (452 | 20.1%) have the highest median income of $60,054 per family member.
| Income Bracket | # Families | Median Income |
| 2-Person Families | 509 (22.6%) | $103,011 |
| 3-Person Families | 452 (20.1%) | $180,161 |
| 4-Person Families | 407 (18.1%) | $145,417 |
| 5-Person Families | 339 (15.0%) | $134,492 |
| 6-Person Families | 363 (16.1%) | $128,542 |
| 7+ Person Families | 183 (8.1%) | $150,694 |
| Total | 2,253 (100.0%) | $133,555 |
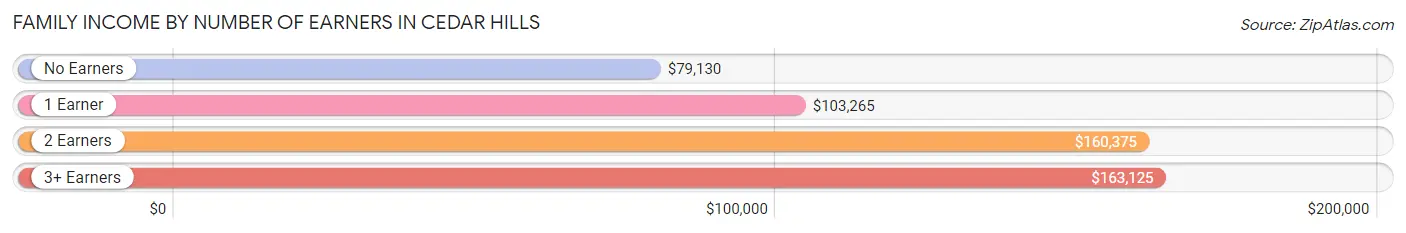
Family Income by Number of Earners in Cedar Hills
The median family income in Cedar Hills is $133,555, with families comprising 3+ earners (614) having the highest median family income of $163,125, while families with no earners (222) have the lowest median family income of $79,130, accounting for 27.3% and 9.9% of families, respectively.
| Number of Earners | # Families | Median Income |
| No Earners | 222 (9.9%) | $79,130 |
| 1 Earner | 684 (30.4%) | $103,265 |
| 2 Earners | 733 (32.5%) | $160,375 |
| 3+ Earners | 614 (27.3%) | $163,125 |
| Total | 2,253 (100.0%) | $133,555 |
Household Income in Cedar Hills
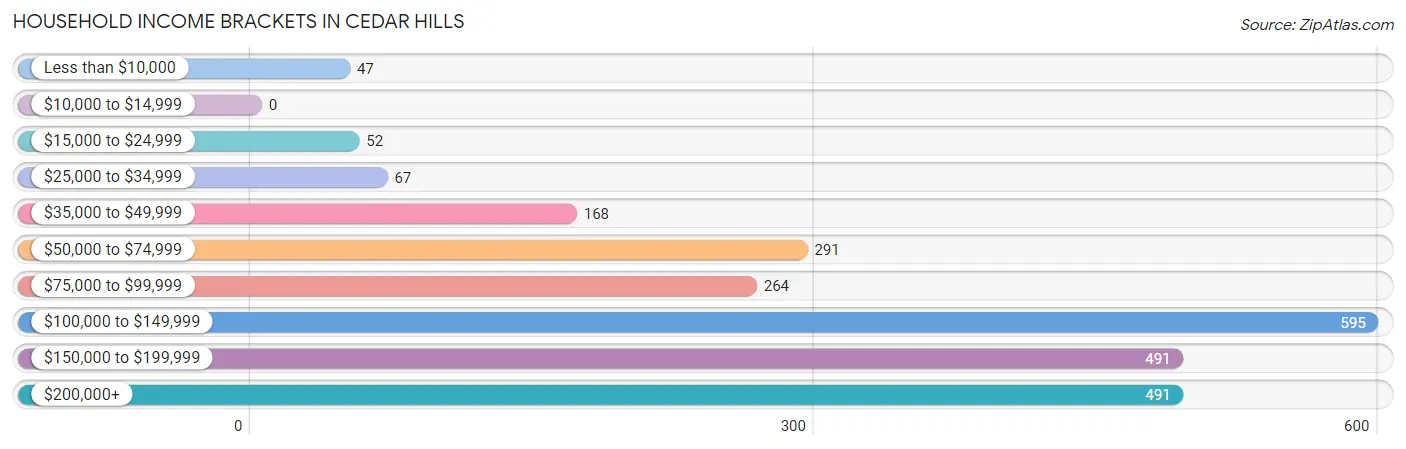
Household Income Brackets in Cedar Hills
With 595 households falling in the category, the $100,000 to $149,999 income range is the most frequent in Cedar Hills, accounting for 24.1% of all households.
| Income Bracket | # Households | % Households |
| Less than $10,000 | 47 | 1.9% |
| $10,000 to $14,999 | 0 | 0.0% |
| $15,000 to $24,999 | 52 | 2.1% |
| $25,000 to $34,999 | 67 | 2.7% |
| $35,000 to $49,999 | 168 | 6.8% |
| $50,000 to $74,999 | 291 | 11.8% |
| $75,000 to $99,999 | 264 | 10.7% |
| $100,000 to $149,999 | 595 | 24.1% |
| $150,000 to $199,999 | 491 | 19.9% |
| $200,000+ | 491 | 19.9% |
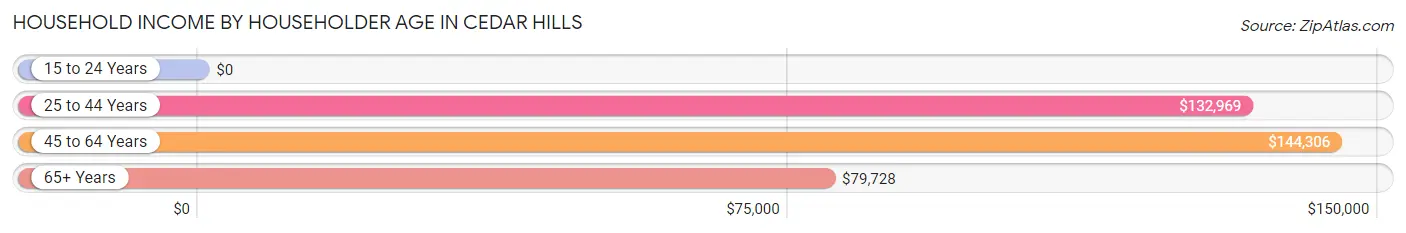
Household Income by Householder Age in Cedar Hills
The median household income in Cedar Hills is $130,847, with the highest median household income of $144,306 found in the 45 to 64 years age bracket for the primary householder. A total of 1,062 households (43.0%) fall into this category.
| Income Bracket | # Households | Median Income |
| 15 to 24 Years | 0 (0.0%) | $0 |
| 25 to 44 Years | 956 (38.8%) | $132,969 |
| 45 to 64 Years | 1,062 (43.0%) | $144,306 |
| 65+ Years | 449 (18.2%) | $79,728 |
| Total | 2,467 (100.0%) | $130,847 |
Poverty in Cedar Hills
Income Below Poverty by Sex and Age in Cedar Hills
With 4.3% poverty level for males and 5.1% for females among the residents of Cedar Hills, 16 and 17 year old males and 6 to 11 year old females are the most vulnerable to poverty, with 34 males (18.9%) and 57 females (9.6%) in their respective age groups living below the poverty level.
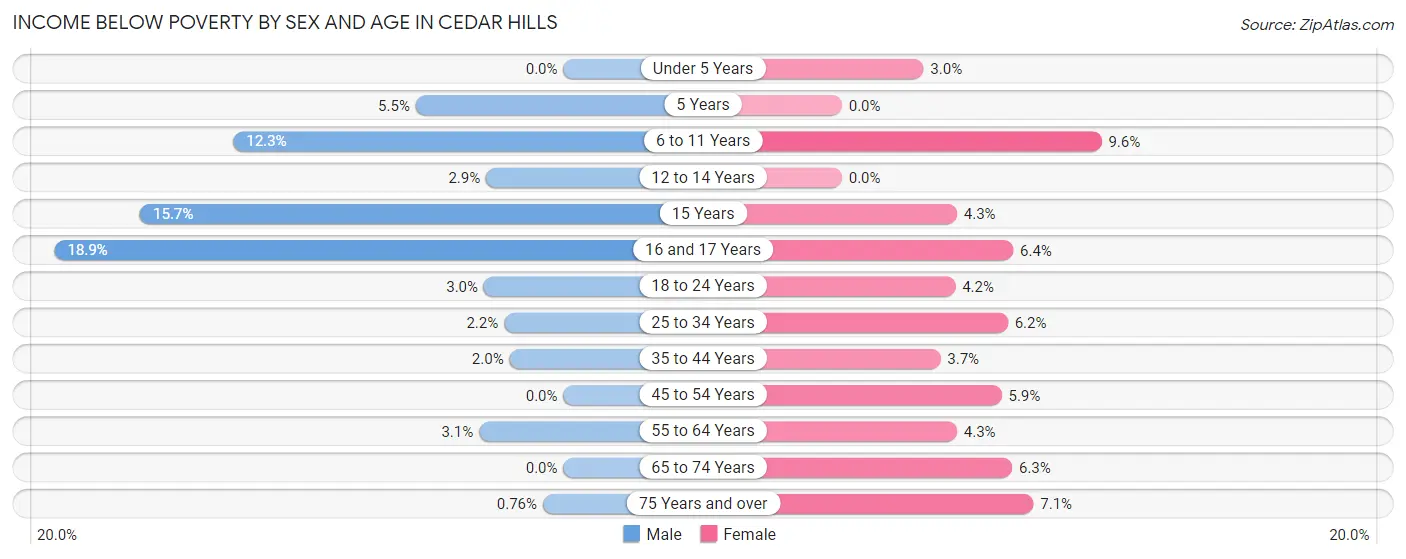
| Age Bracket | Male | Female |
| Under 5 Years | 0 (0.0%) | 16 (3.0%) |
| 5 Years | 8 (5.5%) | 0 (0.0%) |
| 6 to 11 Years | 73 (12.2%) | 57 (9.6%) |
| 12 to 14 Years | 8 (2.9%) | 0 (0.0%) |
| 15 Years | 30 (15.7%) | 7 (4.3%) |
| 16 and 17 Years | 34 (18.9%) | 22 (6.4%) |
| 18 to 24 Years | 23 (2.9%) | 21 (4.2%) |
| 25 to 34 Years | 9 (2.2%) | 25 (6.2%) |
| 35 to 44 Years | 14 (2.0%) | 24 (3.7%) |
| 45 to 54 Years | 0 (0.0%) | 34 (5.9%) |
| 55 to 64 Years | 16 (3.1%) | 14 (4.3%) |
| 65 to 74 Years | 0 (0.0%) | 18 (6.3%) |
| 75 Years and over | 1 (0.8%) | 14 (7.1%) |
| Total | 216 (4.3%) | 252 (5.1%) |
Income Above Poverty by Sex and Age in Cedar Hills
According to the poverty statistics in Cedar Hills, males aged under 5 years and females aged 5 years are the age groups that are most secure financially, with 100.0% of males and 100.0% of females in these age groups living above the poverty line.
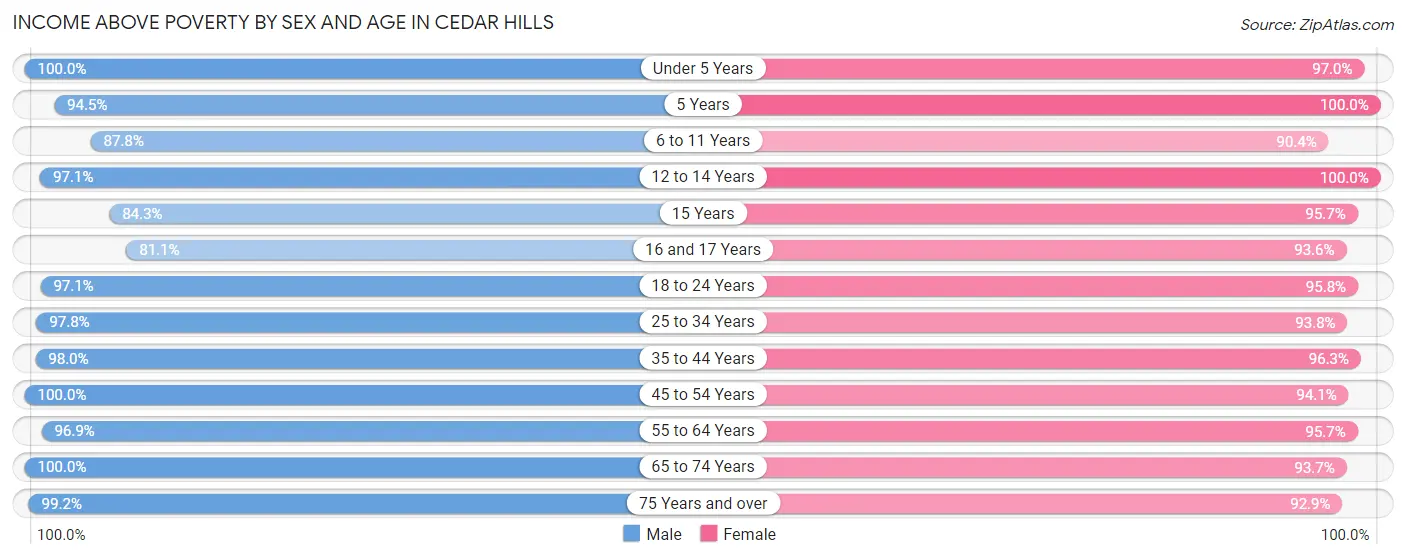
| Age Bracket | Male | Female |
| Under 5 Years | 279 (100.0%) | 512 (97.0%) |
| 5 Years | 138 (94.5%) | 55 (100.0%) |
| 6 to 11 Years | 523 (87.7%) | 534 (90.4%) |
| 12 to 14 Years | 271 (97.1%) | 346 (100.0%) |
| 15 Years | 161 (84.3%) | 157 (95.7%) |
| 16 and 17 Years | 146 (81.1%) | 324 (93.6%) |
| 18 to 24 Years | 756 (97.1%) | 478 (95.8%) |
| 25 to 34 Years | 400 (97.8%) | 381 (93.8%) |
| 35 to 44 Years | 686 (98.0%) | 632 (96.3%) |
| 45 to 54 Years | 543 (100.0%) | 539 (94.1%) |
| 55 to 64 Years | 495 (96.9%) | 314 (95.7%) |
| 65 to 74 Years | 222 (100.0%) | 267 (93.7%) |
| 75 Years and over | 130 (99.2%) | 183 (92.9%) |
| Total | 4,750 (95.7%) | 4,722 (94.9%) |
Income Below Poverty Among Married-Couple Families in Cedar Hills
The poverty statistics for married-couple families in Cedar Hills show that 1.1% or 23 of the total 2,013 families live below the poverty line. Families with 5 or more children have the highest poverty rate of 7.1%, comprising of 8 families. On the other hand, families with 3 or 4 children have the lowest poverty rate of 0.0%, which includes 0 families.
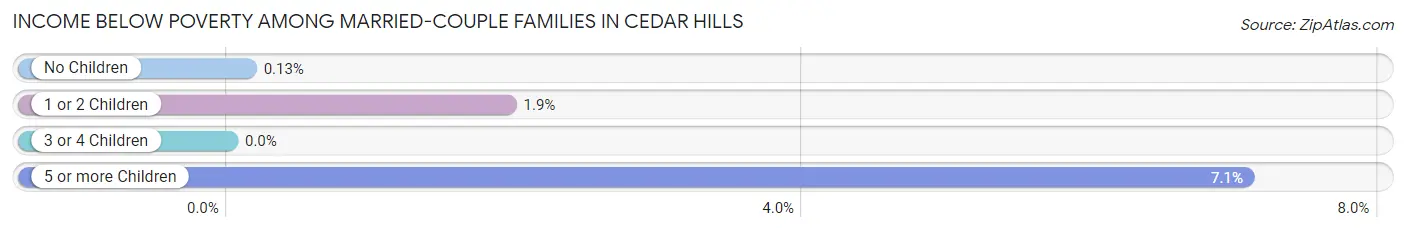
| Children | Above Poverty | Below Poverty |
| No Children | 769 (99.9%) | 1 (0.1%) |
| 1 or 2 Children | 707 (98.1%) | 14 (1.9%) |
| 3 or 4 Children | 409 (100.0%) | 0 (0.0%) |
| 5 or more Children | 105 (92.9%) | 8 (7.1%) |
| Total | 1,990 (98.9%) | 23 (1.1%) |
Income Below Poverty Among Single-Parent Households in Cedar Hills
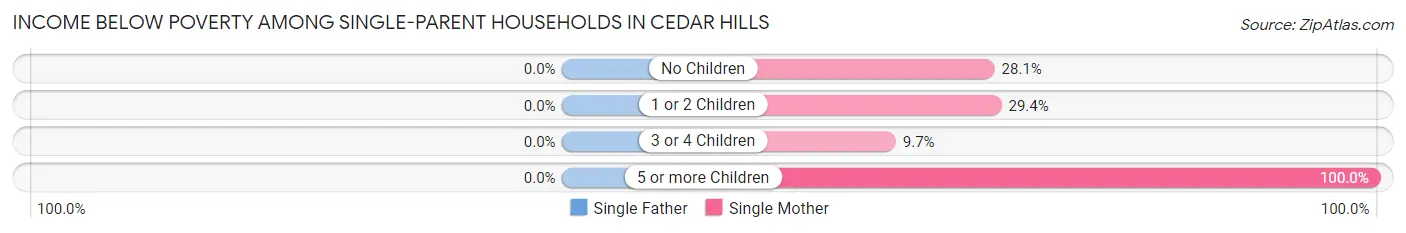
| Children | Single Father | Single Mother |
| No Children | 0 (0.0%) | 9 (28.1%) |
| 1 or 2 Children | 0 (0.0%) | 10 (29.4%) |
| 3 or 4 Children | 0 (0.0%) | 7 (9.7%) |
| 5 or more Children | 0 (0.0%) | 24 (100.0%) |
| Total | 0 (0.0%) | 50 (30.9%) |
Income Below Poverty Among Married-Couple vs Single-Parent Households in Cedar Hills
The poverty data for Cedar Hills shows that 23 of the married-couple family households (1.1%) and 50 of the single-parent households (20.8%) are living below the poverty level. Within the married-couple family households, those with 5 or more children have the highest poverty rate, with 8 households (7.1%) falling below the poverty line. Among the single-parent households, those with 5 or more children have the highest poverty rate, with 24 household (100.0%) living below poverty.
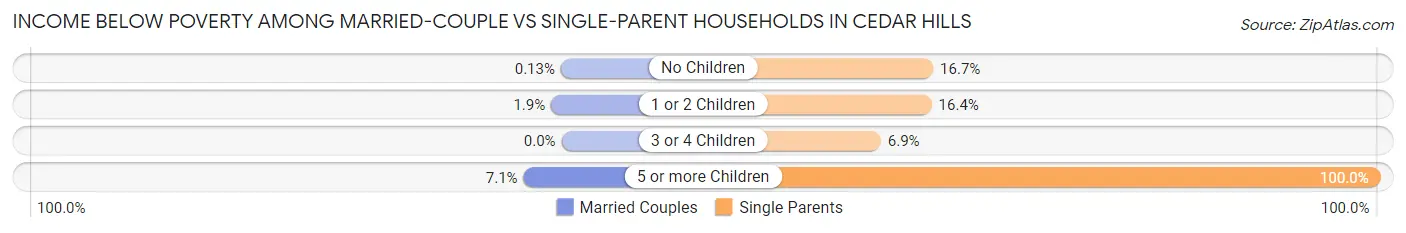
| Children | Married-Couple Families | Single-Parent Households |
| No Children | 1 (0.1%) | 9 (16.7%) |
| 1 or 2 Children | 14 (1.9%) | 10 (16.4%) |
| 3 or 4 Children | 0 (0.0%) | 7 (6.9%) |
| 5 or more Children | 8 (7.1%) | 24 (100.0%) |
| Total | 23 (1.1%) | 50 (20.8%) |
Employment Characteristics in Cedar Hills
Employment by Class of Employer in Cedar Hills
Among the 4,130 employed individuals in Cedar Hills, private company employees (3,055 | 74.0%), not-for-profit organizations (286 | 6.9%), and local government employees (274 | 6.6%) make up the most common classes of employment.
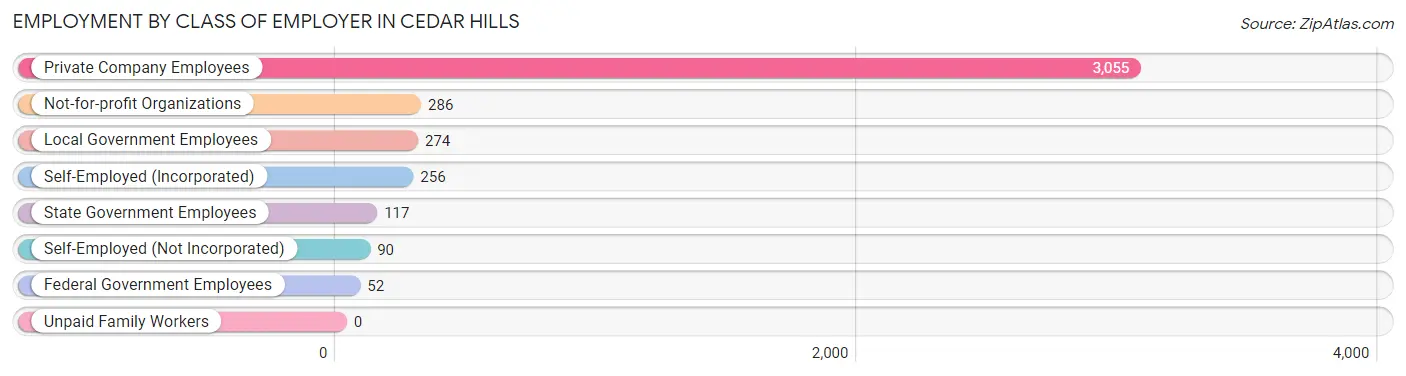
| Employer Class | # Employees | % Employees |
| Private Company Employees | 3,055 | 74.0% |
| Self-Employed (Incorporated) | 256 | 6.2% |
| Self-Employed (Not Incorporated) | 90 | 2.2% |
| Not-for-profit Organizations | 286 | 6.9% |
| Local Government Employees | 274 | 6.6% |
| State Government Employees | 117 | 2.8% |
| Federal Government Employees | 52 | 1.3% |
| Unpaid Family Workers | 0 | 0.0% |
| Total | 4,130 | 100.0% |
Employment Status by Age in Cedar Hills
According to the labor force statistics for Cedar Hills, out of the total population over 16 years of age (6,766), 65.0% or 4,398 individuals are in the labor force, with 2.8% or 123 of them unemployed. The age group with the highest labor force participation rate is 20 to 24 years, with 83.7% or 740 individuals in the labor force. Within the labor force, the 16 to 19 years age range has the highest percentage of unemployed individuals, with 5.5% or 24 of them being unemployed.
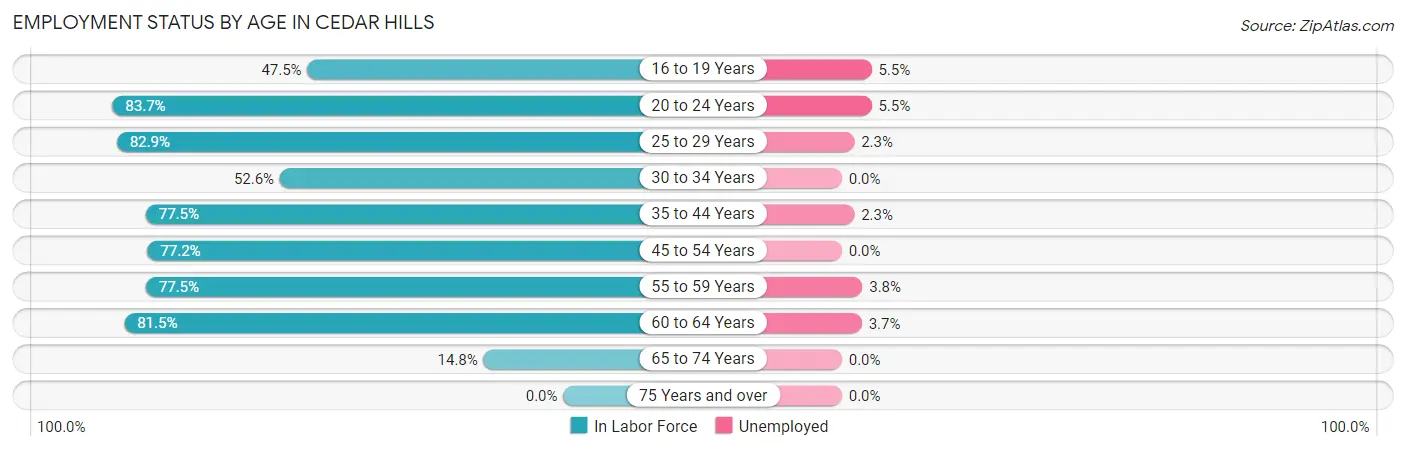
| Age Bracket | In Labor Force | Unemployed |
| 16 to 19 Years | 437 (47.5%) | 24 (5.5%) |
| 20 to 24 Years | 740 (83.7%) | 41 (5.5%) |
| 25 to 29 Years | 389 (82.9%) | 9 (2.3%) |
| 30 to 34 Years | 182 (52.6%) | 0 (0.0%) |
| 35 to 44 Years | 1,051 (77.5%) | 24 (2.3%) |
| 45 to 54 Years | 862 (77.2%) | 0 (0.0%) |
| 55 to 59 Years | 344 (77.5%) | 13 (3.8%) |
| 60 to 64 Years | 322 (81.5%) | 12 (3.7%) |
| 65 to 74 Years | 75 (14.8%) | 0 (0.0%) |
| 75 Years and over | 0 (0.0%) | 0 (0.0%) |
| Total | 4,398 (65.0%) | 123 (2.8%) |
Employment Status by Educational Attainment in Cedar Hills
According to labor force statistics for Cedar Hills, 76.3% of individuals (3,148) out of the total population between 25 and 64 years of age (4,126) are in the labor force, with 1.8% or 57 of them being unemployed. The group with the highest labor force participation rate are those with the educational attainment of bachelor's degree or higher, with 82.0% or 1,941 individuals in the labor force. Within the labor force, individuals with high school diploma education have the highest percentage of unemployment, with 5.8% or 12 of them being unemployed.
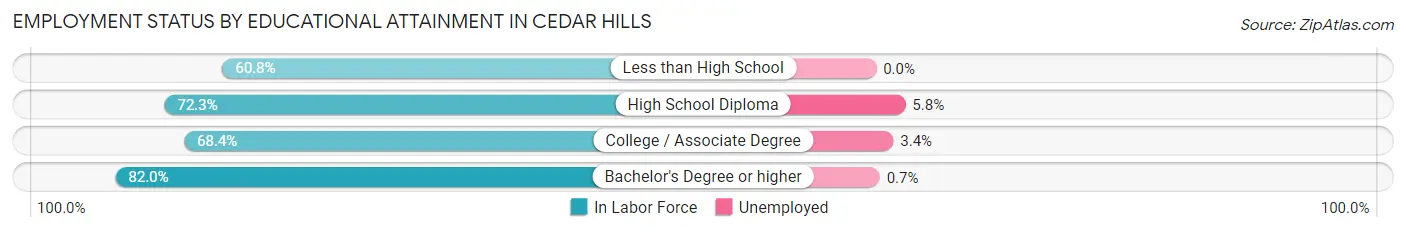
| Educational Attainment | In Labor Force | Unemployed |
| Less than High School | 45 (60.8%) | 0 (0.0%) |
| High School Diploma | 206 (72.3%) | 17 (5.8%) |
| College / Associate Degree | 958 (68.4%) | 48 (3.4%) |
| Bachelor's Degree or higher | 1,941 (82.0%) | 17 (0.7%) |
| Total | 3,148 (76.3%) | 74 (1.8%) |
Employment Occupations by Sex in Cedar Hills
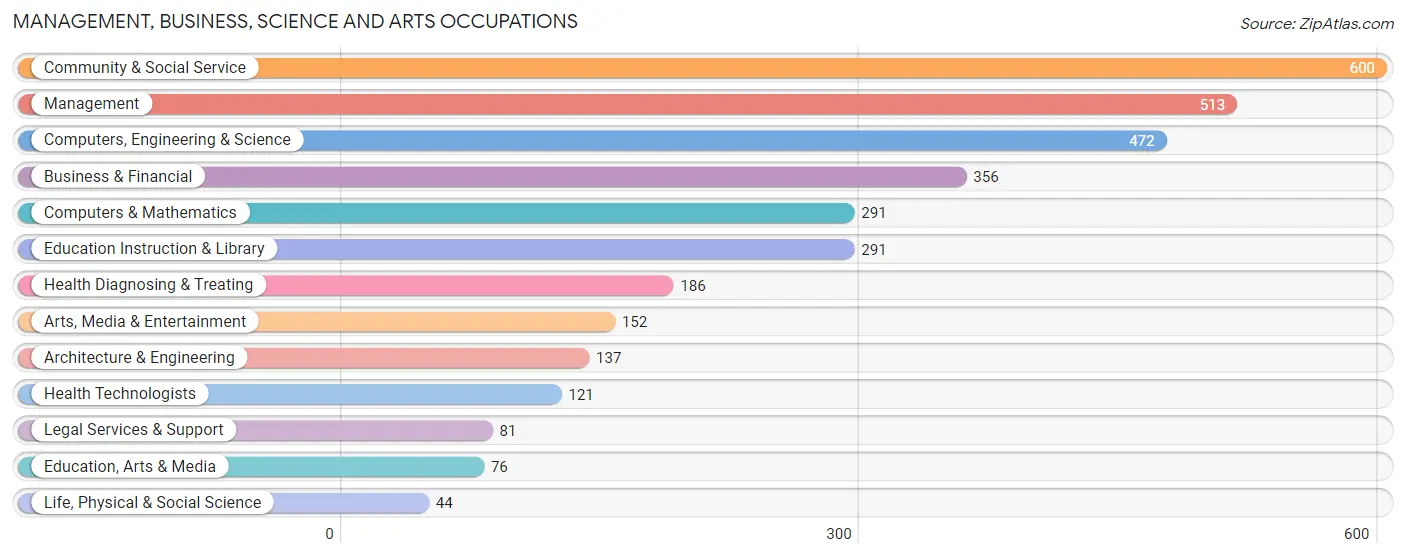
Management, Business, Science and Arts Occupations
The most common Management, Business, Science and Arts occupations in Cedar Hills are Community & Social Service (600 | 14.0%), Management (513 | 12.0%), Computers, Engineering & Science (472 | 11.0%), Business & Financial (356 | 8.3%), and Computers & Mathematics (291 | 6.8%).
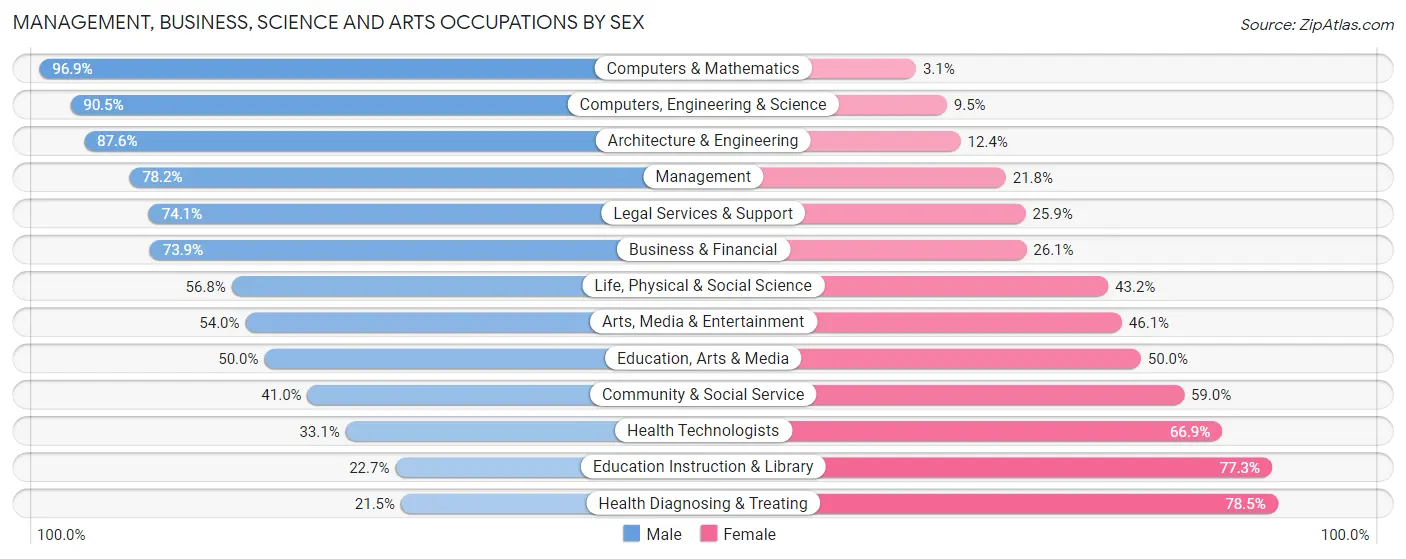
Management, Business, Science and Arts Occupations by Sex
Within the Management, Business, Science and Arts occupations in Cedar Hills, the most male-oriented occupations are Computers & Mathematics (96.9%), Computers, Engineering & Science (90.5%), and Architecture & Engineering (87.6%), while the most female-oriented occupations are Health Diagnosing & Treating (78.5%), Education Instruction & Library (77.3%), and Health Technologists (66.9%).
| Occupation | Male | Female |
| Management | 401 (78.2%) | 112 (21.8%) |
| Business & Financial | 263 (73.9%) | 93 (26.1%) |
| Computers, Engineering & Science | 427 (90.5%) | 45 (9.5%) |
| Computers & Mathematics | 282 (96.9%) | 9 (3.1%) |
| Architecture & Engineering | 120 (87.6%) | 17 (12.4%) |
| Life, Physical & Social Science | 25 (56.8%) | 19 (43.2%) |
| Community & Social Service | 246 (41.0%) | 354 (59.0%) |
| Education, Arts & Media | 38 (50.0%) | 38 (50.0%) |
| Legal Services & Support | 60 (74.1%) | 21 (25.9%) |
| Education Instruction & Library | 66 (22.7%) | 225 (77.3%) |
| Arts, Media & Entertainment | 82 (53.9%) | 70 (46.1%) |
| Health Diagnosing & Treating | 40 (21.5%) | 146 (78.5%) |
| Health Technologists | 40 (33.1%) | 81 (66.9%) |
| Total (Category) | 1,377 (64.7%) | 750 (35.3%) |
| Total (Overall) | 2,729 (63.8%) | 1,549 (36.2%) |
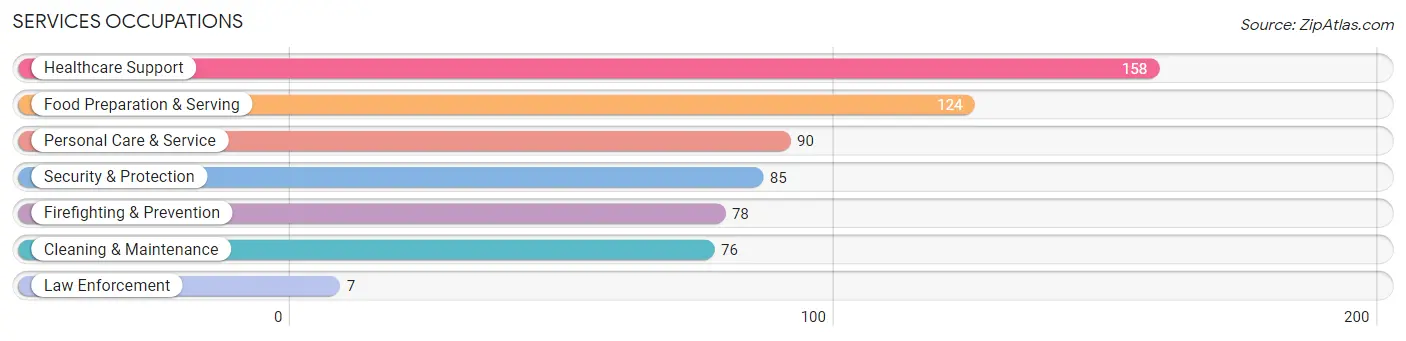
Services Occupations
The most common Services occupations in Cedar Hills are Healthcare Support (158 | 3.7%), Food Preparation & Serving (124 | 2.9%), Personal Care & Service (90 | 2.1%), Security & Protection (85 | 2.0%), and Firefighting & Prevention (78 | 1.8%).
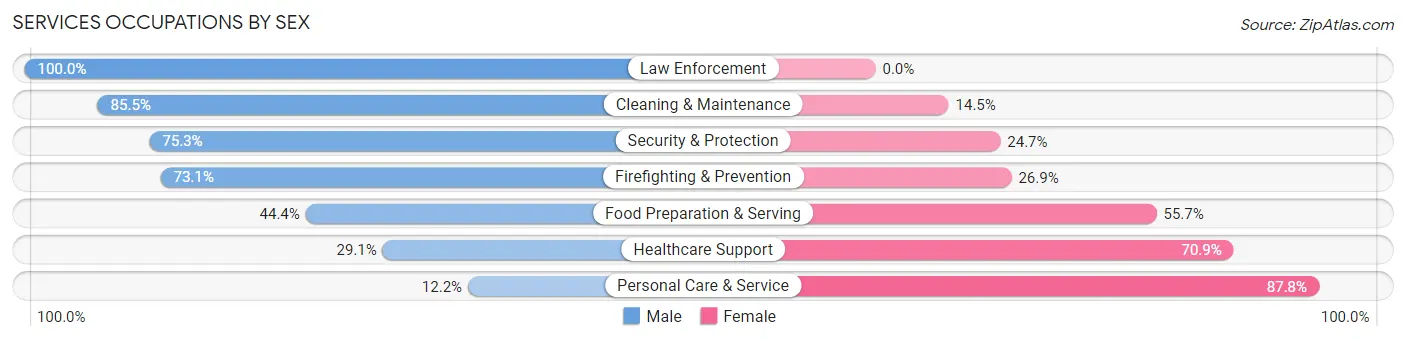
Services Occupations by Sex
Within the Services occupations in Cedar Hills, the most male-oriented occupations are Law Enforcement (100.0%), Cleaning & Maintenance (85.5%), and Security & Protection (75.3%), while the most female-oriented occupations are Personal Care & Service (87.8%), Healthcare Support (70.9%), and Food Preparation & Serving (55.6%).
| Occupation | Male | Female |
| Healthcare Support | 46 (29.1%) | 112 (70.9%) |
| Security & Protection | 64 (75.3%) | 21 (24.7%) |
| Firefighting & Prevention | 57 (73.1%) | 21 (26.9%) |
| Law Enforcement | 7 (100.0%) | 0 (0.0%) |
| Food Preparation & Serving | 55 (44.4%) | 69 (55.6%) |
| Cleaning & Maintenance | 65 (85.5%) | 11 (14.5%) |
| Personal Care & Service | 11 (12.2%) | 79 (87.8%) |
| Total (Category) | 241 (45.2%) | 292 (54.8%) |
| Total (Overall) | 2,729 (63.8%) | 1,549 (36.2%) |
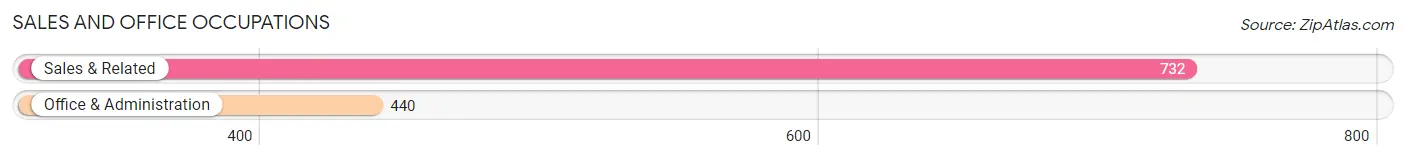
Sales and Office Occupations
The most common Sales and Office occupations in Cedar Hills are Sales & Related (732 | 17.1%), and Office & Administration (440 | 10.3%).
Sales and Office Occupations by Sex
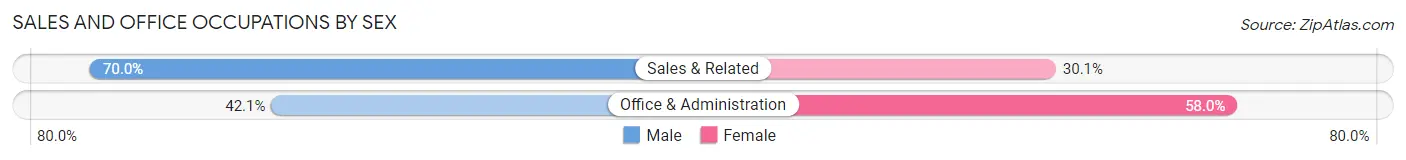
| Occupation | Male | Female |
| Sales & Related | 512 (70.0%) | 220 (30.0%) |
| Office & Administration | 185 (42.0%) | 255 (58.0%) |
| Total (Category) | 697 (59.5%) | 475 (40.5%) |
| Total (Overall) | 2,729 (63.8%) | 1,549 (36.2%) |
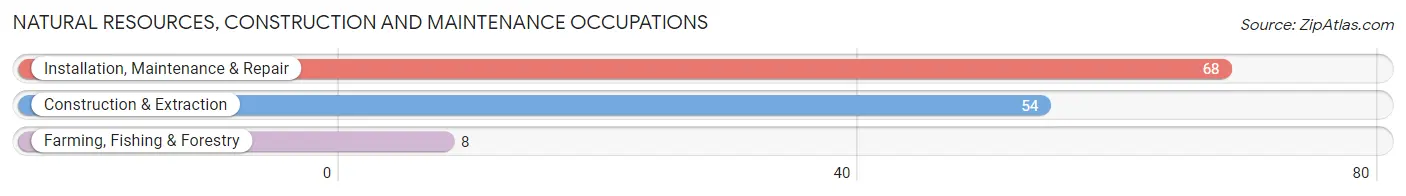
Natural Resources, Construction and Maintenance Occupations
The most common Natural Resources, Construction and Maintenance occupations in Cedar Hills are Installation, Maintenance & Repair (68 | 1.6%), Construction & Extraction (54 | 1.3%), and Farming, Fishing & Forestry (8 | 0.2%).
Natural Resources, Construction and Maintenance Occupations by Sex
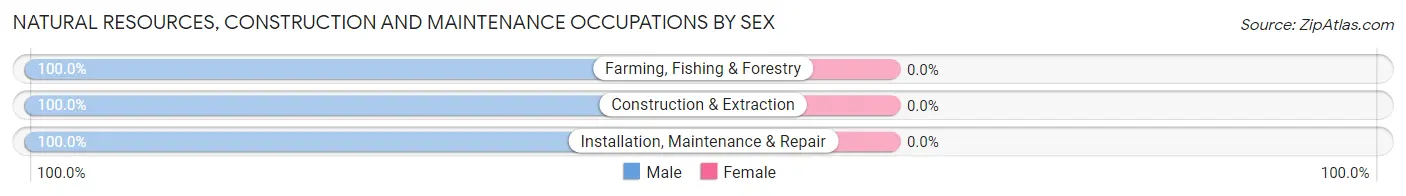
| Occupation | Male | Female |
| Farming, Fishing & Forestry | 8 (100.0%) | 0 (0.0%) |
| Construction & Extraction | 54 (100.0%) | 0 (0.0%) |
| Installation, Maintenance & Repair | 68 (100.0%) | 0 (0.0%) |
| Total (Category) | 130 (100.0%) | 0 (0.0%) |
| Total (Overall) | 2,729 (63.8%) | 1,549 (36.2%) |
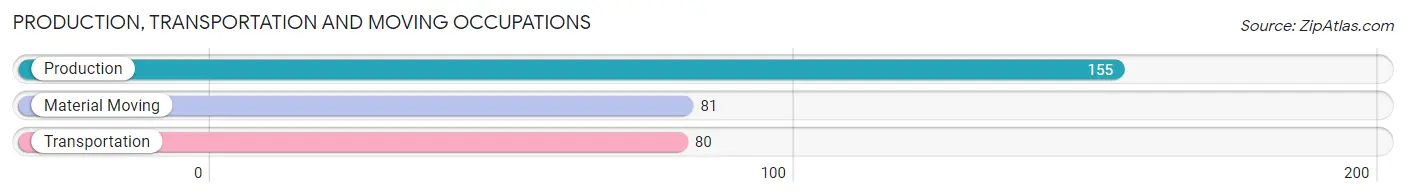
Production, Transportation and Moving Occupations
The most common Production, Transportation and Moving occupations in Cedar Hills are Production (155 | 3.6%), Material Moving (81 | 1.9%), and Transportation (80 | 1.9%).
Production, Transportation and Moving Occupations by Sex
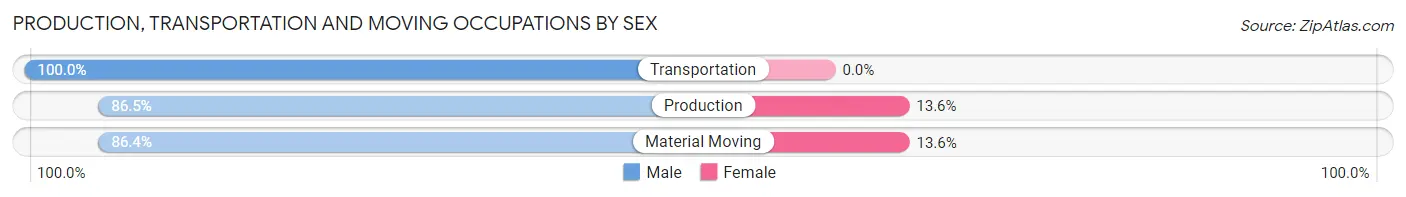
| Occupation | Male | Female |
| Production | 134 (86.5%) | 21 (13.6%) |
| Transportation | 80 (100.0%) | 0 (0.0%) |
| Material Moving | 70 (86.4%) | 11 (13.6%) |
| Total (Category) | 284 (89.9%) | 32 (10.1%) |
| Total (Overall) | 2,729 (63.8%) | 1,549 (36.2%) |
Employment Industries by Sex in Cedar Hills
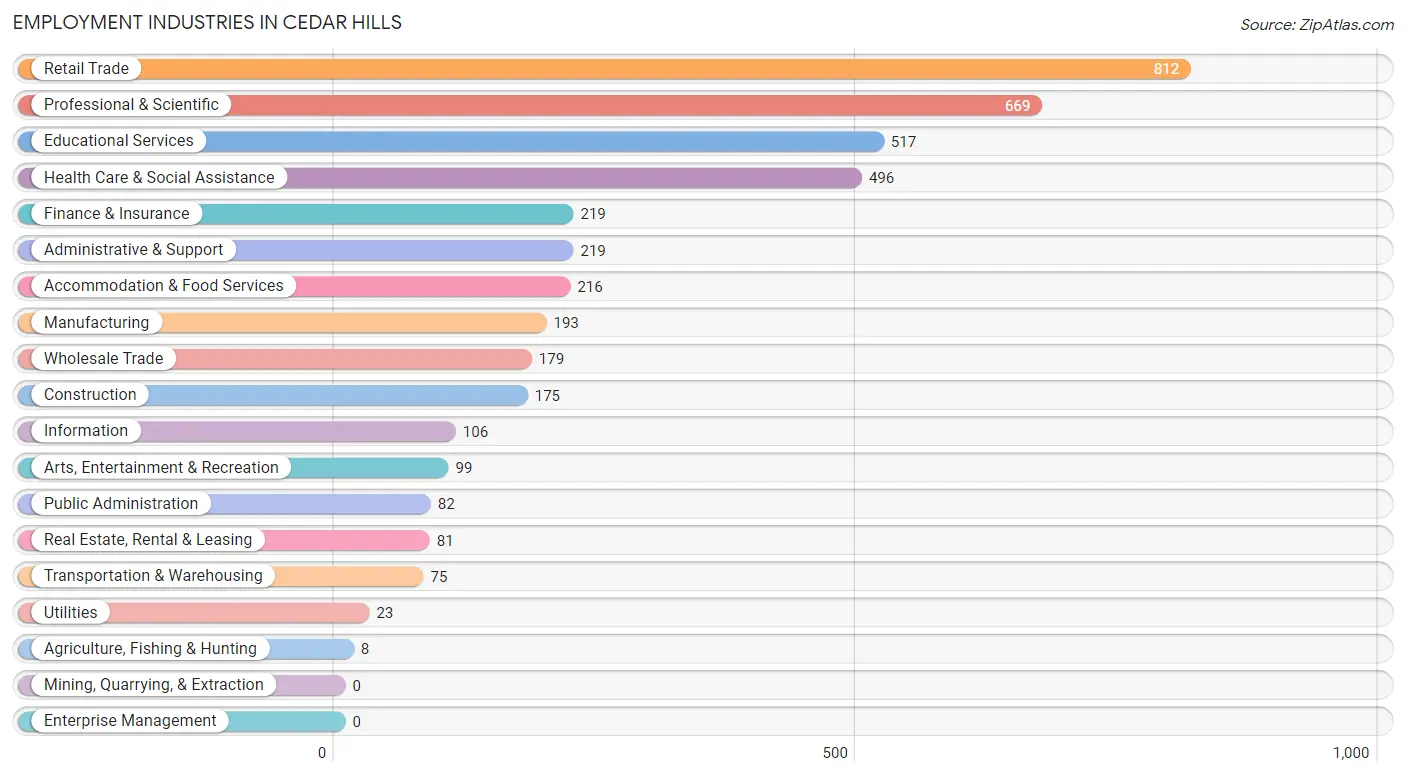
Employment Industries in Cedar Hills
The major employment industries in Cedar Hills include Retail Trade (812 | 19.0%), Professional & Scientific (669 | 15.6%), Educational Services (517 | 12.1%), Health Care & Social Assistance (496 | 11.6%), and Finance & Insurance (219 | 5.1%).
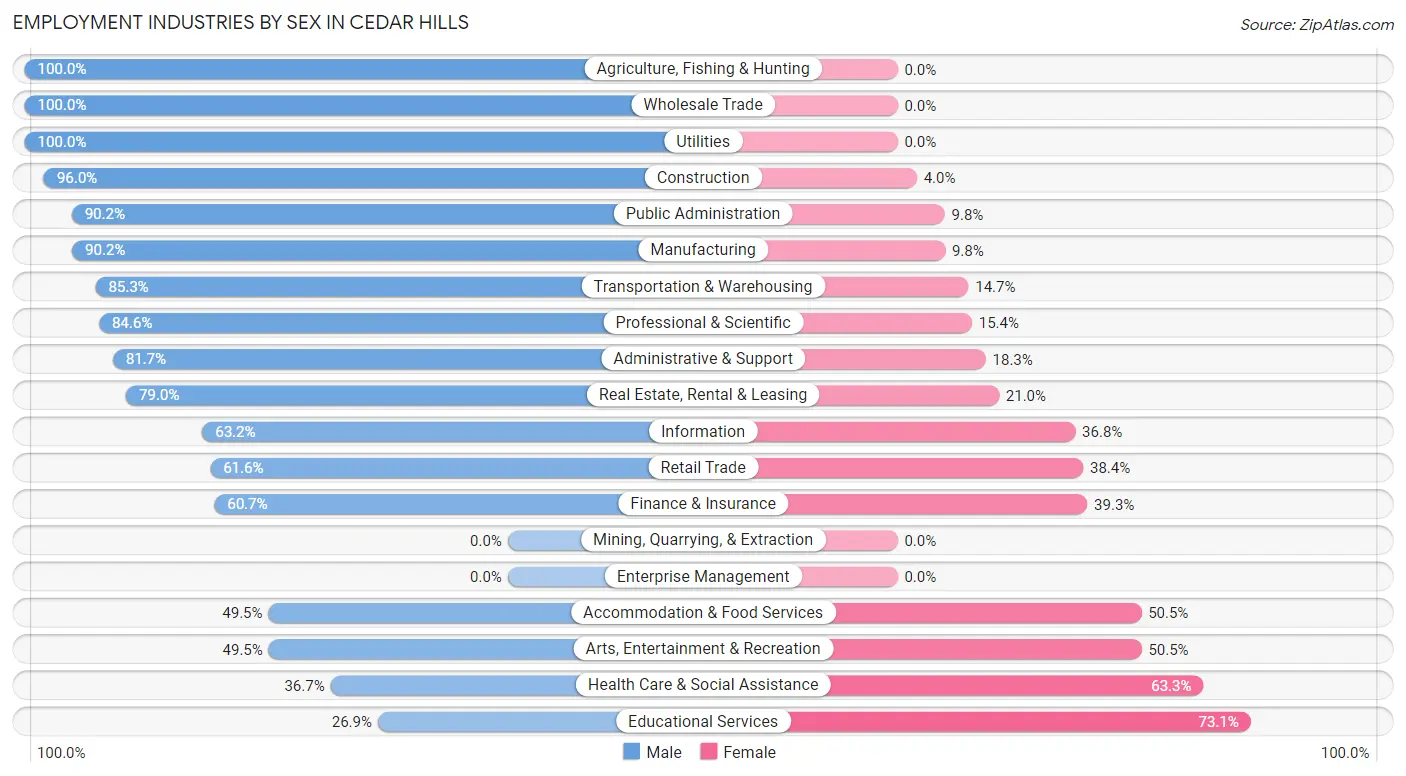
Employment Industries by Sex in Cedar Hills
The Cedar Hills industries that see more men than women are Agriculture, Fishing & Hunting (100.0%), Wholesale Trade (100.0%), and Utilities (100.0%), whereas the industries that tend to have a higher number of women are Educational Services (73.1%), Health Care & Social Assistance (63.3%), and Arts, Entertainment & Recreation (50.5%).
| Industry | Male | Female |
| Agriculture, Fishing & Hunting | 8 (100.0%) | 0 (0.0%) |
| Mining, Quarrying, & Extraction | 0 (0.0%) | 0 (0.0%) |
| Construction | 168 (96.0%) | 7 (4.0%) |
| Manufacturing | 174 (90.2%) | 19 (9.8%) |
| Wholesale Trade | 179 (100.0%) | 0 (0.0%) |
| Retail Trade | 500 (61.6%) | 312 (38.4%) |
| Transportation & Warehousing | 64 (85.3%) | 11 (14.7%) |
| Utilities | 23 (100.0%) | 0 (0.0%) |
| Information | 67 (63.2%) | 39 (36.8%) |
| Finance & Insurance | 133 (60.7%) | 86 (39.3%) |
| Real Estate, Rental & Leasing | 64 (79.0%) | 17 (21.0%) |
| Professional & Scientific | 566 (84.6%) | 103 (15.4%) |
| Enterprise Management | 0 (0.0%) | 0 (0.0%) |
| Administrative & Support | 179 (81.7%) | 40 (18.3%) |
| Educational Services | 139 (26.9%) | 378 (73.1%) |
| Health Care & Social Assistance | 182 (36.7%) | 314 (63.3%) |
| Arts, Entertainment & Recreation | 49 (49.5%) | 50 (50.5%) |
| Accommodation & Food Services | 107 (49.5%) | 109 (50.5%) |
| Public Administration | 74 (90.2%) | 8 (9.8%) |
| Total | 2,729 (63.8%) | 1,549 (36.2%) |
Education in Cedar Hills
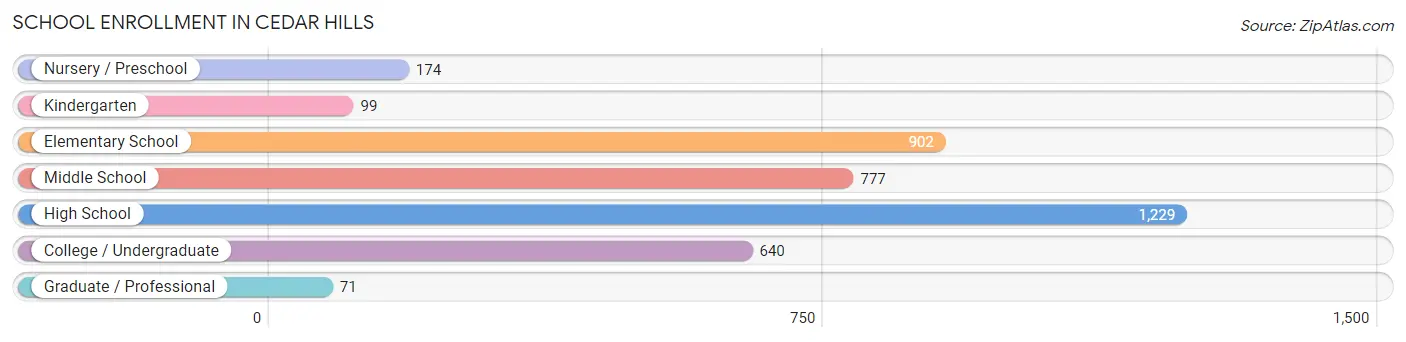
School Enrollment in Cedar Hills
The most common levels of schooling among the 3,892 students in Cedar Hills are high school (1,229 | 31.6%), elementary school (902 | 23.2%), and middle school (777 | 20.0%).
| School Level | # Students | % Students |
| Nursery / Preschool | 174 | 4.5% |
| Kindergarten | 99 | 2.5% |
| Elementary School | 902 | 23.2% |
| Middle School | 777 | 20.0% |
| High School | 1,229 | 31.6% |
| College / Undergraduate | 640 | 16.4% |
| Graduate / Professional | 71 | 1.8% |
| Total | 3,892 | 100.0% |
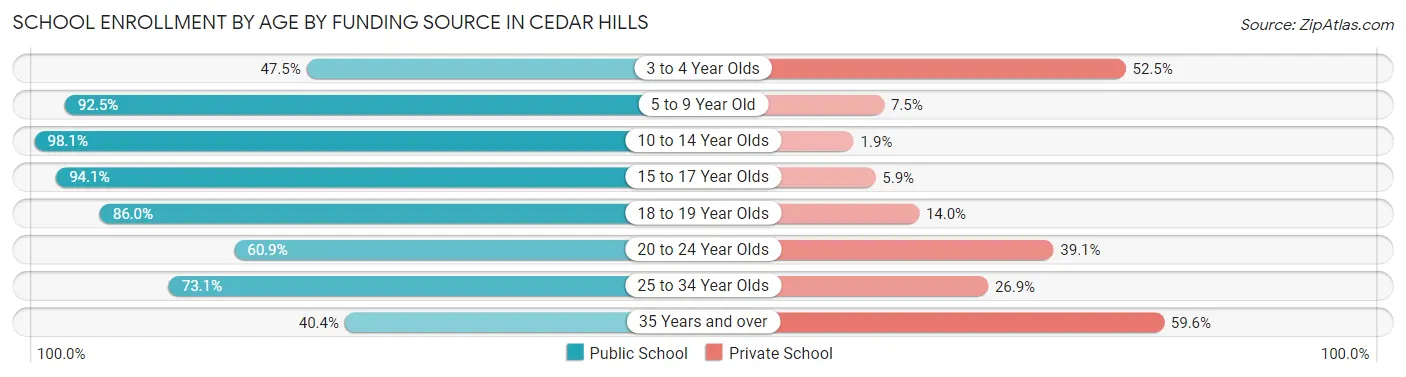
School Enrollment by Age by Funding Source in Cedar Hills
Out of a total of 3,892 students who are enrolled in schools in Cedar Hills, 537 (13.8%) attend a private institution, while the remaining 3,355 (86.2%) are enrolled in public schools. The age group of 35 years and over has the highest likelihood of being enrolled in private schools, with 167 (59.6% in the age bracket) enrolled. Conversely, the age group of 10 to 14 year olds has the lowest likelihood of being enrolled in a private school, with 898 (98.1% in the age bracket) attending a public institution.
| Age Bracket | Public School | Private School |
| 3 to 4 Year Olds | 38 (47.5%) | 42 (52.5%) |
| 5 to 9 Year Old | 948 (92.5%) | 77 (7.5%) |
| 10 to 14 Year Olds | 898 (98.1%) | 17 (1.9%) |
| 15 to 17 Year Olds | 829 (94.1%) | 52 (5.9%) |
| 18 to 19 Year Olds | 276 (86.0%) | 45 (14.0%) |
| 20 to 24 Year Olds | 156 (60.9%) | 100 (39.1%) |
| 25 to 34 Year Olds | 98 (73.1%) | 36 (26.9%) |
| 35 Years and over | 113 (40.4%) | 167 (59.6%) |
| Total | 3,355 (86.2%) | 537 (13.8%) |
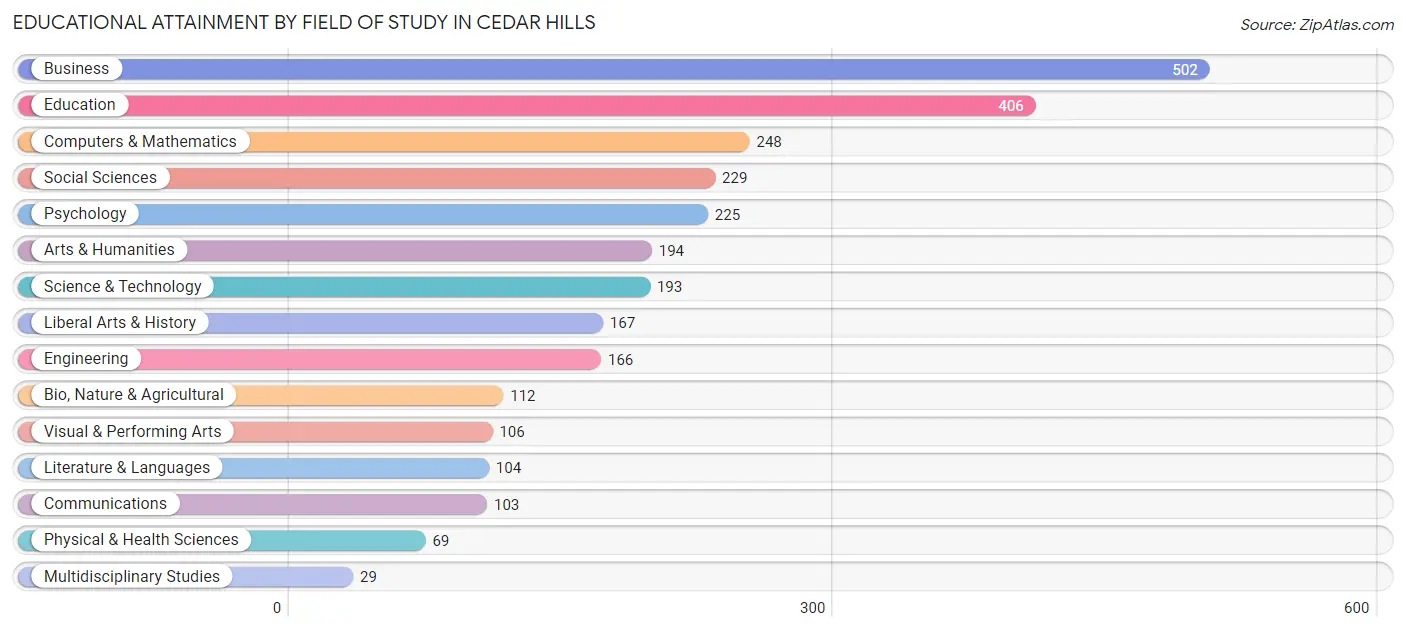
Educational Attainment by Field of Study in Cedar Hills
Business (502 | 17.6%), education (406 | 14.2%), computers & mathematics (248 | 8.7%), social sciences (229 | 8.0%), and psychology (225 | 7.9%) are the most common fields of study among 2,853 individuals in Cedar Hills who have obtained a bachelor's degree or higher.
| Field of Study | # Graduates | % Graduates |
| Computers & Mathematics | 248 | 8.7% |
| Bio, Nature & Agricultural | 112 | 3.9% |
| Physical & Health Sciences | 69 | 2.4% |
| Psychology | 225 | 7.9% |
| Social Sciences | 229 | 8.0% |
| Engineering | 166 | 5.8% |
| Multidisciplinary Studies | 29 | 1.0% |
| Science & Technology | 193 | 6.8% |
| Business | 502 | 17.6% |
| Education | 406 | 14.2% |
| Literature & Languages | 104 | 3.6% |
| Liberal Arts & History | 167 | 5.9% |
| Visual & Performing Arts | 106 | 3.7% |
| Communications | 103 | 3.6% |
| Arts & Humanities | 194 | 6.8% |
| Total | 2,853 | 100.0% |
Transportation & Commute in Cedar Hills
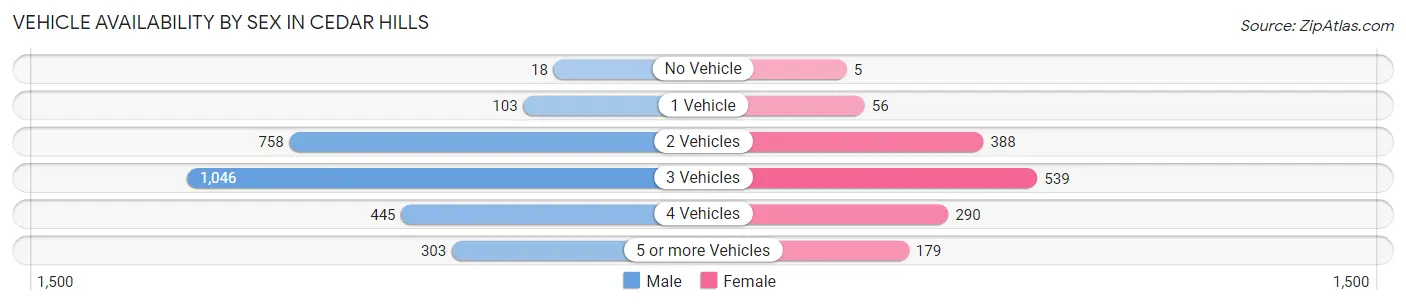
Vehicle Availability by Sex in Cedar Hills
The most prevalent vehicle ownership categories in Cedar Hills are males with 3 vehicles (1,046, accounting for 39.1%) and females with 3 vehicles (539, making up 71.8%).
| Vehicles Available | Male | Female |
| No Vehicle | 18 (0.7%) | 5 (0.3%) |
| 1 Vehicle | 103 (3.8%) | 56 (3.8%) |
| 2 Vehicles | 758 (28.4%) | 388 (26.6%) |
| 3 Vehicles | 1,046 (39.1%) | 539 (37.0%) |
| 4 Vehicles | 445 (16.7%) | 290 (19.9%) |
| 5 or more Vehicles | 303 (11.3%) | 179 (12.3%) |
| Total | 2,673 (100.0%) | 1,457 (100.0%) |
Commute Time in Cedar Hills
The most frequently occuring commute durations in Cedar Hills are 15 to 19 minutes (600 commuters, 18.4%), 10 to 14 minutes (507 commuters, 15.6%), and 30 to 34 minutes (438 commuters, 13.4%).
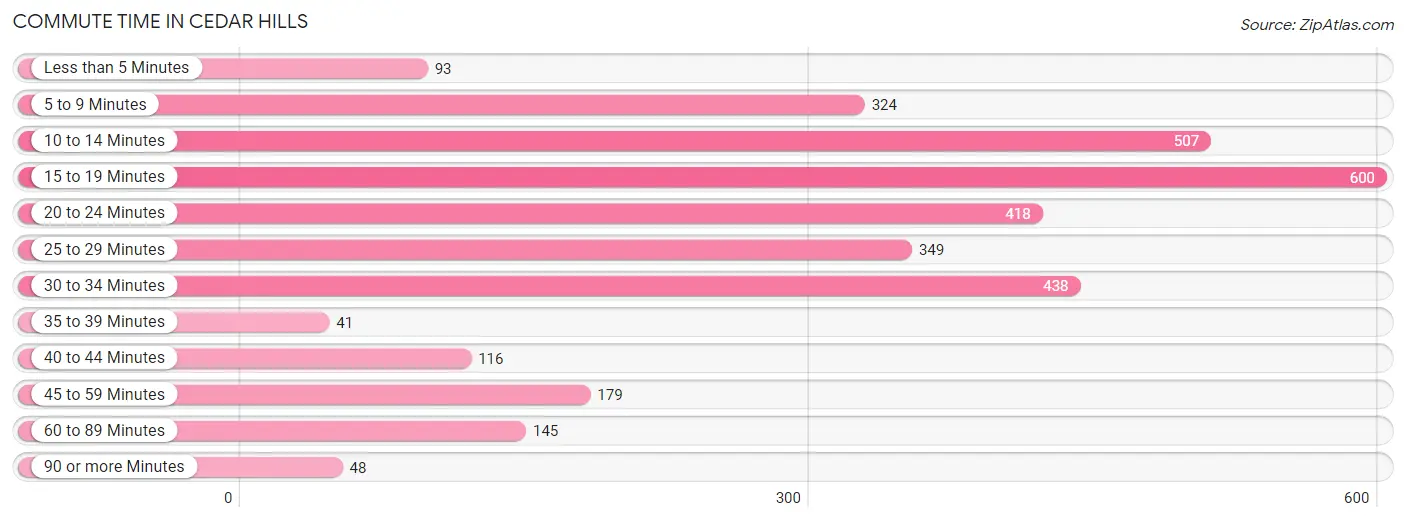
| Commute Time | # Commuters | % Commuters |
| Less than 5 Minutes | 93 | 2.9% |
| 5 to 9 Minutes | 324 | 9.9% |
| 10 to 14 Minutes | 507 | 15.6% |
| 15 to 19 Minutes | 600 | 18.4% |
| 20 to 24 Minutes | 418 | 12.8% |
| 25 to 29 Minutes | 349 | 10.7% |
| 30 to 34 Minutes | 438 | 13.4% |
| 35 to 39 Minutes | 41 | 1.3% |
| 40 to 44 Minutes | 116 | 3.6% |
| 45 to 59 Minutes | 179 | 5.5% |
| 60 to 89 Minutes | 145 | 4.4% |
| 90 or more Minutes | 48 | 1.5% |
Commute Time by Sex in Cedar Hills
The most common commute times in Cedar Hills are 15 to 19 minutes (345 commuters, 17.0%) for males and 15 to 19 minutes (255 commuters, 20.8%) for females.
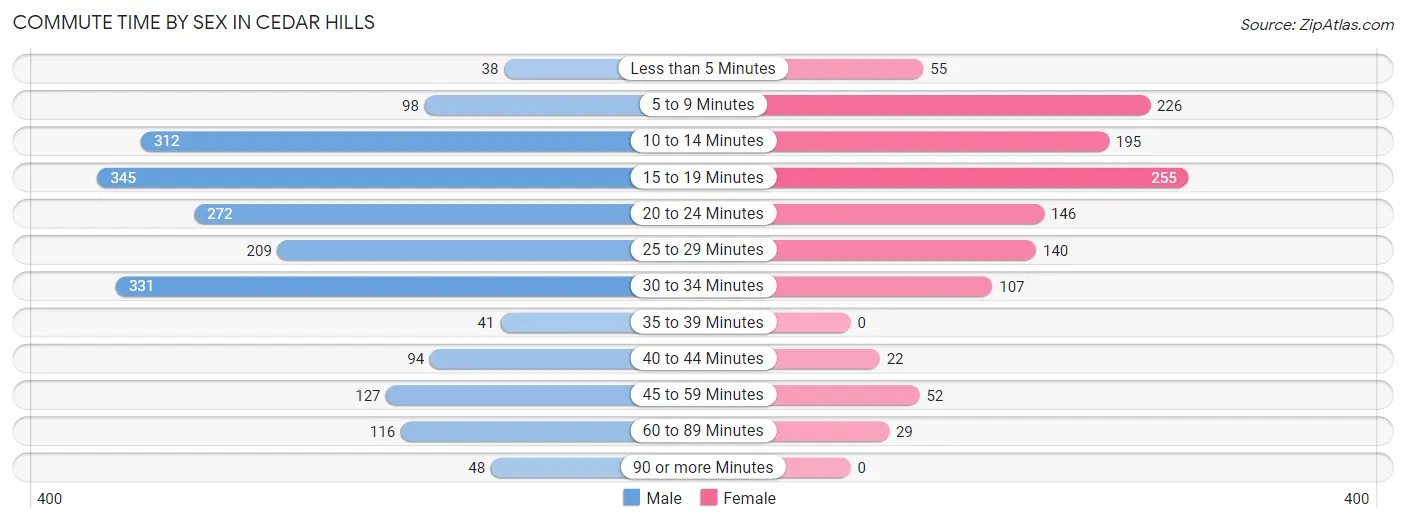
| Commute Time | Male | Female |
| Less than 5 Minutes | 38 (1.9%) | 55 (4.5%) |
| 5 to 9 Minutes | 98 (4.8%) | 226 (18.4%) |
| 10 to 14 Minutes | 312 (15.4%) | 195 (15.9%) |
| 15 to 19 Minutes | 345 (17.0%) | 255 (20.8%) |
| 20 to 24 Minutes | 272 (13.4%) | 146 (11.9%) |
| 25 to 29 Minutes | 209 (10.3%) | 140 (11.4%) |
| 30 to 34 Minutes | 331 (16.3%) | 107 (8.7%) |
| 35 to 39 Minutes | 41 (2.0%) | 0 (0.0%) |
| 40 to 44 Minutes | 94 (4.6%) | 22 (1.8%) |
| 45 to 59 Minutes | 127 (6.2%) | 52 (4.2%) |
| 60 to 89 Minutes | 116 (5.7%) | 29 (2.4%) |
| 90 or more Minutes | 48 (2.4%) | 0 (0.0%) |
Time of Departure to Work by Sex in Cedar Hills
The most frequent times of departure to work in Cedar Hills are 9:00 AM to 9:59 AM (256, 12.6%) for males and 7:30 AM to 7:59 AM (372, 30.3%) for females.
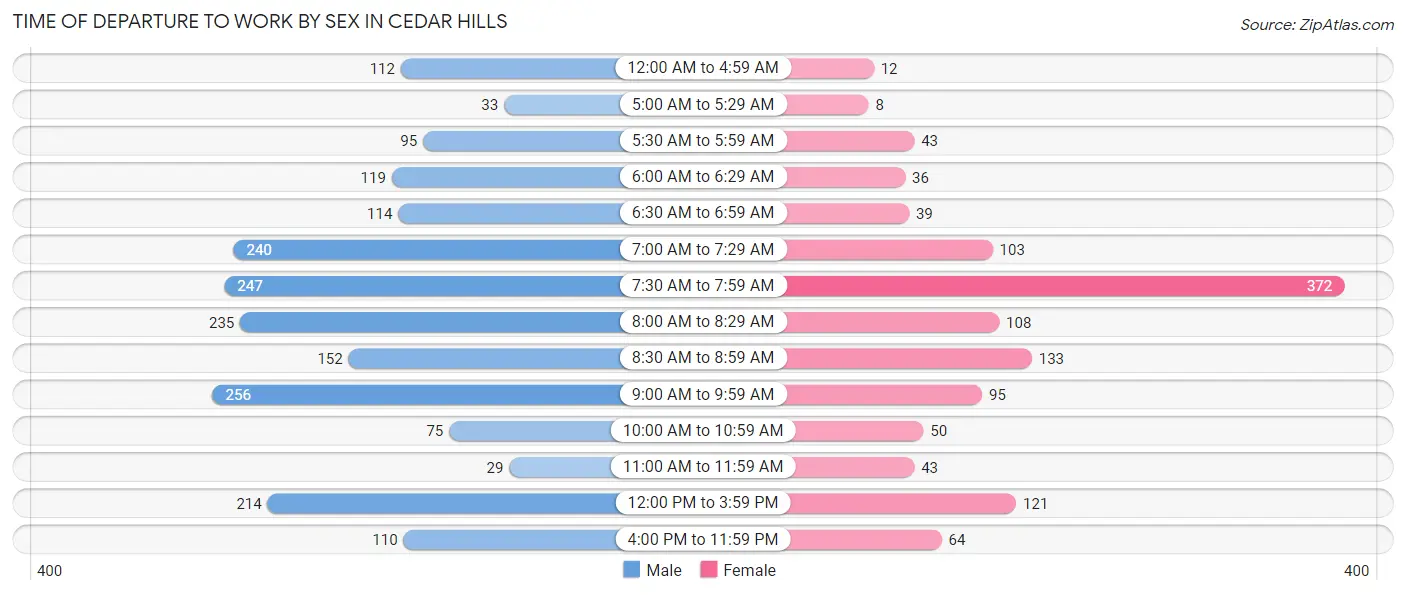
| Time of Departure | Male | Female |
| 12:00 AM to 4:59 AM | 112 (5.5%) | 12 (1.0%) |
| 5:00 AM to 5:29 AM | 33 (1.6%) | 8 (0.6%) |
| 5:30 AM to 5:59 AM | 95 (4.7%) | 43 (3.5%) |
| 6:00 AM to 6:29 AM | 119 (5.9%) | 36 (2.9%) |
| 6:30 AM to 6:59 AM | 114 (5.6%) | 39 (3.2%) |
| 7:00 AM to 7:29 AM | 240 (11.8%) | 103 (8.4%) |
| 7:30 AM to 7:59 AM | 247 (12.2%) | 372 (30.3%) |
| 8:00 AM to 8:29 AM | 235 (11.6%) | 108 (8.8%) |
| 8:30 AM to 8:59 AM | 152 (7.5%) | 133 (10.8%) |
| 9:00 AM to 9:59 AM | 256 (12.6%) | 95 (7.7%) |
| 10:00 AM to 10:59 AM | 75 (3.7%) | 50 (4.1%) |
| 11:00 AM to 11:59 AM | 29 (1.4%) | 43 (3.5%) |
| 12:00 PM to 3:59 PM | 214 (10.5%) | 121 (9.9%) |
| 4:00 PM to 11:59 PM | 110 (5.4%) | 64 (5.2%) |
| Total | 2,031 (100.0%) | 1,227 (100.0%) |
Housing Occupancy in Cedar Hills
Occupancy by Ownership in Cedar Hills
Of the total 2,467 dwellings in Cedar Hills, owner-occupied units account for 2,130 (86.3%), while renter-occupied units make up 337 (13.7%).
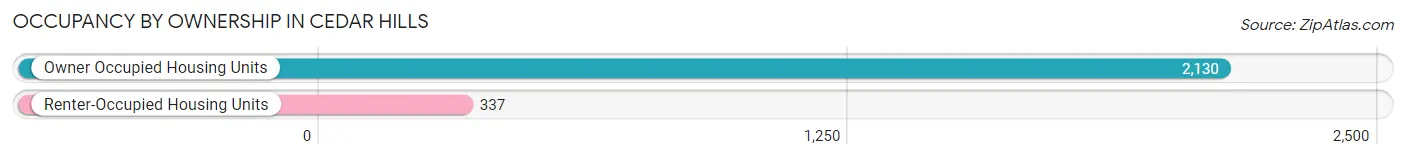
| Occupancy | # Housing Units | % Housing Units |
| Owner Occupied Housing Units | 2,130 | 86.3% |
| Renter-Occupied Housing Units | 337 | 13.7% |
| Total Occupied Housing Units | 2,467 | 100.0% |
Occupancy by Household Size in Cedar Hills
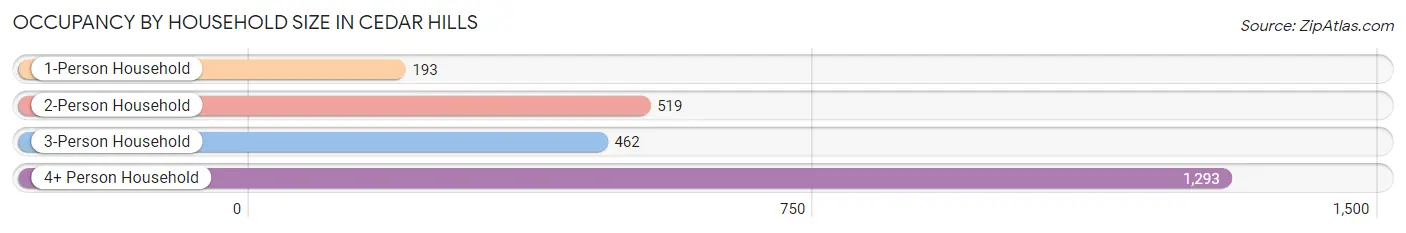
| Household Size | # Housing Units | % Housing Units |
| 1-Person Household | 193 | 7.8% |
| 2-Person Household | 519 | 21.0% |
| 3-Person Household | 462 | 18.7% |
| 4+ Person Household | 1,293 | 52.4% |
| Total Housing Units | 2,467 | 100.0% |
Occupancy by Ownership by Household Size in Cedar Hills
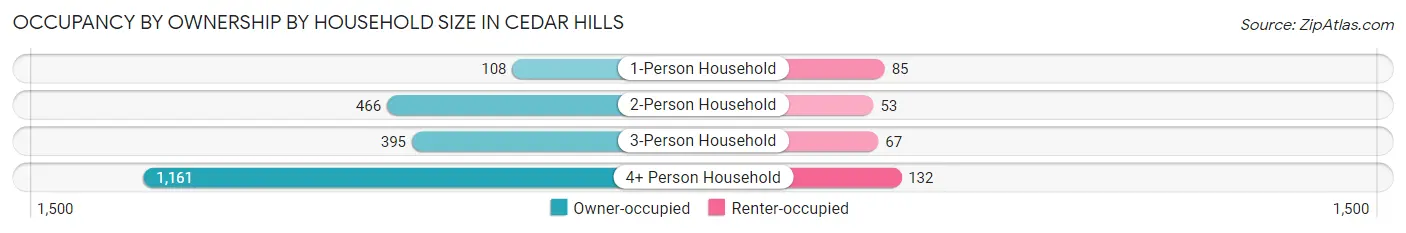
| Household Size | Owner-occupied | Renter-occupied |
| 1-Person Household | 108 (56.0%) | 85 (44.0%) |
| 2-Person Household | 466 (89.8%) | 53 (10.2%) |
| 3-Person Household | 395 (85.5%) | 67 (14.5%) |
| 4+ Person Household | 1,161 (89.8%) | 132 (10.2%) |
| Total Housing Units | 2,130 (86.3%) | 337 (13.7%) |
Occupancy by Educational Attainment in Cedar Hills
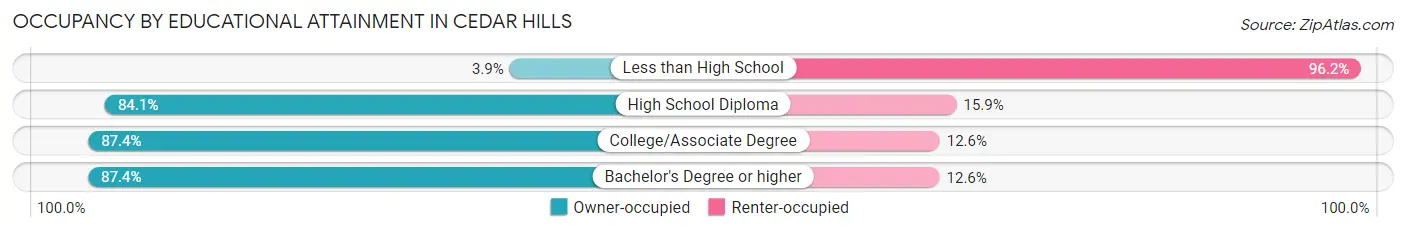
| Household Size | Owner-occupied | Renter-occupied |
| Less than High School | 1 (3.8%) | 25 (96.2%) |
| High School Diploma | 116 (84.1%) | 22 (15.9%) |
| College/Associate Degree | 658 (87.4%) | 95 (12.6%) |
| Bachelor's Degree or higher | 1,355 (87.4%) | 195 (12.6%) |
Occupancy by Age of Householder in Cedar Hills
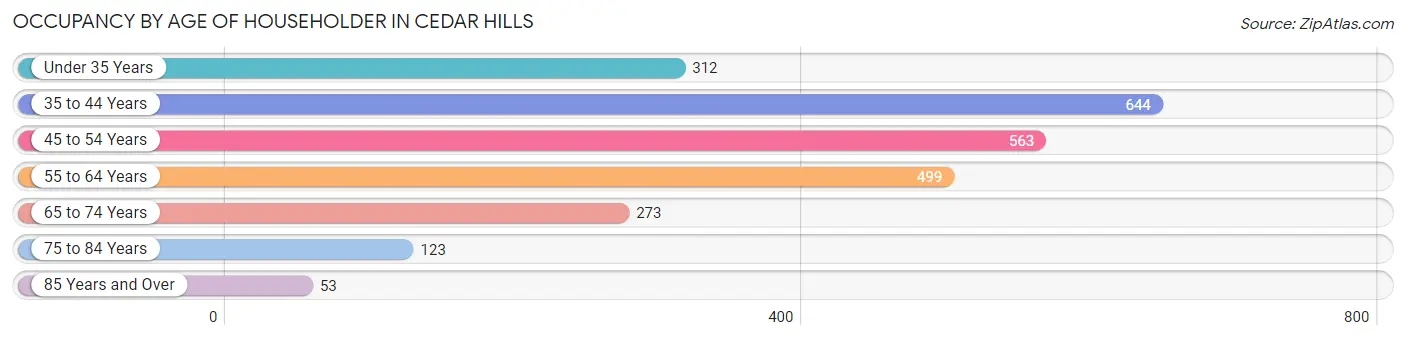
| Age Bracket | # Households | % Households |
| Under 35 Years | 312 | 12.7% |
| 35 to 44 Years | 644 | 26.1% |
| 45 to 54 Years | 563 | 22.8% |
| 55 to 64 Years | 499 | 20.2% |
| 65 to 74 Years | 273 | 11.1% |
| 75 to 84 Years | 123 | 5.0% |
| 85 Years and Over | 53 | 2.1% |
| Total | 2,467 | 100.0% |
Housing Finances in Cedar Hills
Median Income by Occupancy in Cedar Hills
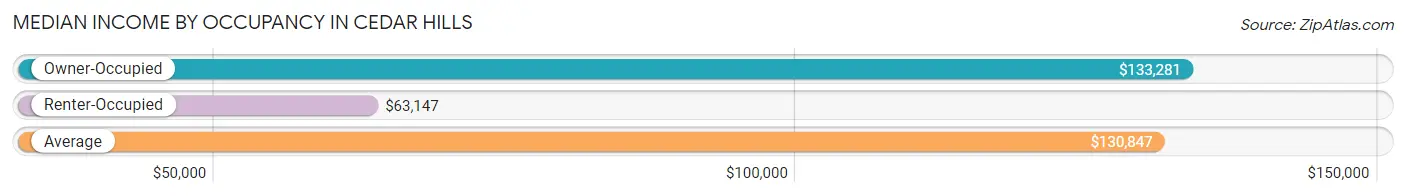
| Occupancy Type | # Households | Median Income |
| Owner-Occupied | 2,130 (86.3%) | $133,281 |
| Renter-Occupied | 337 (13.7%) | $63,147 |
| Average | 2,467 (100.0%) | $130,847 |
Occupancy by Householder Income Bracket in Cedar Hills
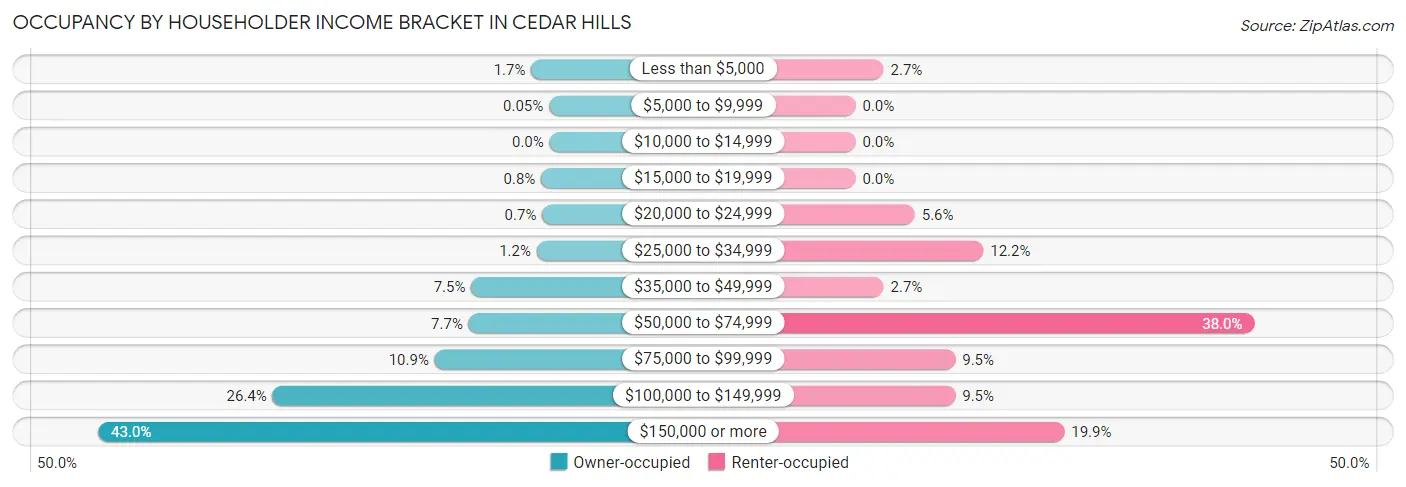
| Income Bracket | Owner-occupied | Renter-occupied |
| Less than $5,000 | 37 (1.7%) | 9 (2.7%) |
| $5,000 to $9,999 | 1 (0.1%) | 0 (0.0%) |
| $10,000 to $14,999 | 0 (0.0%) | 0 (0.0%) |
| $15,000 to $19,999 | 17 (0.8%) | 0 (0.0%) |
| $20,000 to $24,999 | 15 (0.7%) | 19 (5.6%) |
| $25,000 to $34,999 | 26 (1.2%) | 41 (12.2%) |
| $35,000 to $49,999 | 159 (7.5%) | 9 (2.7%) |
| $50,000 to $74,999 | 164 (7.7%) | 128 (38.0%) |
| $75,000 to $99,999 | 233 (10.9%) | 32 (9.5%) |
| $100,000 to $149,999 | 562 (26.4%) | 32 (9.5%) |
| $150,000 or more | 916 (43.0%) | 67 (19.9%) |
| Total | 2,130 (100.0%) | 337 (100.0%) |
Monthly Housing Cost Tiers in Cedar Hills
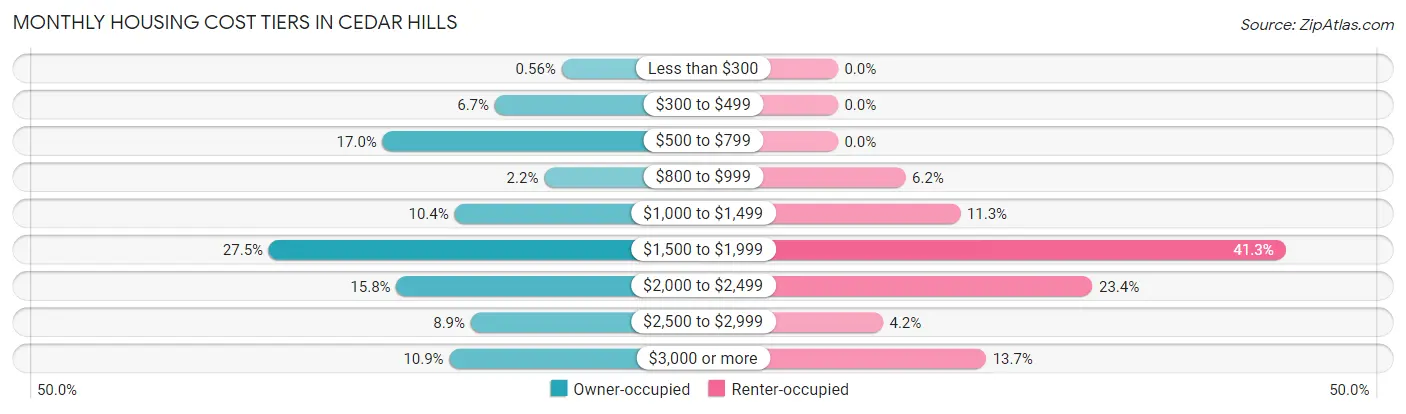
| Monthly Cost | Owner-occupied | Renter-occupied |
| Less than $300 | 12 (0.6%) | 0 (0.0%) |
| $300 to $499 | 143 (6.7%) | 0 (0.0%) |
| $500 to $799 | 363 (17.0%) | 0 (0.0%) |
| $800 to $999 | 46 (2.2%) | 21 (6.2%) |
| $1,000 to $1,499 | 222 (10.4%) | 38 (11.3%) |
| $1,500 to $1,999 | 586 (27.5%) | 139 (41.2%) |
| $2,000 to $2,499 | 336 (15.8%) | 79 (23.4%) |
| $2,500 to $2,999 | 190 (8.9%) | 14 (4.2%) |
| $3,000 or more | 232 (10.9%) | 46 (13.7%) |
| Total | 2,130 (100.0%) | 337 (100.0%) |
Physical Housing Characteristics in Cedar Hills
Housing Structures in Cedar Hills
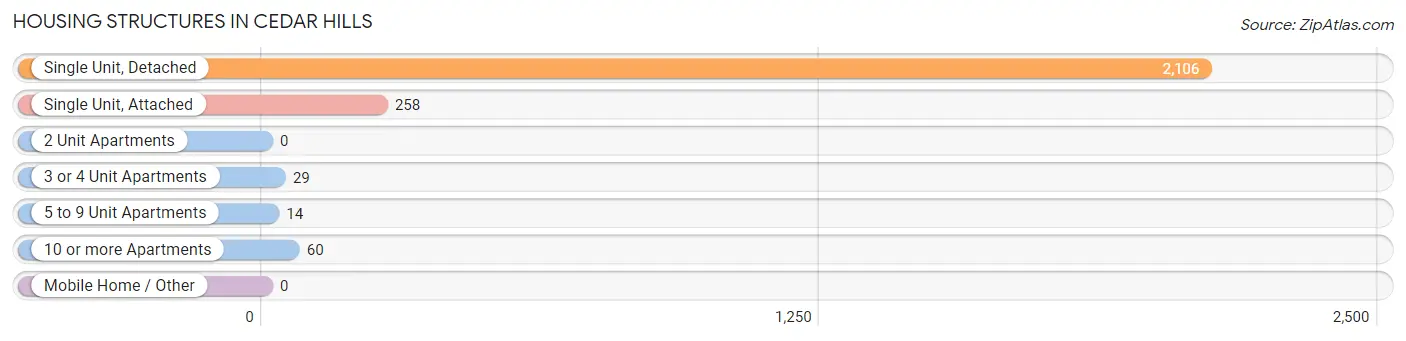
| Structure Type | # Housing Units | % Housing Units |
| Single Unit, Detached | 2,106 | 85.4% |
| Single Unit, Attached | 258 | 10.5% |
| 2 Unit Apartments | 0 | 0.0% |
| 3 or 4 Unit Apartments | 29 | 1.2% |
| 5 to 9 Unit Apartments | 14 | 0.6% |
| 10 or more Apartments | 60 | 2.4% |
| Mobile Home / Other | 0 | 0.0% |
| Total | 2,467 | 100.0% |
Housing Structures by Occupancy in Cedar Hills
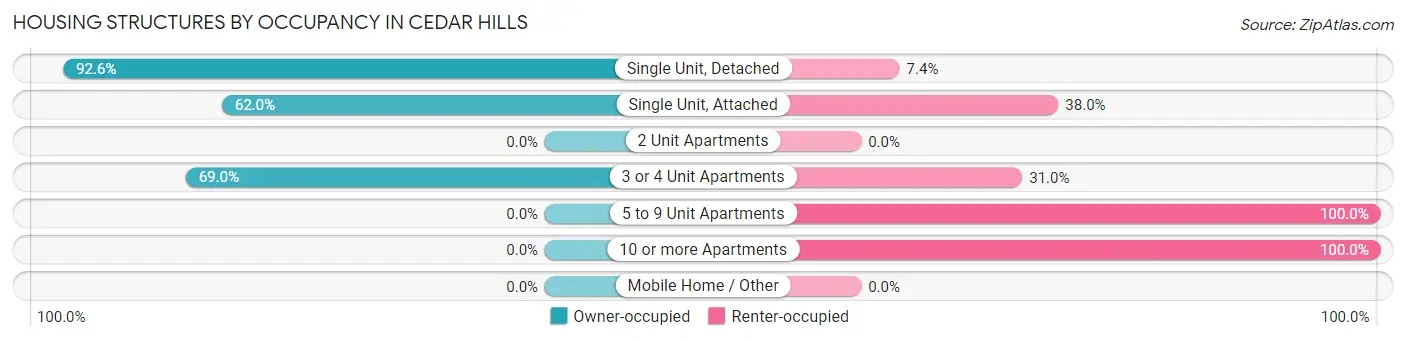
| Structure Type | Owner-occupied | Renter-occupied |
| Single Unit, Detached | 1,950 (92.6%) | 156 (7.4%) |
| Single Unit, Attached | 160 (62.0%) | 98 (38.0%) |
| 2 Unit Apartments | 0 (0.0%) | 0 (0.0%) |
| 3 or 4 Unit Apartments | 20 (69.0%) | 9 (31.0%) |
| 5 to 9 Unit Apartments | 0 (0.0%) | 14 (100.0%) |
| 10 or more Apartments | 0 (0.0%) | 60 (100.0%) |
| Mobile Home / Other | 0 (0.0%) | 0 (0.0%) |
| Total | 2,130 (86.3%) | 337 (13.7%) |
Housing Structures by Number of Rooms in Cedar Hills
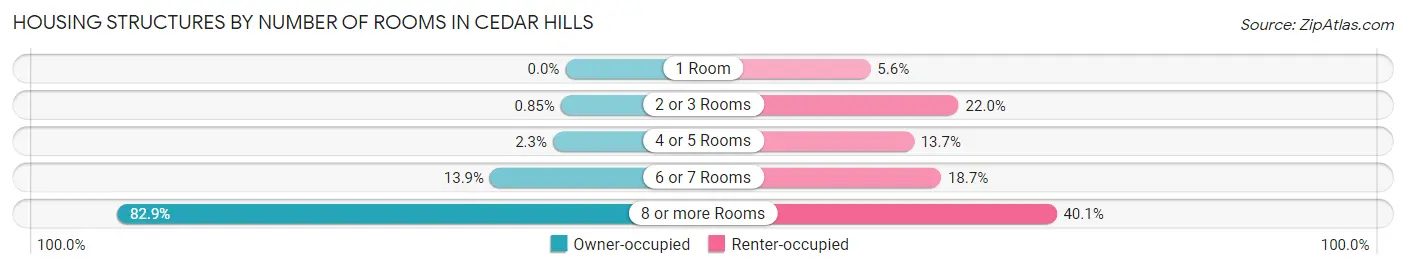
| Number of Rooms | Owner-occupied | Renter-occupied |
| 1 Room | 0 (0.0%) | 19 (5.6%) |
| 2 or 3 Rooms | 18 (0.9%) | 74 (22.0%) |
| 4 or 5 Rooms | 49 (2.3%) | 46 (13.7%) |
| 6 or 7 Rooms | 297 (13.9%) | 63 (18.7%) |
| 8 or more Rooms | 1,766 (82.9%) | 135 (40.1%) |
| Total | 2,130 (100.0%) | 337 (100.0%) |
Housing Structure by Heating Type in Cedar Hills
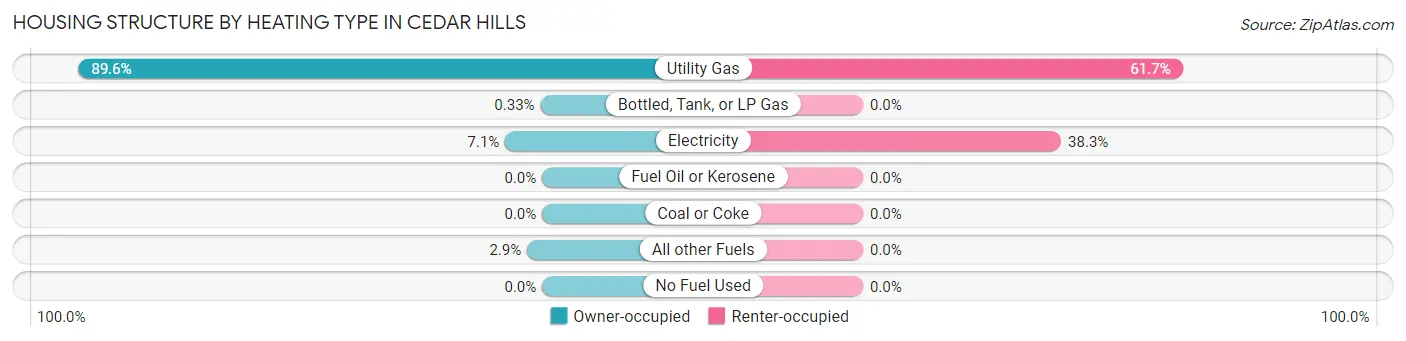
| Heating Type | Owner-occupied | Renter-occupied |
| Utility Gas | 1,909 (89.6%) | 208 (61.7%) |
| Bottled, Tank, or LP Gas | 7 (0.3%) | 0 (0.0%) |
| Electricity | 152 (7.1%) | 129 (38.3%) |
| Fuel Oil or Kerosene | 0 (0.0%) | 0 (0.0%) |
| Coal or Coke | 0 (0.0%) | 0 (0.0%) |
| All other Fuels | 62 (2.9%) | 0 (0.0%) |
| No Fuel Used | 0 (0.0%) | 0 (0.0%) |
| Total | 2,130 (100.0%) | 337 (100.0%) |
Household Vehicle Usage in Cedar Hills
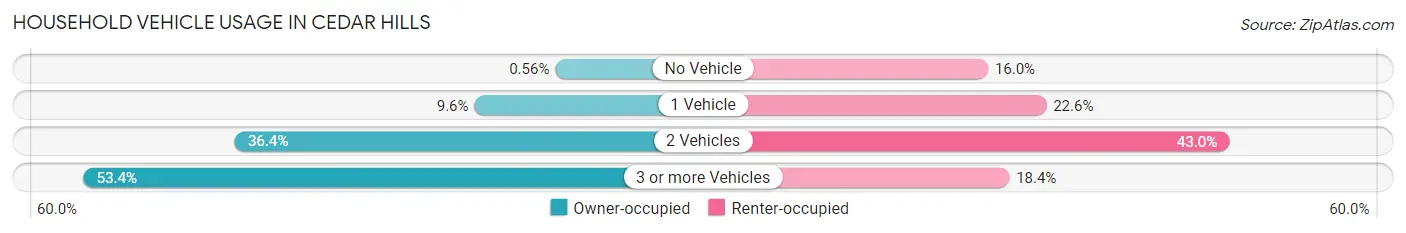
| Vehicles per Household | Owner-occupied | Renter-occupied |
| No Vehicle | 12 (0.6%) | 54 (16.0%) |
| 1 Vehicle | 205 (9.6%) | 76 (22.6%) |
| 2 Vehicles | 776 (36.4%) | 145 (43.0%) |
| 3 or more Vehicles | 1,137 (53.4%) | 62 (18.4%) |
| Total | 2,130 (100.0%) | 337 (100.0%) |
Real Estate & Mortgages in Cedar Hills
Real Estate and Mortgage Overview in Cedar Hills
| Characteristic | Without Mortgage | With Mortgage |
| Housing Units | 582 | 1,548 |
| Median Property Value | $577,800 | $551,400 |
| Median Household Income | $80,417 | $742 |
| Monthly Housing Costs | $563 | $232 |
| Real Estate Taxes | $2,487 | $27 |
Property Value by Mortgage Status in Cedar Hills
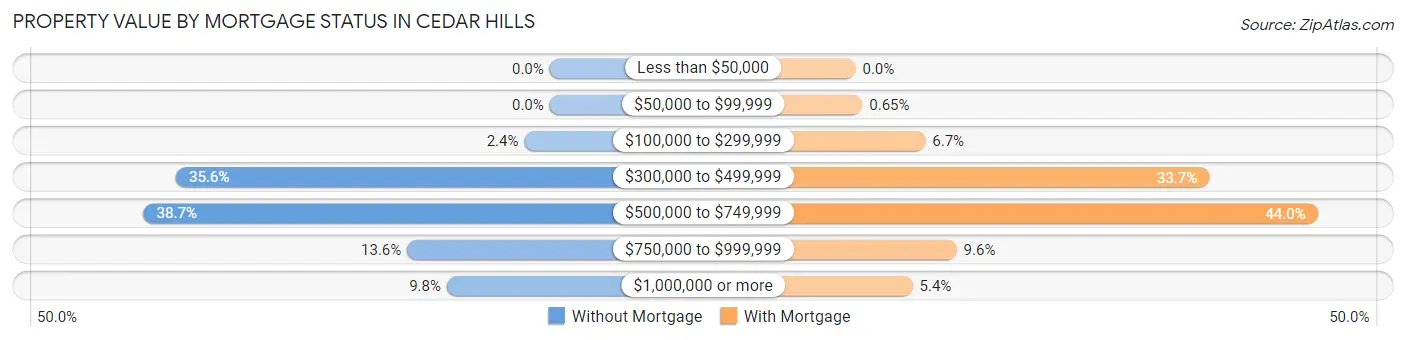
| Property Value | Without Mortgage | With Mortgage |
| Less than $50,000 | 0 (0.0%) | 0 (0.0%) |
| $50,000 to $99,999 | 0 (0.0%) | 10 (0.6%) |
| $100,000 to $299,999 | 14 (2.4%) | 103 (6.7%) |
| $300,000 to $499,999 | 207 (35.6%) | 521 (33.7%) |
| $500,000 to $749,999 | 225 (38.7%) | 681 (44.0%) |
| $750,000 to $999,999 | 79 (13.6%) | 149 (9.6%) |
| $1,000,000 or more | 57 (9.8%) | 84 (5.4%) |
| Total | 582 (100.0%) | 1,548 (100.0%) |
Household Income by Mortgage Status in Cedar Hills
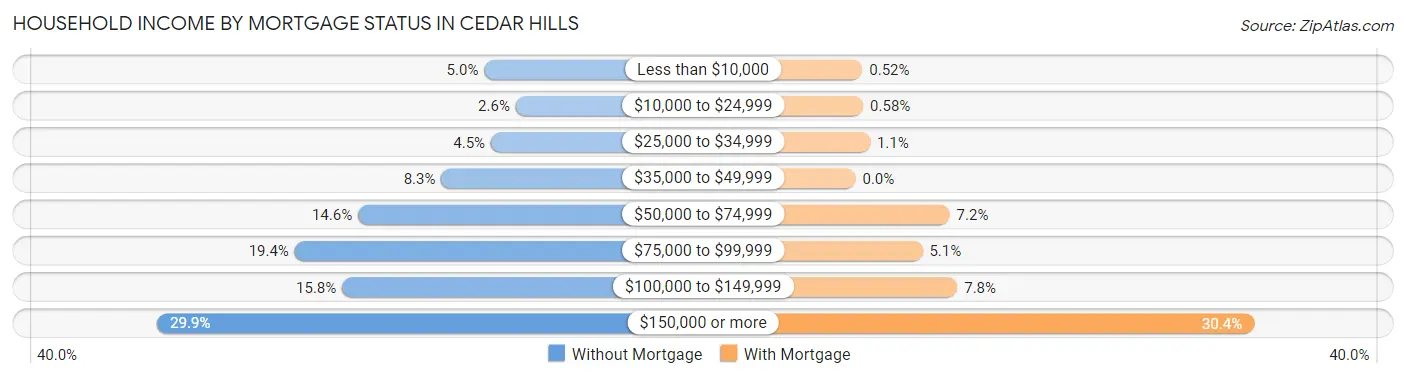
| Household Income | Without Mortgage | With Mortgage |
| Less than $10,000 | 29 (5.0%) | 8 (0.5%) |
| $10,000 to $24,999 | 15 (2.6%) | 9 (0.6%) |
| $25,000 to $34,999 | 26 (4.5%) | 17 (1.1%) |
| $35,000 to $49,999 | 48 (8.3%) | 0 (0.0%) |
| $50,000 to $74,999 | 85 (14.6%) | 111 (7.2%) |
| $75,000 to $99,999 | 113 (19.4%) | 79 (5.1%) |
| $100,000 to $149,999 | 92 (15.8%) | 120 (7.7%) |
| $150,000 or more | 174 (29.9%) | 470 (30.4%) |
| Total | 582 (100.0%) | 1,548 (100.0%) |
Property Value to Household Income Ratio in Cedar Hills
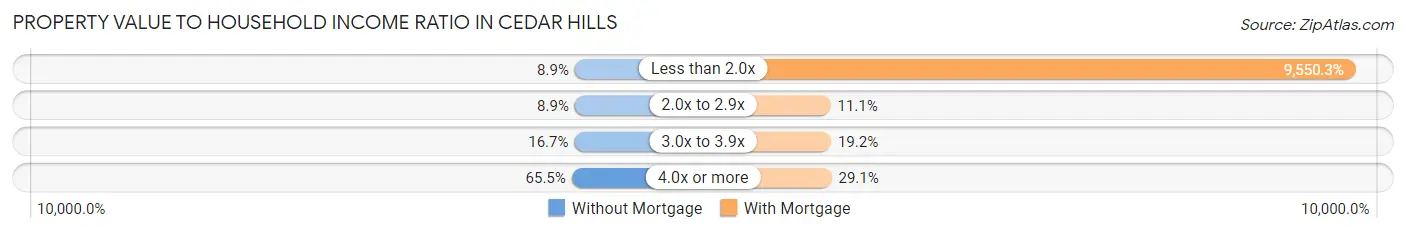
| Value-to-Income Ratio | Without Mortgage | With Mortgage |
| Less than 2.0x | 52 (8.9%) | 147,838 (9,550.3%) |
| 2.0x to 2.9x | 52 (8.9%) | 171 (11.1%) |
| 3.0x to 3.9x | 97 (16.7%) | 297 (19.2%) |
| 4.0x or more | 381 (65.5%) | 450 (29.1%) |
| Total | 582 (100.0%) | 1,548 (100.0%) |
Real Estate Taxes by Mortgage Status in Cedar Hills
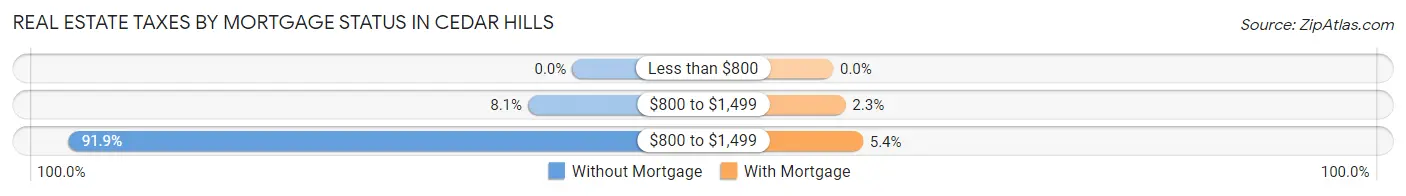
| Property Taxes | Without Mortgage | With Mortgage |
| Less than $800 | 0 (0.0%) | 0 (0.0%) |
| $800 to $1,499 | 47 (8.1%) | 35 (2.3%) |
| $800 to $1,499 | 535 (91.9%) | 84 (5.4%) |
| Total | 582 (100.0%) | 1,548 (100.0%) |
Health & Disability in Cedar Hills
Health Insurance Coverage by Age in Cedar Hills
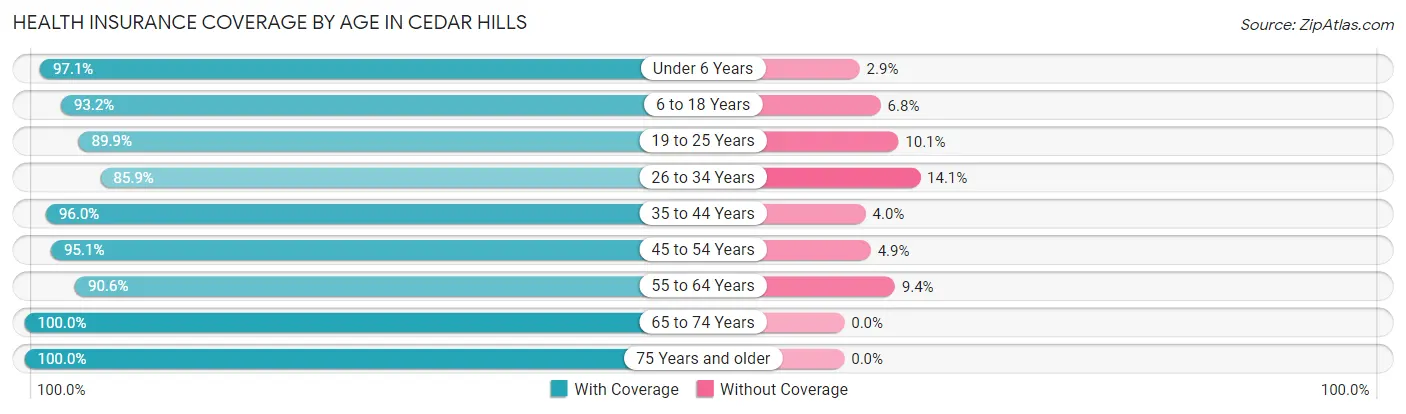
| Age Bracket | With Coverage | Without Coverage |
| Under 6 Years | 1,014 (97.1%) | 30 (2.9%) |
| 6 to 18 Years | 2,789 (93.2%) | 203 (6.8%) |
| 19 to 25 Years | 990 (89.9%) | 111 (10.1%) |
| 26 to 34 Years | 595 (85.9%) | 98 (14.1%) |
| 35 to 44 Years | 1,302 (96.0%) | 54 (4.0%) |
| 45 to 54 Years | 1,061 (95.1%) | 55 (4.9%) |
| 55 to 64 Years | 760 (90.6%) | 79 (9.4%) |
| 65 to 74 Years | 507 (100.0%) | 0 (0.0%) |
| 75 Years and older | 328 (100.0%) | 0 (0.0%) |
| Total | 9,346 (93.7%) | 630 (6.3%) |
Health Insurance Coverage by Citizenship Status in Cedar Hills
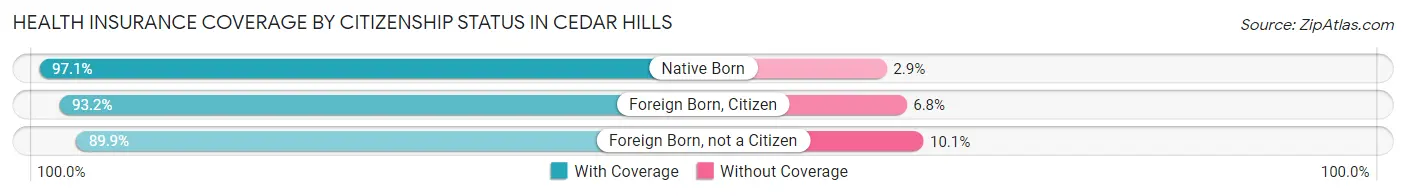
| Citizenship Status | With Coverage | Without Coverage |
| Native Born | 1,014 (97.1%) | 30 (2.9%) |
| Foreign Born, Citizen | 2,789 (93.2%) | 203 (6.8%) |
| Foreign Born, not a Citizen | 990 (89.9%) | 111 (10.1%) |
Health Insurance Coverage by Household Income in Cedar Hills
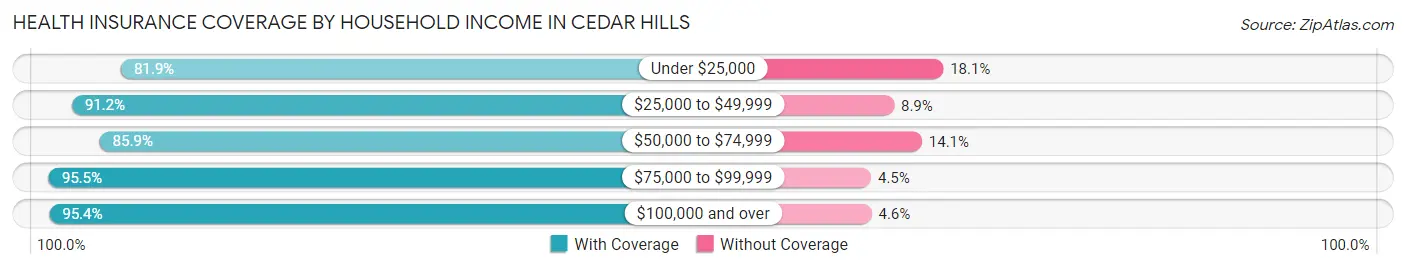
| Household Income | With Coverage | Without Coverage |
| Under $25,000 | 236 (81.9%) | 52 (18.1%) |
| $25,000 to $49,999 | 659 (91.1%) | 64 (8.8%) |
| $50,000 to $74,999 | 911 (85.9%) | 149 (14.1%) |
| $75,000 to $99,999 | 757 (95.5%) | 36 (4.5%) |
| $100,000 and over | 6,783 (95.4%) | 329 (4.6%) |
Public vs Private Health Insurance Coverage by Age in Cedar Hills
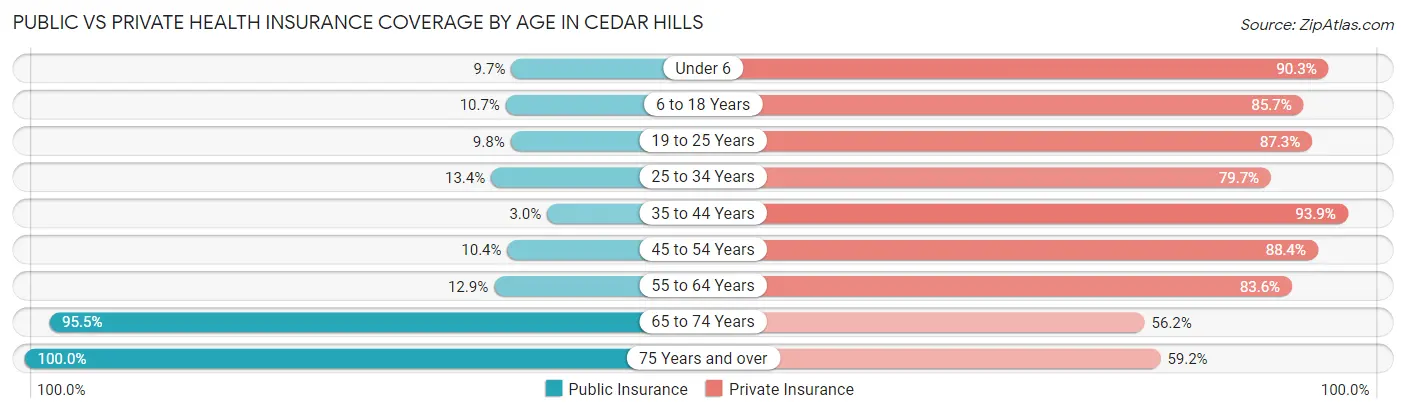
| Age Bracket | Public Insurance | Private Insurance |
| Under 6 | 101 (9.7%) | 943 (90.3%) |
| 6 to 18 Years | 320 (10.7%) | 2,564 (85.7%) |
| 19 to 25 Years | 108 (9.8%) | 961 (87.3%) |
| 25 to 34 Years | 93 (13.4%) | 552 (79.6%) |
| 35 to 44 Years | 41 (3.0%) | 1,273 (93.9%) |
| 45 to 54 Years | 116 (10.4%) | 986 (88.3%) |
| 55 to 64 Years | 108 (12.9%) | 701 (83.6%) |
| 65 to 74 Years | 484 (95.5%) | 285 (56.2%) |
| 75 Years and over | 328 (100.0%) | 194 (59.2%) |
| Total | 1,699 (17.0%) | 8,459 (84.8%) |
Disability Status by Sex by Age in Cedar Hills
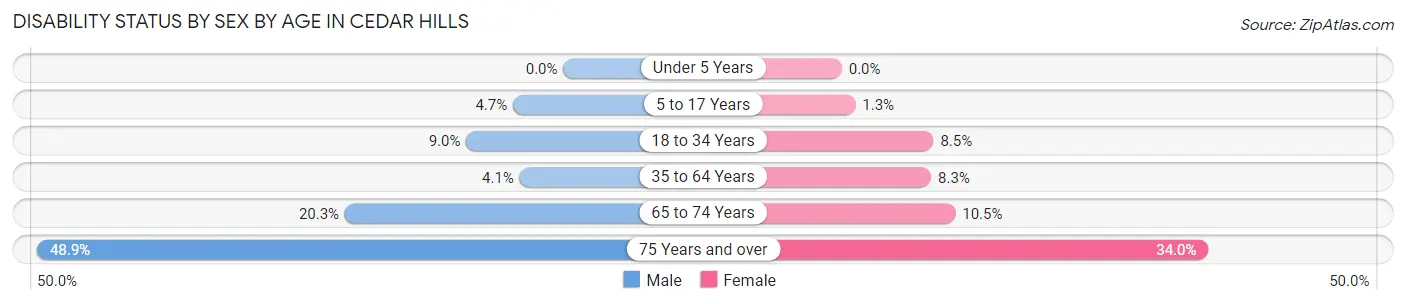
| Age Bracket | Male | Female |
| Under 5 Years | 0 (0.0%) | 0 (0.0%) |
| 5 to 17 Years | 65 (4.7%) | 19 (1.3%) |
| 18 to 34 Years | 107 (9.0%) | 77 (8.5%) |
| 35 to 64 Years | 71 (4.1%) | 129 (8.3%) |
| 65 to 74 Years | 45 (20.3%) | 30 (10.5%) |
| 75 Years and over | 64 (48.8%) | 67 (34.0%) |
Disability Class by Sex by Age in Cedar Hills
Disability Class: Hearing Difficulty
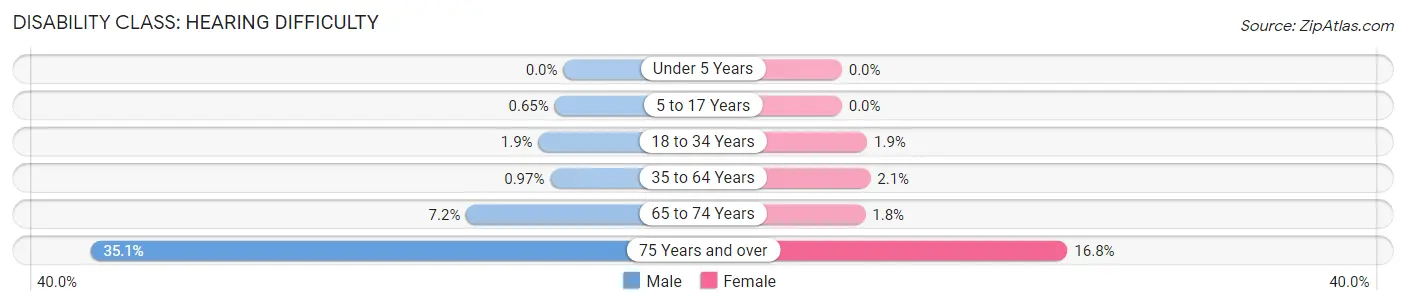
| Age Bracket | Male | Female |
| Under 5 Years | 0 (0.0%) | 0 (0.0%) |
| 5 to 17 Years | 9 (0.6%) | 0 (0.0%) |
| 18 to 34 Years | 22 (1.8%) | 17 (1.9%) |
| 35 to 64 Years | 17 (1.0%) | 33 (2.1%) |
| 65 to 74 Years | 16 (7.2%) | 5 (1.8%) |
| 75 Years and over | 46 (35.1%) | 33 (16.8%) |
Disability Class: Vision Difficulty
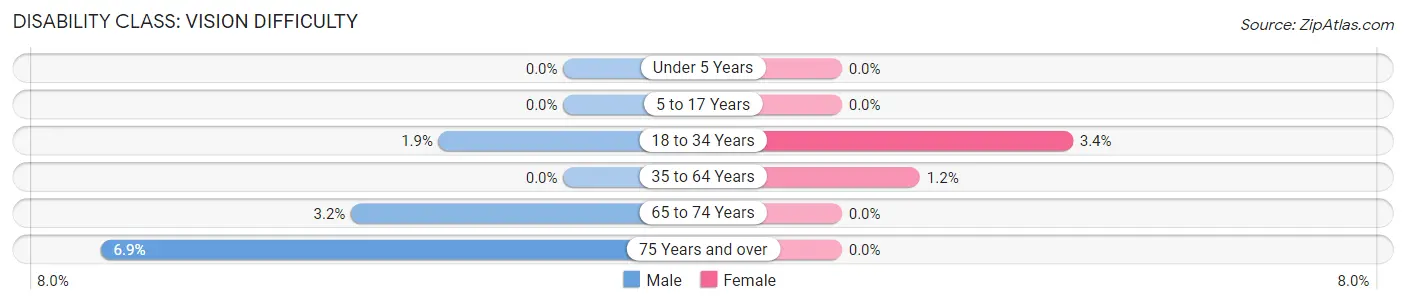
| Age Bracket | Male | Female |
| Under 5 Years | 0 (0.0%) | 0 (0.0%) |
| 5 to 17 Years | 0 (0.0%) | 0 (0.0%) |
| 18 to 34 Years | 22 (1.8%) | 31 (3.4%) |
| 35 to 64 Years | 0 (0.0%) | 18 (1.2%) |
| 65 to 74 Years | 7 (3.2%) | 0 (0.0%) |
| 75 Years and over | 9 (6.9%) | 0 (0.0%) |
Disability Class: Cognitive Difficulty
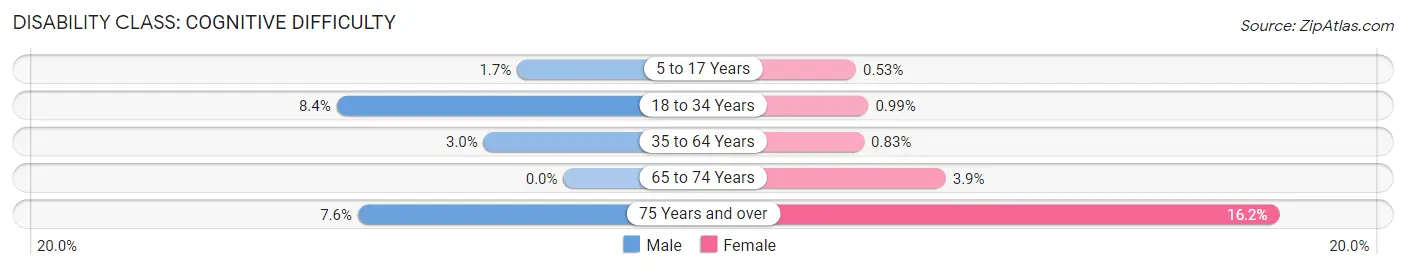
| Age Bracket | Male | Female |
| 5 to 17 Years | 24 (1.7%) | 8 (0.5%) |
| 18 to 34 Years | 100 (8.4%) | 9 (1.0%) |
| 35 to 64 Years | 52 (3.0%) | 13 (0.8%) |
| 65 to 74 Years | 0 (0.0%) | 11 (3.9%) |
| 75 Years and over | 10 (7.6%) | 32 (16.2%) |
Disability Class: Ambulatory Difficulty
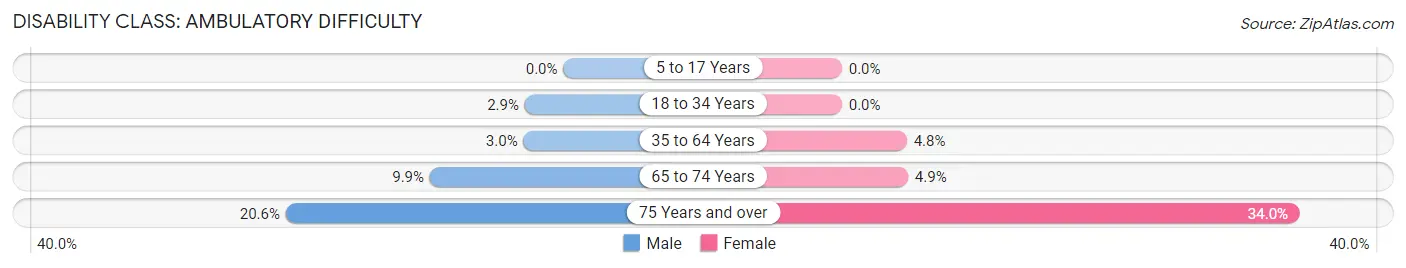
| Age Bracket | Male | Female |
| 5 to 17 Years | 0 (0.0%) | 0 (0.0%) |
| 18 to 34 Years | 34 (2.9%) | 0 (0.0%) |
| 35 to 64 Years | 52 (3.0%) | 75 (4.8%) |
| 65 to 74 Years | 22 (9.9%) | 14 (4.9%) |
| 75 Years and over | 27 (20.6%) | 67 (34.0%) |
Disability Class: Self-Care Difficulty
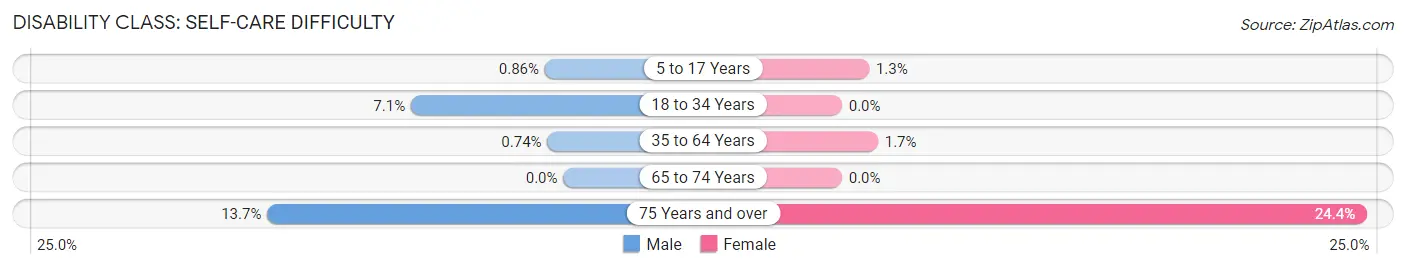
| Age Bracket | Male | Female |
| 5 to 17 Years | 12 (0.9%) | 19 (1.3%) |
| 18 to 34 Years | 84 (7.1%) | 0 (0.0%) |
| 35 to 64 Years | 13 (0.7%) | 26 (1.7%) |
| 65 to 74 Years | 0 (0.0%) | 0 (0.0%) |
| 75 Years and over | 18 (13.7%) | 48 (24.4%) |
Technology Access in Cedar Hills
Computing Device Access in Cedar Hills
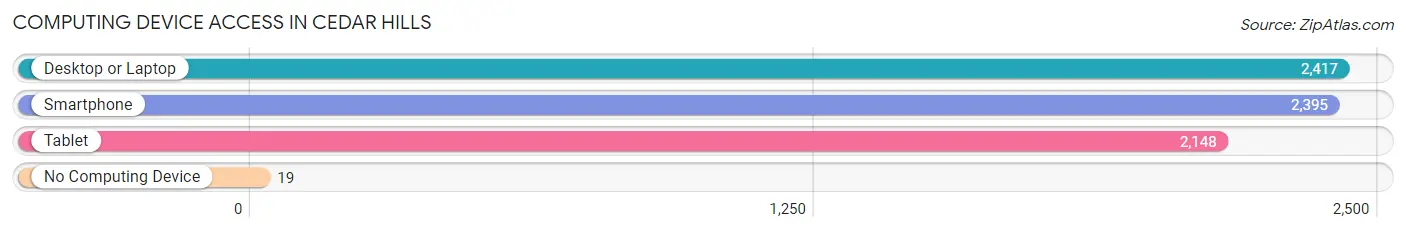
| Device Type | # Households | % Households |
| Desktop or Laptop | 2,417 | 98.0% |
| Smartphone | 2,395 | 97.1% |
| Tablet | 2,148 | 87.1% |
| No Computing Device | 19 | 0.8% |
| Total | 2,467 | 100.0% |
Internet Access in Cedar Hills
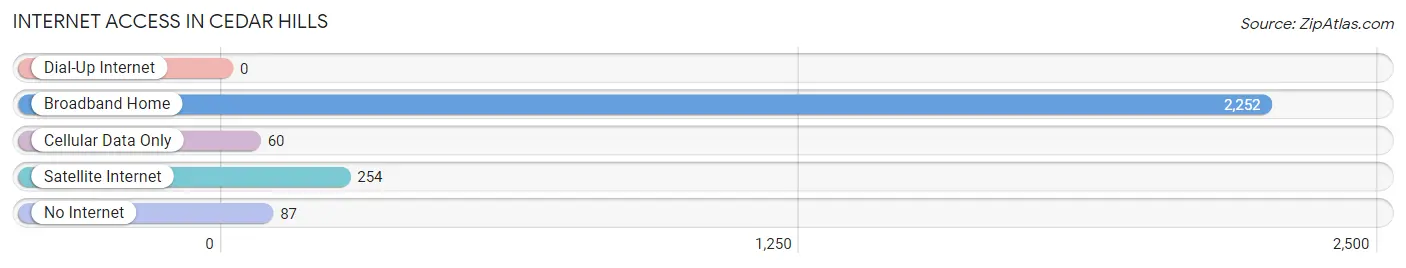
| Internet Type | # Households | % Households |
| Dial-Up Internet | 0 | 0.0% |
| Broadband Home | 2,252 | 91.3% |
| Cellular Data Only | 60 | 2.4% |
| Satellite Internet | 254 | 10.3% |
| No Internet | 87 | 3.5% |
| Total | 2,467 | 100.0% |
Cedar Hills Summary
Cedar Hills is a city located in the state of Utah, in the United States of America. It is located in the northern part of the state, in the Wasatch Front region, and is part of the Salt Lake City metropolitan area. The city is situated in the foothills of the Wasatch Mountains, and is bordered by the cities of Alpine, Highland, and American Fork. As of the 2010 census, the population of Cedar Hills was 8,564.
History
The area that is now Cedar Hills was first settled in the mid-1800s by Mormon pioneers. The area was originally known as “Cedar Valley”, and was part of the larger Alpine School District. In the 1950s, the area began to experience rapid growth, and in 1959, the area was incorporated as the City of Cedar Hills. The city was named after the cedar trees that grew in the area.
Geography
Cedar Hills is located in the northern part of Utah, in the Wasatch Front region. It is situated in the foothills of the Wasatch Mountains, and is bordered by the cities of Alpine, Highland, and American Fork. The city has a total area of 4.3 square miles, all of which is land. The city is located at an elevation of 4,890 feet above sea level.
Climate
Cedar Hills has a humid continental climate, with cold winters and hot summers. The average annual temperature is 46.2°F, with an average high of 68.2°F in July and an average low of 24.2°F in January. The average annual precipitation is 17.3 inches, with an average of 44.3 inches of snowfall per year.
Economy
Cedar Hills is primarily a residential community, and the majority of its residents are employed in the nearby cities of Salt Lake City and Provo. The city does have a few businesses, including a grocery store, a gas station, and a few restaurants. The city also has a few industrial parks, which are home to a variety of businesses, including manufacturing, warehousing, and distribution.
Demographics
As of the 2010 census, the population of Cedar Hills was 8,564. The racial makeup of the city was 91.2% White, 0.7% African American, 0.5% Native American, 2.2% Asian, 0.1% Pacific Islander, 3.2% from other races, and 2.1% from two or more races. Hispanic or Latino of any race were 6.3% of the population. The median household income was $90,945, and the median family income was $97,945. The per capita income was $33,945. About 4.2% of families and 5.2% of the population were below the poverty line.
Common Questions
What is the Total Population of Cedar Hills?
Total Population of Cedar Hills is 9,977.
What is the Total Male Population of Cedar Hills?
Total Male Population of Cedar Hills is 5,003.
What is the Total Female Population of Cedar Hills?
Total Female Population of Cedar Hills is 4,974.
What is the Ratio of Males per 100 Females in Cedar Hills?
There are 100.58 Males per 100 Females in Cedar Hills.
What is the Ratio of Females per 100 Males in Cedar Hills?
There are 99.42 Females per 100 Males in Cedar Hills.
What is the Median Population Age in Cedar Hills?
Median Population Age in Cedar Hills is 24.9 Years.
What is the Average Family Size in Cedar Hills
Average Family Size in Cedar Hills is 4.3 People.
What is the Average Household Size in Cedar Hills
Average Household Size in Cedar Hills is 4.0 People.
What is Per Capita Income in Cedar Hills?
Per Capita income in Cedar Hills is $37,410.
What is the Median Family Income in Cedar Hills?
Median Family Income in Cedar Hills is $133,555.
What is the Median Household income in Cedar Hills?
Median Household Income in Cedar Hills is $130,847.
What is Income or Wage Gap in Cedar Hills?
Income or Wage Gap in Cedar Hills is 70.6%.
Women in Cedar Hills earn 29.4 cents for every dollar earned by a man.
What is Family Income Deficit in Cedar Hills?
Family Income Deficit in Cedar Hills is $11,189.
Families that are below poverty line in Cedar Hills earn $11,189 less on average than the poverty threshold level.
What is Inequality or Gini Index in Cedar Hills?
Inequality or Gini Index in Cedar Hills is 0.38.
How Large is the Labor Force in Cedar Hills?
There are 4,398 People in the Labor Forcein in Cedar Hills.
What is the Percentage of People in the Labor Force in Cedar Hills?
65.0% of People are in the Labor Force in Cedar Hills.
What is the Unemployment Rate in Cedar Hills?
Unemployment Rate in Cedar Hills is 2.8%.