Emigration Canyon, UT
Emigration Canyon Map
Emigration Canyon Overview
1,503
TOTAL POPULATION
785
MALE POPULATION
718
FEMALE POPULATION
109.33
MALES / 100 FEMALES
91.46
FEMALES / 100 MALES
51.2
MEDIAN AGE
2.9
AVG FAMILY SIZE
2.6
AVG HOUSEHOLD SIZE
$79,579
PER CAPITA INCOME
$178,500
AVG FAMILY INCOME
$138,125
AVG HOUSEHOLD INCOME
17.5%
WAGE / INCOME GAP [ % ]
82.5¢/ $1
WAGE / INCOME GAP [ $ ]
0.45
INEQUALITY / GINI INDEX
871
LABOR FORCE [ PEOPLE ]
66.4%
PERCENT IN LABOR FORCE
3.7%
UNEMPLOYMENT RATE
Emigration Canyon Area Codes
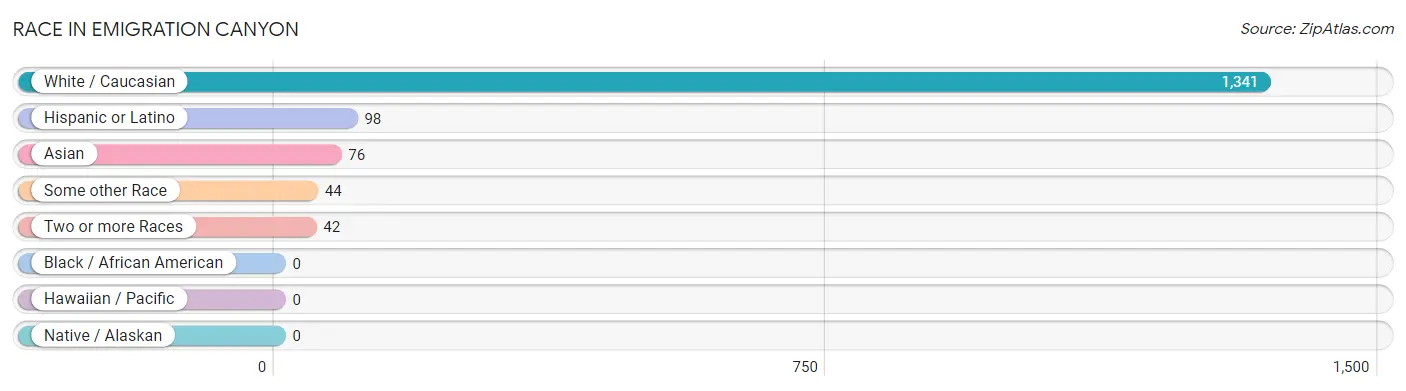
Race in Emigration Canyon
The most populous races in Emigration Canyon are White / Caucasian (1,341 | 89.2%), Hispanic or Latino (98 | 6.5%), and Asian (76 | 5.1%).
| Race | # Population | % Population |
| Asian | 76 | 5.1% |
| Black / African American | 0 | 0.0% |
| Hawaiian / Pacific | 0 | 0.0% |
| Hispanic or Latino | 98 | 6.5% |
| Native / Alaskan | 0 | 0.0% |
| White / Caucasian | 1,341 | 89.2% |
| Two or more Races | 42 | 2.8% |
| Some other Race | 44 | 2.9% |
| Total | 1,503 | 100.0% |
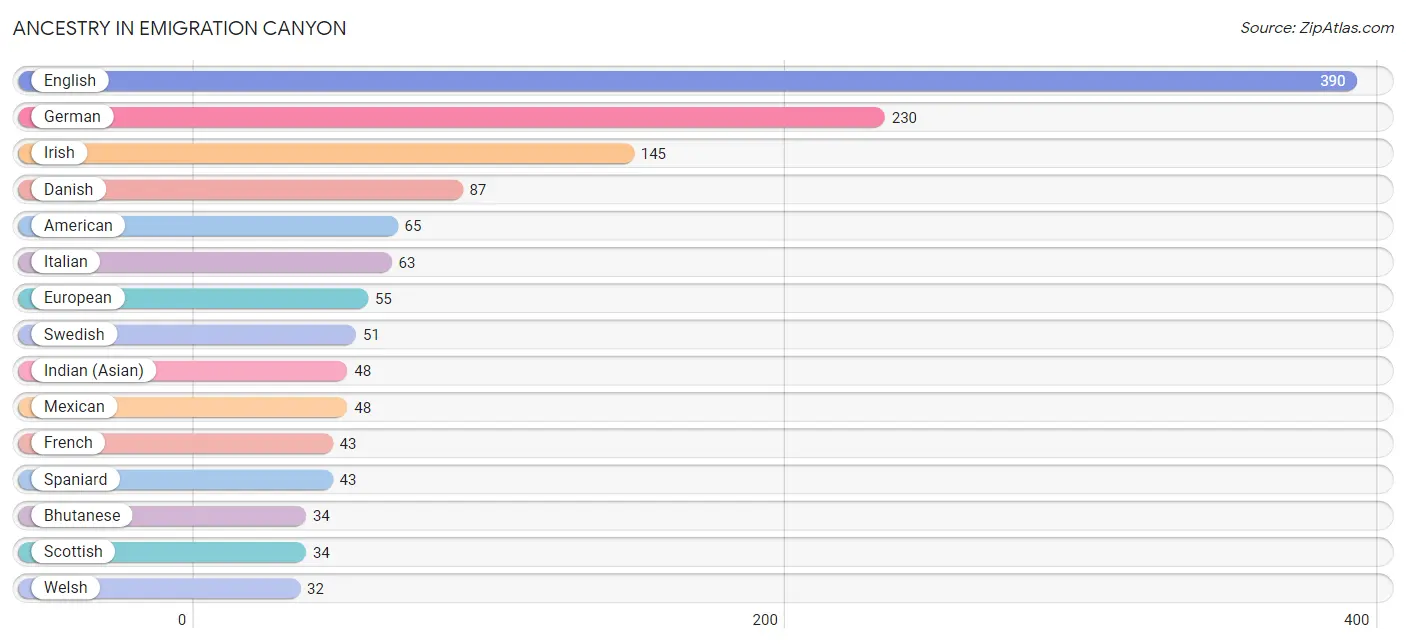
Ancestry in Emigration Canyon
The most populous ancestries reported in Emigration Canyon are English (390 | 26.0%), German (230 | 15.3%), Irish (145 | 9.7%), Danish (87 | 5.8%), and American (65 | 4.3%), together accounting for 61.0% of all Emigration Canyon residents.
| Ancestry | # Population | % Population |
| American | 65 | 4.3% |
| Arab | 2 | 0.1% |
| Austrian | 19 | 1.3% |
| Belgian | 19 | 1.3% |
| Bhutanese | 34 | 2.3% |
| British | 10 | 0.7% |
| Burmese | 3 | 0.2% |
| Choctaw | 4 | 0.3% |
| Cuban | 7 | 0.5% |
| Czech | 20 | 1.3% |
| Danish | 87 | 5.8% |
| Dutch | 12 | 0.8% |
| Eastern European | 22 | 1.5% |
| Egyptian | 2 | 0.1% |
| English | 390 | 26.0% |
| European | 55 | 3.7% |
| Filipino | 12 | 0.8% |
| Finnish | 7 | 0.5% |
| French | 43 | 2.9% |
| French American Indian | 16 | 1.1% |
| French Canadian | 20 | 1.3% |
| German | 230 | 15.3% |
| Indian (Asian) | 48 | 3.2% |
| Irish | 145 | 9.7% |
| Italian | 63 | 4.2% |
| Lithuanian | 14 | 0.9% |
| Mexican | 48 | 3.2% |
| Northern European | 7 | 0.5% |
| Norwegian | 22 | 1.5% |
| Polish | 12 | 0.8% |
| Romanian | 2 | 0.1% |
| Russian | 15 | 1.0% |
| Scandinavian | 16 | 1.1% |
| Scotch-Irish | 2 | 0.1% |
| Scottish | 34 | 2.3% |
| Spaniard | 43 | 2.9% |
| Swedish | 51 | 3.4% |
| Swiss | 25 | 1.7% |
| Ukrainian | 2 | 0.1% |
| Welsh | 32 | 2.1% | View All 40 Rows |
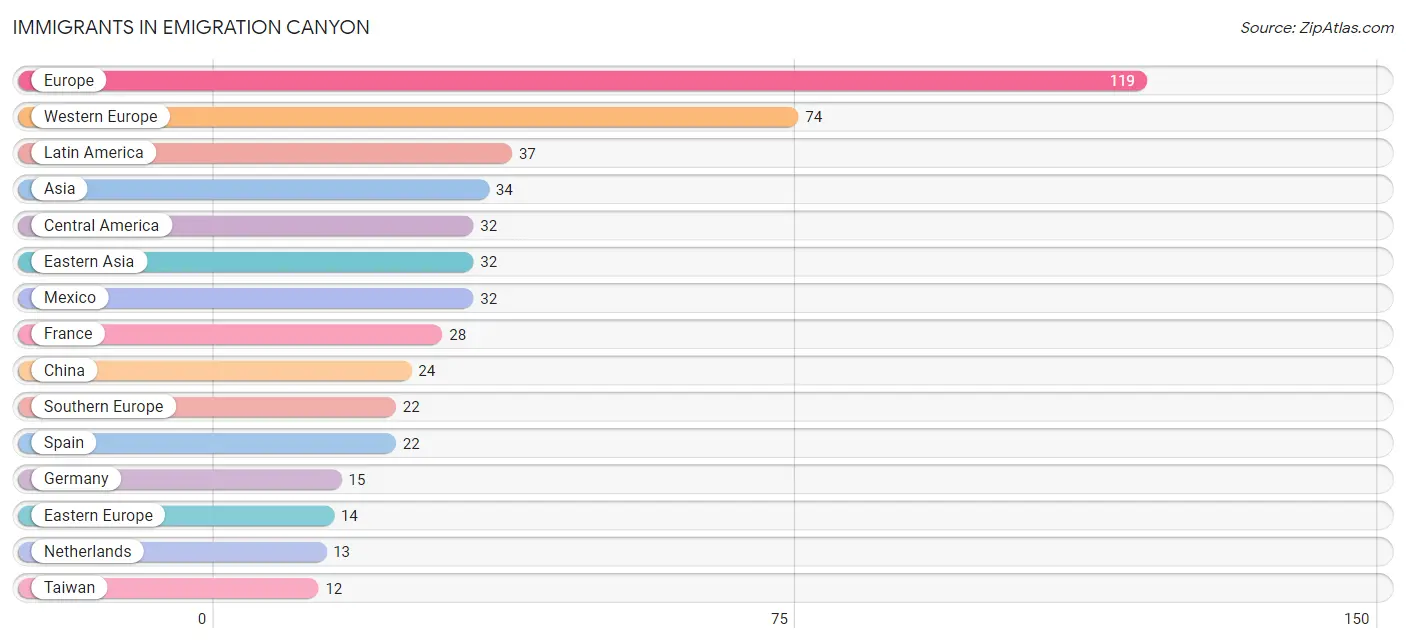
Immigrants in Emigration Canyon
The most numerous immigrant groups reported in Emigration Canyon came from Europe (119 | 7.9%), Western Europe (74 | 4.9%), Latin America (37 | 2.5%), Asia (34 | 2.3%), and Central America (32 | 2.1%), together accounting for 19.7% of all Emigration Canyon residents.
| Immigration Origin | # Population | % Population |
| Asia | 34 | 2.3% |
| Austria | 8 | 0.5% |
| Belgium | 9 | 0.6% |
| Brazil | 5 | 0.3% |
| Canada | 4 | 0.3% |
| Central America | 32 | 2.1% |
| China | 24 | 1.6% |
| Eastern Asia | 32 | 2.1% |
| Eastern Europe | 14 | 0.9% |
| England | 9 | 0.6% |
| Europe | 119 | 7.9% |
| France | 28 | 1.9% |
| Germany | 15 | 1.0% |
| Japan | 5 | 0.3% |
| Korea | 3 | 0.2% |
| Latin America | 37 | 2.5% |
| Mexico | 32 | 2.1% |
| Nepal | 2 | 0.1% |
| Netherlands | 13 | 0.9% |
| Northern Europe | 9 | 0.6% |
| South America | 5 | 0.3% |
| South Central Asia | 2 | 0.1% |
| Southern Europe | 22 | 1.5% |
| Spain | 22 | 1.5% |
| Switzerland | 1 | 0.1% |
| Taiwan | 12 | 0.8% |
| Western Europe | 74 | 4.9% | View All 27 Rows |
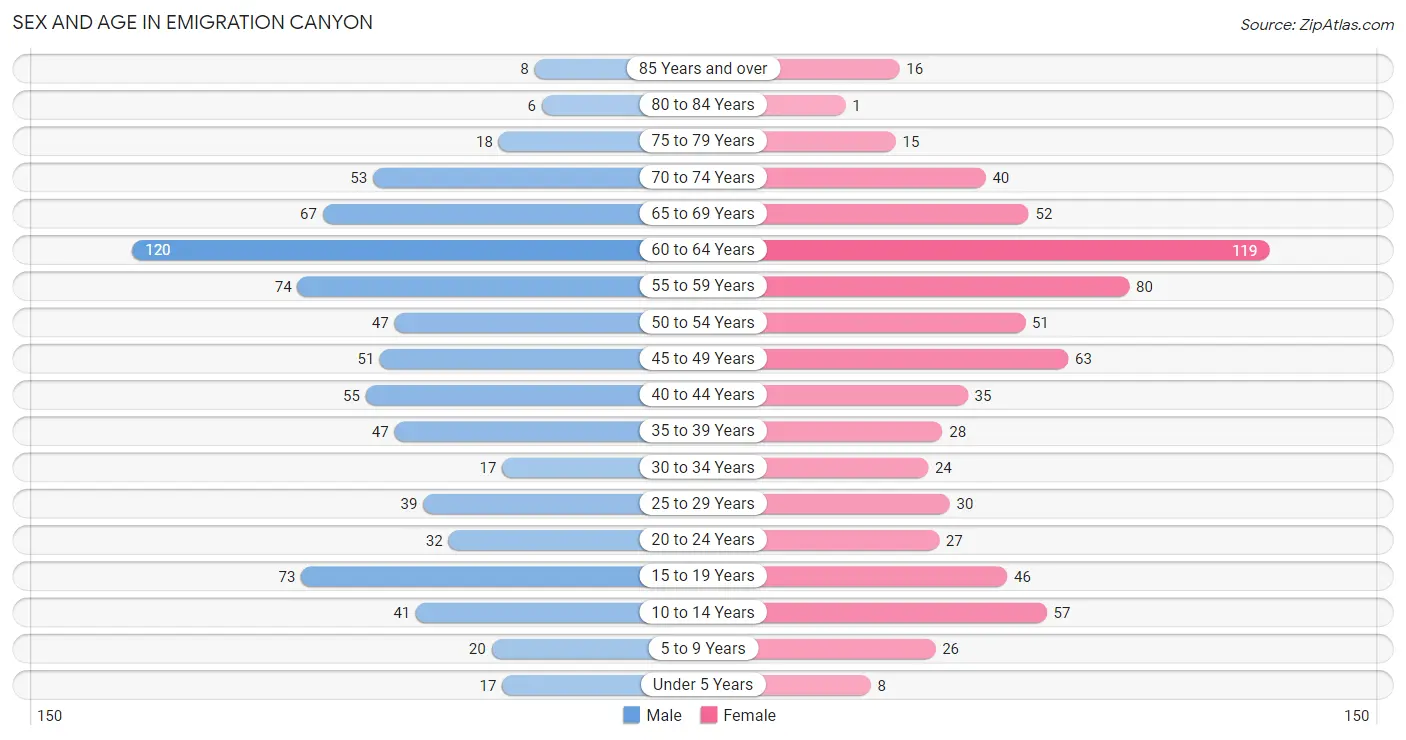
Sex and Age in Emigration Canyon
Sex and Age in Emigration Canyon
The most populous age groups in Emigration Canyon are 60 to 64 Years (120 | 15.3%) for men and 60 to 64 Years (119 | 16.6%) for women.
| Age Bracket | Male | Female |
| Under 5 Years | 17 (2.2%) | 8 (1.1%) |
| 5 to 9 Years | 20 (2.5%) | 26 (3.6%) |
| 10 to 14 Years | 41 (5.2%) | 57 (7.9%) |
| 15 to 19 Years | 73 (9.3%) | 46 (6.4%) |
| 20 to 24 Years | 32 (4.1%) | 27 (3.8%) |
| 25 to 29 Years | 39 (5.0%) | 30 (4.2%) |
| 30 to 34 Years | 17 (2.2%) | 24 (3.3%) |
| 35 to 39 Years | 47 (6.0%) | 28 (3.9%) |
| 40 to 44 Years | 55 (7.0%) | 35 (4.9%) |
| 45 to 49 Years | 51 (6.5%) | 63 (8.8%) |
| 50 to 54 Years | 47 (6.0%) | 51 (7.1%) |
| 55 to 59 Years | 74 (9.4%) | 80 (11.1%) |
| 60 to 64 Years | 120 (15.3%) | 119 (16.6%) |
| 65 to 69 Years | 67 (8.5%) | 52 (7.2%) |
| 70 to 74 Years | 53 (6.8%) | 40 (5.6%) |
| 75 to 79 Years | 18 (2.3%) | 15 (2.1%) |
| 80 to 84 Years | 6 (0.8%) | 1 (0.1%) |
| 85 Years and over | 8 (1.0%) | 16 (2.2%) |
| Total | 785 (100.0%) | 718 (100.0%) |
Families and Households in Emigration Canyon
Median Family Size in Emigration Canyon
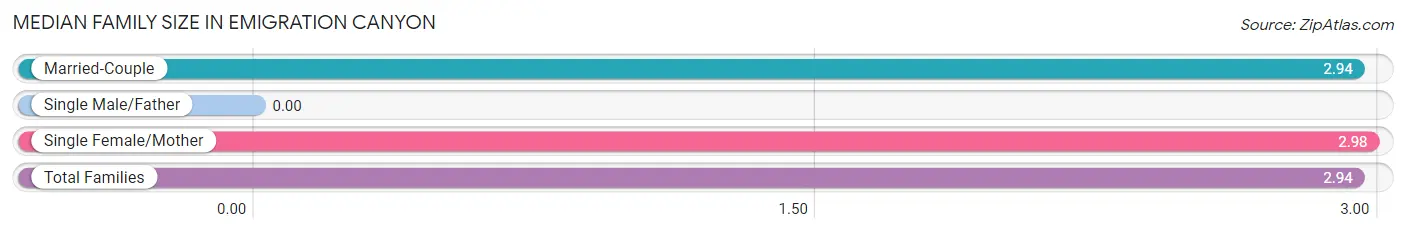
| Family Type | # Families | Family Size |
| Married-Couple | 387 (89.2%) | 2.94 |
| Single Male/Father | 0 (0.0%) | - |
| Single Female/Mother | 47 (10.8%) | 2.98 |
| Total Families | 434 (100.0%) | 2.94 |
Median Household Size in Emigration Canyon
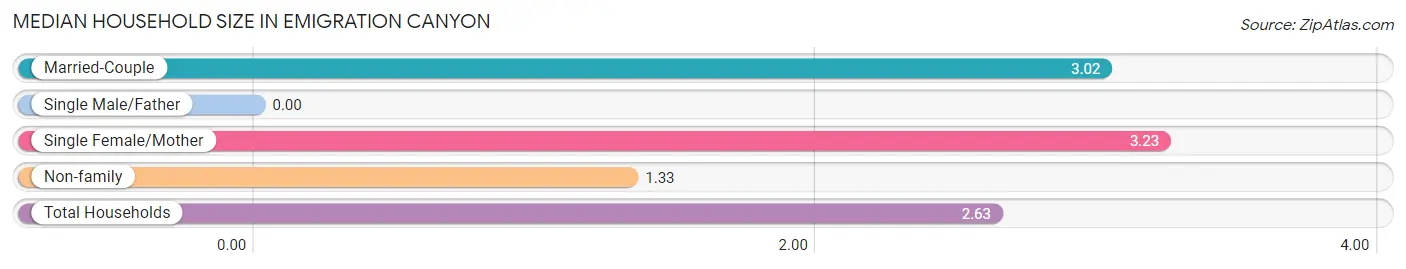
| Household Type | # Households | Household Size |
| Married-Couple | 387 (67.8%) | 3.02 |
| Single Male/Father | 0 (0.0%) | - |
| Single Female/Mother | 47 (8.2%) | 3.23 |
| Non-family | 137 (24.0%) | 1.33 |
| Total Households | 571 (100.0%) | 2.63 |
Household Size by Marriage Status in Emigration Canyon
Out of a total of 571 households in Emigration Canyon, 434 (76.0%) are family households, while 137 (24.0%) are nonfamily households. The most numerous type of family households are 2-person households, comprising 210, and the most common type of nonfamily households are 1-person households, comprising 100.
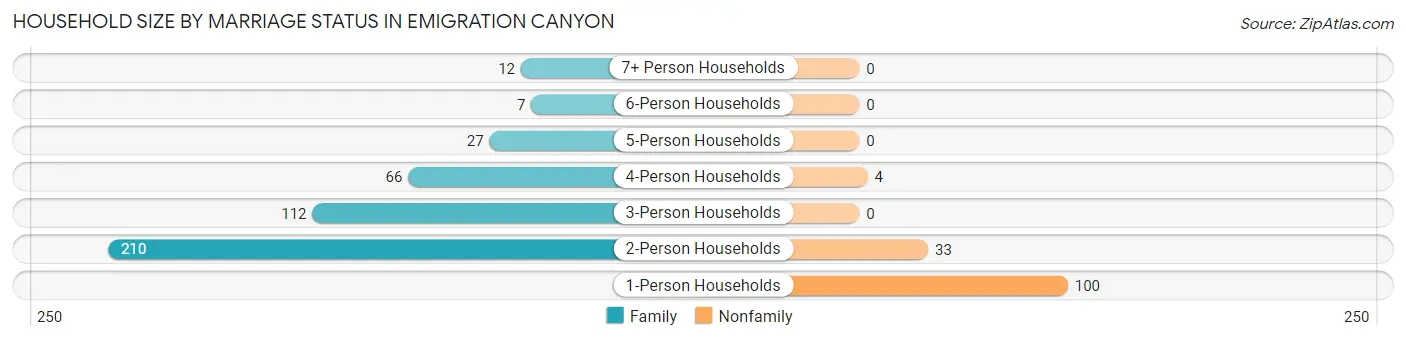
| Household Size | Family Households | Nonfamily Households |
| 1-Person Households | - | 100 (17.5%) |
| 2-Person Households | 210 (36.8%) | 33 (5.8%) |
| 3-Person Households | 112 (19.6%) | 0 (0.0%) |
| 4-Person Households | 66 (11.6%) | 4 (0.7%) |
| 5-Person Households | 27 (4.7%) | 0 (0.0%) |
| 6-Person Households | 7 (1.2%) | 0 (0.0%) |
| 7+ Person Households | 12 (2.1%) | 0 (0.0%) |
| Total | 434 (76.0%) | 137 (24.0%) |
Female Fertility in Emigration Canyon
Fertility by Age in Emigration Canyon
Average fertility rate in Emigration Canyon is 19.0 births per 1,000 women. Women in the age bracket of 20 to 34 years have the highest fertility rate with 37.0 births per 1,000 women. Women in the age bracket of 20 to 34 years acount for 60.0% of all women with births.
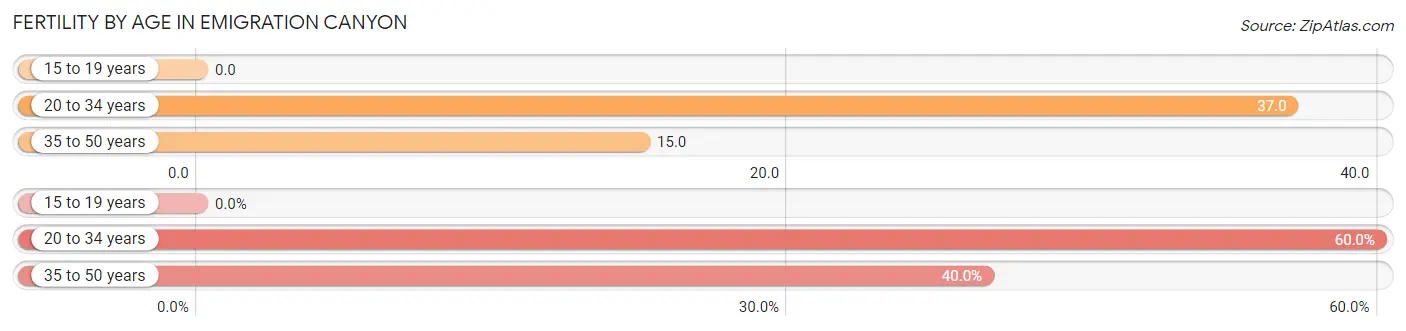
| Age Bracket | Women with Births | Births / 1,000 Women |
| 15 to 19 years | 0 (0.0%) | 0.0 |
| 20 to 34 years | 3 (60.0%) | 37.0 |
| 35 to 50 years | 2 (40.0%) | 15.0 |
| Total | 5 (100.0%) | 19.0 |
Fertility by Age by Marriage Status in Emigration Canyon
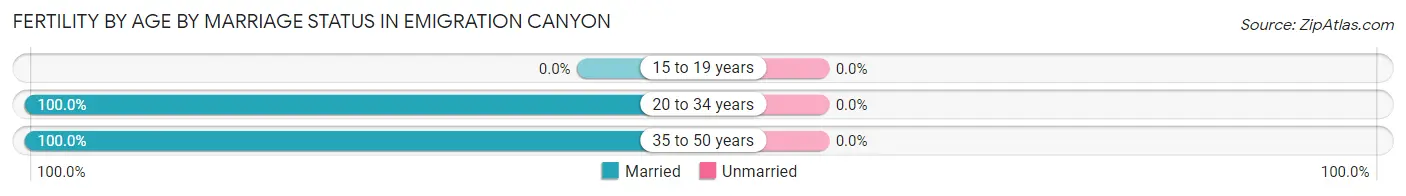
| Age Bracket | Married | Unmarried |
| 15 to 19 years | 0 (0.0%) | 0 (0.0%) |
| 20 to 34 years | 3 (100.0%) | 0 (0.0%) |
| 35 to 50 years | 2 (100.0%) | 0 (0.0%) |
| Total | 5 (100.0%) | 0 (0.0%) |
Fertility by Education in Emigration Canyon
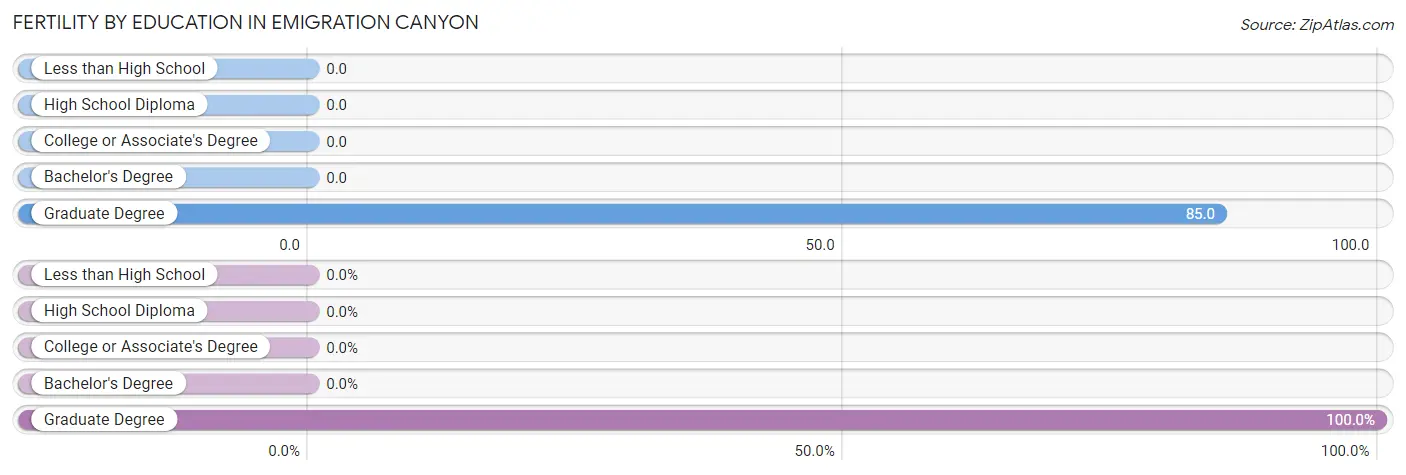
| Educational Attainment | Women with Births | Births / 1,000 Women |
| Less than High School | 0 (0.0%) | 0.0 |
| High School Diploma | 0 (0.0%) | 0.0 |
| College or Associate's Degree | 0 (0.0%) | 0.0 |
| Bachelor's Degree | 0 (0.0%) | 0.0 |
| Graduate Degree | 5 (100.0%) | 85.0 |
| Total | 5 (100.0%) | 19.0 |
Fertility by Education by Marriage Status in Emigration Canyon
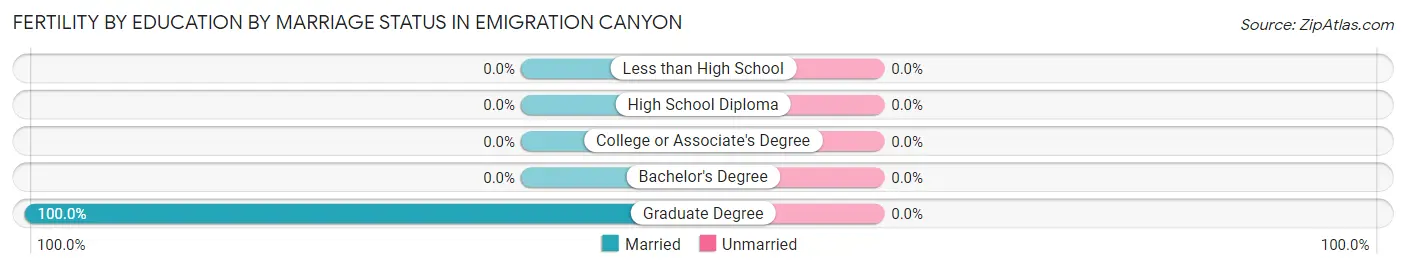
| Educational Attainment | Married | Unmarried |
| Less than High School | 0 (0.0%) | 0 (0.0%) |
| High School Diploma | 0 (0.0%) | 0 (0.0%) |
| College or Associate's Degree | 0 (0.0%) | 0 (0.0%) |
| Bachelor's Degree | 0 (0.0%) | 0 (0.0%) |
| Graduate Degree | 5 (100.0%) | 0 (0.0%) |
| Total | 5 (100.0%) | 0 (0.0%) |
Income in Emigration Canyon
Income Overview in Emigration Canyon
Per Capita Income in Emigration Canyon is $79,579, while median incomes of families and households are $178,500 and $138,125 respectively.
| Characteristic | Number | Measure |
| Per Capita Income | 1,503 | $79,579 |
| Median Family Income | 434 | $178,500 |
| Mean Family Income | 434 | $226,414 |
| Median Household Income | 571 | $138,125 |
| Mean Household Income | 571 | $206,929 |
| Income Deficit | 434 | $0 |
| Wage / Income Gap (%) | 1,503 | 17.55% |
| Wage / Income Gap ($) | 1,503 | 82.45¢ per $1 |
| Gini / Inequality Index | 1,503 | 0.45 |
Earnings by Sex in Emigration Canyon
Average Earnings in Emigration Canyon are $65,263, $71,078 for men and $58,606 for women, a difference of 17.5%.
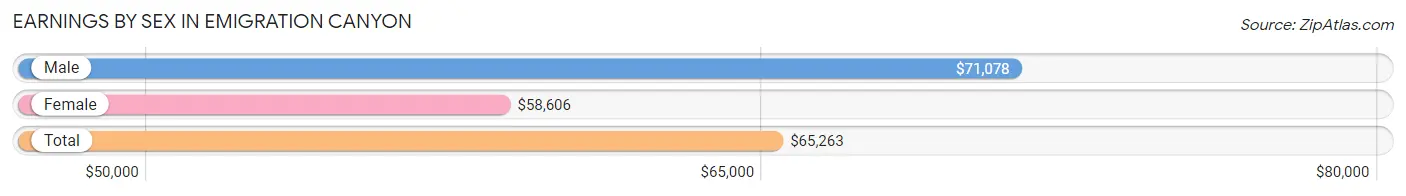
| Sex | Number | Average Earnings |
| Male | 507 (56.3%) | $71,078 |
| Female | 393 (43.7%) | $58,606 |
| Total | 900 (100.0%) | $65,263 |
Earnings by Sex by Income Bracket in Emigration Canyon
The most common earnings brackets in Emigration Canyon are $100,000+ for men (201 | 39.6%) and $100,000+ for women (106 | 27.0%).
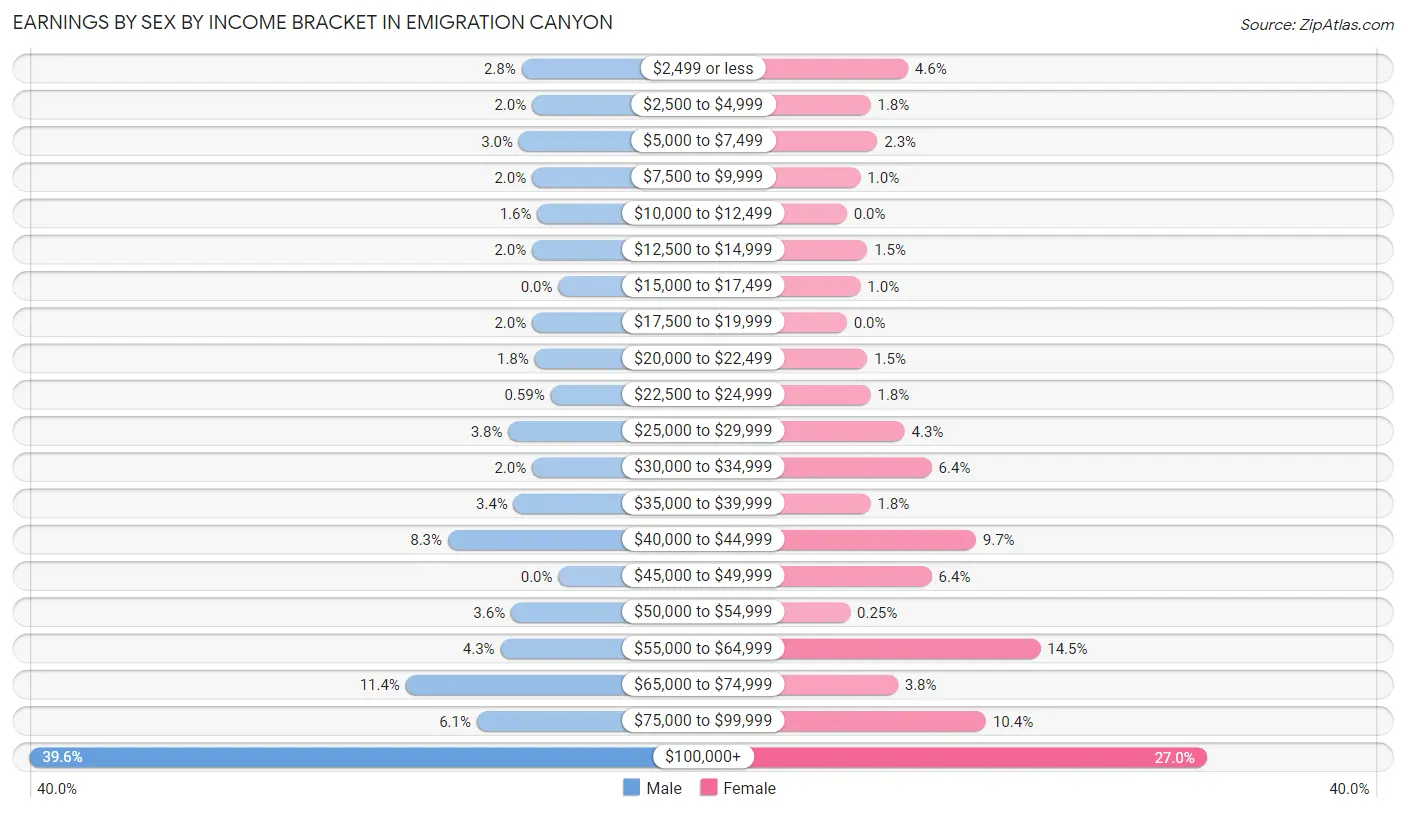
| Income | Male | Female |
| $2,499 or less | 14 (2.8%) | 18 (4.6%) |
| $2,500 to $4,999 | 10 (2.0%) | 7 (1.8%) |
| $5,000 to $7,499 | 15 (3.0%) | 9 (2.3%) |
| $7,500 to $9,999 | 10 (2.0%) | 4 (1.0%) |
| $10,000 to $12,499 | 8 (1.6%) | 0 (0.0%) |
| $12,500 to $14,999 | 10 (2.0%) | 6 (1.5%) |
| $15,000 to $17,499 | 0 (0.0%) | 4 (1.0%) |
| $17,500 to $19,999 | 10 (2.0%) | 0 (0.0%) |
| $20,000 to $22,499 | 9 (1.8%) | 6 (1.5%) |
| $22,500 to $24,999 | 3 (0.6%) | 7 (1.8%) |
| $25,000 to $29,999 | 19 (3.7%) | 17 (4.3%) |
| $30,000 to $34,999 | 10 (2.0%) | 25 (6.4%) |
| $35,000 to $39,999 | 17 (3.4%) | 7 (1.8%) |
| $40,000 to $44,999 | 42 (8.3%) | 38 (9.7%) |
| $45,000 to $49,999 | 0 (0.0%) | 25 (6.4%) |
| $50,000 to $54,999 | 18 (3.5%) | 1 (0.3%) |
| $55,000 to $64,999 | 22 (4.3%) | 57 (14.5%) |
| $65,000 to $74,999 | 58 (11.4%) | 15 (3.8%) |
| $75,000 to $99,999 | 31 (6.1%) | 41 (10.4%) |
| $100,000+ | 201 (39.6%) | 106 (27.0%) |
| Total | 507 (100.0%) | 393 (100.0%) |
Earnings by Sex by Educational Attainment in Emigration Canyon
Average earnings in Emigration Canyon are $76,528 for men and $62,961 for women, a difference of 17.7%. Men with an educational attainment of graduate degree enjoy the highest average annual earnings of $201,429, while those with college or associate's degree education earn the least with $41,250. Women with an educational attainment of graduate degree earn the most with the average annual earnings of $123,333, while those with college or associate's degree education have the smallest earnings of $42,171.
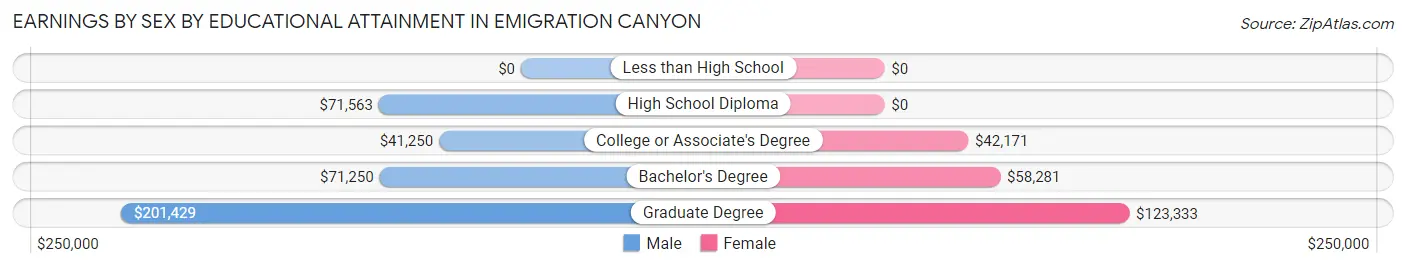
| Educational Attainment | Male Income | Female Income |
| Less than High School | - | - |
| High School Diploma | $71,563 | $0 |
| College or Associate's Degree | $41,250 | $42,171 |
| Bachelor's Degree | $71,250 | $58,281 |
| Graduate Degree | $201,429 | $123,333 |
| Total | $76,528 | $62,961 |
Family Income in Emigration Canyon
Family Income Brackets in Emigration Canyon
According to the Emigration Canyon family income data, there are 189 families falling into the $200,000+ income range, which is the most common income bracket and makes up 43.5% of all families.
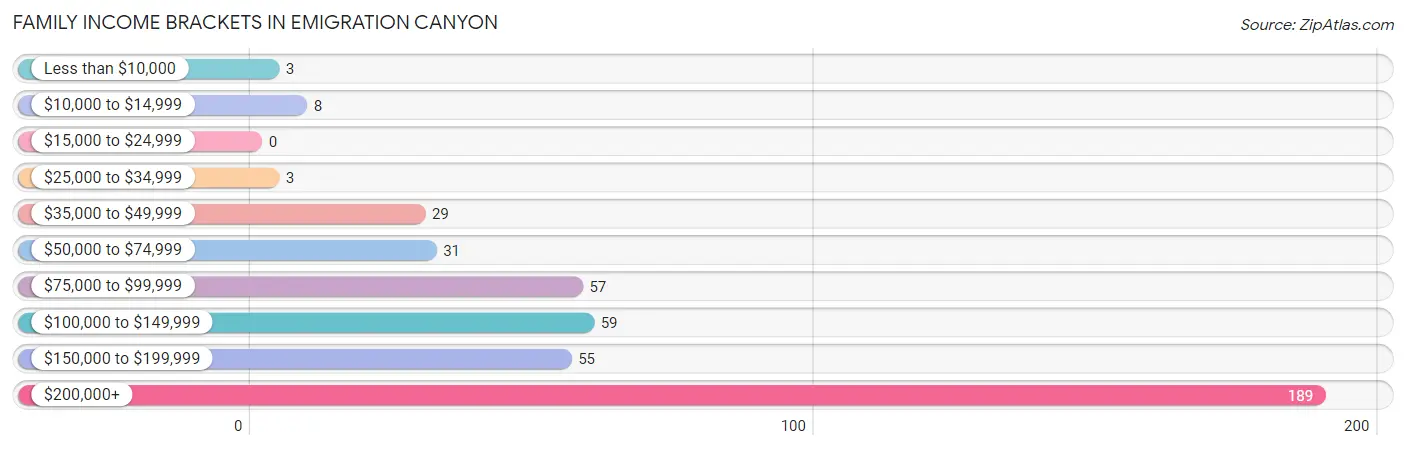
| Income Bracket | # Families | % Families |
| Less than $10,000 | 3 | 0.7% |
| $10,000 to $14,999 | 8 | 1.8% |
| $15,000 to $24,999 | 0 | 0.0% |
| $25,000 to $34,999 | 3 | 0.7% |
| $35,000 to $49,999 | 29 | 6.7% |
| $50,000 to $74,999 | 31 | 7.1% |
| $75,000 to $99,999 | 57 | 13.1% |
| $100,000 to $149,999 | 59 | 13.6% |
| $150,000 to $199,999 | 55 | 12.7% |
| $200,000+ | 189 | 43.5% |
Family Income by Famaliy Size in Emigration Canyon
5-person families (27 | 6.2%) account for the highest median family income in Emigration Canyon with $250,001 per family, while 2-person families (225 | 51.8%) have the highest median income of $91,328 per family member.
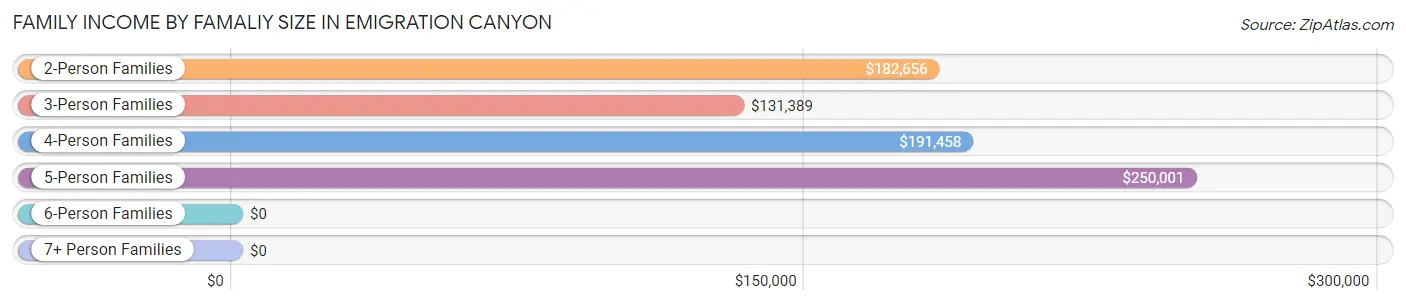
| Income Bracket | # Families | Median Income |
| 2-Person Families | 225 (51.8%) | $182,656 |
| 3-Person Families | 118 (27.2%) | $131,389 |
| 4-Person Families | 46 (10.6%) | $191,458 |
| 5-Person Families | 27 (6.2%) | $250,001 |
| 6-Person Families | 6 (1.4%) | $0 |
| 7+ Person Families | 12 (2.8%) | $0 |
| Total | 434 (100.0%) | $178,500 |
Family Income by Number of Earners in Emigration Canyon
The median family income in Emigration Canyon is $178,500, with families comprising 2 earners (215) having the highest median family income of $213,523, while families with 1 earner (131) have the lowest median family income of $107,917, accounting for 49.5% and 30.2% of families, respectively.
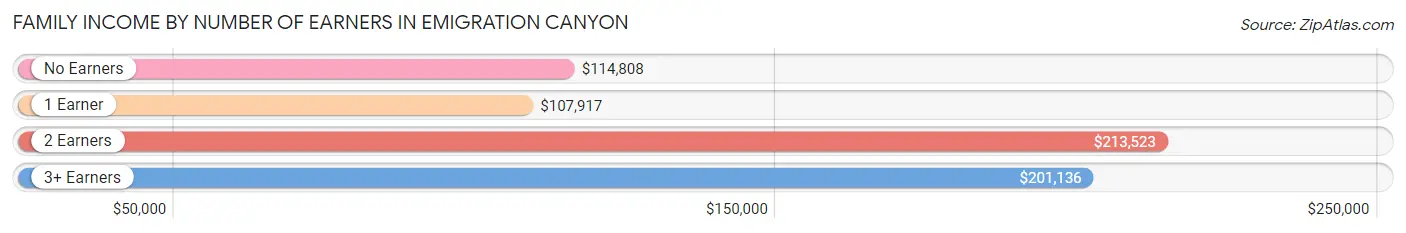
| Number of Earners | # Families | Median Income |
| No Earners | 48 (11.1%) | $114,808 |
| 1 Earner | 131 (30.2%) | $107,917 |
| 2 Earners | 215 (49.5%) | $213,523 |
| 3+ Earners | 40 (9.2%) | $201,136 |
| Total | 434 (100.0%) | $178,500 |
Household Income in Emigration Canyon
Household Income Brackets in Emigration Canyon
With 230 households falling in the category, the $200,000+ income range is the most frequent in Emigration Canyon, accounting for 40.3% of all households.
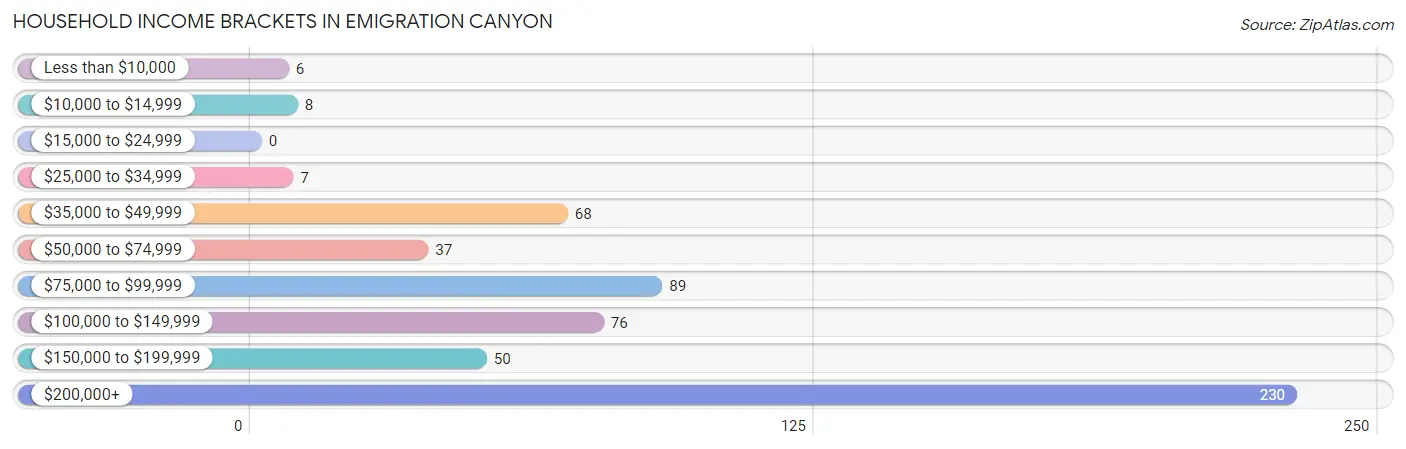
| Income Bracket | # Households | % Households |
| Less than $10,000 | 6 | 1.1% |
| $10,000 to $14,999 | 8 | 1.4% |
| $15,000 to $24,999 | 0 | 0.0% |
| $25,000 to $34,999 | 7 | 1.2% |
| $35,000 to $49,999 | 68 | 11.9% |
| $50,000 to $74,999 | 37 | 6.5% |
| $75,000 to $99,999 | 89 | 15.6% |
| $100,000 to $149,999 | 76 | 13.3% |
| $150,000 to $199,999 | 50 | 8.8% |
| $200,000+ | 230 | 40.3% |
Household Income by Householder Age in Emigration Canyon
The median household income in Emigration Canyon is $138,125, with the highest median household income of $178,750 found in the 25 to 44 years age bracket for the primary householder. A total of 76 households (13.3%) fall into this category.
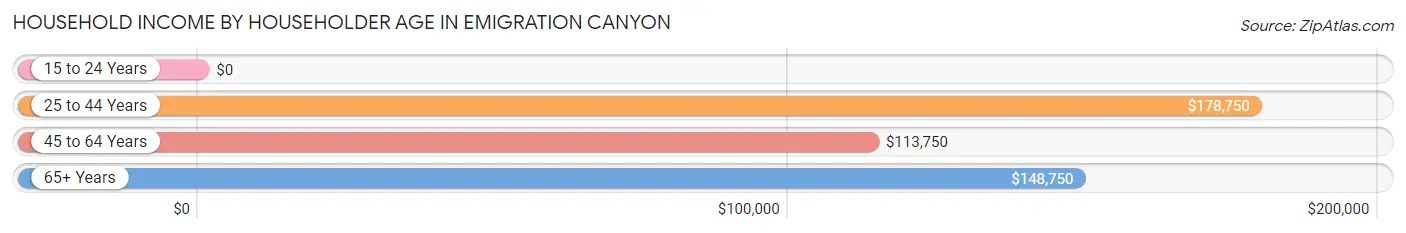
| Income Bracket | # Households | Median Income |
| 15 to 24 Years | 0 (0.0%) | $0 |
| 25 to 44 Years | 76 (13.3%) | $178,750 |
| 45 to 64 Years | 287 (50.3%) | $113,750 |
| 65+ Years | 208 (36.4%) | $148,750 |
| Total | 571 (100.0%) | $138,125 |
Poverty in Emigration Canyon
Income Below Poverty by Sex and Age in Emigration Canyon
With 5.5% poverty level for males and 4.6% for females among the residents of Emigration Canyon, 16 and 17 year old males and 16 and 17 year old females are the most vulnerable to poverty, with 12 males (46.2%) and 8 females (18.6%) in their respective age groups living below the poverty level.
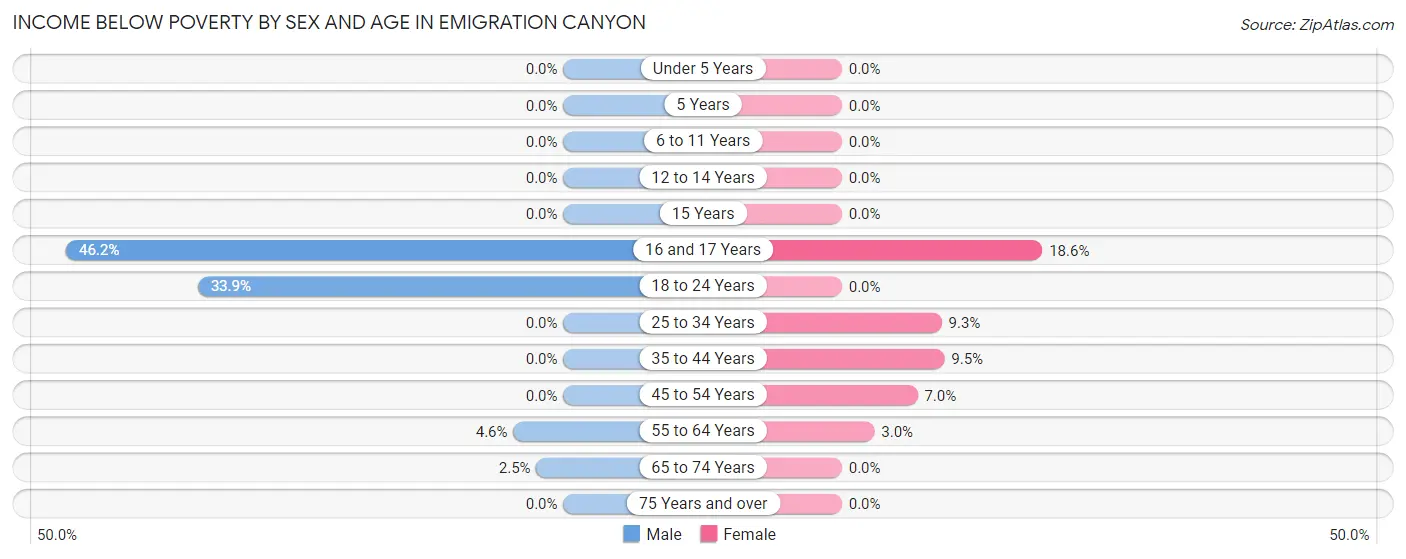
| Age Bracket | Male | Female |
| Under 5 Years | 0 (0.0%) | 0 (0.0%) |
| 5 Years | 0 (0.0%) | 0 (0.0%) |
| 6 to 11 Years | 0 (0.0%) | 0 (0.0%) |
| 12 to 14 Years | 0 (0.0%) | 0 (0.0%) |
| 15 Years | 0 (0.0%) | 0 (0.0%) |
| 16 and 17 Years | 12 (46.2%) | 8 (18.6%) |
| 18 to 24 Years | 19 (33.9%) | 0 (0.0%) |
| 25 to 34 Years | 0 (0.0%) | 5 (9.3%) |
| 35 to 44 Years | 0 (0.0%) | 6 (9.5%) |
| 45 to 54 Years | 0 (0.0%) | 8 (7.0%) |
| 55 to 64 Years | 9 (4.6%) | 6 (3.0%) |
| 65 to 74 Years | 3 (2.5%) | 0 (0.0%) |
| 75 Years and over | 0 (0.0%) | 0 (0.0%) |
| Total | 43 (5.5%) | 33 (4.6%) |
Income Above Poverty by Sex and Age in Emigration Canyon
According to the poverty statistics in Emigration Canyon, males aged under 5 years and females aged under 5 years are the age groups that are most secure financially, with 100.0% of males and 100.0% of females in these age groups living above the poverty line.
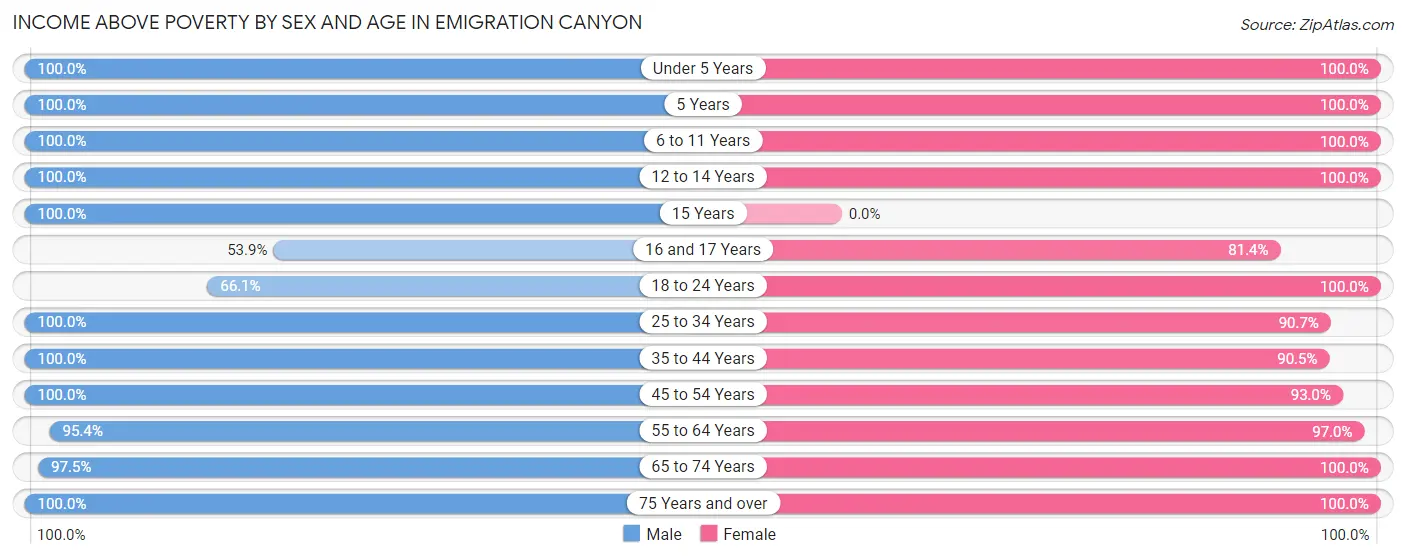
| Age Bracket | Male | Female |
| Under 5 Years | 17 (100.0%) | 8 (100.0%) |
| 5 Years | 2 (100.0%) | 2 (100.0%) |
| 6 to 11 Years | 23 (100.0%) | 43 (100.0%) |
| 12 to 14 Years | 36 (100.0%) | 38 (100.0%) |
| 15 Years | 23 (100.0%) | 0 (0.0%) |
| 16 and 17 Years | 14 (53.8%) | 35 (81.4%) |
| 18 to 24 Years | 37 (66.1%) | 30 (100.0%) |
| 25 to 34 Years | 56 (100.0%) | 49 (90.7%) |
| 35 to 44 Years | 102 (100.0%) | 57 (90.5%) |
| 45 to 54 Years | 98 (100.0%) | 106 (93.0%) |
| 55 to 64 Years | 185 (95.4%) | 193 (97.0%) |
| 65 to 74 Years | 117 (97.5%) | 92 (100.0%) |
| 75 Years and over | 32 (100.0%) | 32 (100.0%) |
| Total | 742 (94.5%) | 685 (95.4%) |
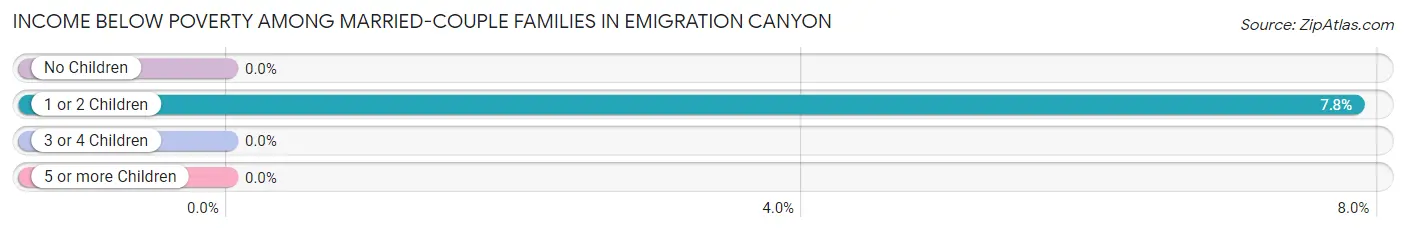
Income Below Poverty Among Married-Couple Families in Emigration Canyon
The poverty statistics for married-couple families in Emigration Canyon show that 2.1% or 8 of the total 387 families live below the poverty line. Families with 1 or 2 children have the highest poverty rate of 7.8%, comprising of 8 families. On the other hand, families with no children have the lowest poverty rate of 0.0%, which includes 0 families.
| Children | Above Poverty | Below Poverty |
| No Children | 257 (100.0%) | 0 (0.0%) |
| 1 or 2 Children | 94 (92.2%) | 8 (7.8%) |
| 3 or 4 Children | 16 (100.0%) | 0 (0.0%) |
| 5 or more Children | 12 (100.0%) | 0 (0.0%) |
| Total | 379 (97.9%) | 8 (2.1%) |
Income Below Poverty Among Single-Parent Households in Emigration Canyon
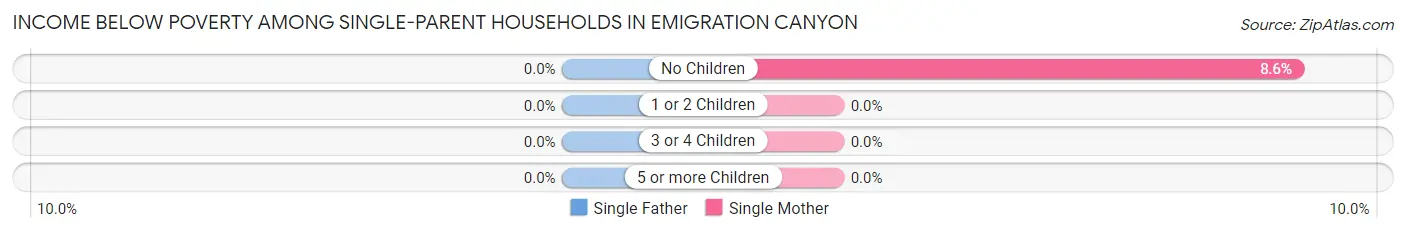
| Children | Single Father | Single Mother |
| No Children | 0 (0.0%) | 3 (8.6%) |
| 1 or 2 Children | 0 (0.0%) | 0 (0.0%) |
| 3 or 4 Children | 0 (0.0%) | 0 (0.0%) |
| 5 or more Children | 0 (0.0%) | 0 (0.0%) |
| Total | 0 (0.0%) | 3 (6.4%) |
Income Below Poverty Among Married-Couple vs Single-Parent Households in Emigration Canyon
The poverty data for Emigration Canyon shows that 8 of the married-couple family households (2.1%) and 3 of the single-parent households (6.4%) are living below the poverty level. Within the married-couple family households, those with 1 or 2 children have the highest poverty rate, with 8 households (7.8%) falling below the poverty line. Among the single-parent households, those with no children have the highest poverty rate, with 3 household (8.6%) living below poverty.
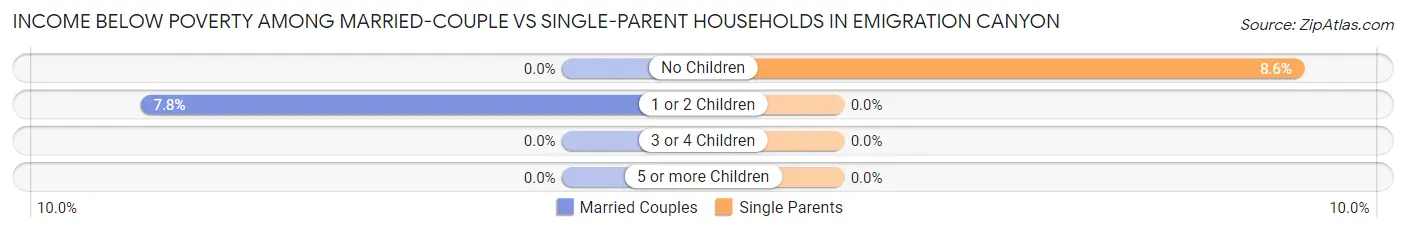
| Children | Married-Couple Families | Single-Parent Households |
| No Children | 0 (0.0%) | 3 (8.6%) |
| 1 or 2 Children | 8 (7.8%) | 0 (0.0%) |
| 3 or 4 Children | 0 (0.0%) | 0 (0.0%) |
| 5 or more Children | 0 (0.0%) | 0 (0.0%) |
| Total | 8 (2.1%) | 3 (6.4%) |
Employment Characteristics in Emigration Canyon
Employment by Class of Employer in Emigration Canyon
Among the 820 employed individuals in Emigration Canyon, private company employees (358 | 43.7%), not-for-profit organizations (166 | 20.2%), and state government employees (105 | 12.8%) make up the most common classes of employment.
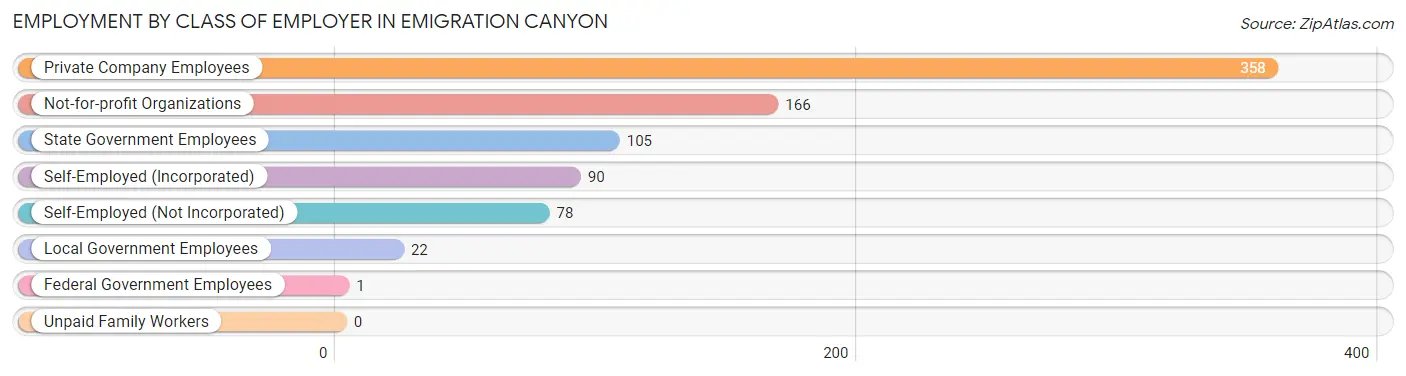
| Employer Class | # Employees | % Employees |
| Private Company Employees | 358 | 43.7% |
| Self-Employed (Incorporated) | 90 | 11.0% |
| Self-Employed (Not Incorporated) | 78 | 9.5% |
| Not-for-profit Organizations | 166 | 20.2% |
| Local Government Employees | 22 | 2.7% |
| State Government Employees | 105 | 12.8% |
| Federal Government Employees | 1 | 0.1% |
| Unpaid Family Workers | 0 | 0.0% |
| Total | 820 | 100.0% |
Employment Status by Age in Emigration Canyon
According to the labor force statistics for Emigration Canyon, out of the total population over 16 years of age (1,311), 66.4% or 871 individuals are in the labor force, with 3.7% or 32 of them unemployed. The age group with the highest labor force participation rate is 20 to 24 years, with 93.2% or 55 individuals in the labor force. Within the labor force, the 20 to 24 years age range has the highest percentage of unemployed individuals, with 16.4% or 9 of them being unemployed.
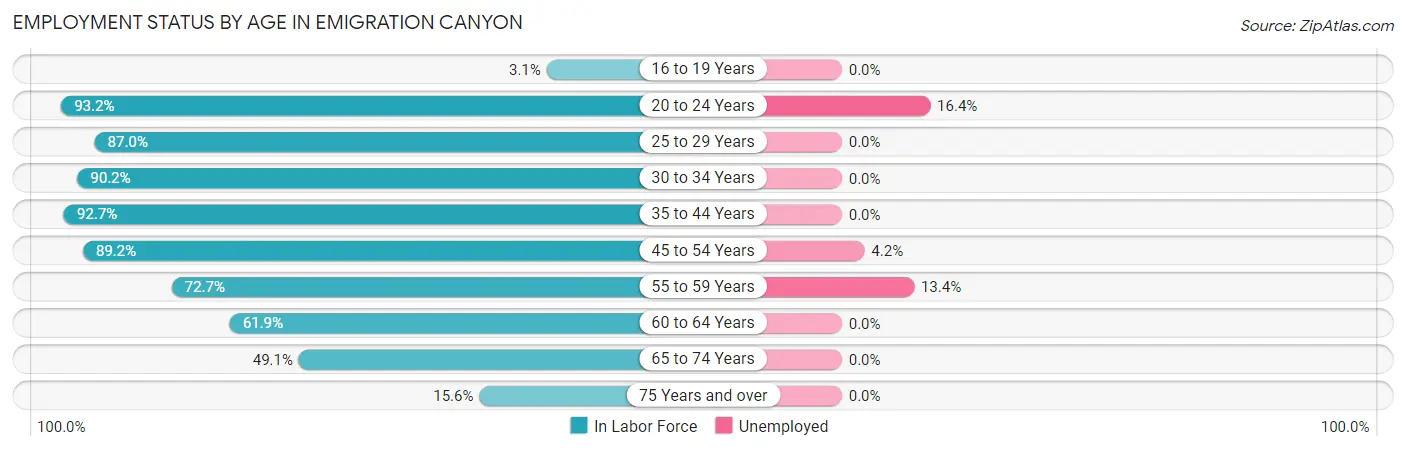
| Age Bracket | In Labor Force | Unemployed |
| 16 to 19 Years | 3 (3.1%) | 0 (0.0%) |
| 20 to 24 Years | 55 (93.2%) | 9 (16.4%) |
| 25 to 29 Years | 60 (87.0%) | 0 (0.0%) |
| 30 to 34 Years | 37 (90.2%) | 0 (0.0%) |
| 35 to 44 Years | 153 (92.7%) | 0 (0.0%) |
| 45 to 54 Years | 189 (89.2%) | 8 (4.2%) |
| 55 to 59 Years | 112 (72.7%) | 15 (13.4%) |
| 60 to 64 Years | 148 (61.9%) | 0 (0.0%) |
| 65 to 74 Years | 104 (49.1%) | 0 (0.0%) |
| 75 Years and over | 10 (15.6%) | 0 (0.0%) |
| Total | 871 (66.4%) | 32 (3.7%) |
Employment Status by Educational Attainment in Emigration Canyon
According to labor force statistics for Emigration Canyon, 79.4% of individuals (699) out of the total population between 25 and 64 years of age (880) are in the labor force, with 3.3% or 23 of them being unemployed. The group with the highest labor force participation rate are those with the educational attainment of high school diploma, with 96.2% or 50 individuals in the labor force. Within the labor force, individuals with bachelor's degree or higher education have the highest percentage of unemployment, with 4.9% or 23 of them being unemployed.
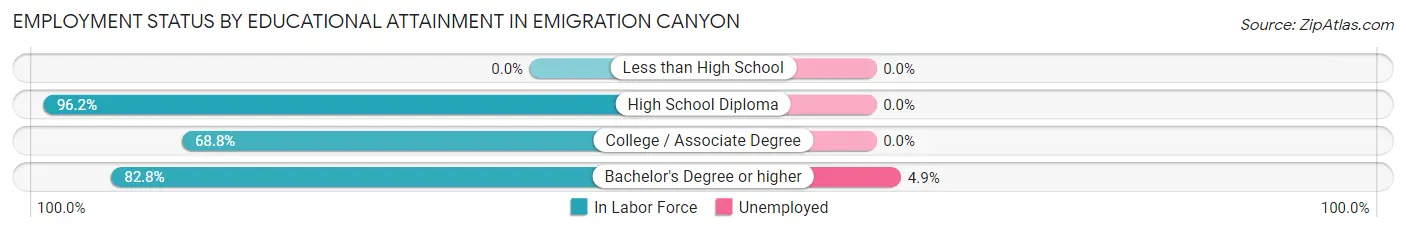
| Educational Attainment | In Labor Force | Unemployed |
| Less than High School | 0 (0.0%) | 0 (0.0%) |
| High School Diploma | 50 (96.2%) | 0 (0.0%) |
| College / Associate Degree | 181 (68.8%) | 0 (0.0%) |
| Bachelor's Degree or higher | 468 (82.8%) | 28 (4.9%) |
| Total | 699 (79.4%) | 29 (3.3%) |
Employment Occupations by Sex in Emigration Canyon
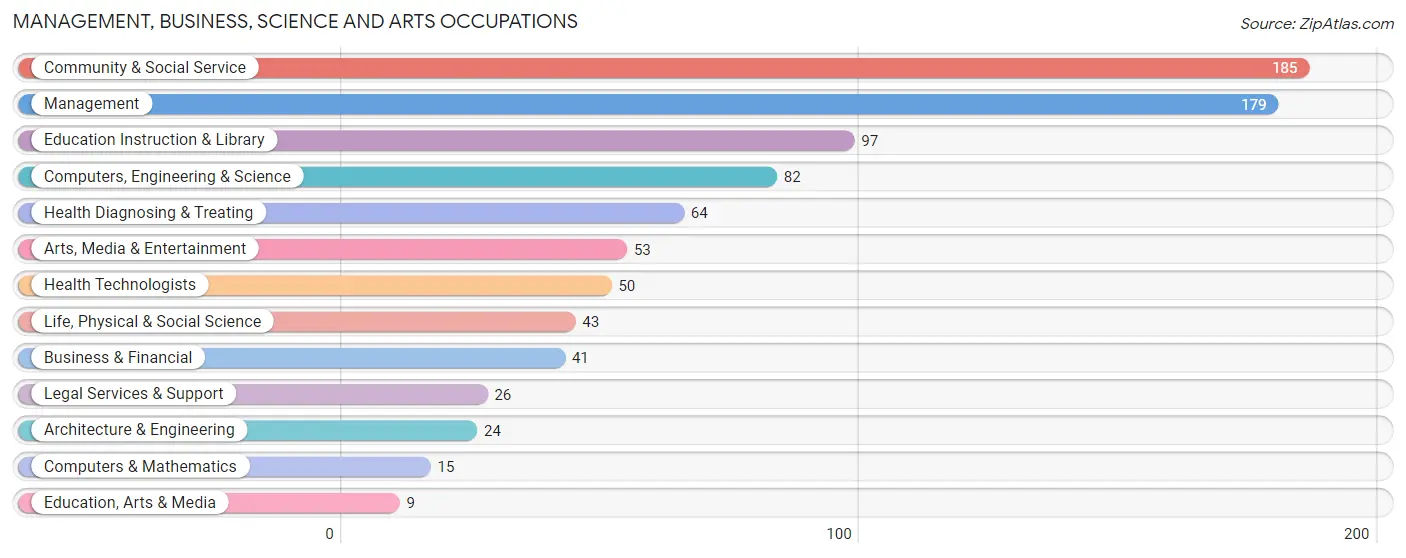
Management, Business, Science and Arts Occupations
The most common Management, Business, Science and Arts occupations in Emigration Canyon are Community & Social Service (185 | 22.1%), Management (179 | 21.3%), Education Instruction & Library (97 | 11.6%), Computers, Engineering & Science (82 | 9.8%), and Health Diagnosing & Treating (64 | 7.6%).
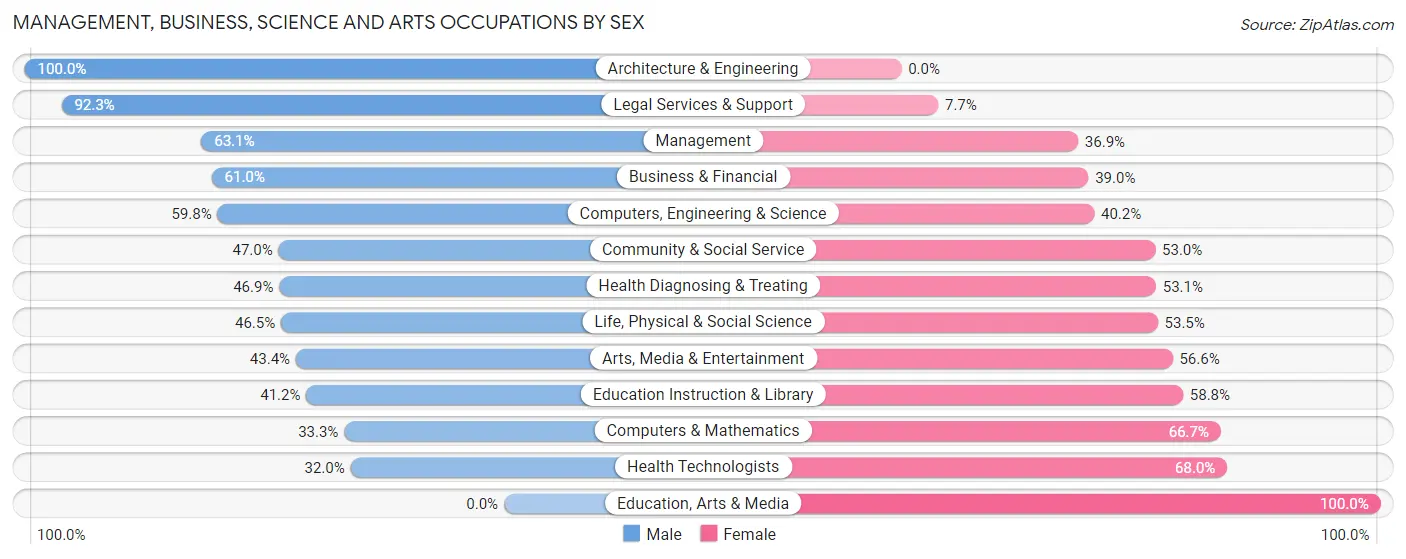
Management, Business, Science and Arts Occupations by Sex
Within the Management, Business, Science and Arts occupations in Emigration Canyon, the most male-oriented occupations are Architecture & Engineering (100.0%), Legal Services & Support (92.3%), and Management (63.1%), while the most female-oriented occupations are Education, Arts & Media (100.0%), Health Technologists (68.0%), and Computers & Mathematics (66.7%).
| Occupation | Male | Female |
| Management | 113 (63.1%) | 66 (36.9%) |
| Business & Financial | 25 (61.0%) | 16 (39.0%) |
| Computers, Engineering & Science | 49 (59.8%) | 33 (40.2%) |
| Computers & Mathematics | 5 (33.3%) | 10 (66.7%) |
| Architecture & Engineering | 24 (100.0%) | 0 (0.0%) |
| Life, Physical & Social Science | 20 (46.5%) | 23 (53.5%) |
| Community & Social Service | 87 (47.0%) | 98 (53.0%) |
| Education, Arts & Media | 0 (0.0%) | 9 (100.0%) |
| Legal Services & Support | 24 (92.3%) | 2 (7.7%) |
| Education Instruction & Library | 40 (41.2%) | 57 (58.8%) |
| Arts, Media & Entertainment | 23 (43.4%) | 30 (56.6%) |
| Health Diagnosing & Treating | 30 (46.9%) | 34 (53.1%) |
| Health Technologists | 16 (32.0%) | 34 (68.0%) |
| Total (Category) | 304 (55.2%) | 247 (44.8%) |
| Total (Overall) | 471 (56.1%) | 368 (43.9%) |
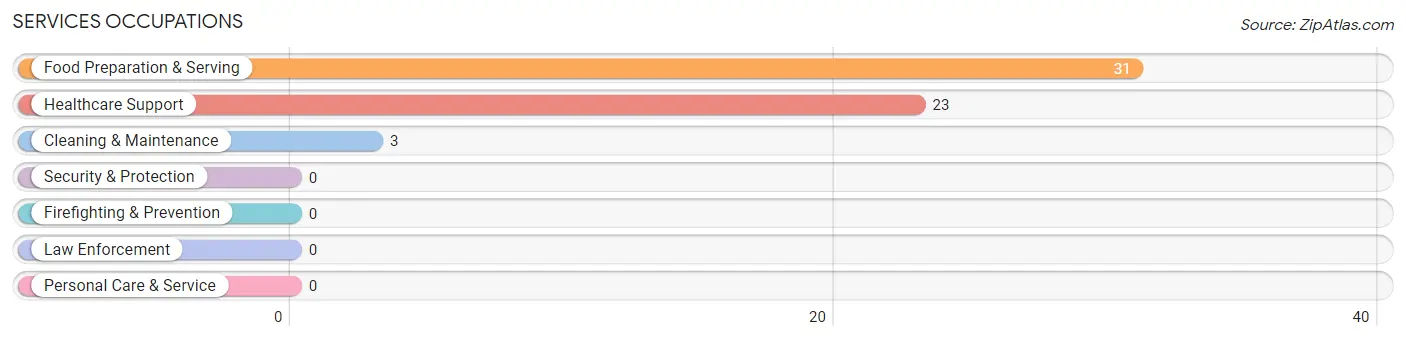
Services Occupations
The most common Services occupations in Emigration Canyon are Food Preparation & Serving (31 | 3.7%), Healthcare Support (23 | 2.7%), and Cleaning & Maintenance (3 | 0.4%).
Services Occupations by Sex
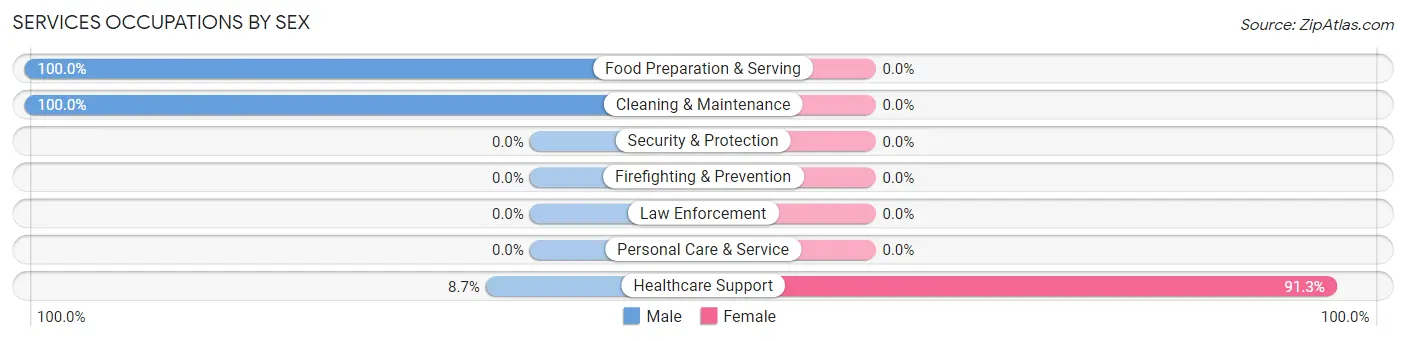
| Occupation | Male | Female |
| Healthcare Support | 2 (8.7%) | 21 (91.3%) |
| Security & Protection | 0 (0.0%) | 0 (0.0%) |
| Firefighting & Prevention | 0 (0.0%) | 0 (0.0%) |
| Law Enforcement | 0 (0.0%) | 0 (0.0%) |
| Food Preparation & Serving | 31 (100.0%) | 0 (0.0%) |
| Cleaning & Maintenance | 3 (100.0%) | 0 (0.0%) |
| Personal Care & Service | 0 (0.0%) | 0 (0.0%) |
| Total (Category) | 36 (63.2%) | 21 (36.8%) |
| Total (Overall) | 471 (56.1%) | 368 (43.9%) |
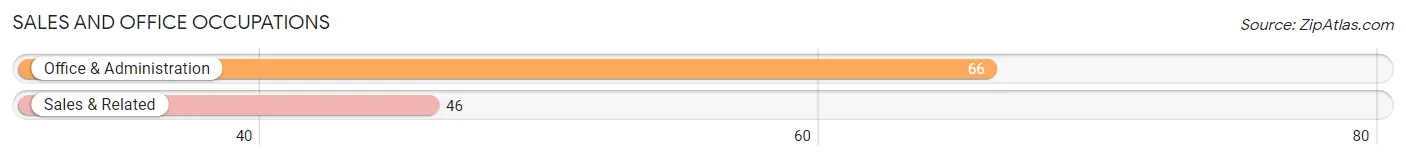
Sales and Office Occupations
The most common Sales and Office occupations in Emigration Canyon are Office & Administration (66 | 7.9%), and Sales & Related (46 | 5.5%).
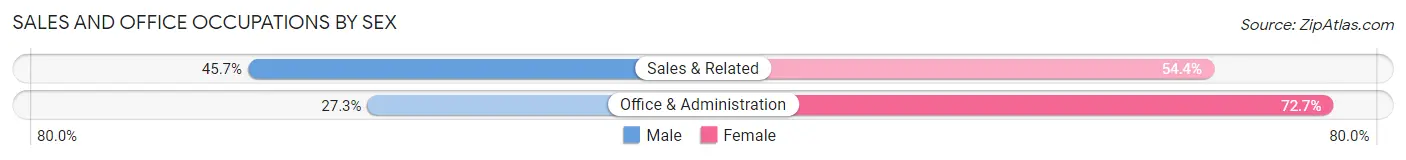
Sales and Office Occupations by Sex
| Occupation | Male | Female |
| Sales & Related | 21 (45.7%) | 25 (54.3%) |
| Office & Administration | 18 (27.3%) | 48 (72.7%) |
| Total (Category) | 39 (34.8%) | 73 (65.2%) |
| Total (Overall) | 471 (56.1%) | 368 (43.9%) |
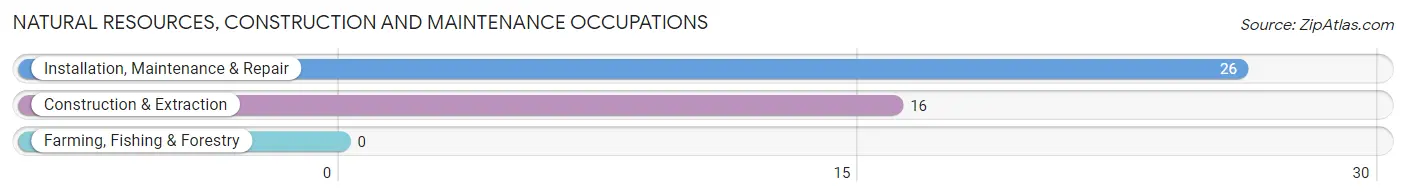
Natural Resources, Construction and Maintenance Occupations
The most common Natural Resources, Construction and Maintenance occupations in Emigration Canyon are Installation, Maintenance & Repair (26 | 3.1%), and Construction & Extraction (16 | 1.9%).
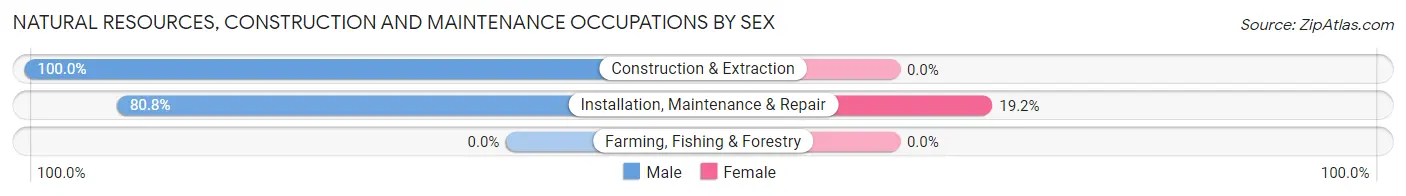
Natural Resources, Construction and Maintenance Occupations by Sex
| Occupation | Male | Female |
| Farming, Fishing & Forestry | 0 (0.0%) | 0 (0.0%) |
| Construction & Extraction | 16 (100.0%) | 0 (0.0%) |
| Installation, Maintenance & Repair | 21 (80.8%) | 5 (19.2%) |
| Total (Category) | 37 (88.1%) | 5 (11.9%) |
| Total (Overall) | 471 (56.1%) | 368 (43.9%) |
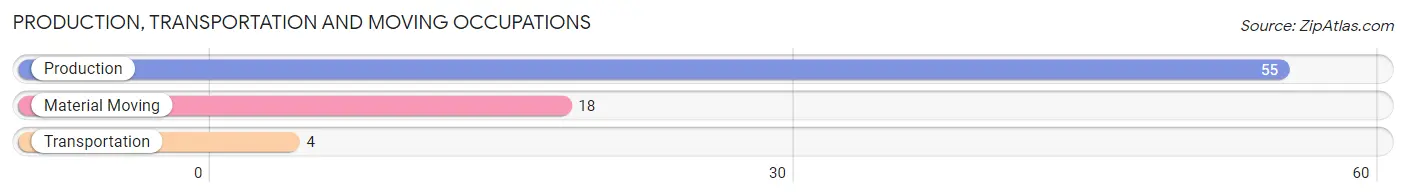
Production, Transportation and Moving Occupations
The most common Production, Transportation and Moving occupations in Emigration Canyon are Production (55 | 6.6%), Material Moving (18 | 2.1%), and Transportation (4 | 0.5%).
Production, Transportation and Moving Occupations by Sex
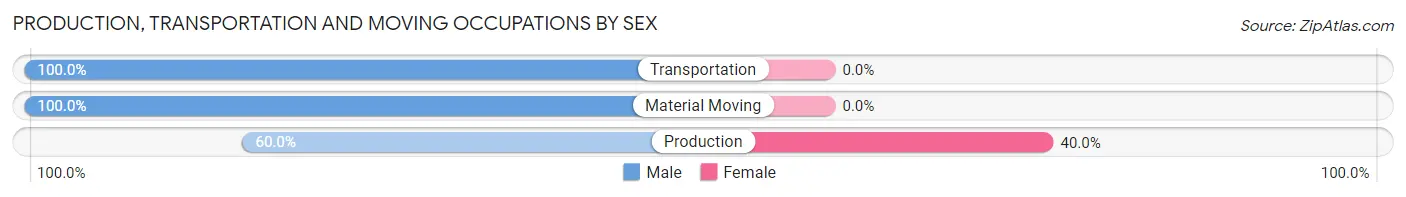
| Occupation | Male | Female |
| Production | 33 (60.0%) | 22 (40.0%) |
| Transportation | 4 (100.0%) | 0 (0.0%) |
| Material Moving | 18 (100.0%) | 0 (0.0%) |
| Total (Category) | 55 (71.4%) | 22 (28.6%) |
| Total (Overall) | 471 (56.1%) | 368 (43.9%) |
Employment Industries by Sex in Emigration Canyon
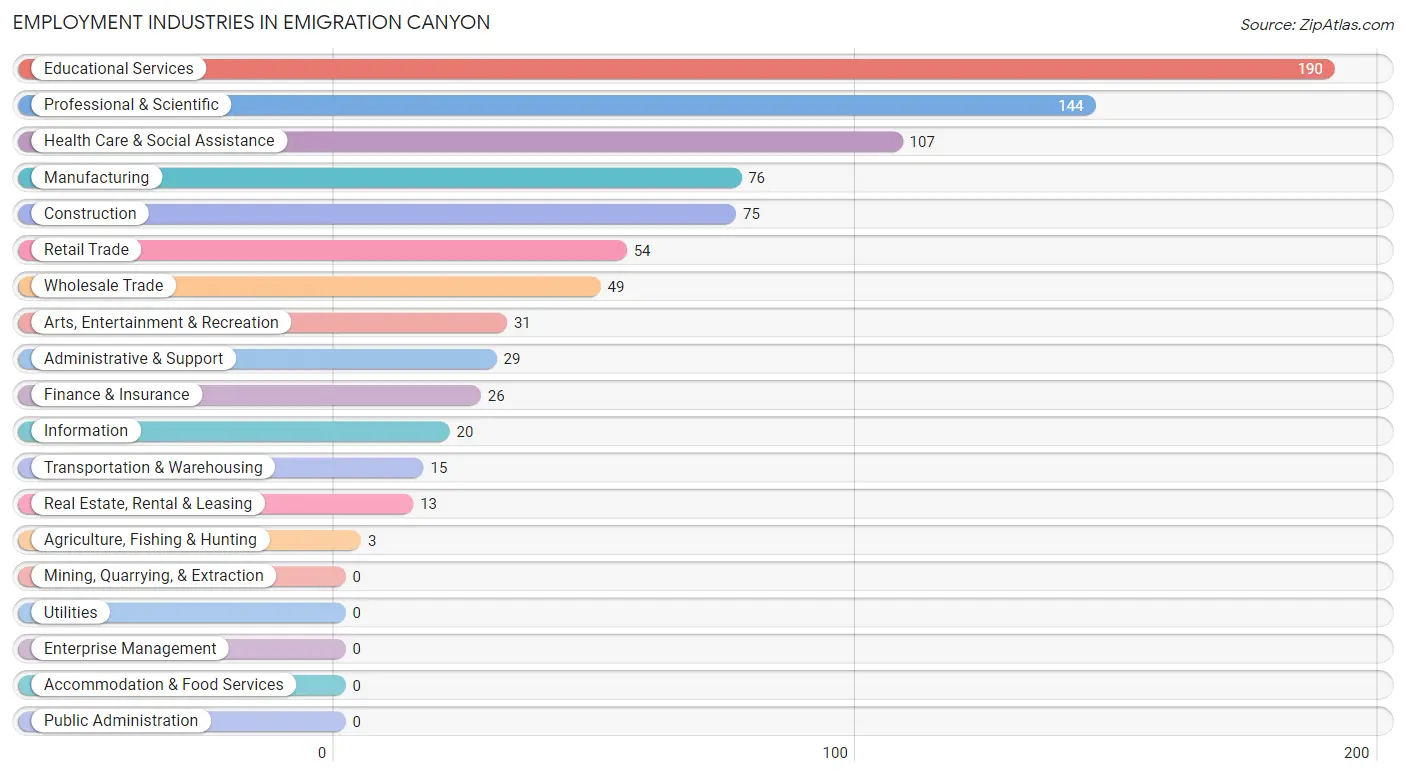
Employment Industries in Emigration Canyon
The major employment industries in Emigration Canyon include Educational Services (190 | 22.7%), Professional & Scientific (144 | 17.2%), Health Care & Social Assistance (107 | 12.8%), Manufacturing (76 | 9.1%), and Construction (75 | 8.9%).
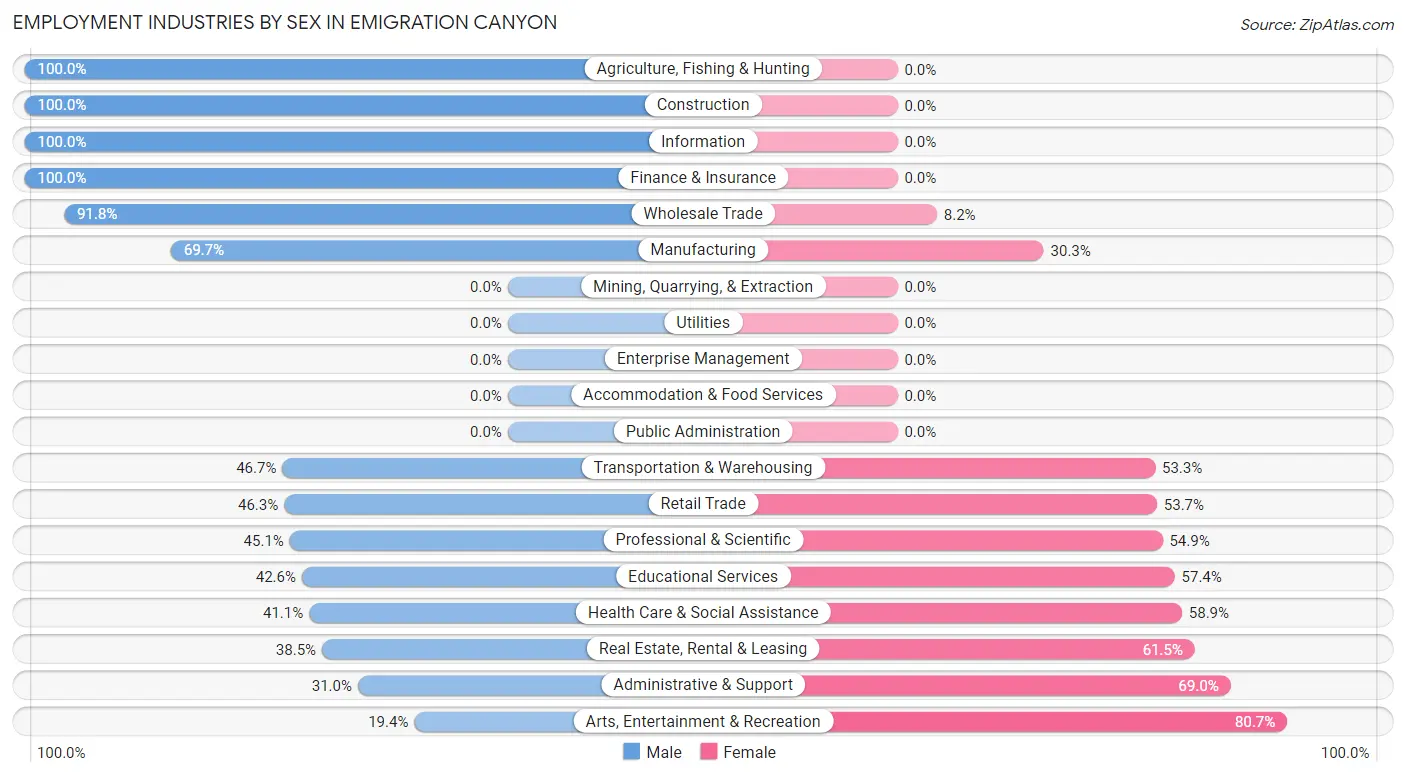
Employment Industries by Sex in Emigration Canyon
The Emigration Canyon industries that see more men than women are Agriculture, Fishing & Hunting (100.0%), Construction (100.0%), and Information (100.0%), whereas the industries that tend to have a higher number of women are Arts, Entertainment & Recreation (80.6%), Administrative & Support (69.0%), and Real Estate, Rental & Leasing (61.5%).
| Industry | Male | Female |
| Agriculture, Fishing & Hunting | 3 (100.0%) | 0 (0.0%) |
| Mining, Quarrying, & Extraction | 0 (0.0%) | 0 (0.0%) |
| Construction | 75 (100.0%) | 0 (0.0%) |
| Manufacturing | 53 (69.7%) | 23 (30.3%) |
| Wholesale Trade | 45 (91.8%) | 4 (8.2%) |
| Retail Trade | 25 (46.3%) | 29 (53.7%) |
| Transportation & Warehousing | 7 (46.7%) | 8 (53.3%) |
| Utilities | 0 (0.0%) | 0 (0.0%) |
| Information | 20 (100.0%) | 0 (0.0%) |
| Finance & Insurance | 26 (100.0%) | 0 (0.0%) |
| Real Estate, Rental & Leasing | 5 (38.5%) | 8 (61.5%) |
| Professional & Scientific | 65 (45.1%) | 79 (54.9%) |
| Enterprise Management | 0 (0.0%) | 0 (0.0%) |
| Administrative & Support | 9 (31.0%) | 20 (69.0%) |
| Educational Services | 81 (42.6%) | 109 (57.4%) |
| Health Care & Social Assistance | 44 (41.1%) | 63 (58.9%) |
| Arts, Entertainment & Recreation | 6 (19.4%) | 25 (80.6%) |
| Accommodation & Food Services | 0 (0.0%) | 0 (0.0%) |
| Public Administration | 0 (0.0%) | 0 (0.0%) |
| Total | 471 (56.1%) | 368 (43.9%) |
Education in Emigration Canyon
School Enrollment in Emigration Canyon
The most common levels of schooling among the 357 students in Emigration Canyon are high school (106 | 29.7%), middle school (95 | 26.6%), and college / undergraduate (76 | 21.3%).
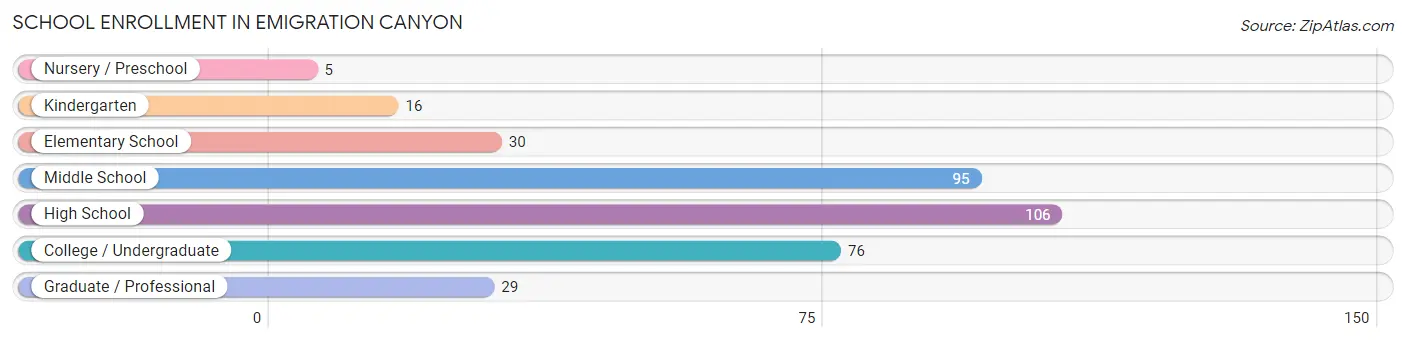
| School Level | # Students | % Students |
| Nursery / Preschool | 5 | 1.4% |
| Kindergarten | 16 | 4.5% |
| Elementary School | 30 | 8.4% |
| Middle School | 95 | 26.6% |
| High School | 106 | 29.7% |
| College / Undergraduate | 76 | 21.3% |
| Graduate / Professional | 29 | 8.1% |
| Total | 357 | 100.0% |
School Enrollment by Age by Funding Source in Emigration Canyon
Out of a total of 357 students who are enrolled in schools in Emigration Canyon, 113 (31.7%) attend a private institution, while the remaining 244 (68.3%) are enrolled in public schools. The age group of 3 to 4 year olds has the highest likelihood of being enrolled in private schools, with 5 (100.0% in the age bracket) enrolled. Conversely, the age group of 20 to 24 year olds has the lowest likelihood of being enrolled in a private school, with 27 (100.0% in the age bracket) attending a public institution.
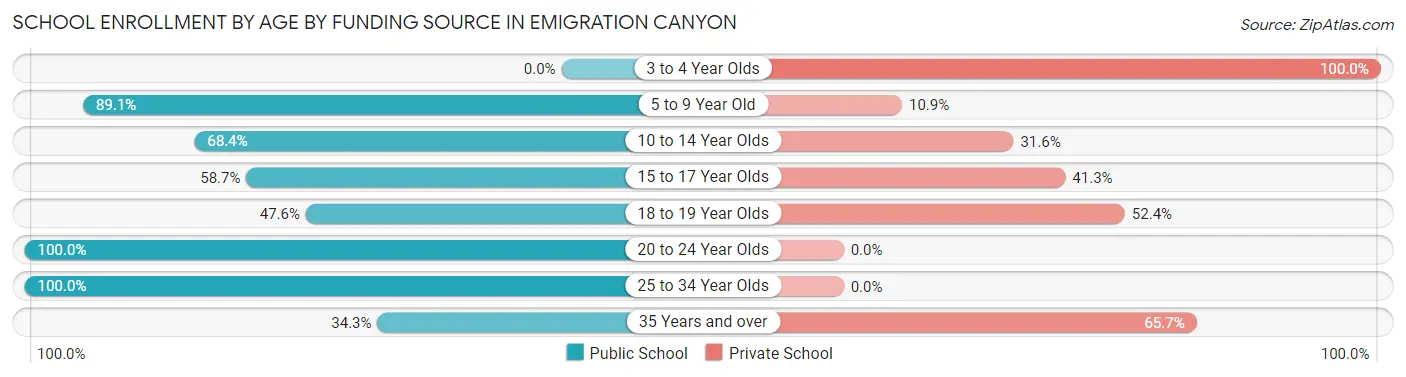
| Age Bracket | Public School | Private School |
| 3 to 4 Year Olds | 0 (0.0%) | 5 (100.0%) |
| 5 to 9 Year Old | 41 (89.1%) | 5 (10.9%) |
| 10 to 14 Year Olds | 67 (68.4%) | 31 (31.6%) |
| 15 to 17 Year Olds | 54 (58.7%) | 38 (41.3%) |
| 18 to 19 Year Olds | 10 (47.6%) | 11 (52.4%) |
| 20 to 24 Year Olds | 27 (100.0%) | 0 (0.0%) |
| 25 to 34 Year Olds | 33 (100.0%) | 0 (0.0%) |
| 35 Years and over | 12 (34.3%) | 23 (65.7%) |
| Total | 244 (68.3%) | 113 (31.7%) |
Educational Attainment by Field of Study in Emigration Canyon
Engineering (155 | 19.0%), bio, nature & agricultural (101 | 12.4%), social sciences (78 | 9.6%), science & technology (75 | 9.2%), and business (64 | 7.9%) are the most common fields of study among 815 individuals in Emigration Canyon who have obtained a bachelor's degree or higher.
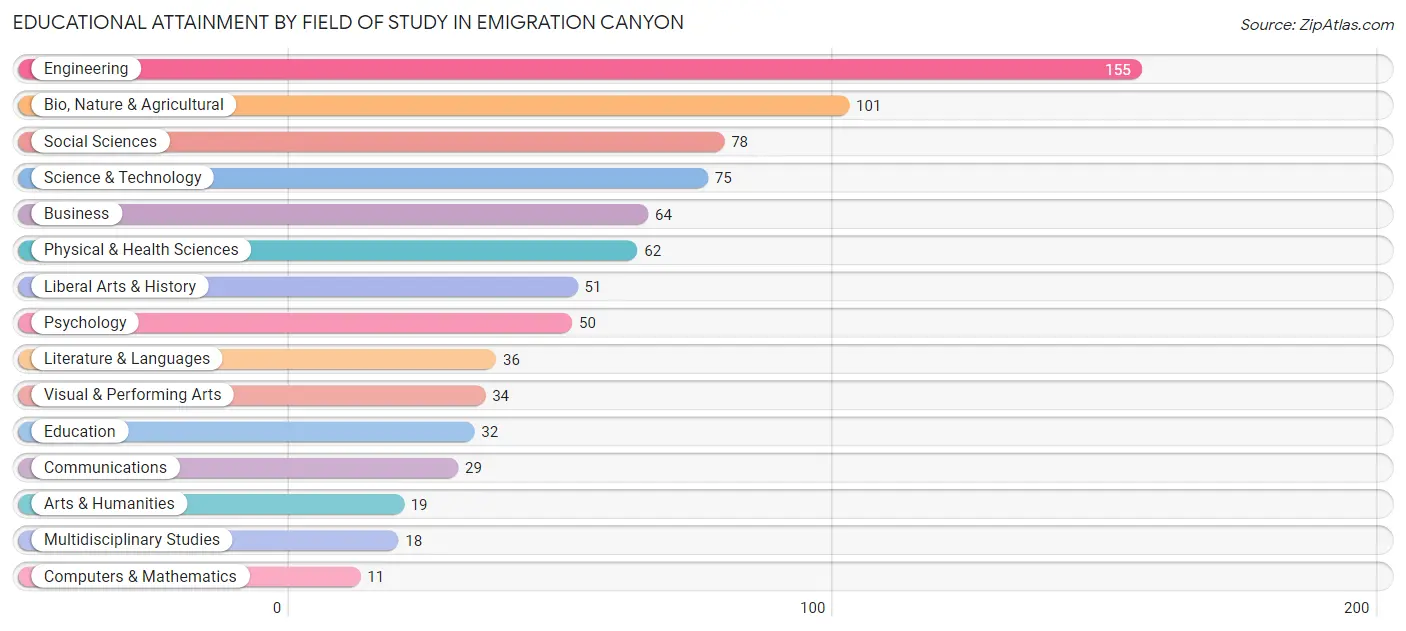
| Field of Study | # Graduates | % Graduates |
| Computers & Mathematics | 11 | 1.3% |
| Bio, Nature & Agricultural | 101 | 12.4% |
| Physical & Health Sciences | 62 | 7.6% |
| Psychology | 50 | 6.1% |
| Social Sciences | 78 | 9.6% |
| Engineering | 155 | 19.0% |
| Multidisciplinary Studies | 18 | 2.2% |
| Science & Technology | 75 | 9.2% |
| Business | 64 | 7.9% |
| Education | 32 | 3.9% |
| Literature & Languages | 36 | 4.4% |
| Liberal Arts & History | 51 | 6.3% |
| Visual & Performing Arts | 34 | 4.2% |
| Communications | 29 | 3.6% |
| Arts & Humanities | 19 | 2.3% |
| Total | 815 | 100.0% |
Transportation & Commute in Emigration Canyon
Vehicle Availability by Sex in Emigration Canyon
The most prevalent vehicle ownership categories in Emigration Canyon are males with 3 vehicles (171, accounting for 37.8%) and females with 3 vehicles (158, making up 46.5%).
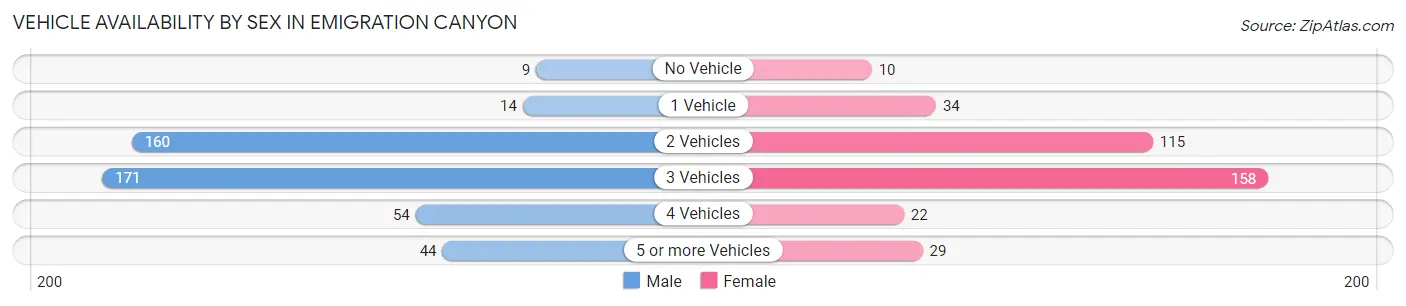
| Vehicles Available | Male | Female |
| No Vehicle | 9 (2.0%) | 10 (2.7%) |
| 1 Vehicle | 14 (3.1%) | 34 (9.2%) |
| 2 Vehicles | 160 (35.4%) | 115 (31.2%) |
| 3 Vehicles | 171 (37.8%) | 158 (42.9%) |
| 4 Vehicles | 54 (11.9%) | 22 (6.0%) |
| 5 or more Vehicles | 44 (9.7%) | 29 (7.9%) |
| Total | 452 (100.0%) | 368 (100.0%) |
Commute Time in Emigration Canyon
The most frequently occuring commute durations in Emigration Canyon are 15 to 19 minutes (163 commuters, 24.9%), 30 to 34 minutes (152 commuters, 23.2%), and 20 to 24 minutes (83 commuters, 12.7%).
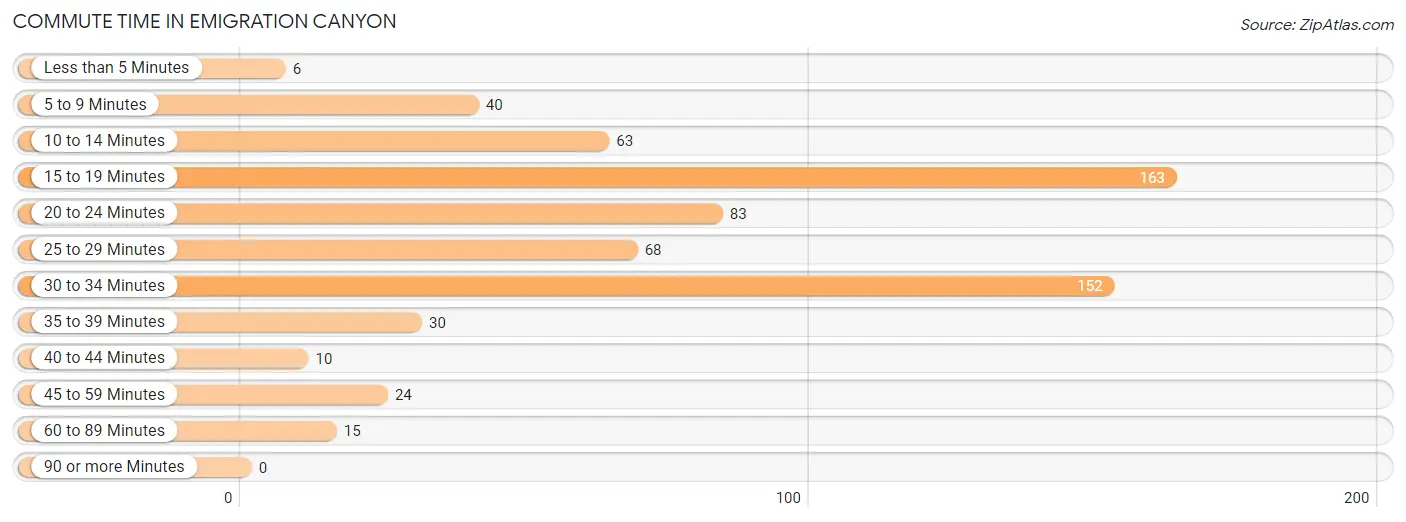
| Commute Time | # Commuters | % Commuters |
| Less than 5 Minutes | 6 | 0.9% |
| 5 to 9 Minutes | 40 | 6.1% |
| 10 to 14 Minutes | 63 | 9.6% |
| 15 to 19 Minutes | 163 | 24.9% |
| 20 to 24 Minutes | 83 | 12.7% |
| 25 to 29 Minutes | 68 | 10.4% |
| 30 to 34 Minutes | 152 | 23.2% |
| 35 to 39 Minutes | 30 | 4.6% |
| 40 to 44 Minutes | 10 | 1.5% |
| 45 to 59 Minutes | 24 | 3.7% |
| 60 to 89 Minutes | 15 | 2.3% |
| 90 or more Minutes | 0 | 0.0% |
Commute Time by Sex in Emigration Canyon
The most common commute times in Emigration Canyon are 30 to 34 minutes (83 commuters, 22.8%) for males and 15 to 19 minutes (107 commuters, 36.9%) for females.
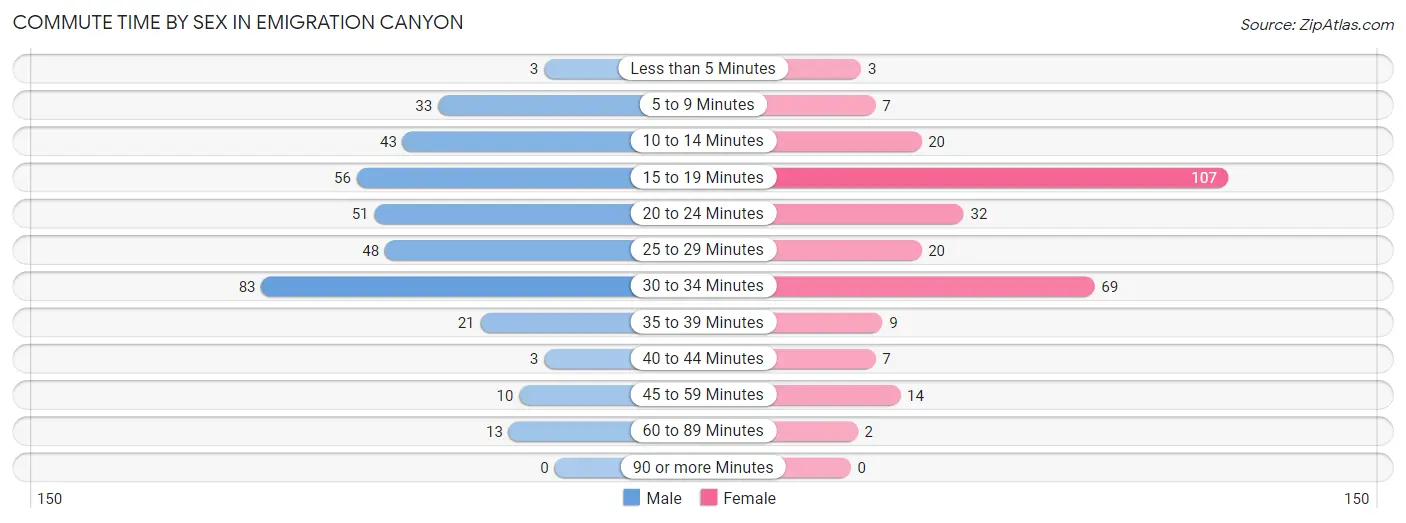
| Commute Time | Male | Female |
| Less than 5 Minutes | 3 (0.8%) | 3 (1.0%) |
| 5 to 9 Minutes | 33 (9.1%) | 7 (2.4%) |
| 10 to 14 Minutes | 43 (11.8%) | 20 (6.9%) |
| 15 to 19 Minutes | 56 (15.4%) | 107 (36.9%) |
| 20 to 24 Minutes | 51 (14.0%) | 32 (11.0%) |
| 25 to 29 Minutes | 48 (13.2%) | 20 (6.9%) |
| 30 to 34 Minutes | 83 (22.8%) | 69 (23.8%) |
| 35 to 39 Minutes | 21 (5.8%) | 9 (3.1%) |
| 40 to 44 Minutes | 3 (0.8%) | 7 (2.4%) |
| 45 to 59 Minutes | 10 (2.8%) | 14 (4.8%) |
| 60 to 89 Minutes | 13 (3.6%) | 2 (0.7%) |
| 90 or more Minutes | 0 (0.0%) | 0 (0.0%) |
Time of Departure to Work by Sex in Emigration Canyon
The most frequent times of departure to work in Emigration Canyon are 7:30 AM to 7:59 AM (99, 27.2%) for males and 8:30 AM to 8:59 AM (61, 21.0%) for females.
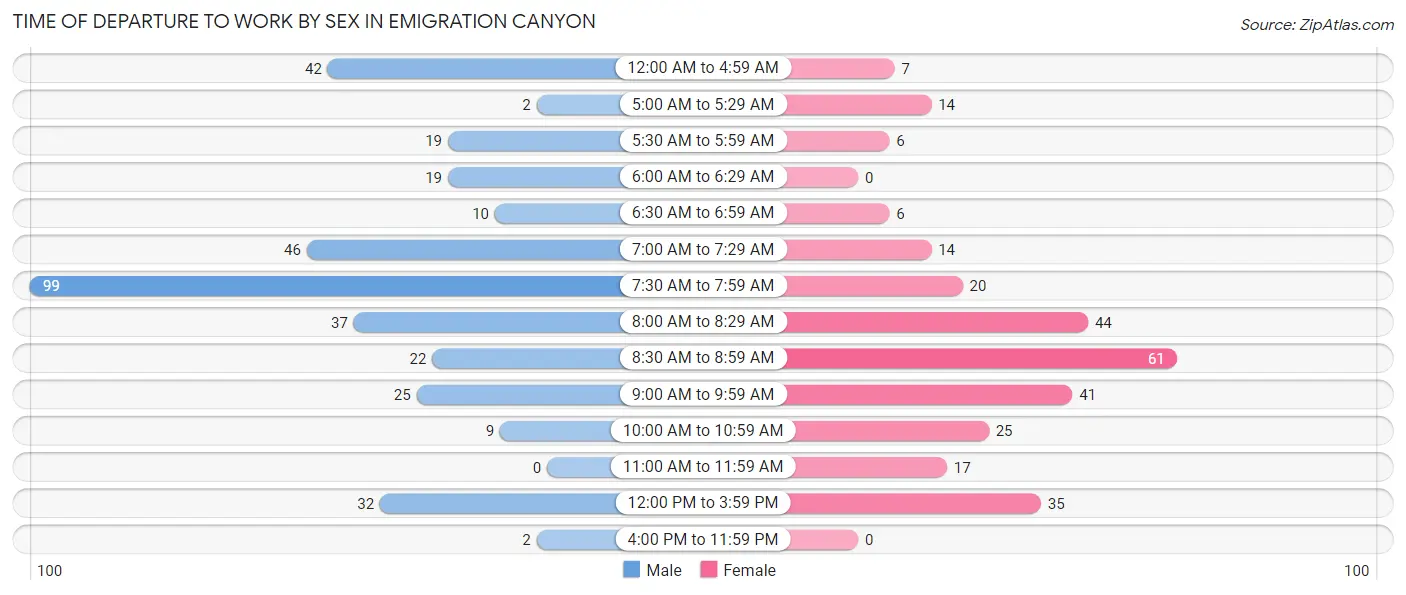
| Time of Departure | Male | Female |
| 12:00 AM to 4:59 AM | 42 (11.5%) | 7 (2.4%) |
| 5:00 AM to 5:29 AM | 2 (0.5%) | 14 (4.8%) |
| 5:30 AM to 5:59 AM | 19 (5.2%) | 6 (2.1%) |
| 6:00 AM to 6:29 AM | 19 (5.2%) | 0 (0.0%) |
| 6:30 AM to 6:59 AM | 10 (2.8%) | 6 (2.1%) |
| 7:00 AM to 7:29 AM | 46 (12.6%) | 14 (4.8%) |
| 7:30 AM to 7:59 AM | 99 (27.2%) | 20 (6.9%) |
| 8:00 AM to 8:29 AM | 37 (10.2%) | 44 (15.2%) |
| 8:30 AM to 8:59 AM | 22 (6.0%) | 61 (21.0%) |
| 9:00 AM to 9:59 AM | 25 (6.9%) | 41 (14.1%) |
| 10:00 AM to 10:59 AM | 9 (2.5%) | 25 (8.6%) |
| 11:00 AM to 11:59 AM | 0 (0.0%) | 17 (5.9%) |
| 12:00 PM to 3:59 PM | 32 (8.8%) | 35 (12.1%) |
| 4:00 PM to 11:59 PM | 2 (0.5%) | 0 (0.0%) |
| Total | 364 (100.0%) | 290 (100.0%) |
Housing Occupancy in Emigration Canyon
Occupancy by Ownership in Emigration Canyon
Of the total 571 dwellings in Emigration Canyon, owner-occupied units account for 533 (93.3%), while renter-occupied units make up 38 (6.7%).
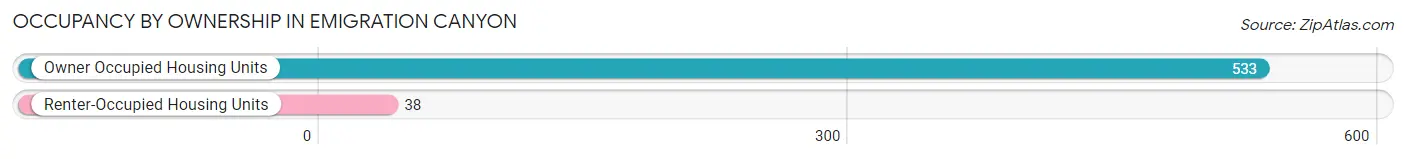
| Occupancy | # Housing Units | % Housing Units |
| Owner Occupied Housing Units | 533 | 93.3% |
| Renter-Occupied Housing Units | 38 | 6.7% |
| Total Occupied Housing Units | 571 | 100.0% |
Occupancy by Household Size in Emigration Canyon
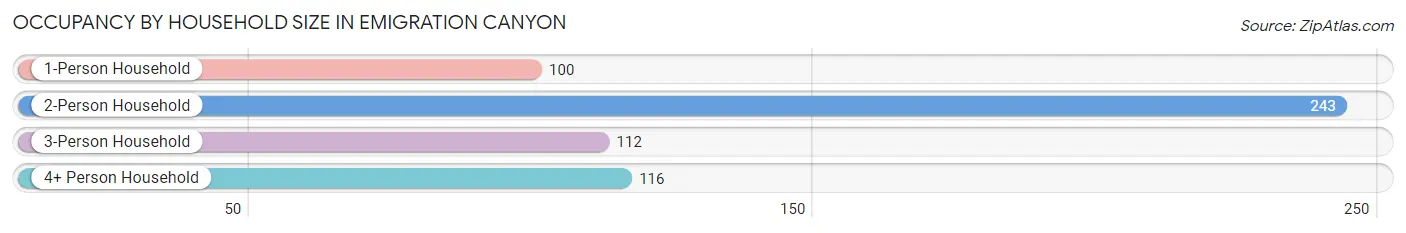
| Household Size | # Housing Units | % Housing Units |
| 1-Person Household | 100 | 17.5% |
| 2-Person Household | 243 | 42.6% |
| 3-Person Household | 112 | 19.6% |
| 4+ Person Household | 116 | 20.3% |
| Total Housing Units | 571 | 100.0% |
Occupancy by Ownership by Household Size in Emigration Canyon
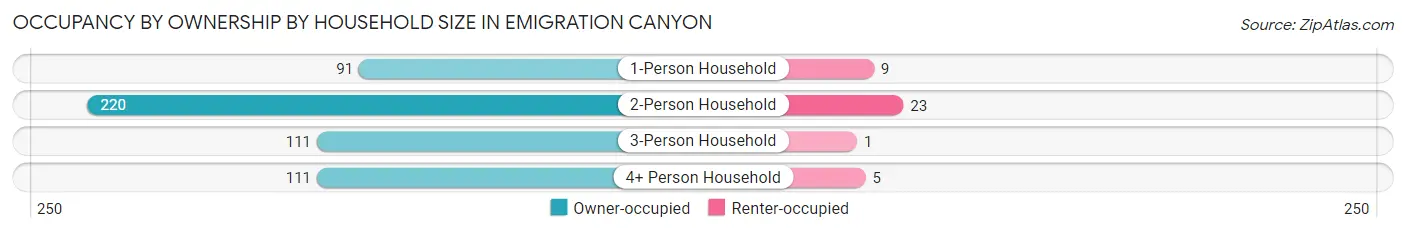
| Household Size | Owner-occupied | Renter-occupied |
| 1-Person Household | 91 (91.0%) | 9 (9.0%) |
| 2-Person Household | 220 (90.5%) | 23 (9.5%) |
| 3-Person Household | 111 (99.1%) | 1 (0.9%) |
| 4+ Person Household | 111 (95.7%) | 5 (4.3%) |
| Total Housing Units | 533 (93.3%) | 38 (6.7%) |
Occupancy by Educational Attainment in Emigration Canyon
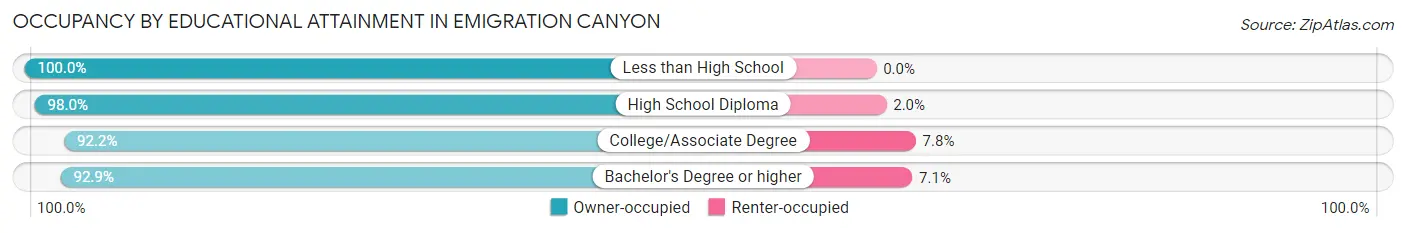
| Household Size | Owner-occupied | Renter-occupied |
| Less than High School | 14 (100.0%) | 0 (0.0%) |
| High School Diploma | 49 (98.0%) | 1 (2.0%) |
| College/Associate Degree | 106 (92.2%) | 9 (7.8%) |
| Bachelor's Degree or higher | 364 (92.9%) | 28 (7.1%) |
Occupancy by Age of Householder in Emigration Canyon
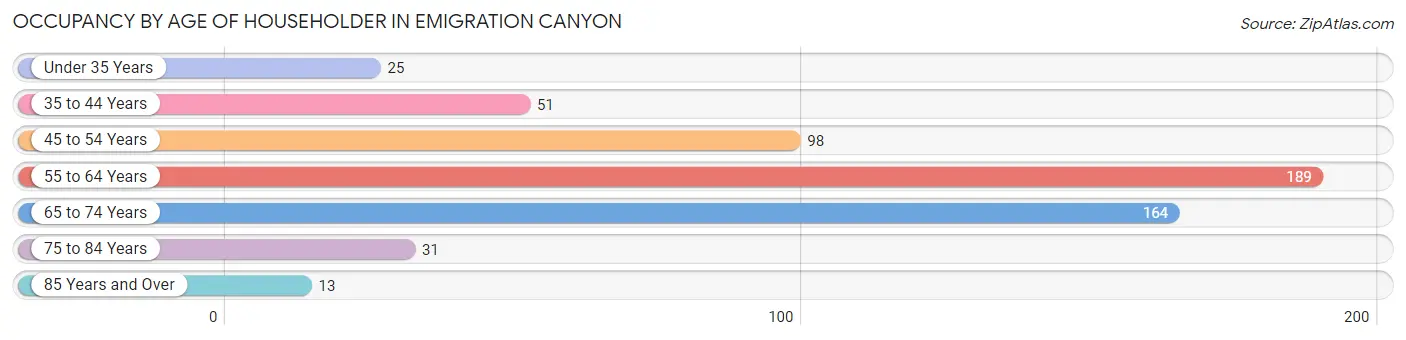
| Age Bracket | # Households | % Households |
| Under 35 Years | 25 | 4.4% |
| 35 to 44 Years | 51 | 8.9% |
| 45 to 54 Years | 98 | 17.2% |
| 55 to 64 Years | 189 | 33.1% |
| 65 to 74 Years | 164 | 28.7% |
| 75 to 84 Years | 31 | 5.4% |
| 85 Years and Over | 13 | 2.3% |
| Total | 571 | 100.0% |
Housing Finances in Emigration Canyon
Median Income by Occupancy in Emigration Canyon
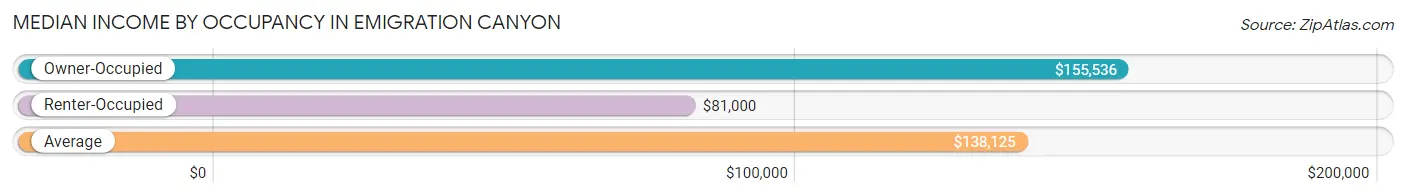
| Occupancy Type | # Households | Median Income |
| Owner-Occupied | 533 (93.3%) | $155,536 |
| Renter-Occupied | 38 (6.7%) | $81,000 |
| Average | 571 (100.0%) | $138,125 |
Occupancy by Householder Income Bracket in Emigration Canyon
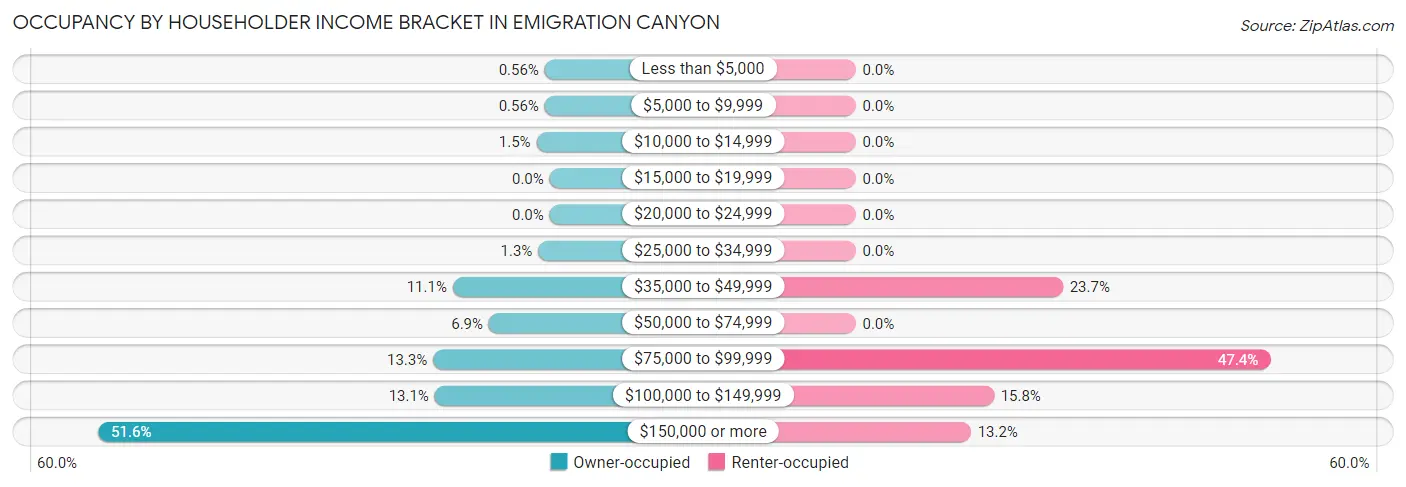
| Income Bracket | Owner-occupied | Renter-occupied |
| Less than $5,000 | 3 (0.6%) | 0 (0.0%) |
| $5,000 to $9,999 | 3 (0.6%) | 0 (0.0%) |
| $10,000 to $14,999 | 8 (1.5%) | 0 (0.0%) |
| $15,000 to $19,999 | 0 (0.0%) | 0 (0.0%) |
| $20,000 to $24,999 | 0 (0.0%) | 0 (0.0%) |
| $25,000 to $34,999 | 7 (1.3%) | 0 (0.0%) |
| $35,000 to $49,999 | 59 (11.1%) | 9 (23.7%) |
| $50,000 to $74,999 | 37 (6.9%) | 0 (0.0%) |
| $75,000 to $99,999 | 71 (13.3%) | 18 (47.4%) |
| $100,000 to $149,999 | 70 (13.1%) | 6 (15.8%) |
| $150,000 or more | 275 (51.6%) | 5 (13.2%) |
| Total | 533 (100.0%) | 38 (100.0%) |
Monthly Housing Cost Tiers in Emigration Canyon
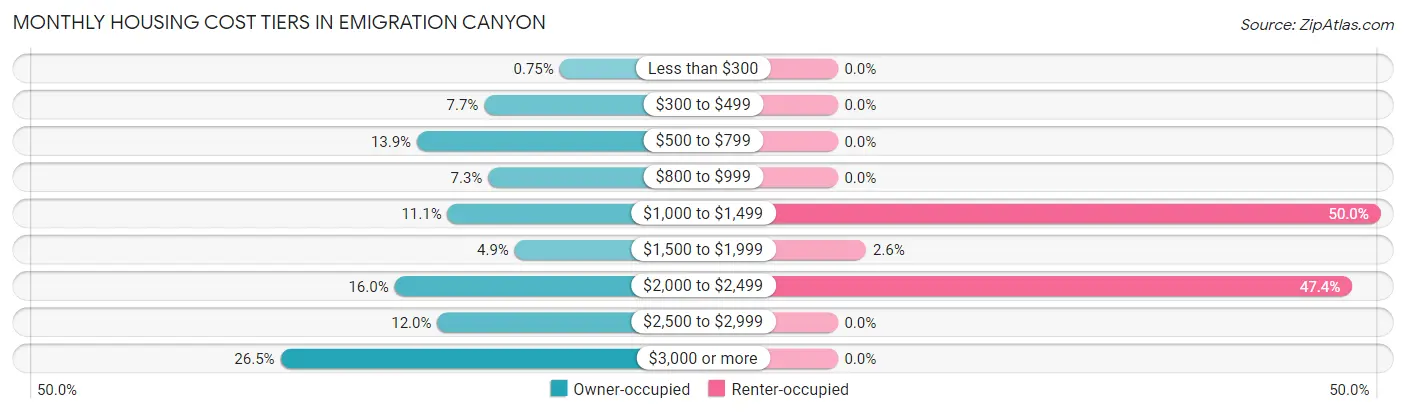
| Monthly Cost | Owner-occupied | Renter-occupied |
| Less than $300 | 4 (0.7%) | 0 (0.0%) |
| $300 to $499 | 41 (7.7%) | 0 (0.0%) |
| $500 to $799 | 74 (13.9%) | 0 (0.0%) |
| $800 to $999 | 39 (7.3%) | 0 (0.0%) |
| $1,000 to $1,499 | 59 (11.1%) | 19 (50.0%) |
| $1,500 to $1,999 | 26 (4.9%) | 1 (2.6%) |
| $2,000 to $2,499 | 85 (16.0%) | 18 (47.4%) |
| $2,500 to $2,999 | 64 (12.0%) | 0 (0.0%) |
| $3,000 or more | 141 (26.5%) | 0 (0.0%) |
| Total | 533 (100.0%) | 38 (100.0%) |
Physical Housing Characteristics in Emigration Canyon
Housing Structures in Emigration Canyon
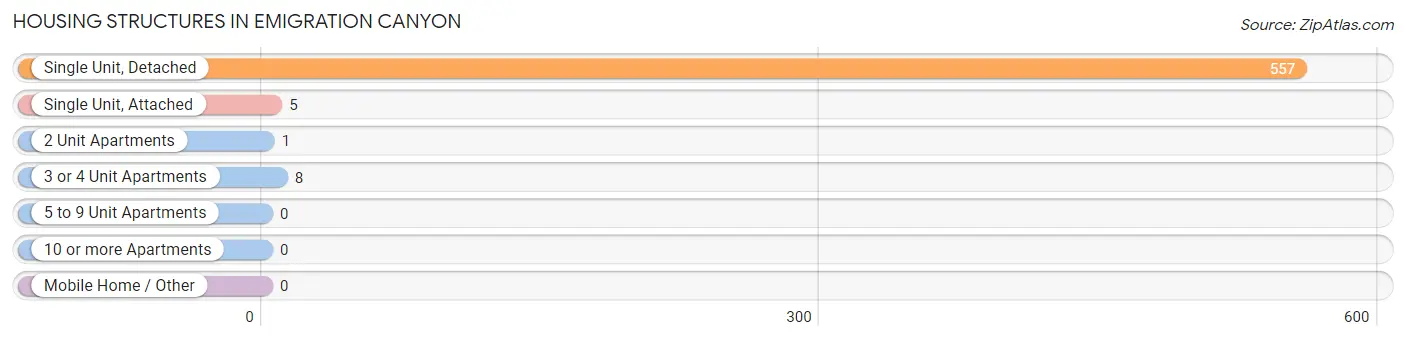
| Structure Type | # Housing Units | % Housing Units |
| Single Unit, Detached | 557 | 97.6% |
| Single Unit, Attached | 5 | 0.9% |
| 2 Unit Apartments | 1 | 0.2% |
| 3 or 4 Unit Apartments | 8 | 1.4% |
| 5 to 9 Unit Apartments | 0 | 0.0% |
| 10 or more Apartments | 0 | 0.0% |
| Mobile Home / Other | 0 | 0.0% |
| Total | 571 | 100.0% |
Housing Structures by Occupancy in Emigration Canyon
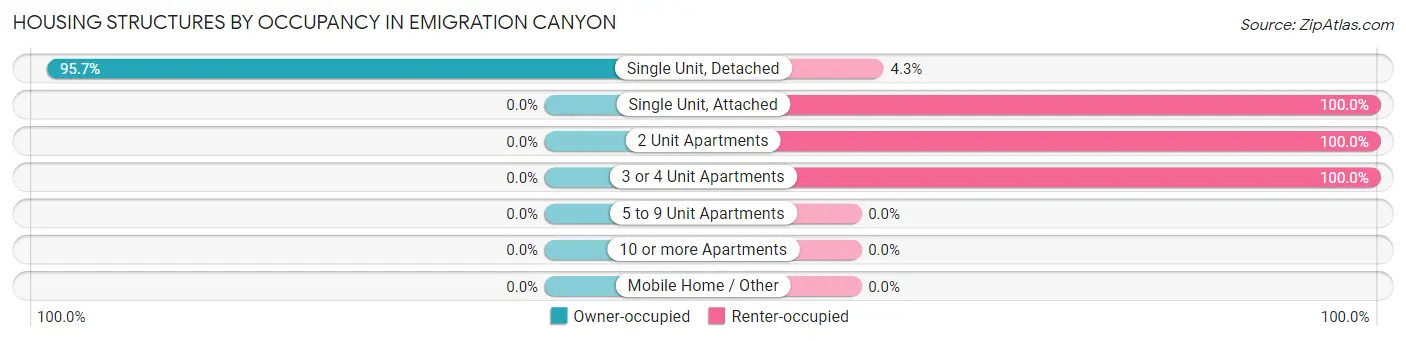
| Structure Type | Owner-occupied | Renter-occupied |
| Single Unit, Detached | 533 (95.7%) | 24 (4.3%) |
| Single Unit, Attached | 0 (0.0%) | 5 (100.0%) |
| 2 Unit Apartments | 0 (0.0%) | 1 (100.0%) |
| 3 or 4 Unit Apartments | 0 (0.0%) | 8 (100.0%) |
| 5 to 9 Unit Apartments | 0 (0.0%) | 0 (0.0%) |
| 10 or more Apartments | 0 (0.0%) | 0 (0.0%) |
| Mobile Home / Other | 0 (0.0%) | 0 (0.0%) |
| Total | 533 (93.3%) | 38 (6.7%) |
Housing Structures by Number of Rooms in Emigration Canyon
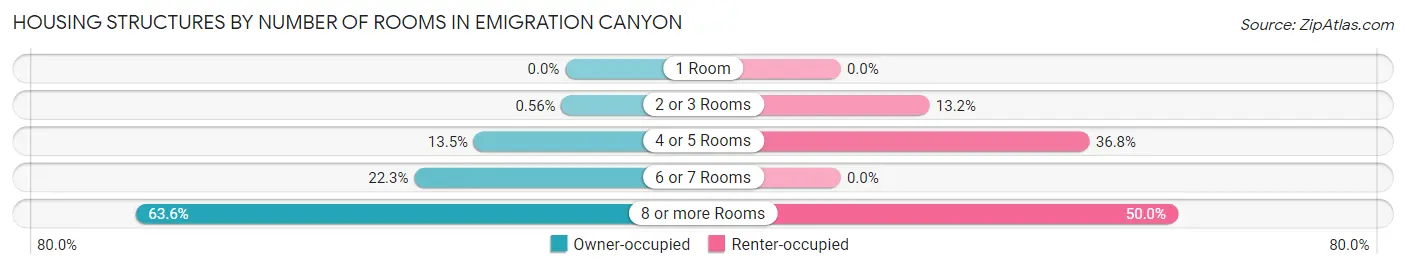
| Number of Rooms | Owner-occupied | Renter-occupied |
| 1 Room | 0 (0.0%) | 0 (0.0%) |
| 2 or 3 Rooms | 3 (0.6%) | 5 (13.2%) |
| 4 or 5 Rooms | 72 (13.5%) | 14 (36.8%) |
| 6 or 7 Rooms | 119 (22.3%) | 0 (0.0%) |
| 8 or more Rooms | 339 (63.6%) | 19 (50.0%) |
| Total | 533 (100.0%) | 38 (100.0%) |
Housing Structure by Heating Type in Emigration Canyon
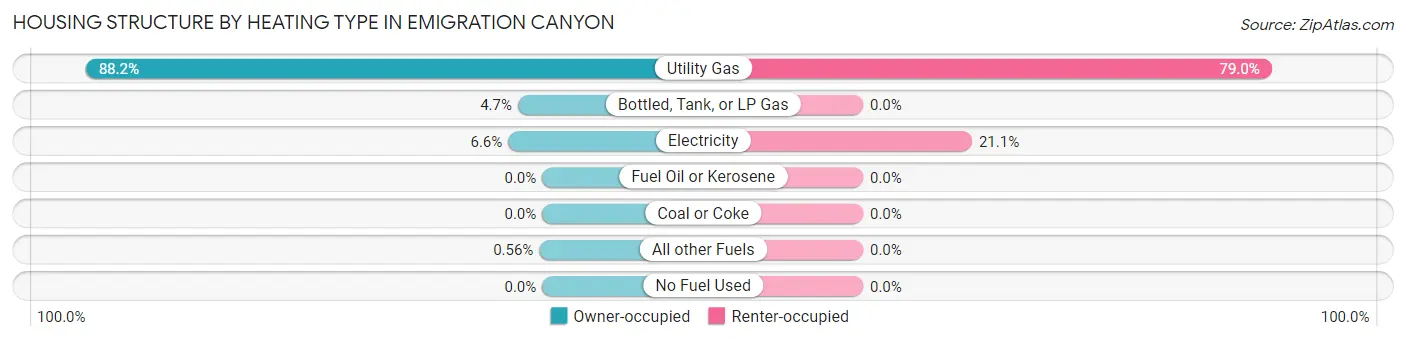
| Heating Type | Owner-occupied | Renter-occupied |
| Utility Gas | 470 (88.2%) | 30 (78.9%) |
| Bottled, Tank, or LP Gas | 25 (4.7%) | 0 (0.0%) |
| Electricity | 35 (6.6%) | 8 (21.0%) |
| Fuel Oil or Kerosene | 0 (0.0%) | 0 (0.0%) |
| Coal or Coke | 0 (0.0%) | 0 (0.0%) |
| All other Fuels | 3 (0.6%) | 0 (0.0%) |
| No Fuel Used | 0 (0.0%) | 0 (0.0%) |
| Total | 533 (100.0%) | 38 (100.0%) |
Household Vehicle Usage in Emigration Canyon
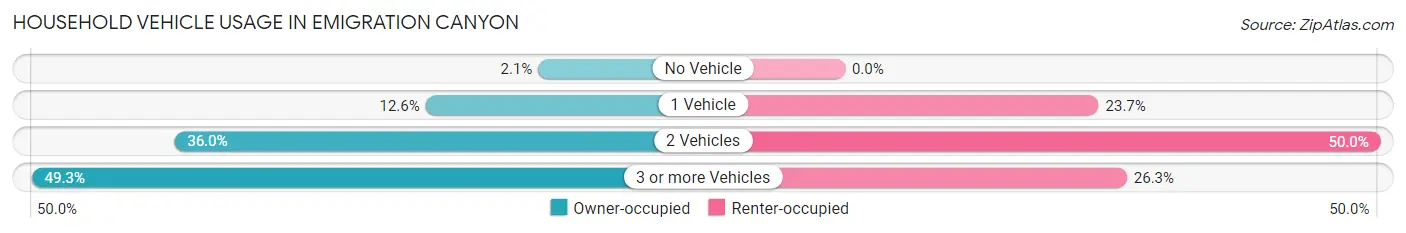
| Vehicles per Household | Owner-occupied | Renter-occupied |
| No Vehicle | 11 (2.1%) | 0 (0.0%) |
| 1 Vehicle | 67 (12.6%) | 9 (23.7%) |
| 2 Vehicles | 192 (36.0%) | 19 (50.0%) |
| 3 or more Vehicles | 263 (49.3%) | 10 (26.3%) |
| Total | 533 (100.0%) | 38 (100.0%) |
Real Estate & Mortgages in Emigration Canyon
Real Estate and Mortgage Overview in Emigration Canyon
| Characteristic | Without Mortgage | With Mortgage |
| Housing Units | 236 | 297 |
| Median Property Value | $949,100 | $813,900 |
| Median Household Income | $110,000 | $173 |
| Monthly Housing Costs | $798 | $134 |
| Real Estate Taxes | $6,118 | $3 |
Property Value by Mortgage Status in Emigration Canyon
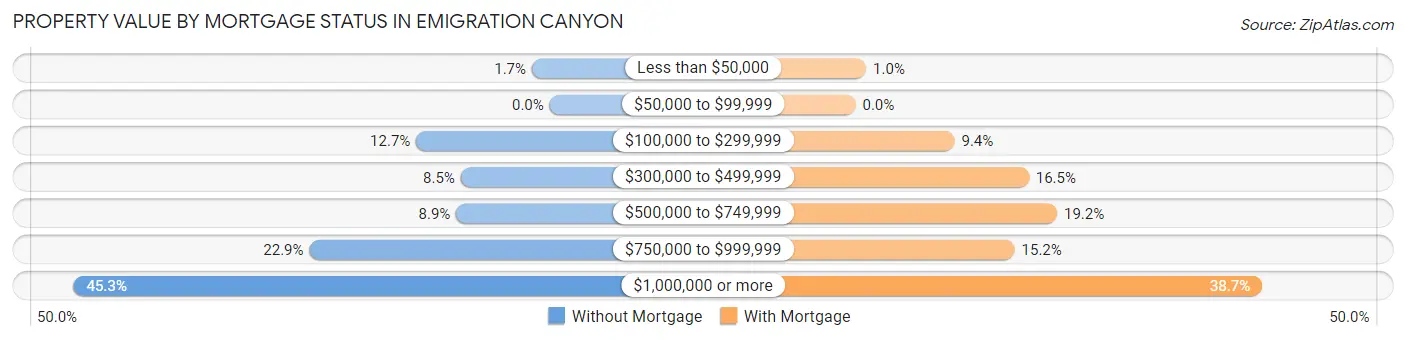
| Property Value | Without Mortgage | With Mortgage |
| Less than $50,000 | 4 (1.7%) | 3 (1.0%) |
| $50,000 to $99,999 | 0 (0.0%) | 0 (0.0%) |
| $100,000 to $299,999 | 30 (12.7%) | 28 (9.4%) |
| $300,000 to $499,999 | 20 (8.5%) | 49 (16.5%) |
| $500,000 to $749,999 | 21 (8.9%) | 57 (19.2%) |
| $750,000 to $999,999 | 54 (22.9%) | 45 (15.1%) |
| $1,000,000 or more | 107 (45.3%) | 115 (38.7%) |
| Total | 236 (100.0%) | 297 (100.0%) |
Household Income by Mortgage Status in Emigration Canyon
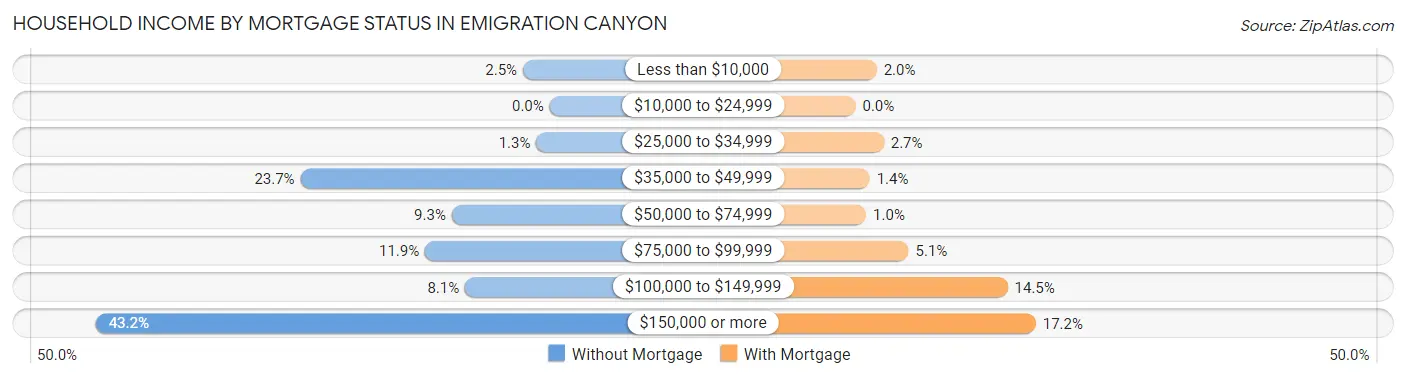
| Household Income | Without Mortgage | With Mortgage |
| Less than $10,000 | 6 (2.5%) | 6 (2.0%) |
| $10,000 to $24,999 | 0 (0.0%) | 0 (0.0%) |
| $25,000 to $34,999 | 3 (1.3%) | 8 (2.7%) |
| $35,000 to $49,999 | 56 (23.7%) | 4 (1.3%) |
| $50,000 to $74,999 | 22 (9.3%) | 3 (1.0%) |
| $75,000 to $99,999 | 28 (11.9%) | 15 (5.1%) |
| $100,000 to $149,999 | 19 (8.1%) | 43 (14.5%) |
| $150,000 or more | 102 (43.2%) | 51 (17.2%) |
| Total | 236 (100.0%) | 297 (100.0%) |
Property Value to Household Income Ratio in Emigration Canyon
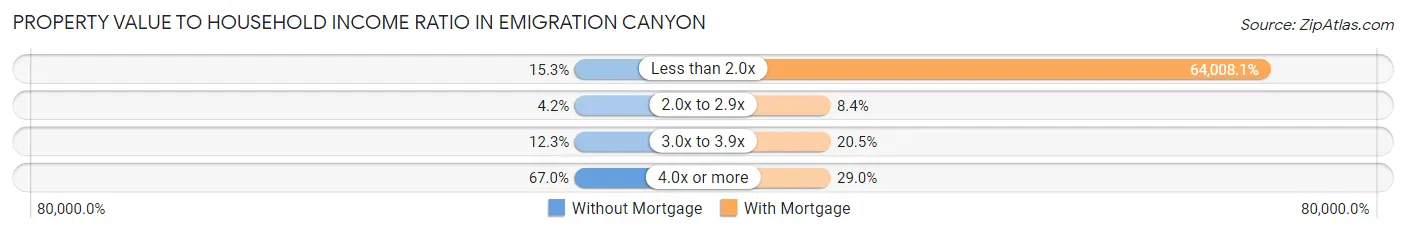
| Value-to-Income Ratio | Without Mortgage | With Mortgage |
| Less than 2.0x | 36 (15.2%) | 190,104 (64,008.1%) |
| 2.0x to 2.9x | 10 (4.2%) | 25 (8.4%) |
| 3.0x to 3.9x | 29 (12.3%) | 61 (20.5%) |
| 4.0x or more | 158 (66.9%) | 86 (29.0%) |
| Total | 236 (100.0%) | 297 (100.0%) |
Real Estate Taxes by Mortgage Status in Emigration Canyon
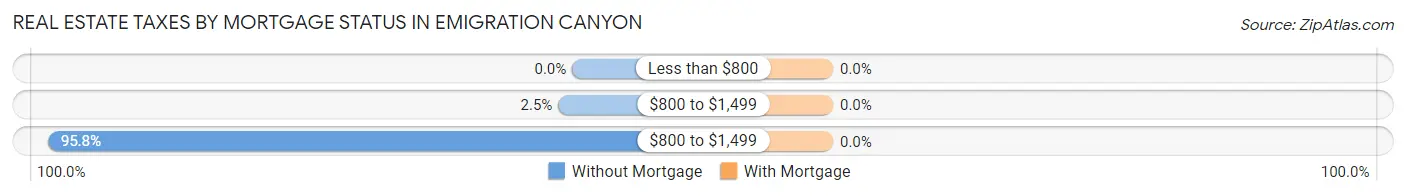
| Property Taxes | Without Mortgage | With Mortgage |
| Less than $800 | 0 (0.0%) | 0 (0.0%) |
| $800 to $1,499 | 6 (2.5%) | 0 (0.0%) |
| $800 to $1,499 | 226 (95.8%) | 0 (0.0%) |
| Total | 236 (100.0%) | 297 (100.0%) |
Health & Disability in Emigration Canyon
Health Insurance Coverage by Age in Emigration Canyon
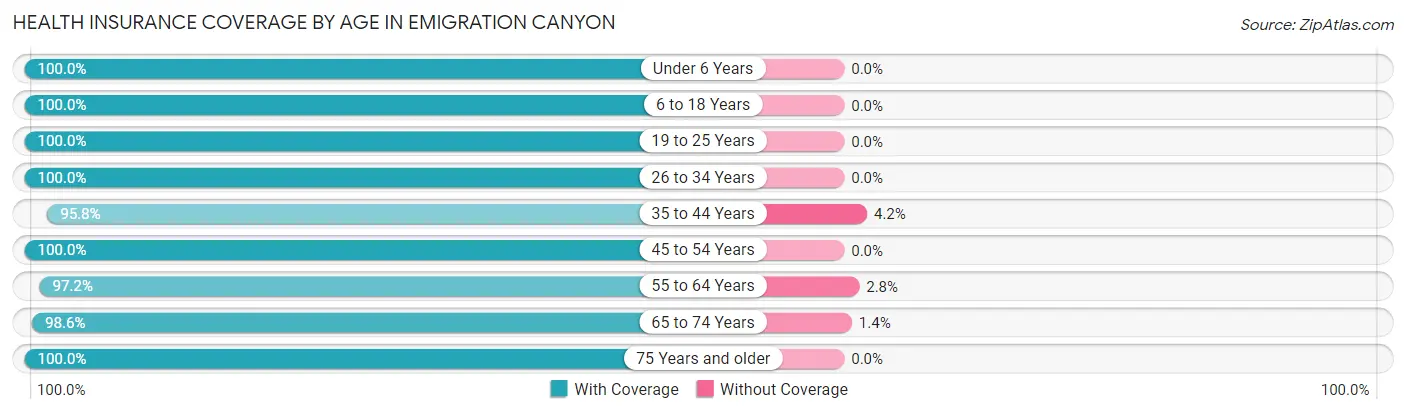
| Age Bracket | With Coverage | Without Coverage |
| Under 6 Years | 29 (100.0%) | 0 (0.0%) |
| 6 to 18 Years | 243 (100.0%) | 0 (0.0%) |
| 19 to 25 Years | 76 (100.0%) | 0 (0.0%) |
| 26 to 34 Years | 109 (100.0%) | 0 (0.0%) |
| 35 to 44 Years | 158 (95.8%) | 7 (4.2%) |
| 45 to 54 Years | 212 (100.0%) | 0 (0.0%) |
| 55 to 64 Years | 382 (97.2%) | 11 (2.8%) |
| 65 to 74 Years | 209 (98.6%) | 3 (1.4%) |
| 75 Years and older | 64 (100.0%) | 0 (0.0%) |
| Total | 1,482 (98.6%) | 21 (1.4%) |
Health Insurance Coverage by Citizenship Status in Emigration Canyon

| Citizenship Status | With Coverage | Without Coverage |
| Native Born | 29 (100.0%) | 0 (0.0%) |
| Foreign Born, Citizen | 243 (100.0%) | 0 (0.0%) |
| Foreign Born, not a Citizen | 76 (100.0%) | 0 (0.0%) |
Health Insurance Coverage by Household Income in Emigration Canyon
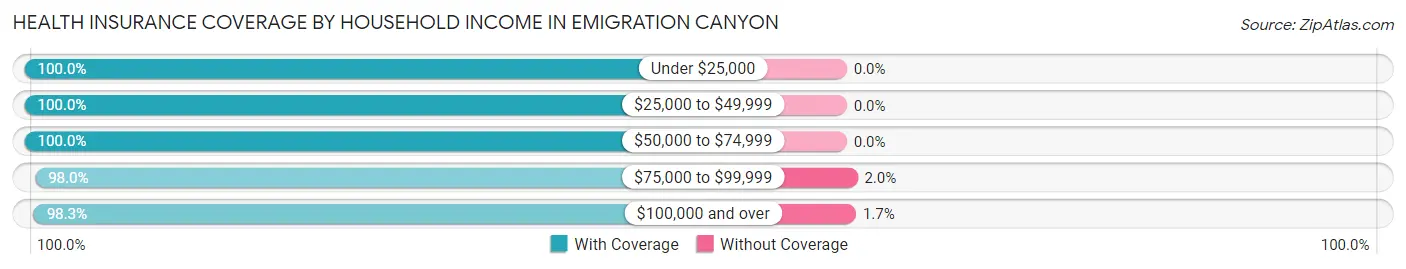
| Household Income | With Coverage | Without Coverage |
| Under $25,000 | 53 (100.0%) | 0 (0.0%) |
| $25,000 to $49,999 | 136 (100.0%) | 0 (0.0%) |
| $50,000 to $74,999 | 127 (100.0%) | 0 (0.0%) |
| $75,000 to $99,999 | 196 (98.0%) | 4 (2.0%) |
| $100,000 and over | 970 (98.3%) | 17 (1.7%) |
Public vs Private Health Insurance Coverage by Age in Emigration Canyon
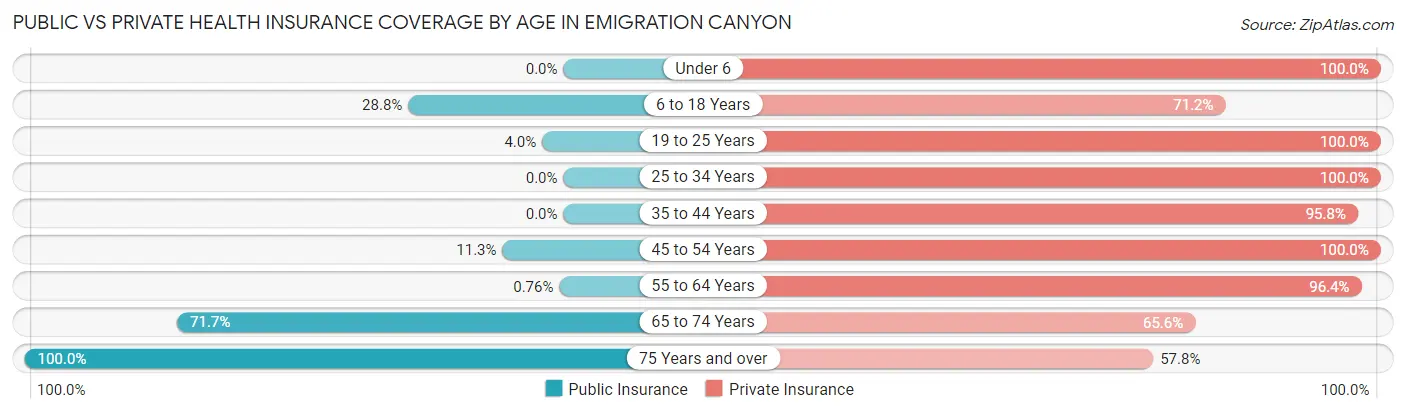
| Age Bracket | Public Insurance | Private Insurance |
| Under 6 | 0 (0.0%) | 29 (100.0%) |
| 6 to 18 Years | 70 (28.8%) | 173 (71.2%) |
| 19 to 25 Years | 3 (4.0%) | 76 (100.0%) |
| 25 to 34 Years | 0 (0.0%) | 109 (100.0%) |
| 35 to 44 Years | 0 (0.0%) | 158 (95.8%) |
| 45 to 54 Years | 24 (11.3%) | 212 (100.0%) |
| 55 to 64 Years | 3 (0.8%) | 379 (96.4%) |
| 65 to 74 Years | 152 (71.7%) | 139 (65.6%) |
| 75 Years and over | 64 (100.0%) | 37 (57.8%) |
| Total | 316 (21.0%) | 1,312 (87.3%) |
Disability Status by Sex by Age in Emigration Canyon
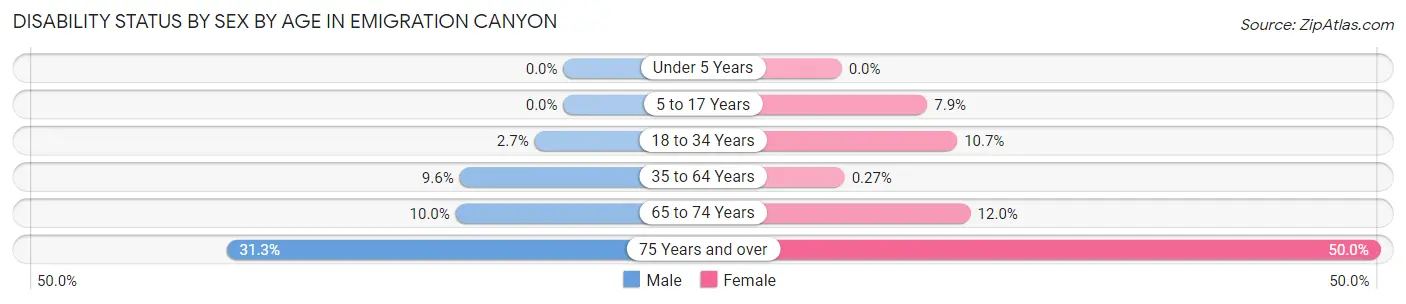
| Age Bracket | Male | Female |
| Under 5 Years | 0 (0.0%) | 0 (0.0%) |
| 5 to 17 Years | 0 (0.0%) | 10 (7.9%) |
| 18 to 34 Years | 3 (2.7%) | 9 (10.7%) |
| 35 to 64 Years | 38 (9.6%) | 1 (0.3%) |
| 65 to 74 Years | 12 (10.0%) | 11 (12.0%) |
| 75 Years and over | 10 (31.2%) | 16 (50.0%) |
Disability Class by Sex by Age in Emigration Canyon
Disability Class: Hearing Difficulty
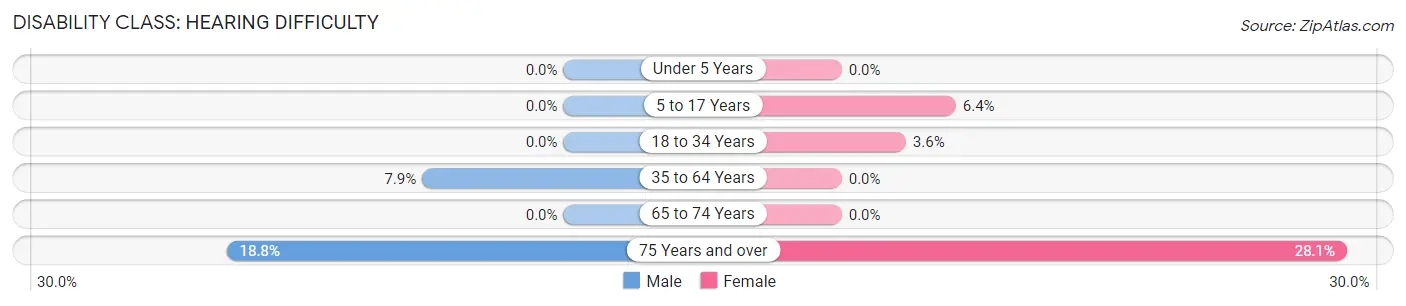
| Age Bracket | Male | Female |
| Under 5 Years | 0 (0.0%) | 0 (0.0%) |
| 5 to 17 Years | 0 (0.0%) | 8 (6.4%) |
| 18 to 34 Years | 0 (0.0%) | 3 (3.6%) |
| 35 to 64 Years | 31 (7.9%) | 0 (0.0%) |
| 65 to 74 Years | 0 (0.0%) | 0 (0.0%) |
| 75 Years and over | 6 (18.8%) | 9 (28.1%) |
Disability Class: Vision Difficulty
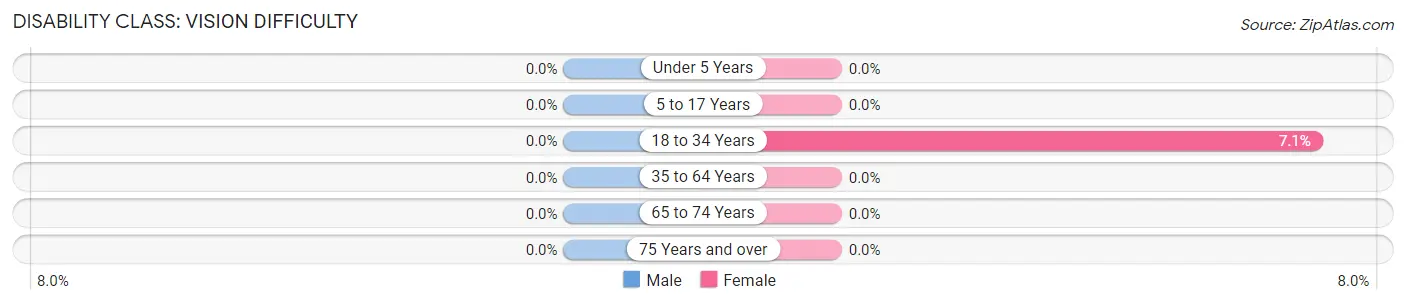
| Age Bracket | Male | Female |
| Under 5 Years | 0 (0.0%) | 0 (0.0%) |
| 5 to 17 Years | 0 (0.0%) | 0 (0.0%) |
| 18 to 34 Years | 0 (0.0%) | 6 (7.1%) |
| 35 to 64 Years | 0 (0.0%) | 0 (0.0%) |
| 65 to 74 Years | 0 (0.0%) | 0 (0.0%) |
| 75 Years and over | 0 (0.0%) | 0 (0.0%) |
Disability Class: Cognitive Difficulty
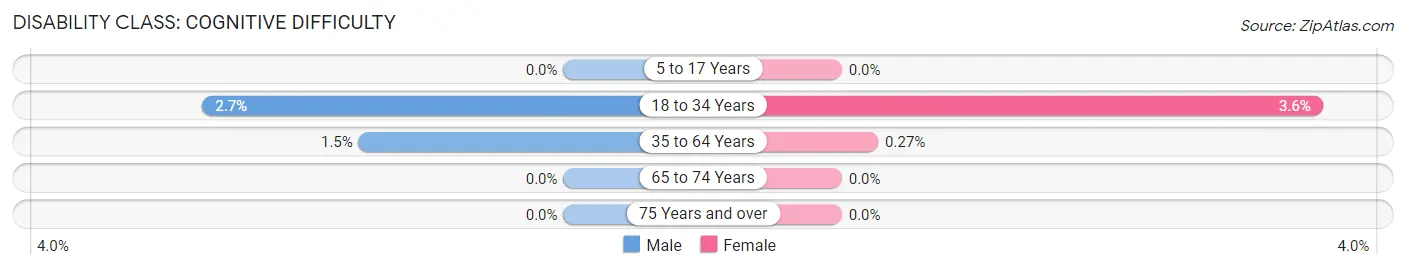
| Age Bracket | Male | Female |
| 5 to 17 Years | 0 (0.0%) | 0 (0.0%) |
| 18 to 34 Years | 3 (2.7%) | 3 (3.6%) |
| 35 to 64 Years | 6 (1.5%) | 1 (0.3%) |
| 65 to 74 Years | 0 (0.0%) | 0 (0.0%) |
| 75 Years and over | 0 (0.0%) | 0 (0.0%) |
Disability Class: Ambulatory Difficulty
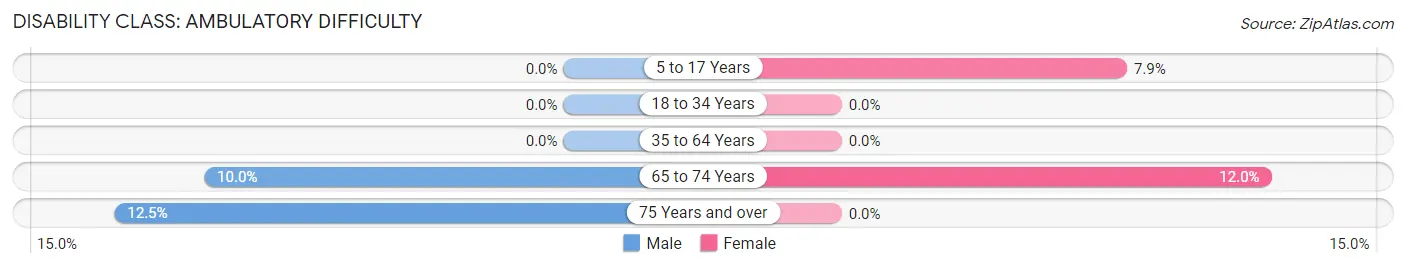
| Age Bracket | Male | Female |
| 5 to 17 Years | 0 (0.0%) | 10 (7.9%) |
| 18 to 34 Years | 0 (0.0%) | 0 (0.0%) |
| 35 to 64 Years | 0 (0.0%) | 0 (0.0%) |
| 65 to 74 Years | 12 (10.0%) | 11 (12.0%) |
| 75 Years and over | 4 (12.5%) | 0 (0.0%) |
Disability Class: Self-Care Difficulty
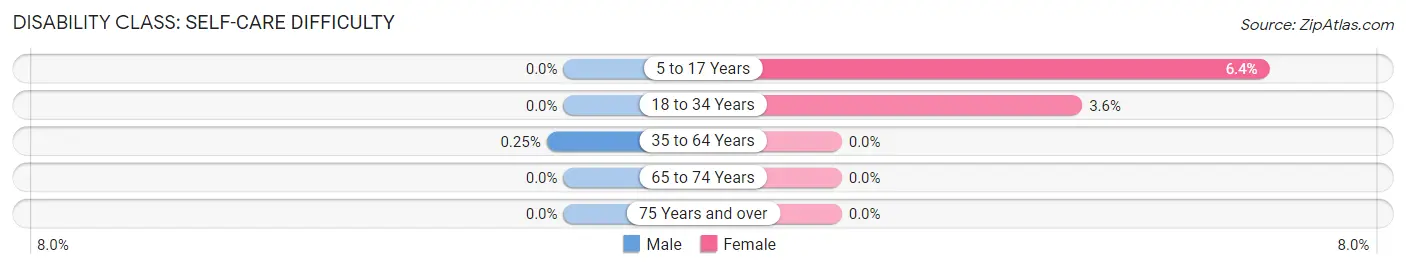
| Age Bracket | Male | Female |
| 5 to 17 Years | 0 (0.0%) | 8 (6.4%) |
| 18 to 34 Years | 0 (0.0%) | 3 (3.6%) |
| 35 to 64 Years | 1 (0.3%) | 0 (0.0%) |
| 65 to 74 Years | 0 (0.0%) | 0 (0.0%) |
| 75 Years and over | 0 (0.0%) | 0 (0.0%) |
Technology Access in Emigration Canyon
Computing Device Access in Emigration Canyon
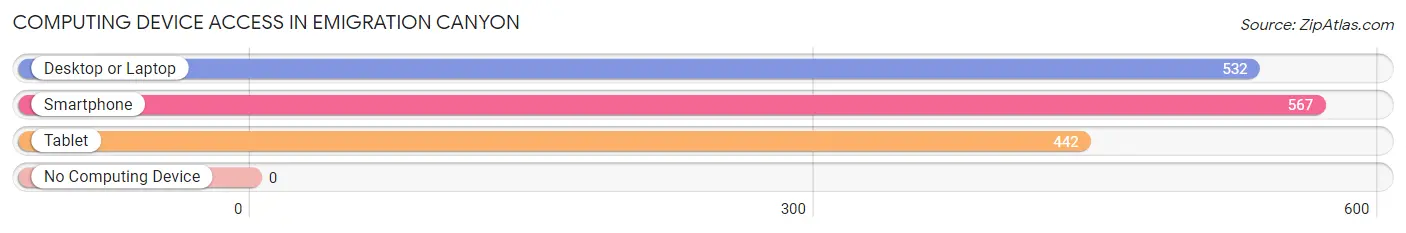
| Device Type | # Households | % Households |
| Desktop or Laptop | 532 | 93.2% |
| Smartphone | 567 | 99.3% |
| Tablet | 442 | 77.4% |
| No Computing Device | 0 | 0.0% |
| Total | 571 | 100.0% |
Internet Access in Emigration Canyon
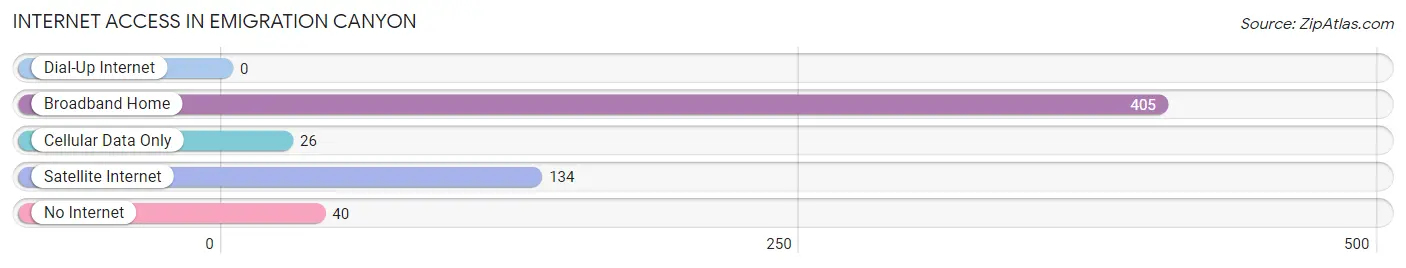
| Internet Type | # Households | % Households |
| Dial-Up Internet | 0 | 0.0% |
| Broadband Home | 405 | 70.9% |
| Cellular Data Only | 26 | 4.5% |
| Satellite Internet | 134 | 23.5% |
| No Internet | 40 | 7.0% |
| Total | 571 | 100.0% |
Emigration Canyon Summary
Emigration Canyon is a small canyon located in Salt Lake County, Utah, United States. It is located east of Salt Lake City, and is the site of the first permanent settlement in the Salt Lake Valley. The canyon is named for the Mormon pioneers who traveled through it in 1847, on their way to the Salt Lake Valley.
Geography
Emigration Canyon is located in the Wasatch Range of the Rocky Mountains, and is approximately 8 miles long. The canyon is located east of Salt Lake City, and is bordered by the cities of Holladay, Millcreek, and East Millcreek. The canyon is part of the Wasatch-Cache National Forest, and is home to a variety of wildlife, including deer, elk, and mountain lions.
The canyon is accessible by car, and is a popular destination for hikers, mountain bikers, and campers. The canyon is also home to several ski resorts, including Snowbird and Solitude.
History
Emigration Canyon has a long and storied history. The canyon was first explored by fur trappers in the early 1800s, and was later used by Native American tribes, including the Ute and Shoshone.
In 1847, the Mormon pioneers traveled through the canyon on their way to the Salt Lake Valley. The canyon was named for the pioneers, and is now known as Emigration Canyon.
In the late 1800s, the canyon was home to several small settlements, including Emigration City and East Millcreek. The canyon was also home to several mines, including the East Millcreek Mine, which operated from 1891 to 1906.
Economy
Today, Emigration Canyon is home to several small businesses, including restaurants, lodging, and retail stores. The canyon is also home to several ski resorts, which attract visitors from around the world.
Demographics
As of the 2010 census, the population of Emigration Canyon was 1,845. The median age was 37.7 years, and the median household income was $50,945. The majority of the population (90.3%) was white, and the median home value was $323,400.
Conclusion
Emigration Canyon is a small canyon located in Salt Lake County, Utah, United States. It is located east of Salt Lake City, and is the site of the first permanent settlement in the Salt Lake Valley. The canyon is home to a variety of wildlife, and is a popular destination for hikers, mountain bikers, and campers. The canyon is also home to several ski resorts, which attract visitors from around the world. The population of Emigration Canyon was 1,845 as of the 2010 census, and the median household income was $50,945.
Common Questions
What is the Total Population of Emigration Canyon?
Total Population of Emigration Canyon is 1,503.
What is the Total Male Population of Emigration Canyon?
Total Male Population of Emigration Canyon is 785.
What is the Total Female Population of Emigration Canyon?
Total Female Population of Emigration Canyon is 718.
What is the Ratio of Males per 100 Females in Emigration Canyon?
There are 109.33 Males per 100 Females in Emigration Canyon.
What is the Ratio of Females per 100 Males in Emigration Canyon?
There are 91.46 Females per 100 Males in Emigration Canyon.
What is the Median Population Age in Emigration Canyon?
Median Population Age in Emigration Canyon is 51.2 Years.
What is the Average Family Size in Emigration Canyon
Average Family Size in Emigration Canyon is 2.9 People.
What is the Average Household Size in Emigration Canyon
Average Household Size in Emigration Canyon is 2.6 People.
What is Per Capita Income in Emigration Canyon?
Per Capita income in Emigration Canyon is $79,579.
What is the Median Family Income in Emigration Canyon?
Median Family Income in Emigration Canyon is $178,500.
What is the Median Household income in Emigration Canyon?
Median Household Income in Emigration Canyon is $138,125.
What is Income or Wage Gap in Emigration Canyon?
Income or Wage Gap in Emigration Canyon is 17.5%.
Women in Emigration Canyon earn 82.5 cents for every dollar earned by a man.
What is Inequality or Gini Index in Emigration Canyon?
Inequality or Gini Index in Emigration Canyon is 0.45.
How Large is the Labor Force in Emigration Canyon?
There are 871 People in the Labor Forcein in Emigration Canyon.
What is the Percentage of People in the Labor Force in Emigration Canyon?
66.4% of People are in the Labor Force in Emigration Canyon.
What is the Unemployment Rate in Emigration Canyon?
Unemployment Rate in Emigration Canyon is 3.7%.