Cities with the Lowest Poverty Level Among Seniors Over the Age of 65 in Utah
RELATED REPORTS & OPTIONS
Lowest Poverty | Seniors 65+
Utah
Compare Cities
Map of Cities with the Lowest Poverty Level Among Seniors Over the Age of 65 in Utah
6.0%
0.0%
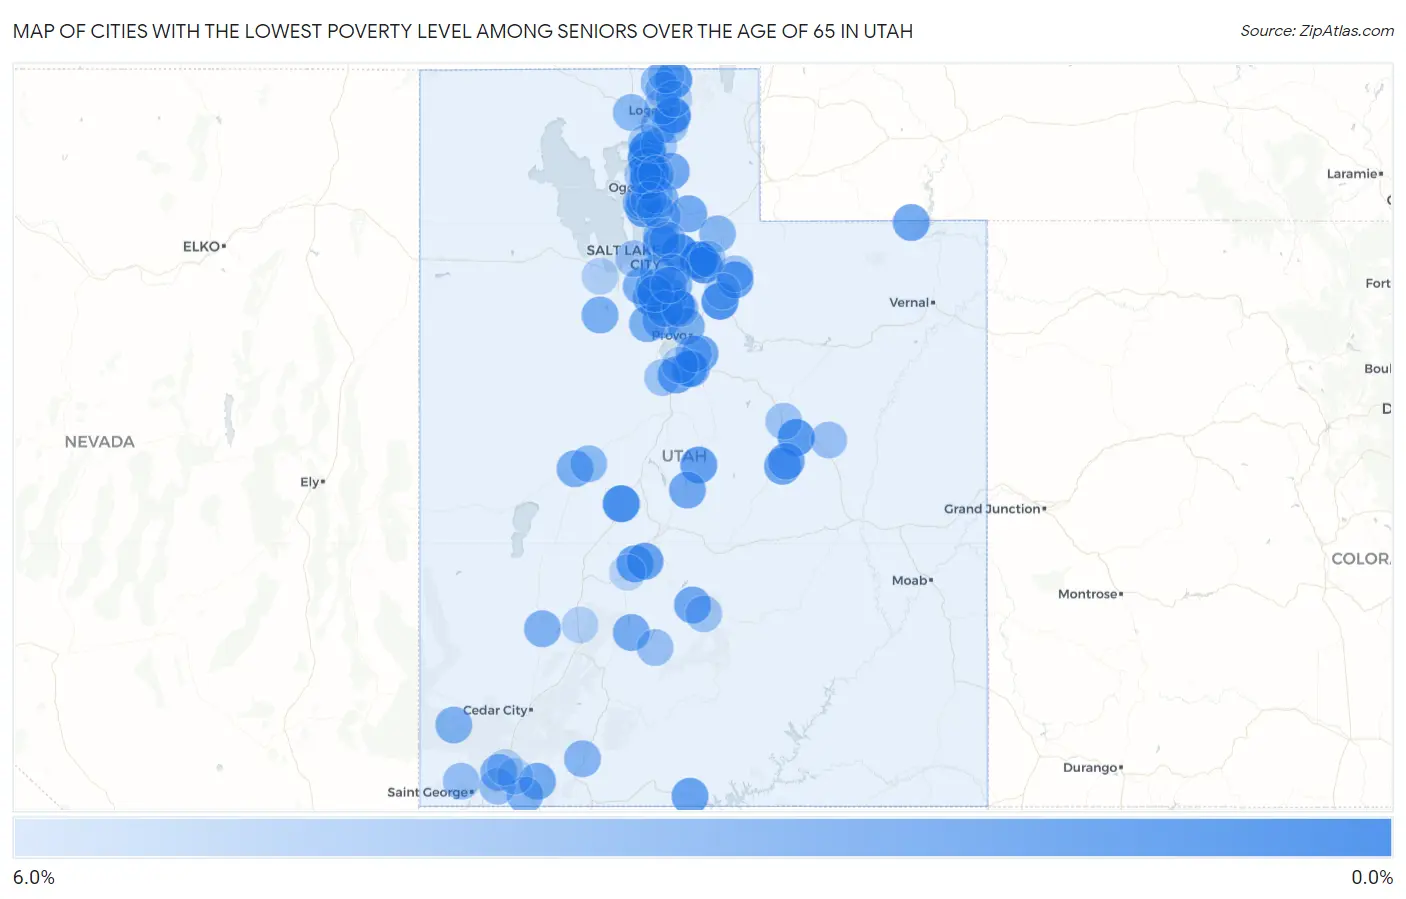
Cities with the Lowest Poverty Level Among Seniors Over the Age of 65 in Utah
| City | Senior Poverty | vs State | vs National | |
| 1. | Farr West | 0.20% | 6.6%(-6.36)#1 | 10.0%(-9.75)#17 |
| 2. | Summit Park | 0.31% | 6.6%(-6.25)#2 | 10.0%(-9.64)#44 |
| 3. | Highland | 0.82% | 6.6%(-5.74)#3 | 10.0%(-9.13)#187 |
| 4. | Holden | 0.93% | 6.6%(-5.63)#4 | 10.0%(-9.02)#250 |
| 5. | Willard | 1.0% | 6.6%(-5.53)#5 | 10.0%(-8.92)#296 |
| 6. | Emigration Canyon | 1.1% | 6.6%(-5.47)#6 | 10.0%(-8.86)#328 |
| 7. | Daniel | 1.3% | 6.6%(-5.28)#7 | 10.0%(-8.67)#476 |
| 8. | Perry | 1.3% | 6.6%(-5.22)#8 | 10.0%(-8.61)#532 |
| 9. | Snyderville | 1.4% | 6.6%(-5.11)#9 | 10.0%(-8.50)#611 |
| 10. | Wellington | 1.6% | 6.6%(-4.97)#10 | 10.0%(-8.36)#711 |
| 11. | Richmond | 1.6% | 6.6%(-4.95)#11 | 10.0%(-8.34)#738 |
| 12. | Bluffdale | 1.7% | 6.6%(-4.86)#12 | 10.0%(-8.25)#815 |
| 13. | Millville | 1.7% | 6.6%(-4.83)#13 | 10.0%(-8.22)#850 |
| 14. | Syracuse | 1.9% | 6.6%(-4.63)#14 | 10.0%(-8.02)#1,021 |
| 15. | Francis | 2.0% | 6.6%(-4.59)#15 | 10.0%(-7.98)#1,068 |
| 16. | Ephraim | 2.1% | 6.6%(-4.45)#16 | 10.0%(-7.84)#1,196 |
| 17. | Elsinore | 2.3% | 6.6%(-4.28)#17 | 10.0%(-7.67)#1,359 |
| 18. | Santaquin | 2.3% | 6.6%(-4.27)#18 | 10.0%(-7.66)#1,367 |
| 19. | Annabella | 2.3% | 6.6%(-4.27)#19 | 10.0%(-7.66)#1,370 |
| 20. | North Salt Lake | 2.3% | 6.6%(-4.22)#20 | 10.0%(-7.61)#1,417 |
| 21. | Big Water | 2.3% | 6.6%(-4.22)#21 | 10.0%(-7.61)#1,424 |
| 22. | Harrisville | 2.4% | 6.6%(-4.19)#22 | 10.0%(-7.58)#1,448 |
| 23. | Mapleton | 2.4% | 6.6%(-4.15)#23 | 10.0%(-7.54)#1,504 |
| 24. | Draper | 2.5% | 6.6%(-4.07)#24 | 10.0%(-7.46)#1,578 |
| 25. | Cleveland | 2.5% | 6.6%(-4.06)#25 | 10.0%(-7.45)#1,586 |
| 26. | Manila | 2.5% | 6.6%(-4.06)#26 | 10.0%(-7.45)#1,587 |
| 27. | Herriman | 2.5% | 6.6%(-4.02)#27 | 10.0%(-7.41)#1,641 |
| 28. | Wolf Creek | 2.6% | 6.6%(-3.95)#28 | 10.0%(-7.34)#1,713 |
| 29. | Loa | 2.6% | 6.6%(-3.93)#29 | 10.0%(-7.32)#1,737 |
| 30. | Elmo | 2.6% | 6.6%(-3.93)#30 | 10.0%(-7.32)#1,740 |
| 31. | Sterling | 2.6% | 6.6%(-3.93)#31 | 10.0%(-7.32)#1,744 |
| 32. | Saratoga Springs | 2.7% | 6.6%(-3.86)#32 | 10.0%(-7.26)#1,823 |
| 33. | Woodland Hills | 2.7% | 6.6%(-3.83)#33 | 10.0%(-7.22)#1,861 |
| 34. | Springdale | 2.8% | 6.6%(-3.80)#34 | 10.0%(-7.19)#1,885 |
| 35. | Morgan | 2.8% | 6.6%(-3.73)#35 | 10.0%(-7.13)#1,957 |
| 36. | Kingston | 2.9% | 6.6%(-3.68)#36 | 10.0%(-7.07)#2,043 |
| 37. | Copperton | 3.1% | 6.6%(-3.48)#37 | 10.0%(-6.87)#2,265 |
| 38. | Hinckley | 3.1% | 6.6%(-3.48)#38 | 10.0%(-6.87)#2,268 |
| 39. | Elk Ridge | 3.1% | 6.6%(-3.47)#39 | 10.0%(-6.86)#2,287 |
| 40. | Rush Valley | 3.1% | 6.6%(-3.47)#40 | 10.0%(-6.86)#2,295 |
| 41. | Orem | 3.1% | 6.6%(-3.45)#41 | 10.0%(-6.84)#2,316 |
| 42. | Eagle Mountain | 3.1% | 6.6%(-3.43)#42 | 10.0%(-6.82)#2,354 |
| 43. | Granite | 3.2% | 6.6%(-3.38)#43 | 10.0%(-6.77)#2,411 |
| 44. | Leeds | 3.2% | 6.6%(-3.34)#44 | 10.0%(-6.74)#2,451 |
| 45. | Wellsville | 3.2% | 6.6%(-3.33)#45 | 10.0%(-6.72)#2,488 |
| 46. | Enterprise | 3.3% | 6.6%(-3.23)#46 | 10.0%(-6.62)#2,612 |
| 47. | Minersville | 3.3% | 6.6%(-3.23)#47 | 10.0%(-6.62)#2,616 |
| 48. | South Jordan | 3.4% | 6.6%(-3.21)#48 | 10.0%(-6.60)#2,666 |
| 49. | Apple Valley | 3.4% | 6.6%(-3.18)#49 | 10.0%(-6.57)#2,687 |
| 50. | Uintah | 3.4% | 6.6%(-3.15)#50 | 10.0%(-6.54)#2,729 |
| 51. | Lehi | 3.6% | 6.6%(-2.99)#51 | 10.0%(-6.38)#2,929 |
| 52. | Glendale | 3.6% | 6.6%(-2.92)#52 | 10.0%(-6.32)#3,057 |
| 53. | South Willard | 3.7% | 6.6%(-2.90)#53 | 10.0%(-6.29)#3,073 |
| 54. | West Point | 3.7% | 6.6%(-2.86)#54 | 10.0%(-6.25)#3,123 |
| 55. | Coalville | 3.7% | 6.6%(-2.86)#55 | 10.0%(-6.25)#3,131 |
| 56. | Tremonton | 3.8% | 6.6%(-2.78)#56 | 10.0%(-6.18)#3,236 |
| 57. | Delta | 3.8% | 6.6%(-2.75)#57 | 10.0%(-6.14)#3,285 |
| 58. | Fruit Heights | 3.8% | 6.6%(-2.72)#58 | 10.0%(-6.12)#3,312 |
| 59. | Cedar Hills | 4.0% | 6.6%(-2.61)#59 | 10.0%(-6.00)#3,474 |
| 60. | West Bountiful | 4.1% | 6.6%(-2.49)#60 | 10.0%(-5.88)#3,639 |
| 61. | Clinton | 4.1% | 6.6%(-2.47)#61 | 10.0%(-5.87)#3,663 |
| 62. | Taylorsville | 4.1% | 6.6%(-2.44)#62 | 10.0%(-5.83)#3,720 |
| 63. | Trenton | 4.2% | 6.6%(-2.39)#63 | 10.0%(-5.79)#3,778 |
| 64. | Ivins | 4.2% | 6.6%(-2.36)#64 | 10.0%(-5.76)#3,830 |
| 65. | Bountiful | 4.2% | 6.6%(-2.35)#65 | 10.0%(-5.74)#3,839 |
| 66. | Holladay | 4.3% | 6.6%(-2.30)#66 | 10.0%(-5.69)#3,910 |
| 67. | Spanish Fork | 4.3% | 6.6%(-2.27)#67 | 10.0%(-5.66)#3,951 |
| 68. | Hurricane | 4.3% | 6.6%(-2.26)#68 | 10.0%(-5.66)#3,956 |
| 69. | East Carbon | 4.3% | 6.6%(-2.22)#69 | 10.0%(-5.62)#4,013 |
| 70. | Antimony | 4.3% | 6.6%(-2.21)#70 | 10.0%(-5.60)#4,060 |
| 71. | Amalga | 4.4% | 6.6%(-2.15)#71 | 10.0%(-5.54)#4,150 |
| 72. | Goshen | 4.4% | 6.6%(-2.12)#72 | 10.0%(-5.51)#4,204 |
| 73. | Bicknell | 4.4% | 6.6%(-2.12)#73 | 10.0%(-5.51)#4,208 |
| 74. | Spring Glen | 4.5% | 6.6%(-2.10)#74 | 10.0%(-5.49)#4,234 |
| 75. | Pleasant View | 4.5% | 6.6%(-2.10)#75 | 10.0%(-5.49)#4,236 |
| 76. | Magna | 4.5% | 6.6%(-2.10)#76 | 10.0%(-5.49)#4,243 |
| 77. | Riverton | 4.5% | 6.6%(-2.08)#77 | 10.0%(-5.47)#4,270 |
| 78. | Marriott Slaterville | 4.6% | 6.6%(-2.00)#78 | 10.0%(-5.39)#4,396 |
| 79. | Kamas | 4.6% | 6.6%(-1.96)#79 | 10.0%(-5.35)#4,432 |
| 80. | Sandy | 4.6% | 6.6%(-1.94)#80 | 10.0%(-5.33)#4,465 |
| 81. | Mantua | 4.6% | 6.6%(-1.92)#81 | 10.0%(-5.31)#4,494 |
| 82. | Hyrum | 4.7% | 6.6%(-1.86)#82 | 10.0%(-5.25)#4,572 |
| 83. | Silver Summit | 4.9% | 6.6%(-1.71)#83 | 10.0%(-5.10)#4,792 |
| 84. | Washington Terrace | 4.9% | 6.6%(-1.68)#84 | 10.0%(-5.07)#4,829 |
| 85. | Providence | 4.9% | 6.6%(-1.67)#85 | 10.0%(-5.06)#4,833 |
| 86. | Sunset | 4.9% | 6.6%(-1.65)#86 | 10.0%(-5.04)#4,862 |
| 87. | Plain City | 5.0% | 6.6%(-1.55)#87 | 10.0%(-4.94)#5,028 |
| 88. | Benson | 5.0% | 6.6%(-1.54)#88 | 10.0%(-4.93)#5,032 |
| 89. | Brigham City | 5.1% | 6.6%(-1.45)#89 | 10.0%(-4.84)#5,151 |
| 90. | Hyde Park | 5.2% | 6.6%(-1.37)#90 | 10.0%(-4.76)#5,276 |
| 91. | Grantsville | 5.2% | 6.6%(-1.36)#91 | 10.0%(-4.75)#5,289 |
| 92. | Payson | 5.2% | 6.6%(-1.35)#92 | 10.0%(-4.74)#5,303 |
| 93. | Lewiston | 5.2% | 6.6%(-1.33)#93 | 10.0%(-4.72)#5,328 |
| 94. | Heber | 5.3% | 6.6%(-1.26)#94 | 10.0%(-4.65)#5,455 |
| 95. | Layton | 5.3% | 6.6%(-1.25)#95 | 10.0%(-4.64)#5,468 |
| 96. | North Ogden | 5.3% | 6.6%(-1.24)#96 | 10.0%(-4.63)#5,491 |
| 97. | Beaver | 5.3% | 6.6%(-1.22)#97 | 10.0%(-4.61)#5,514 |
| 98. | Virgin | 5.3% | 6.6%(-1.22)#98 | 10.0%(-4.61)#5,519 |
| 99. | Toquerville | 5.3% | 6.6%(-1.21)#99 | 10.0%(-4.61)#5,522 |
| 100. | Joseph | 5.6% | 6.6%(-1.00)#100 | 10.0%(-4.40)#5,864 |
Common Questions
What are the Top 10 Cities with the Lowest Poverty Level Among Seniors Over the Age of 65 in Utah?
Top 10 Cities with the Lowest Poverty Level Among Seniors Over the Age of 65 in Utah are:
#1
0.20%
#2
0.31%
#3
0.82%
#4
0.93%
#5
1.0%
#6
1.1%
#7
1.3%
#8
1.3%
#9
1.4%
#10
1.6%
What city has the Lowest Poverty Level Among Seniors Over the Age of 65 in Utah?
Farr West has the Lowest Poverty Level Among Seniors Over the Age of 65 in Utah with 0.20%.
What is the Poverty Level Among Seniors Over the Age of 65 in the State of Utah?
Poverty Level Among Seniors Over the Age of 65 in Utah is 6.6%.
What is the Poverty Level Among Seniors Over the Age of 65 in the United States?
Poverty Level Among Seniors Over the Age of 65 in the United States is 10.0%.