Cities with the Highest Percentage of Population Taking Public Transit to Work in Utah
RELATED REPORTS & OPTIONS
Public Transit
Utah
Compare Cities
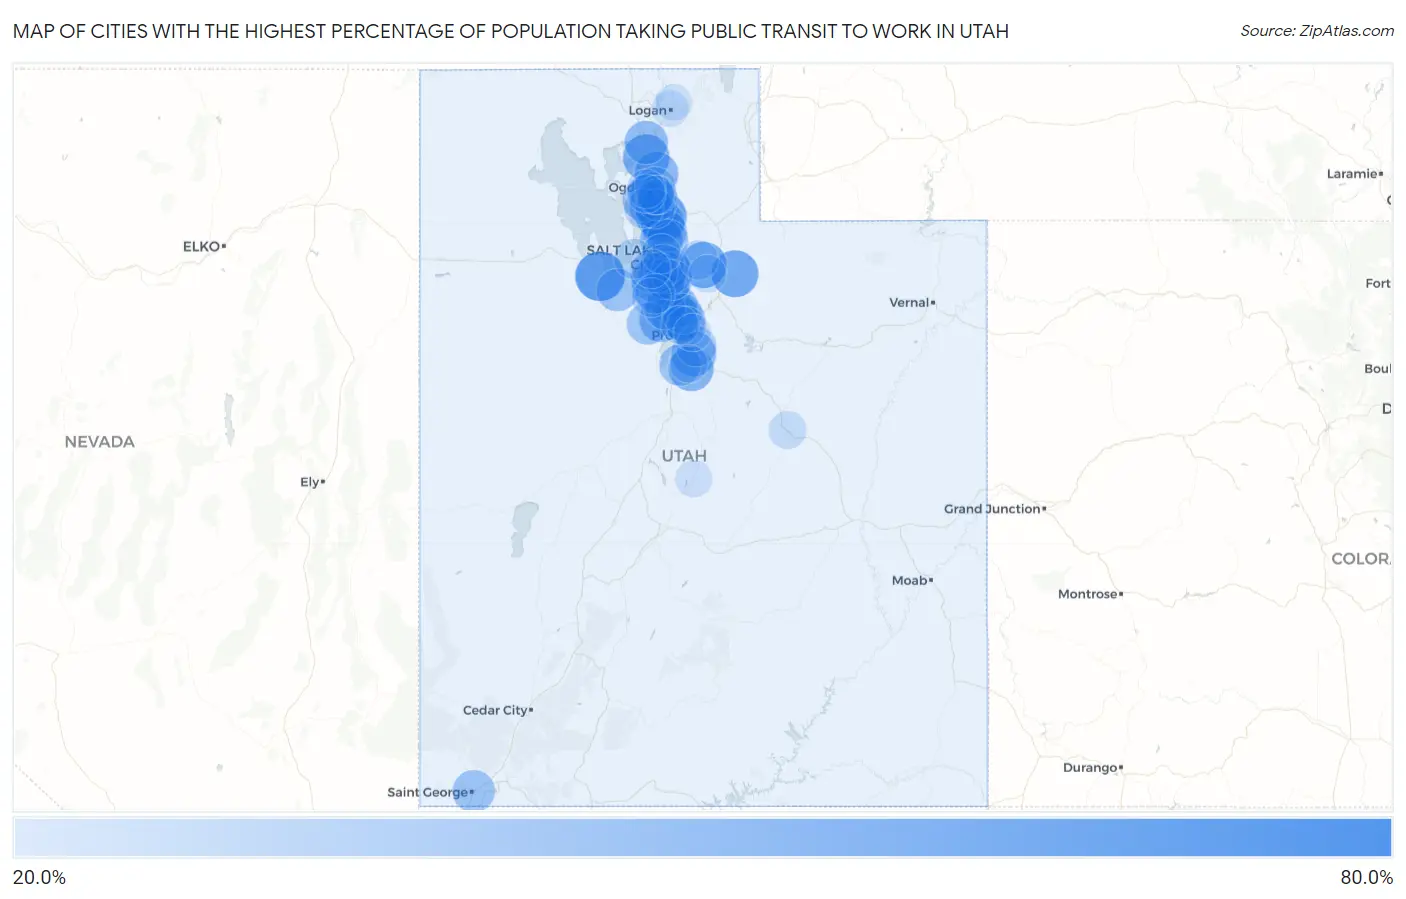
Map of Cities with the Highest Percentage of Population Taking Public Transit to Work in Utah
0.0%
80.0%
Cities with the Highest Percentage of Population Taking Public Transit to Work in Utah
| City | % Public Transit | vs State | vs National | |
| 1. | White | 68.4% | 31.6%(+36.8)#1 | 38.5%(+29.9)#18 |
| 2. | Grantsville | 62.1% | 31.6%(+30.5)#2 | 38.5%(+23.6)#103 |
| 3. | Fruit Heights | 57.1% | 31.6%(+25.5)#3 | 38.5%(+18.6)#306 |
| 4. | Kamas | 53.7% | 31.6%(+22.1)#4 | 38.5%(+15.2)#545 |
| 5. | Willard | 52.5% | 31.6%(+20.9)#5 | 38.5%(+14.0)#656 |
| 6. | Snyderville | 51.5% | 31.6%(+19.9)#6 | 38.5%(+13.0)#723 |
| 7. | American Fork | 49.4% | 31.6%(+17.8)#7 | 38.5%(+10.9)#971 |
| 8. | Spanish Fork | 47.3% | 31.6%(+15.7)#8 | 38.5%(+8.80)#1,288 |
| 9. | Woodland Hills | 47.0% | 31.6%(+15.4)#9 | 38.5%(+8.50)#1,353 |
| 10. | Saratoga Springs | 45.2% | 31.6%(+13.6)#10 | 38.5%(+6.70)#1,628 |
| 11. | Kaysville | 44.9% | 31.6%(+13.3)#11 | 38.5%(+6.40)#1,677 |
| 12. | North Ogden | 44.9% | 31.6%(+13.3)#12 | 38.5%(+6.40)#1,682 |
| 13. | Farmington | 44.5% | 31.6%(+12.9)#13 | 38.5%(+6.00)#1,737 |
| 14. | South Jordan | 42.8% | 31.6%(+11.2)#14 | 38.5%(+4.30)#2,038 |
| 15. | Centerville | 42.7% | 31.6%(+11.1)#15 | 38.5%(+4.20)#2,077 |
| 16. | Brigham City | 42.6% | 31.6%(+11.0)#16 | 38.5%(+4.10)#2,091 |
| 17. | Draper | 42.2% | 31.6%(+10.6)#17 | 38.5%(+3.70)#2,159 |
| 18. | Woods Cross | 42.1% | 31.6%(+10.5)#18 | 38.5%(+3.60)#2,181 |
| 19. | Lindon | 41.5% | 31.6%(+9.90)#19 | 38.5%(+3.00)#2,269 |
| 20. | Highland | 41.3% | 31.6%(+9.70)#20 | 38.5%(+2.80)#2,296 |
| 21. | Riverdale | 41.2% | 31.6%(+9.60)#21 | 38.5%(+2.70)#2,313 |
| 22. | West Jordan | 40.1% | 31.6%(+8.50)#22 | 38.5%(+1.60)#2,512 |
| 23. | Tooele | 39.6% | 31.6%(+8.00)#23 | 38.5%(+1.10)#2,605 |
| 24. | Clinton | 39.6% | 31.6%(+8.00)#24 | 38.5%(+1.10)#2,610 |
| 25. | Millcreek | 39.5% | 31.6%(+7.90)#25 | 38.5%(+1.00)#2,623 |
| 26. | St George | 39.4% | 31.6%(+7.80)#26 | 38.5%(+0.900)#2,646 |
| 27. | Clearfield | 38.2% | 31.6%(+6.60)#27 | 38.5%(-0.300)#2,844 |
| 28. | Sandy | 38.1% | 31.6%(+6.50)#28 | 38.5%(-0.400)#2,850 |
| 29. | Murray | 37.5% | 31.6%(+5.90)#29 | 38.5%(-1.00)#2,929 |
| 30. | Eagle Mountain | 37.0% | 31.6%(+5.40)#30 | 38.5%(-1.50)#3,005 |
| 31. | Payson | 37.0% | 31.6%(+5.40)#31 | 38.5%(-1.50)#3,009 |
| 32. | Bountiful | 36.7% | 31.6%(+5.10)#32 | 38.5%(-1.80)#3,060 |
| 33. | Lehi | 36.1% | 31.6%(+4.50)#33 | 38.5%(-2.40)#3,151 |
| 34. | Ogden | 35.3% | 31.6%(+3.70)#34 | 38.5%(-3.20)#3,266 |
| 35. | Holladay | 35.2% | 31.6%(+3.60)#35 | 38.5%(-3.30)#3,285 |
| 36. | South Weber | 35.2% | 31.6%(+3.60)#36 | 38.5%(-3.30)#3,292 |
| 37. | South Salt Lake | 35.0% | 31.6%(+3.40)#37 | 38.5%(-3.50)#3,318 |
| 38. | Midvale | 34.7% | 31.6%(+3.10)#38 | 38.5%(-3.80)#3,364 |
| 39. | Springville | 33.2% | 31.6%(+1.60)#39 | 38.5%(-5.30)#3,554 |
| 40. | Pleasant Grove | 32.8% | 31.6%(+1.20)#40 | 38.5%(-5.70)#3,592 |
| 41. | Kearns | 31.9% | 31.6%(+0.300)#41 | 38.5%(-6.60)#3,699 |
| 42. | Taylorsville | 31.8% | 31.6%(+0.200)#42 | 38.5%(-6.70)#3,714 |
| 43. | Cottonwood Heights | 31.5% | 31.6%(-0.100)#43 | 38.5%(-7.00)#3,736 |
| 44. | Magna | 31.2% | 31.6%(-0.400)#44 | 38.5%(-7.30)#3,764 |
| 45. | Riverton | 30.8% | 31.6%(-0.800)#45 | 38.5%(-7.70)#3,805 |
| 46. | Layton | 30.6% | 31.6%(-1.00)#46 | 38.5%(-7.90)#3,825 |
| 47. | Orem | 29.9% | 31.6%(-1.70)#47 | 38.5%(-8.60)#3,876 |
| 48. | Salt Lake City | 29.8% | 31.6%(-1.80)#48 | 38.5%(-8.70)#3,890 |
| 49. | Summit Park | 29.5% | 31.6%(-2.10)#49 | 38.5%(-9.00)#3,924 |
| 50. | Herriman | 29.0% | 31.6%(-2.60)#50 | 38.5%(-9.50)#3,958 |
| 51. | Syracuse | 28.9% | 31.6%(-2.70)#51 | 38.5%(-9.60)#3,974 |
| 52. | West Valley City | 28.5% | 31.6%(-3.10)#52 | 38.5%(-10.0)#4,017 |
| 53. | South Ogden | 28.1% | 31.6%(-3.50)#53 | 38.5%(-10.4)#4,051 |
| 54. | Washington Terrace | 27.7% | 31.6%(-3.90)#54 | 38.5%(-10.8)#4,079 |
| 55. | West Haven | 27.6% | 31.6%(-4.00)#55 | 38.5%(-10.9)#4,083 |
| 56. | Roy | 27.2% | 31.6%(-4.40)#56 | 38.5%(-11.3)#4,117 |
| 57. | Vineyard | 25.7% | 31.6%(-5.90)#57 | 38.5%(-12.8)#4,207 |
| 58. | Price | 25.3% | 31.6%(-6.30)#58 | 38.5%(-13.2)#4,230 |
| 59. | Park City | 24.9% | 31.6%(-6.70)#59 | 38.5%(-13.6)#4,252 |
| 60. | Salem | 24.7% | 31.6%(-6.90)#60 | 38.5%(-13.8)#4,271 |
| 61. | Provo | 23.7% | 31.6%(-7.90)#61 | 38.5%(-14.8)#4,323 |
| 62. | Manti | 23.5% | 31.6%(-8.10)#62 | 38.5%(-15.0)#4,342 |
| 63. | Logan | 22.6% | 31.6%(-9.00)#63 | 38.5%(-15.9)#4,384 |
| 64. | North Logan | 22.4% | 31.6%(-9.20)#64 | 38.5%(-16.1)#4,405 |
Common Questions
What are the Top 10 Cities with the Highest Percentage of Population Taking Public Transit to Work in Utah?
Top 10 Cities with the Highest Percentage of Population Taking Public Transit to Work in Utah are:
#1
62.1%
#2
57.1%
#3
53.7%
#4
52.5%
#5
51.5%
#6
49.4%
#7
47.3%
#8
47.0%
#9
45.2%
#10
44.9%
What city has the Highest Percentage of Population Taking Public Transit to Work in Utah?
Grantsville has the Highest Percentage of Population Taking Public Transit to Work in Utah with 62.1%.
What is the Percentage of Population Taking Public Transit to Work in the State of Utah?
Percentage of Population Taking Public Transit to Work in Utah is 31.6%.
What is the Percentage of Population Taking Public Transit to Work in the United States?
Percentage of Population Taking Public Transit to Work in the United States is 38.5%.