Naples, UT
Naples Map
Naples Overview
2,801
TOTAL POPULATION
1,374
MALE POPULATION
1,427
FEMALE POPULATION
96.29
MALES / 100 FEMALES
103.86
FEMALES / 100 MALES
32.4
MEDIAN AGE
3.6
AVG FAMILY SIZE
3.2
AVG HOUSEHOLD SIZE
$26,786
PER CAPITA INCOME
$90,098
AVG FAMILY INCOME
$87,679
AVG HOUSEHOLD INCOME
52.0%
WAGE / INCOME GAP [ % ]
48.0¢/ $1
WAGE / INCOME GAP [ $ ]
$11,483
FAMILY INCOME DEFICIT
0.30
INEQUALITY / GINI INDEX
1,082
LABOR FORCE [ PEOPLE ]
57.3%
PERCENT IN LABOR FORCE
2.2%
UNEMPLOYMENT RATE
Naples Area Codes
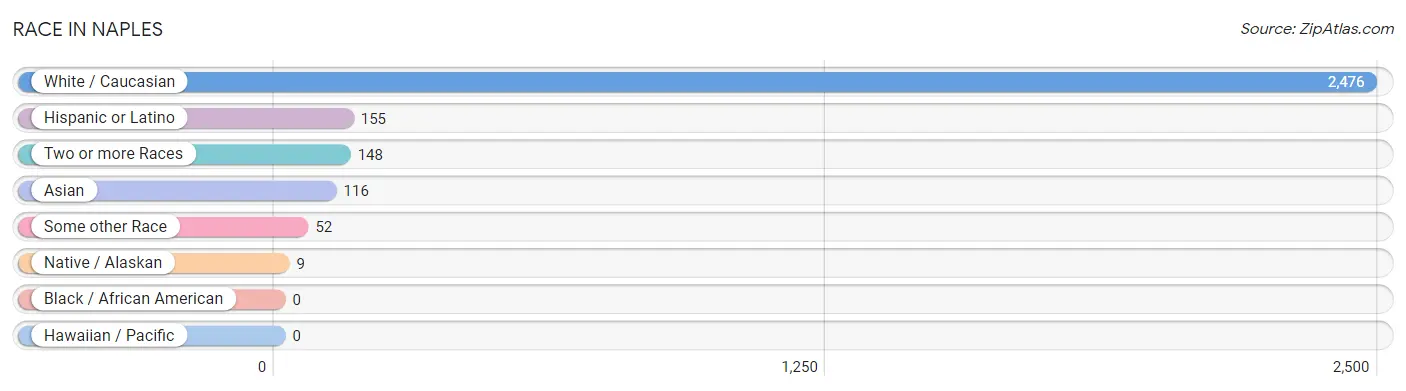
Race in Naples
The most populous races in Naples are White / Caucasian (2,476 | 88.4%), Hispanic or Latino (155 | 5.5%), and Two or more Races (148 | 5.3%).
| Race | # Population | % Population |
| Asian | 116 | 4.1% |
| Black / African American | 0 | 0.0% |
| Hawaiian / Pacific | 0 | 0.0% |
| Hispanic or Latino | 155 | 5.5% |
| Native / Alaskan | 9 | 0.3% |
| White / Caucasian | 2,476 | 88.4% |
| Two or more Races | 148 | 5.3% |
| Some other Race | 52 | 1.9% |
| Total | 2,801 | 100.0% |
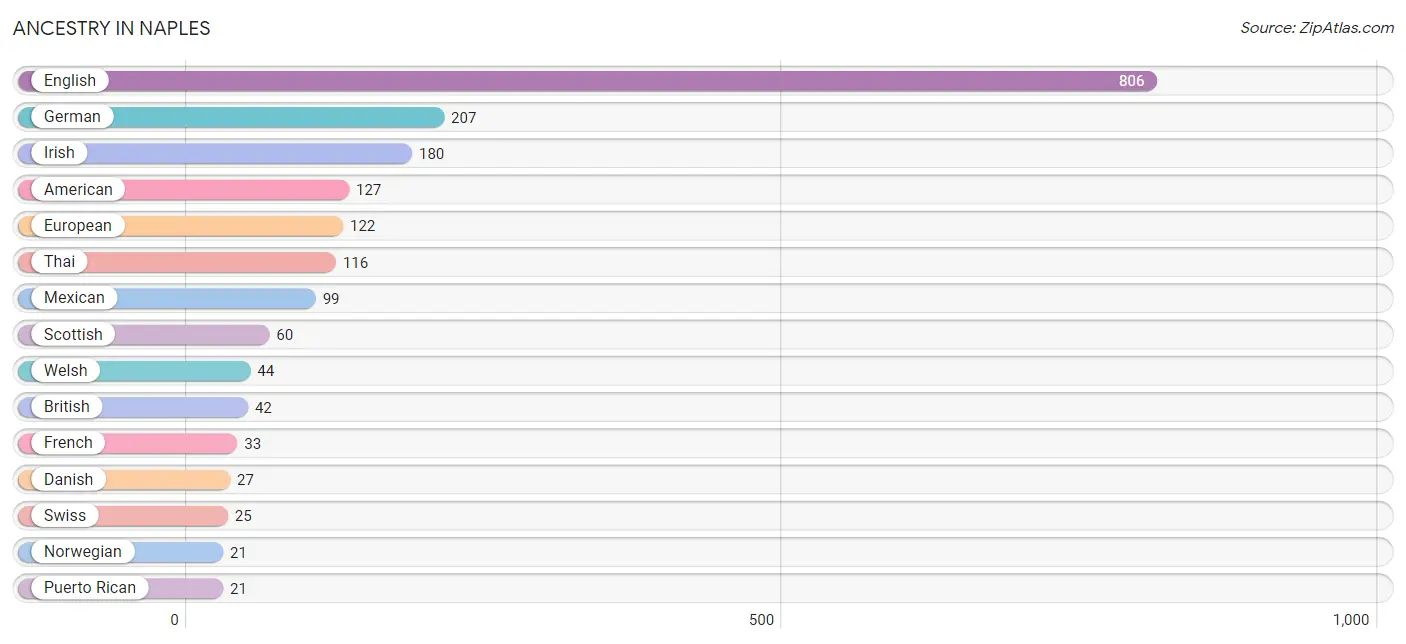
Ancestry in Naples
The most populous ancestries reported in Naples are English (806 | 28.8%), German (207 | 7.4%), Irish (180 | 6.4%), American (127 | 4.5%), and European (122 | 4.4%), together accounting for 51.5% of all Naples residents.
| Ancestry | # Population | % Population |
| American | 127 | 4.5% |
| British | 42 | 1.5% |
| Cherokee | 5 | 0.2% |
| Czechoslovakian | 4 | 0.1% |
| Danish | 27 | 1.0% |
| Dutch | 18 | 0.6% |
| Eastern European | 4 | 0.1% |
| English | 806 | 28.8% |
| European | 122 | 4.4% |
| French | 33 | 1.2% |
| German | 207 | 7.4% |
| Irish | 180 | 6.4% |
| Italian | 16 | 0.6% |
| Mexican | 99 | 3.5% |
| Navajo | 9 | 0.3% |
| Norwegian | 21 | 0.7% |
| Peruvian | 7 | 0.3% |
| Polish | 8 | 0.3% |
| Potawatomi | 8 | 0.3% |
| Puerto Rican | 21 | 0.7% |
| Samoan | 6 | 0.2% |
| Scotch-Irish | 13 | 0.5% |
| Scottish | 60 | 2.1% |
| Slovak | 4 | 0.1% |
| South American | 7 | 0.3% |
| Spaniard | 11 | 0.4% |
| Swedish | 18 | 0.6% |
| Swiss | 25 | 0.9% |
| Thai | 116 | 4.1% |
| Ukrainian | 4 | 0.1% |
| Welsh | 44 | 1.6% | View All 31 Rows |
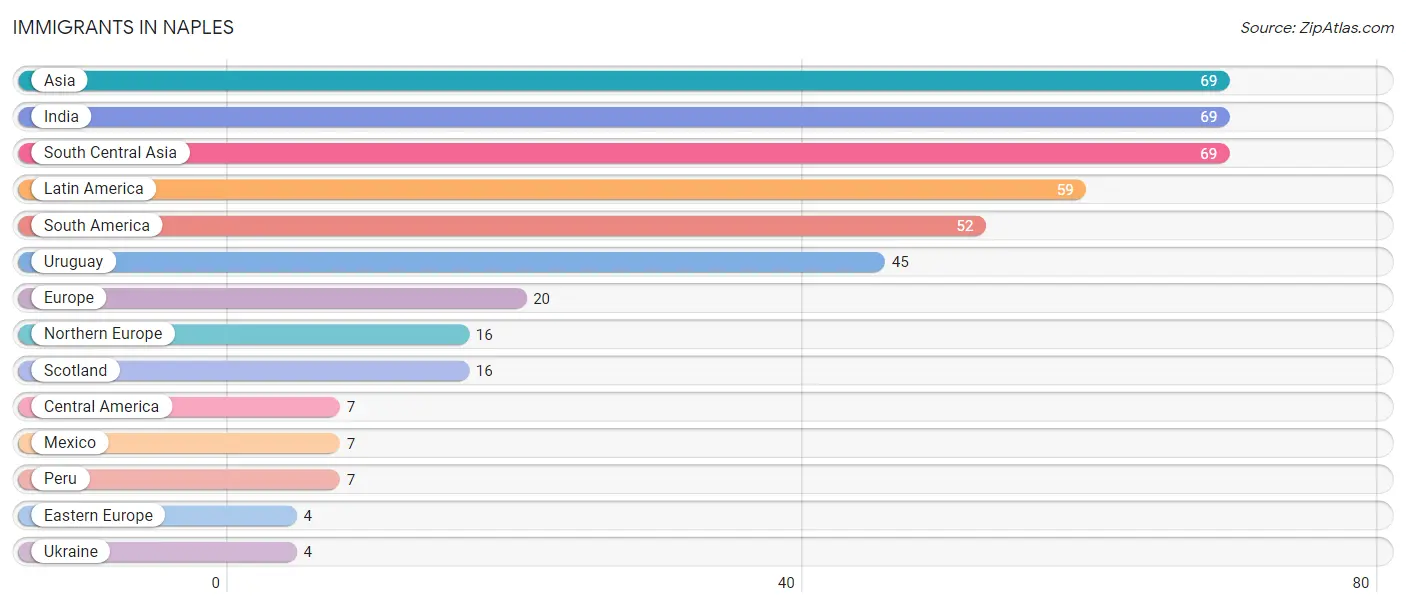
Immigrants in Naples
The most numerous immigrant groups reported in Naples came from Asia (69 | 2.5%), India (69 | 2.5%), South Central Asia (69 | 2.5%), Latin America (59 | 2.1%), and South America (52 | 1.9%), together accounting for 11.4% of all Naples residents.
| Immigration Origin | # Population | % Population |
| Asia | 69 | 2.5% |
| Central America | 7 | 0.3% |
| Eastern Europe | 4 | 0.1% |
| Europe | 20 | 0.7% |
| India | 69 | 2.5% |
| Latin America | 59 | 2.1% |
| Mexico | 7 | 0.3% |
| Northern Europe | 16 | 0.6% |
| Peru | 7 | 0.3% |
| Scotland | 16 | 0.6% |
| South America | 52 | 1.9% |
| South Central Asia | 69 | 2.5% |
| Ukraine | 4 | 0.1% |
| Uruguay | 45 | 1.6% | View All 14 Rows |
Sex and Age in Naples
Sex and Age in Naples
The most populous age groups in Naples are 40 to 44 Years (160 | 11.6%) for men and 5 to 9 Years (200 | 14.0%) for women.
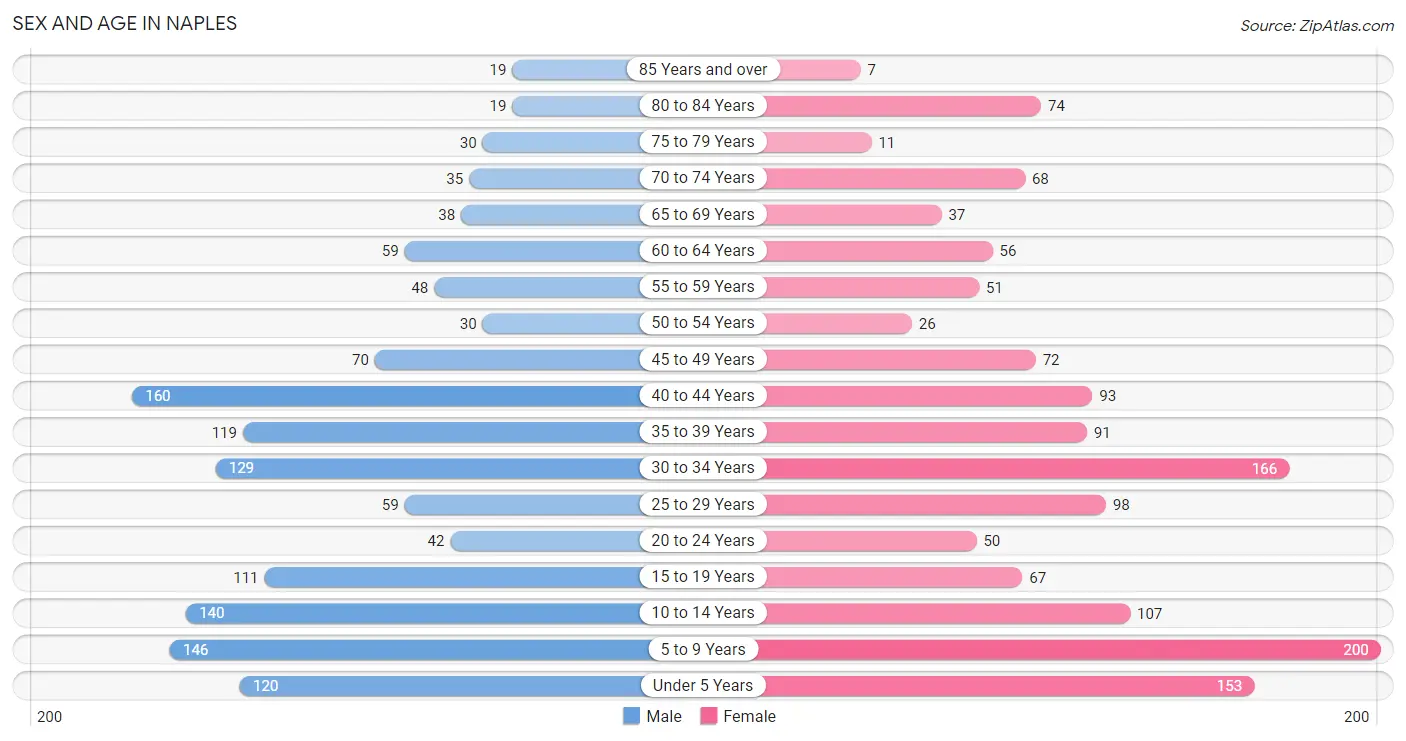
| Age Bracket | Male | Female |
| Under 5 Years | 120 (8.7%) | 153 (10.7%) |
| 5 to 9 Years | 146 (10.6%) | 200 (14.0%) |
| 10 to 14 Years | 140 (10.2%) | 107 (7.5%) |
| 15 to 19 Years | 111 (8.1%) | 67 (4.7%) |
| 20 to 24 Years | 42 (3.1%) | 50 (3.5%) |
| 25 to 29 Years | 59 (4.3%) | 98 (6.9%) |
| 30 to 34 Years | 129 (9.4%) | 166 (11.6%) |
| 35 to 39 Years | 119 (8.7%) | 91 (6.4%) |
| 40 to 44 Years | 160 (11.6%) | 93 (6.5%) |
| 45 to 49 Years | 70 (5.1%) | 72 (5.1%) |
| 50 to 54 Years | 30 (2.2%) | 26 (1.8%) |
| 55 to 59 Years | 48 (3.5%) | 51 (3.6%) |
| 60 to 64 Years | 59 (4.3%) | 56 (3.9%) |
| 65 to 69 Years | 38 (2.8%) | 37 (2.6%) |
| 70 to 74 Years | 35 (2.5%) | 68 (4.8%) |
| 75 to 79 Years | 30 (2.2%) | 11 (0.8%) |
| 80 to 84 Years | 19 (1.4%) | 74 (5.2%) |
| 85 Years and over | 19 (1.4%) | 7 (0.5%) |
| Total | 1,374 (100.0%) | 1,427 (100.0%) |
Families and Households in Naples
Median Family Size in Naples
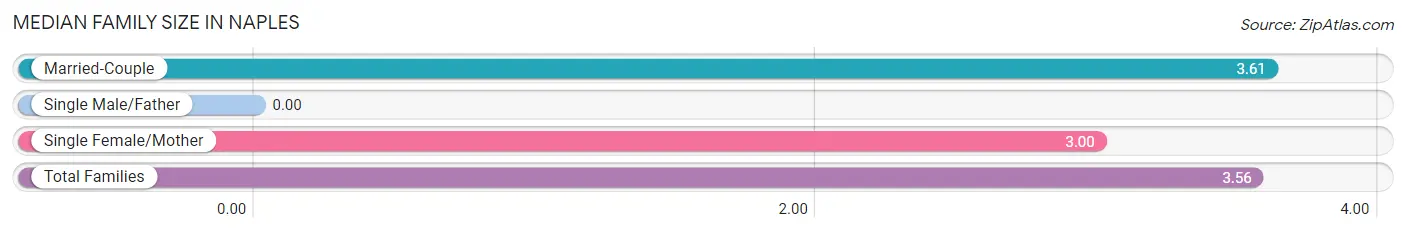
| Family Type | # Families | Family Size |
| Married-Couple | 666 (92.5%) | 3.61 |
| Single Male/Father | 0 (0.0%) | - |
| Single Female/Mother | 54 (7.5%) | 3.00 |
| Total Families | 720 (100.0%) | 3.56 |
Median Household Size in Naples
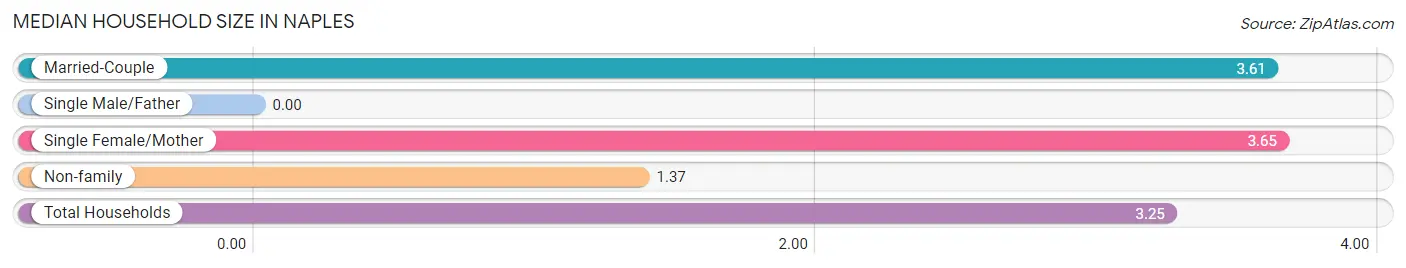
| Household Type | # Households | Household Size |
| Married-Couple | 666 (77.3%) | 3.61 |
| Single Male/Father | 0 (0.0%) | - |
| Single Female/Mother | 54 (6.3%) | 3.65 |
| Non-family | 142 (16.5%) | 1.37 |
| Total Households | 862 (100.0%) | 3.25 |
Household Size by Marriage Status in Naples
Out of a total of 862 households in Naples, 720 (83.5%) are family households, while 142 (16.5%) are nonfamily households. The most numerous type of family households are 2-person households, comprising 216, and the most common type of nonfamily households are 1-person households, comprising 90.
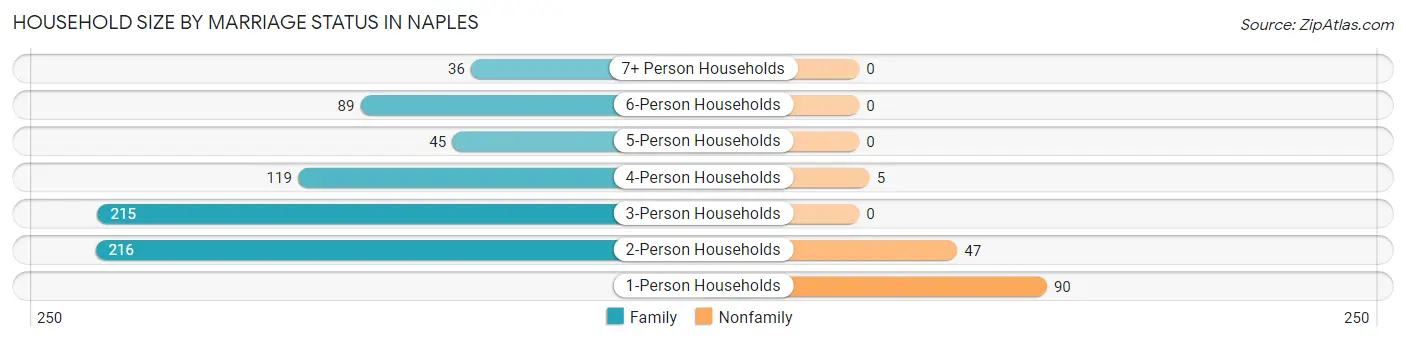
| Household Size | Family Households | Nonfamily Households |
| 1-Person Households | - | 90 (10.4%) |
| 2-Person Households | 216 (25.1%) | 47 (5.4%) |
| 3-Person Households | 215 (24.9%) | 0 (0.0%) |
| 4-Person Households | 119 (13.8%) | 5 (0.6%) |
| 5-Person Households | 45 (5.2%) | 0 (0.0%) |
| 6-Person Households | 89 (10.3%) | 0 (0.0%) |
| 7+ Person Households | 36 (4.2%) | 0 (0.0%) |
| Total | 720 (83.5%) | 142 (16.5%) |
Female Fertility in Naples
Fertility by Age in Naples
Average fertility rate in Naples is 116.0 births per 1,000 women. Women in the age bracket of 20 to 34 years have the highest fertility rate with 236.0 births per 1,000 women. Women in the age bracket of 20 to 34 years acount for 100.0% of all women with births.
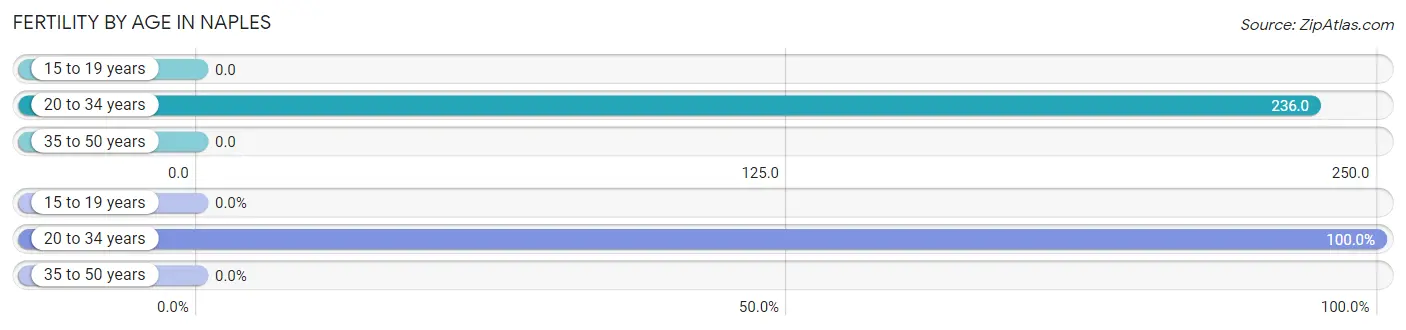
| Age Bracket | Women with Births | Births / 1,000 Women |
| 15 to 19 years | 0 (0.0%) | 0.0 |
| 20 to 34 years | 74 (100.0%) | 236.0 |
| 35 to 50 years | 0 (0.0%) | 0.0 |
| Total | 74 (100.0%) | 116.0 |
Fertility by Age by Marriage Status in Naples
85.1% of women with births (74) in Naples are married. The highest percentage of unmarried women with births falls into 20 to 34 years age bracket with 14.9% of them unmarried at the time of birth, while the lowest percentage of unmarried women with births belong to 20 to 34 years age bracket with 14.9% of them unmarried.
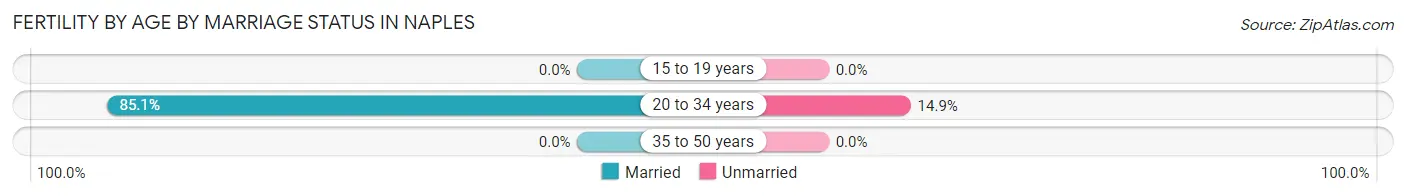
| Age Bracket | Married | Unmarried |
| 15 to 19 years | 0 (0.0%) | 0 (0.0%) |
| 20 to 34 years | 63 (85.1%) | 11 (14.9%) |
| 35 to 50 years | 0 (0.0%) | 0 (0.0%) |
| Total | 63 (85.1%) | 11 (14.9%) |
Fertility by Education in Naples
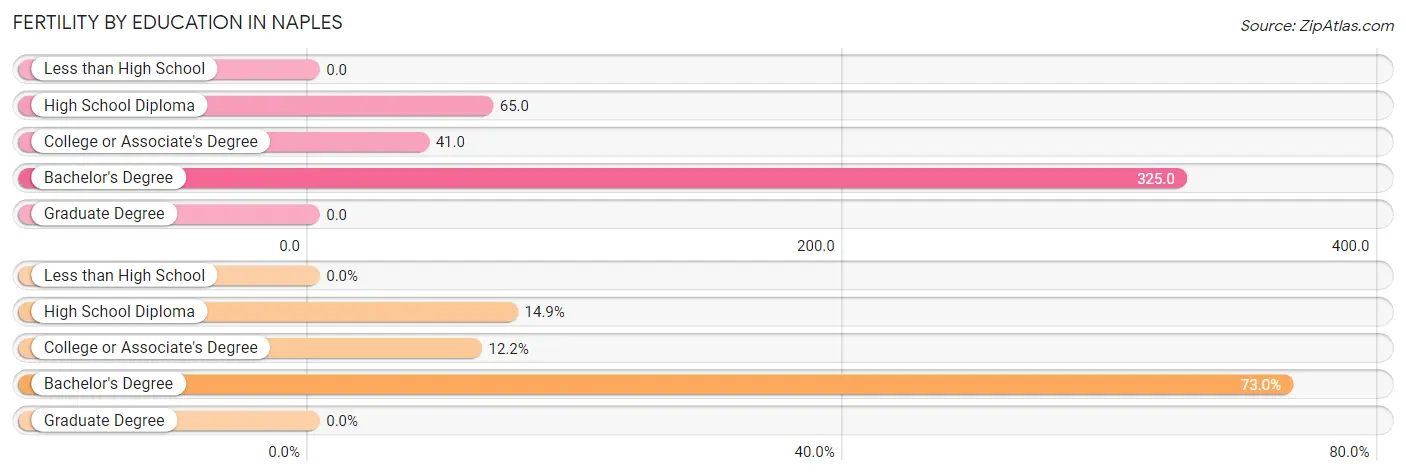
| Educational Attainment | Women with Births | Births / 1,000 Women |
| Less than High School | 0 (0.0%) | 0.0 |
| High School Diploma | 11 (14.9%) | 65.0 |
| College or Associate's Degree | 9 (12.2%) | 41.0 |
| Bachelor's Degree | 54 (73.0%) | 325.0 |
| Graduate Degree | 0 (0.0%) | 0.0 |
| Total | 74 (100.0%) | 116.0 |
Fertility by Education by Marriage Status in Naples
14.9% of women with births in Naples are unmarried. Women with the educational attainment of college or associate's degree are most likely to be married with 100.0% of them married at childbirth, while women with the educational attainment of high school diploma are least likely to be married with 100.0% of them unmarried at childbirth.
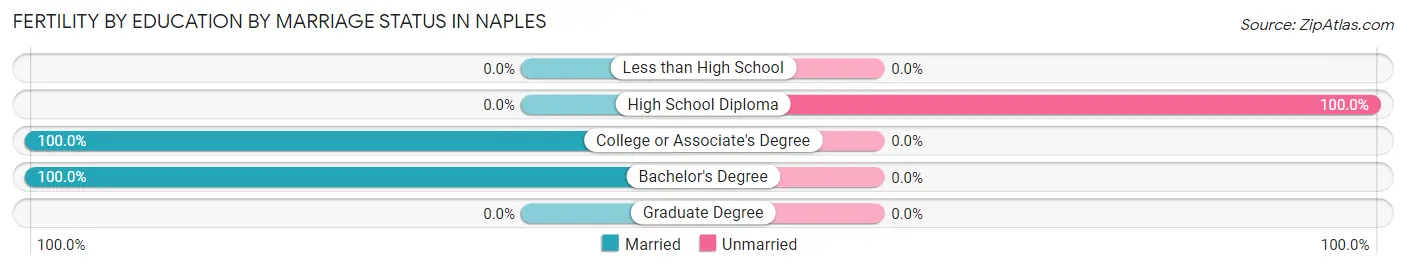
| Educational Attainment | Married | Unmarried |
| Less than High School | 0 (0.0%) | 0 (0.0%) |
| High School Diploma | 0 (0.0%) | 11 (100.0%) |
| College or Associate's Degree | 9 (100.0%) | 0 (0.0%) |
| Bachelor's Degree | 54 (100.0%) | 0 (0.0%) |
| Graduate Degree | 0 (0.0%) | 0 (0.0%) |
| Total | 63 (85.1%) | 11 (14.9%) |
Income in Naples
Income Overview in Naples
Per Capita Income in Naples is $26,786, while median incomes of families and households are $90,098 and $87,679 respectively.
| Characteristic | Number | Measure |
| Per Capita Income | 2,801 | $26,786 |
| Median Family Income | 720 | $90,098 |
| Mean Family Income | 720 | $91,452 |
| Median Household Income | 862 | $87,679 |
| Mean Household Income | 862 | $90,755 |
| Income Deficit | 720 | $11,483 |
| Wage / Income Gap (%) | 2,801 | 51.99% |
| Wage / Income Gap ($) | 2,801 | 48.01¢ per $1 |
| Gini / Inequality Index | 2,801 | 0.30 |
Earnings by Sex in Naples
Average Earnings in Naples are $50,852, $70,500 for men and $33,846 for women, a difference of 52.0%.
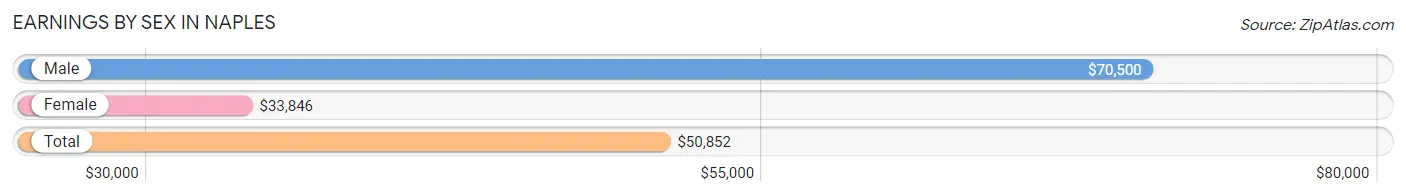
| Sex | Number | Average Earnings |
| Male | 648 (57.2%) | $70,500 |
| Female | 484 (42.8%) | $33,846 |
| Total | 1,132 (100.0%) | $50,852 |
Earnings by Sex by Income Bracket in Naples
The most common earnings brackets in Naples are $100,000+ for men (148 | 22.8%) and $65,000 to $74,999 for women (65 | 13.4%).
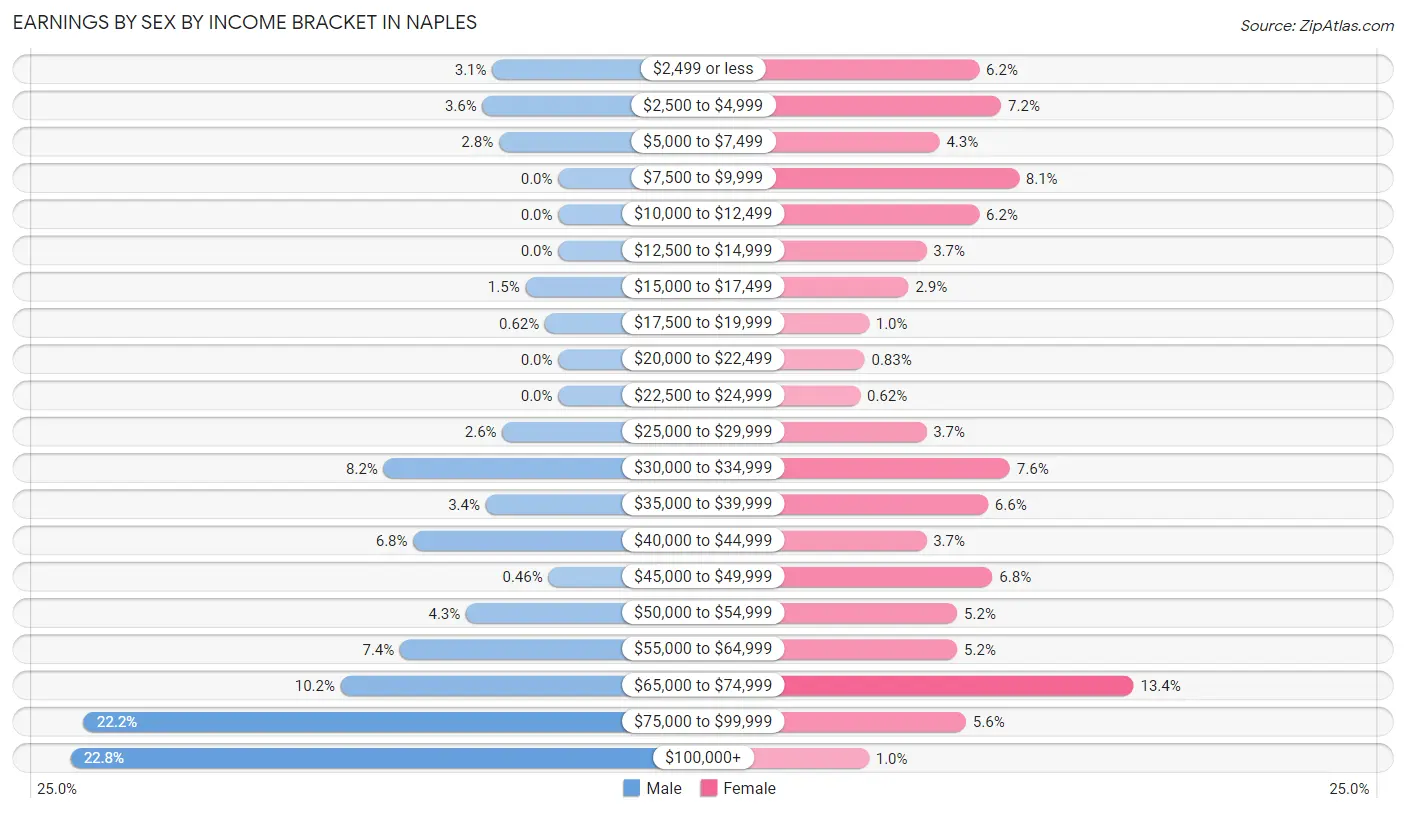
| Income | Male | Female |
| $2,499 or less | 20 (3.1%) | 30 (6.2%) |
| $2,500 to $4,999 | 23 (3.5%) | 35 (7.2%) |
| $5,000 to $7,499 | 18 (2.8%) | 21 (4.3%) |
| $7,500 to $9,999 | 0 (0.0%) | 39 (8.1%) |
| $10,000 to $12,499 | 0 (0.0%) | 30 (6.2%) |
| $12,500 to $14,999 | 0 (0.0%) | 18 (3.7%) |
| $15,000 to $17,499 | 10 (1.5%) | 14 (2.9%) |
| $17,500 to $19,999 | 4 (0.6%) | 5 (1.0%) |
| $20,000 to $22,499 | 0 (0.0%) | 4 (0.8%) |
| $22,500 to $24,999 | 0 (0.0%) | 3 (0.6%) |
| $25,000 to $29,999 | 17 (2.6%) | 18 (3.7%) |
| $30,000 to $34,999 | 53 (8.2%) | 37 (7.6%) |
| $35,000 to $39,999 | 22 (3.4%) | 32 (6.6%) |
| $40,000 to $44,999 | 44 (6.8%) | 18 (3.7%) |
| $45,000 to $49,999 | 3 (0.5%) | 33 (6.8%) |
| $50,000 to $54,999 | 28 (4.3%) | 25 (5.2%) |
| $55,000 to $64,999 | 48 (7.4%) | 25 (5.2%) |
| $65,000 to $74,999 | 66 (10.2%) | 65 (13.4%) |
| $75,000 to $99,999 | 144 (22.2%) | 27 (5.6%) |
| $100,000+ | 148 (22.8%) | 5 (1.0%) |
| Total | 648 (100.0%) | 484 (100.0%) |
Earnings by Sex by Educational Attainment in Naples
Average earnings in Naples are $77,344 for men and $37,500 for women, a difference of 51.5%. Men with an educational attainment of graduate degree enjoy the highest average annual earnings of $106,500, while those with less than high school education earn the least with $57,679. Women with an educational attainment of bachelor's degree earn the most with the average annual earnings of $65,147, while those with college or associate's degree education have the smallest earnings of $34,250.
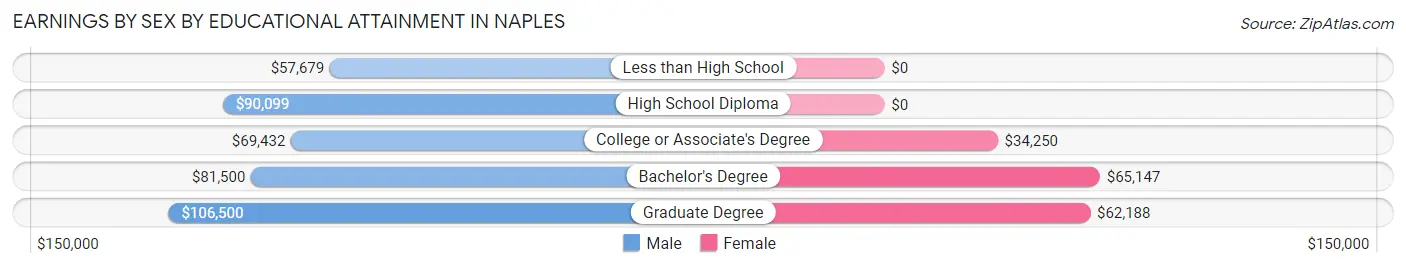
| Educational Attainment | Male Income | Female Income |
| Less than High School | $57,679 | $0 |
| High School Diploma | $90,099 | $0 |
| College or Associate's Degree | $69,432 | $34,250 |
| Bachelor's Degree | $81,500 | $65,147 |
| Graduate Degree | $106,500 | $62,188 |
| Total | $77,344 | $37,500 |
Family Income in Naples
Family Income Brackets in Naples
According to the Naples family income data, there are 196 families falling into the $100,000 to $149,999 income range, which is the most common income bracket and makes up 27.2% of all families. Conversely, the $15,000 to $24,999 income bracket is the least frequent group with only 12 families (1.7%) belonging to this category.
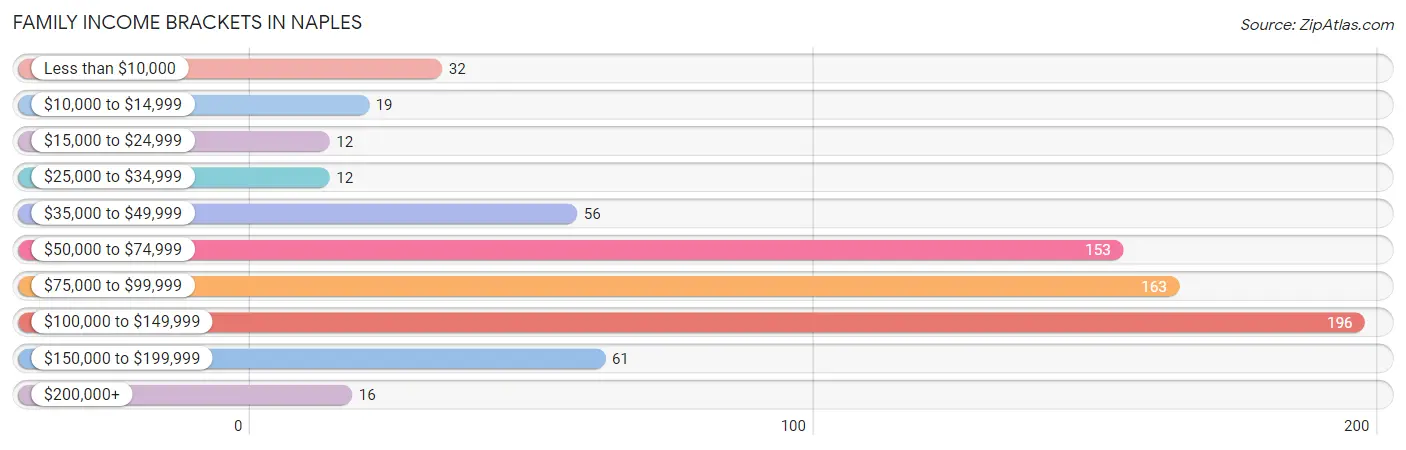
| Income Bracket | # Families | % Families |
| Less than $10,000 | 32 | 4.4% |
| $10,000 to $14,999 | 19 | 2.6% |
| $15,000 to $24,999 | 12 | 1.7% |
| $25,000 to $34,999 | 12 | 1.7% |
| $35,000 to $49,999 | 56 | 7.8% |
| $50,000 to $74,999 | 153 | 21.3% |
| $75,000 to $99,999 | 163 | 22.6% |
| $100,000 to $149,999 | 196 | 27.2% |
| $150,000 to $199,999 | 61 | 8.5% |
| $200,000+ | 16 | 2.2% |
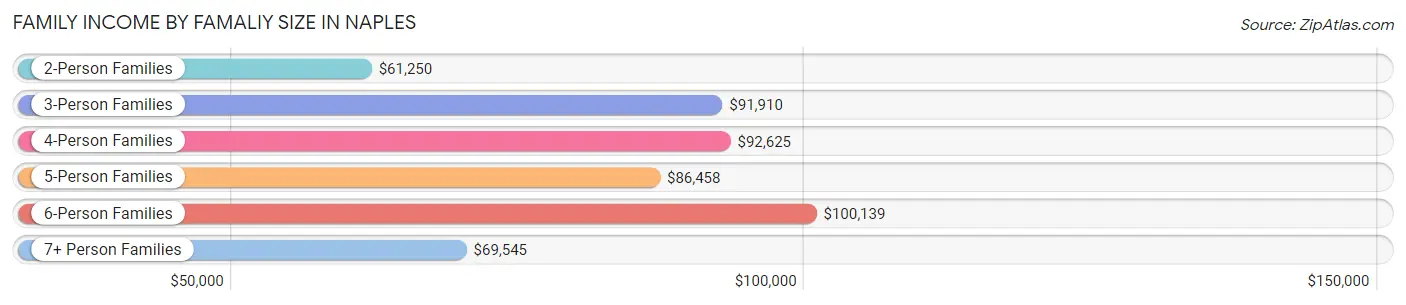
Family Income by Famaliy Size in Naples
6-person families (89 | 12.4%) account for the highest median family income in Naples with $100,139 per family, while 3-person families (195 | 27.1%) have the highest median income of $30,637 per family member.
| Income Bracket | # Families | Median Income |
| 2-Person Families | 244 (33.9%) | $61,250 |
| 3-Person Families | 195 (27.1%) | $91,910 |
| 4-Person Families | 119 (16.5%) | $92,625 |
| 5-Person Families | 37 (5.1%) | $86,458 |
| 6-Person Families | 89 (12.4%) | $100,139 |
| 7+ Person Families | 36 (5.0%) | $69,545 |
| Total | 720 (100.0%) | $90,098 |
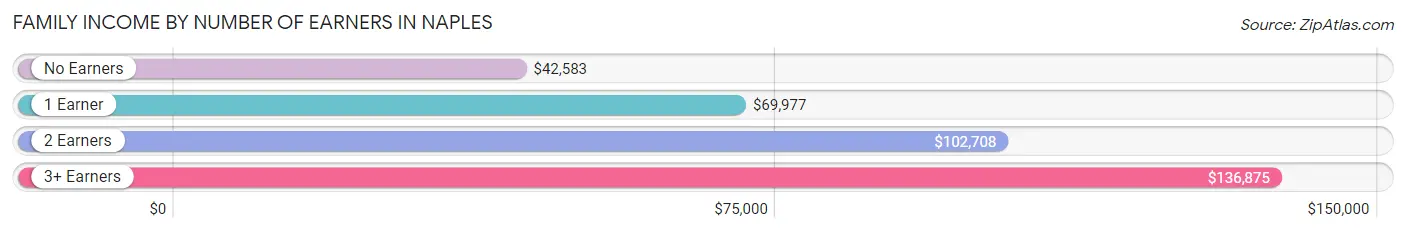
Family Income by Number of Earners in Naples
The median family income in Naples is $90,098, with families comprising 3+ earners (52) having the highest median family income of $136,875, while families with no earners (111) have the lowest median family income of $42,583, accounting for 7.2% and 15.4% of families, respectively.
| Number of Earners | # Families | Median Income |
| No Earners | 111 (15.4%) | $42,583 |
| 1 Earner | 261 (36.2%) | $69,977 |
| 2 Earners | 296 (41.1%) | $102,708 |
| 3+ Earners | 52 (7.2%) | $136,875 |
| Total | 720 (100.0%) | $90,098 |
Household Income in Naples
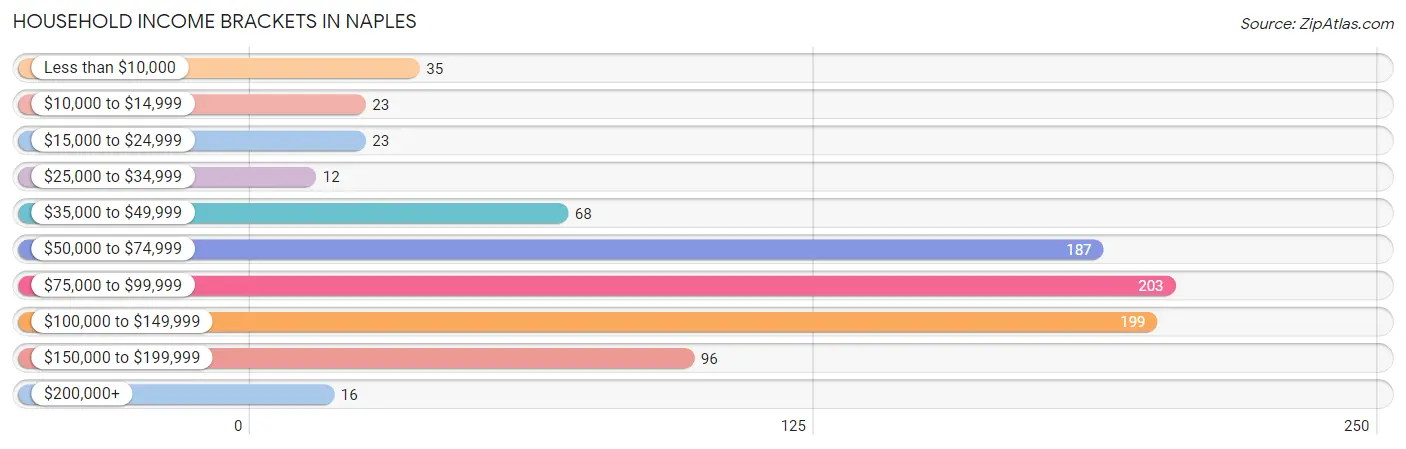
Household Income Brackets in Naples
With 203 households falling in the category, the $75,000 to $99,999 income range is the most frequent in Naples, accounting for 23.5% of all households. In contrast, only 12 households (1.4%) fall into the $25,000 to $34,999 income bracket, making it the least populous group.
| Income Bracket | # Households | % Households |
| Less than $10,000 | 35 | 4.1% |
| $10,000 to $14,999 | 23 | 2.7% |
| $15,000 to $24,999 | 23 | 2.7% |
| $25,000 to $34,999 | 12 | 1.4% |
| $35,000 to $49,999 | 68 | 7.9% |
| $50,000 to $74,999 | 187 | 21.7% |
| $75,000 to $99,999 | 203 | 23.5% |
| $100,000 to $149,999 | 199 | 23.1% |
| $150,000 to $199,999 | 96 | 11.1% |
| $200,000+ | 16 | 1.9% |
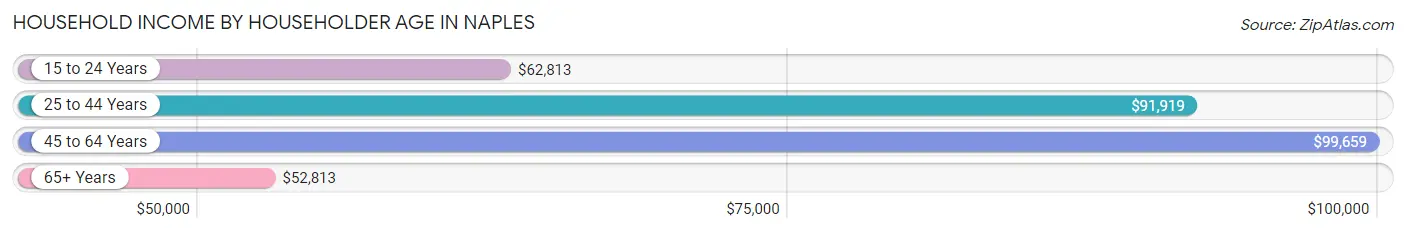
Household Income by Householder Age in Naples
The median household income in Naples is $87,679, with the highest median household income of $99,659 found in the 45 to 64 years age bracket for the primary householder. A total of 211 households (24.5%) fall into this category. Meanwhile, the 65+ years age bracket for the primary householder has the lowest median household income of $52,813, with 182 households (21.1%) in this group.
| Income Bracket | # Households | Median Income |
| 15 to 24 Years | 25 (2.9%) | $62,813 |
| 25 to 44 Years | 444 (51.5%) | $91,919 |
| 45 to 64 Years | 211 (24.5%) | $99,659 |
| 65+ Years | 182 (21.1%) | $52,813 |
| Total | 862 (100.0%) | $87,679 |
Poverty in Naples
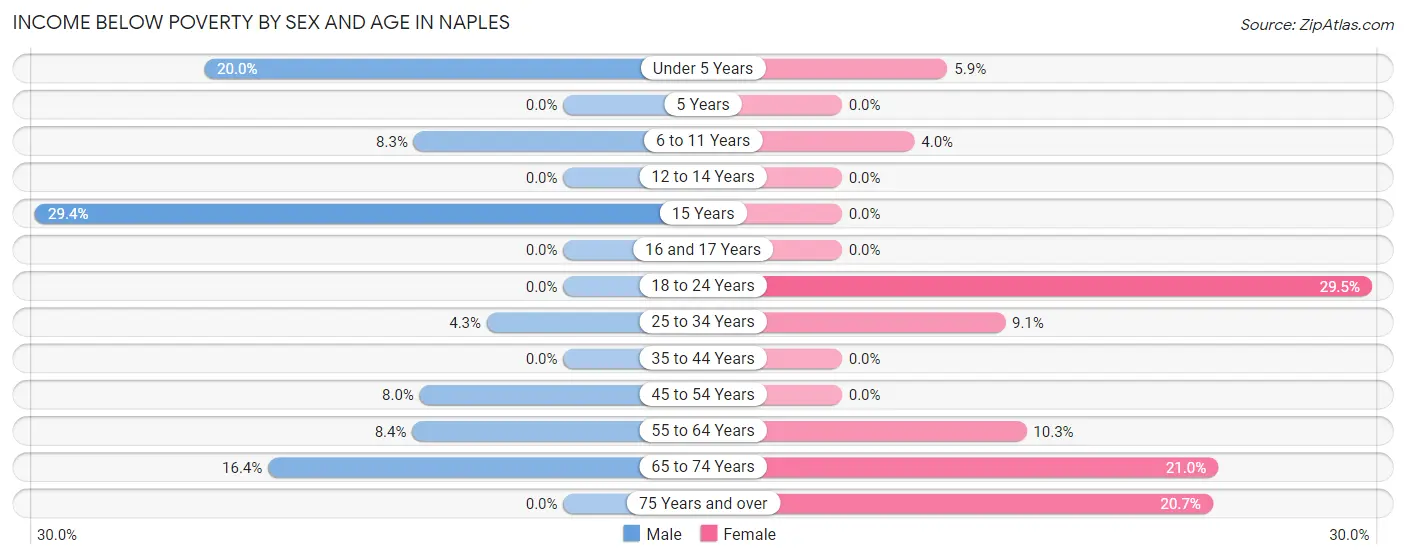
Income Below Poverty by Sex and Age in Naples
With 6.0% poverty level for males and 7.9% for females among the residents of Naples, 15 year old males and 18 to 24 year old females are the most vulnerable to poverty, with 5 males (29.4%) and 18 females (29.5%) in their respective age groups living below the poverty level.
| Age Bracket | Male | Female |
| Under 5 Years | 24 (20.0%) | 9 (5.9%) |
| 5 Years | 0 (0.0%) | 0 (0.0%) |
| 6 to 11 Years | 17 (8.3%) | 9 (4.0%) |
| 12 to 14 Years | 0 (0.0%) | 0 (0.0%) |
| 15 Years | 5 (29.4%) | 0 (0.0%) |
| 16 and 17 Years | 0 (0.0%) | 0 (0.0%) |
| 18 to 24 Years | 0 (0.0%) | 18 (29.5%) |
| 25 to 34 Years | 8 (4.3%) | 24 (9.1%) |
| 35 to 44 Years | 0 (0.0%) | 0 (0.0%) |
| 45 to 54 Years | 8 (8.0%) | 0 (0.0%) |
| 55 to 64 Years | 9 (8.4%) | 11 (10.3%) |
| 65 to 74 Years | 12 (16.4%) | 22 (20.9%) |
| 75 Years and over | 0 (0.0%) | 19 (20.6%) |
| Total | 83 (6.0%) | 112 (7.9%) |
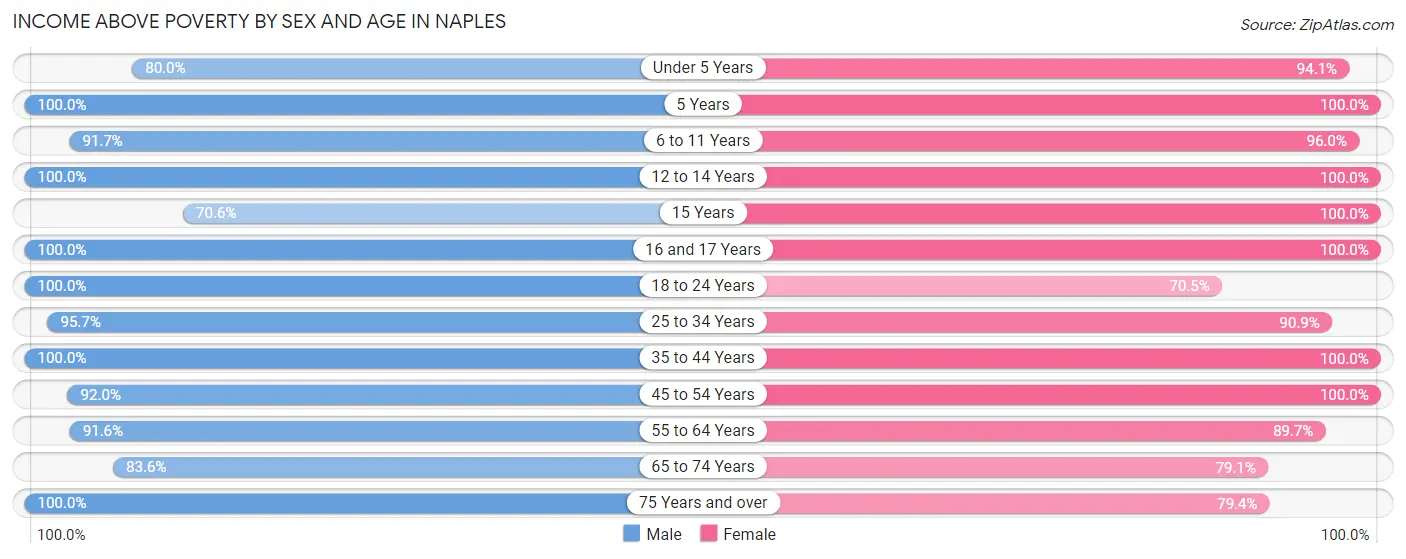
Income Above Poverty by Sex and Age in Naples
According to the poverty statistics in Naples, males aged 5 years and females aged 5 years are the age groups that are most secure financially, with 100.0% of males and 100.0% of females in these age groups living above the poverty line.
| Age Bracket | Male | Female |
| Under 5 Years | 96 (80.0%) | 144 (94.1%) |
| 5 Years | 27 (100.0%) | 23 (100.0%) |
| 6 to 11 Years | 187 (91.7%) | 214 (96.0%) |
| 12 to 14 Years | 55 (100.0%) | 61 (100.0%) |
| 15 Years | 12 (70.6%) | 30 (100.0%) |
| 16 and 17 Years | 32 (100.0%) | 26 (100.0%) |
| 18 to 24 Years | 104 (100.0%) | 43 (70.5%) |
| 25 to 34 Years | 180 (95.7%) | 240 (90.9%) |
| 35 to 44 Years | 279 (100.0%) | 184 (100.0%) |
| 45 to 54 Years | 92 (92.0%) | 95 (100.0%) |
| 55 to 64 Years | 98 (91.6%) | 96 (89.7%) |
| 65 to 74 Years | 61 (83.6%) | 83 (79.0%) |
| 75 Years and over | 68 (100.0%) | 73 (79.3%) |
| Total | 1,291 (94.0%) | 1,312 (92.1%) |
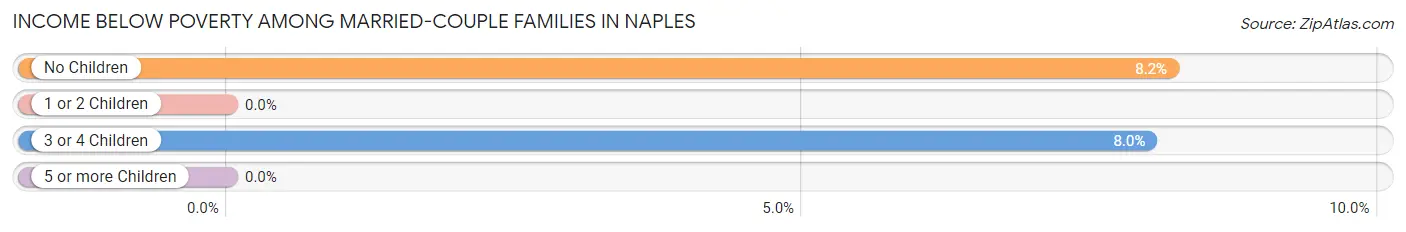
Income Below Poverty Among Married-Couple Families in Naples
The poverty statistics for married-couple families in Naples show that 4.6% or 31 of the total 666 families live below the poverty line. Families with no children have the highest poverty rate of 8.2%, comprising of 23 families. On the other hand, families with 1 or 2 children have the lowest poverty rate of 0.0%, which includes 0 families.
| Children | Above Poverty | Below Poverty |
| No Children | 258 (91.8%) | 23 (8.2%) |
| 1 or 2 Children | 249 (100.0%) | 0 (0.0%) |
| 3 or 4 Children | 92 (92.0%) | 8 (8.0%) |
| 5 or more Children | 36 (100.0%) | 0 (0.0%) |
| Total | 635 (95.4%) | 31 (4.6%) |
Income Below Poverty Among Single-Parent Households in Naples
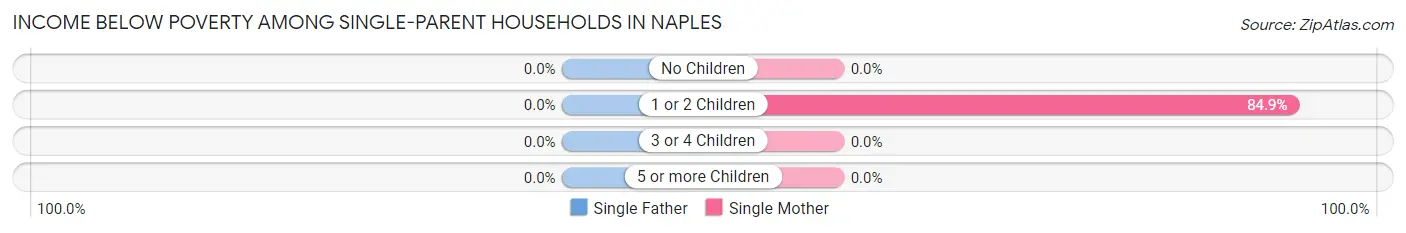
| Children | Single Father | Single Mother |
| No Children | 0 (0.0%) | 0 (0.0%) |
| 1 or 2 Children | 0 (0.0%) | 28 (84.9%) |
| 3 or 4 Children | 0 (0.0%) | 0 (0.0%) |
| 5 or more Children | 0 (0.0%) | 0 (0.0%) |
| Total | 0 (0.0%) | 28 (51.8%) |
Income Below Poverty Among Married-Couple vs Single-Parent Households in Naples
The poverty data for Naples shows that 31 of the married-couple family households (4.6%) and 28 of the single-parent households (51.8%) are living below the poverty level. Within the married-couple family households, those with no children have the highest poverty rate, with 23 households (8.2%) falling below the poverty line. Among the single-parent households, those with 1 or 2 children have the highest poverty rate, with 28 household (84.9%) living below poverty.
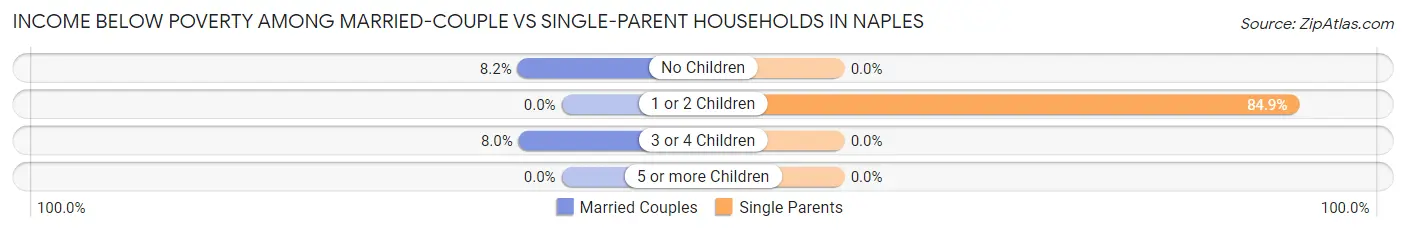
| Children | Married-Couple Families | Single-Parent Households |
| No Children | 23 (8.2%) | 0 (0.0%) |
| 1 or 2 Children | 0 (0.0%) | 28 (84.9%) |
| 3 or 4 Children | 8 (8.0%) | 0 (0.0%) |
| 5 or more Children | 0 (0.0%) | 0 (0.0%) |
| Total | 31 (4.6%) | 28 (51.8%) |
Employment Characteristics in Naples
Employment by Class of Employer in Naples
Among the 1,044 employed individuals in Naples, private company employees (693 | 66.4%), local government employees (126 | 12.1%), and self-employed (incorporated) (69 | 6.6%) make up the most common classes of employment.
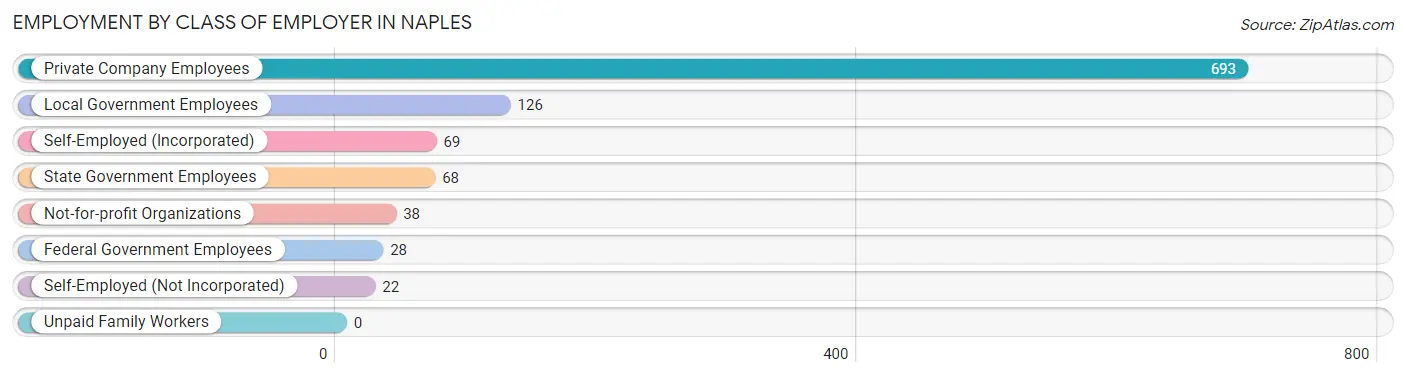
| Employer Class | # Employees | % Employees |
| Private Company Employees | 693 | 66.4% |
| Self-Employed (Incorporated) | 69 | 6.6% |
| Self-Employed (Not Incorporated) | 22 | 2.1% |
| Not-for-profit Organizations | 38 | 3.6% |
| Local Government Employees | 126 | 12.1% |
| State Government Employees | 68 | 6.5% |
| Federal Government Employees | 28 | 2.7% |
| Unpaid Family Workers | 0 | 0.0% |
| Total | 1,044 | 100.0% |
Employment Status by Age in Naples
According to the labor force statistics for Naples, out of the total population over 16 years of age (1,888), 57.3% or 1,082 individuals are in the labor force, with 2.2% or 24 of them unemployed. The age group with the highest labor force participation rate is 20 to 24 years, with 95.7% or 88 individuals in the labor force. Within the labor force, the 60 to 64 years age range has the highest percentage of unemployed individuals, with 19.6% or 10 of them being unemployed.
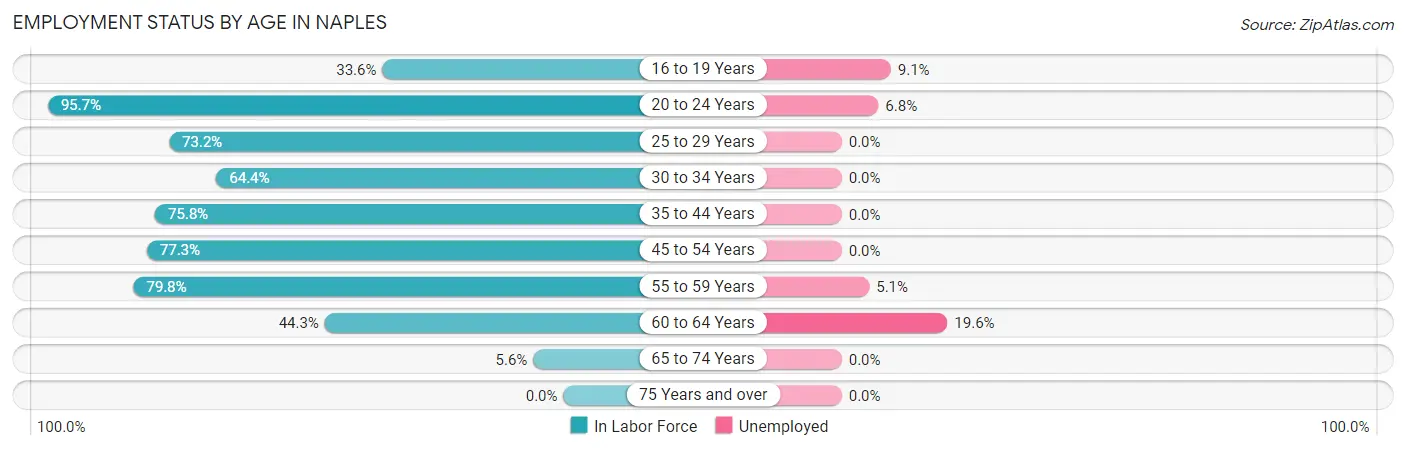
| Age Bracket | In Labor Force | Unemployed |
| 16 to 19 Years | 44 (33.6%) | 4 (9.1%) |
| 20 to 24 Years | 88 (95.7%) | 6 (6.8%) |
| 25 to 29 Years | 115 (73.2%) | 0 (0.0%) |
| 30 to 34 Years | 190 (64.4%) | 0 (0.0%) |
| 35 to 44 Years | 351 (75.8%) | 0 (0.0%) |
| 45 to 54 Years | 153 (77.3%) | 0 (0.0%) |
| 55 to 59 Years | 79 (79.8%) | 4 (5.1%) |
| 60 to 64 Years | 51 (44.3%) | 10 (19.6%) |
| 65 to 74 Years | 10 (5.6%) | 0 (0.0%) |
| 75 Years and over | 0 (0.0%) | 0 (0.0%) |
| Total | 1,082 (57.3%) | 24 (2.2%) |
Employment Status by Educational Attainment in Naples
According to labor force statistics for Naples, 70.8% of individuals (940) out of the total population between 25 and 64 years of age (1,327) are in the labor force, with 1.5% or 14 of them being unemployed. The group with the highest labor force participation rate are those with the educational attainment of college / associate degree, with 73.1% or 350 individuals in the labor force. Within the labor force, individuals with bachelor's degree or higher education have the highest percentage of unemployment, with 3.4% or 10 of them being unemployed.
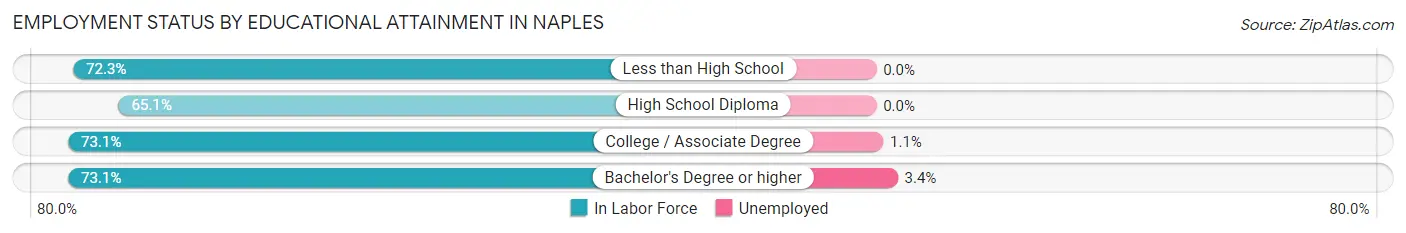
| Educational Attainment | In Labor Force | Unemployed |
| Less than High School | 47 (72.3%) | 0 (0.0%) |
| High School Diploma | 248 (65.1%) | 0 (0.0%) |
| College / Associate Degree | 350 (73.1%) | 5 (1.1%) |
| Bachelor's Degree or higher | 294 (73.1%) | 14 (3.4%) |
| Total | 940 (70.8%) | 20 (1.5%) |
Employment Occupations by Sex in Naples
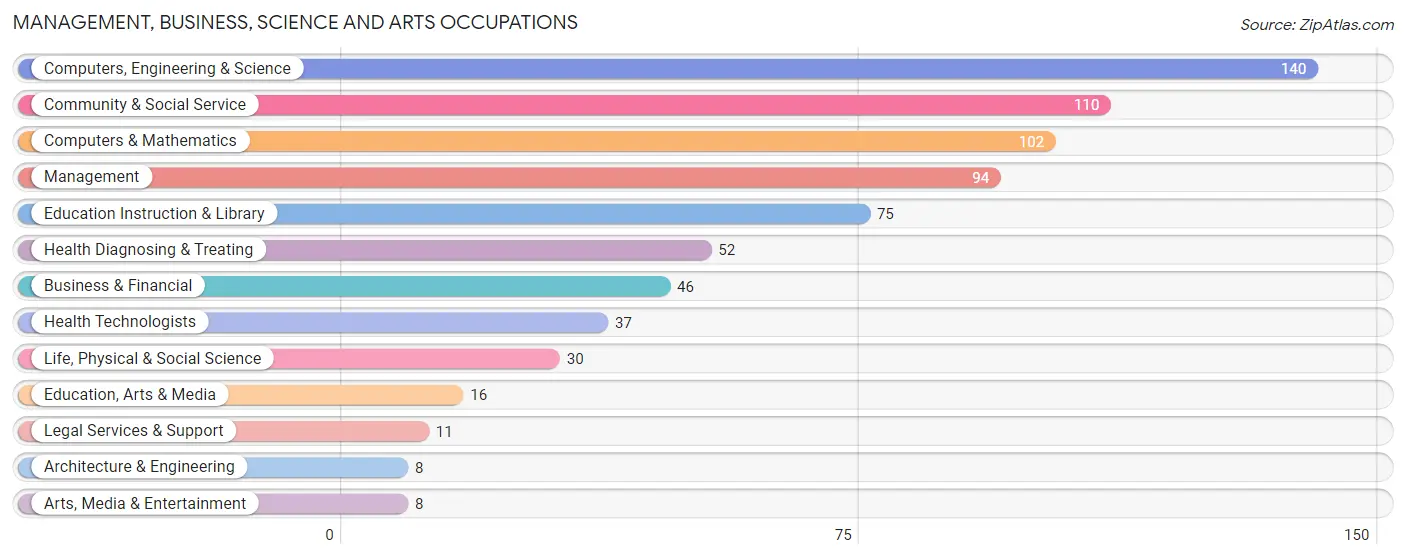
Management, Business, Science and Arts Occupations
The most common Management, Business, Science and Arts occupations in Naples are Computers, Engineering & Science (140 | 13.3%), Community & Social Service (110 | 10.4%), Computers & Mathematics (102 | 9.7%), Management (94 | 8.9%), and Education Instruction & Library (75 | 7.1%).
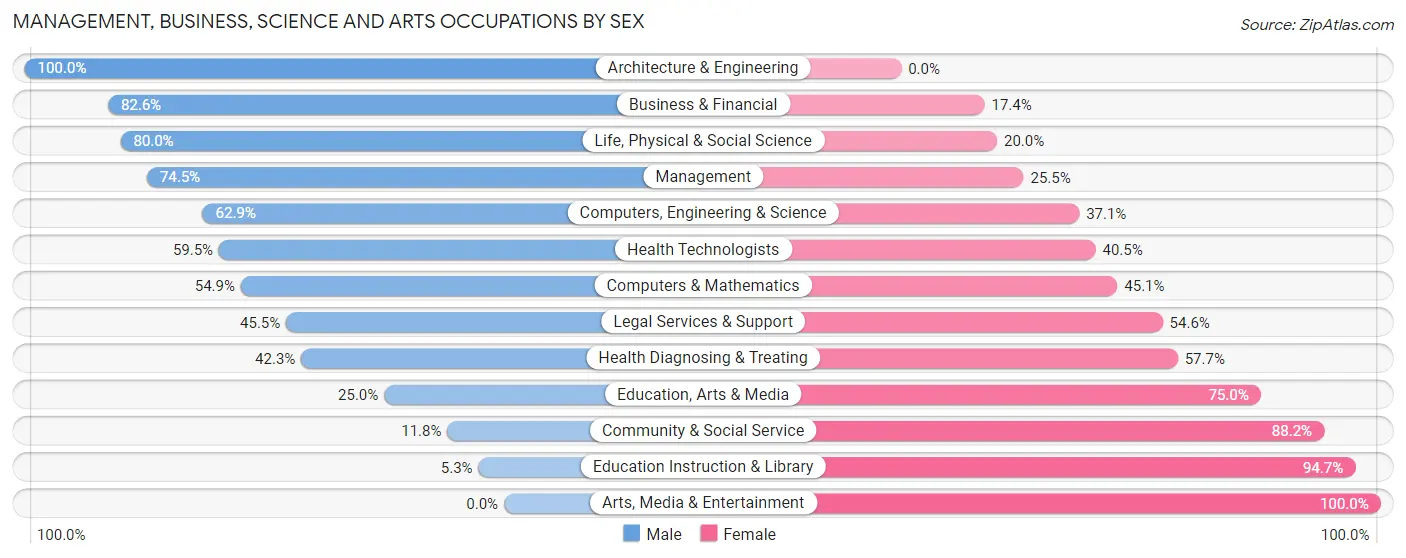
Management, Business, Science and Arts Occupations by Sex
Within the Management, Business, Science and Arts occupations in Naples, the most male-oriented occupations are Architecture & Engineering (100.0%), Business & Financial (82.6%), and Life, Physical & Social Science (80.0%), while the most female-oriented occupations are Arts, Media & Entertainment (100.0%), Education Instruction & Library (94.7%), and Community & Social Service (88.2%).
| Occupation | Male | Female |
| Management | 70 (74.5%) | 24 (25.5%) |
| Business & Financial | 38 (82.6%) | 8 (17.4%) |
| Computers, Engineering & Science | 88 (62.9%) | 52 (37.1%) |
| Computers & Mathematics | 56 (54.9%) | 46 (45.1%) |
| Architecture & Engineering | 8 (100.0%) | 0 (0.0%) |
| Life, Physical & Social Science | 24 (80.0%) | 6 (20.0%) |
| Community & Social Service | 13 (11.8%) | 97 (88.2%) |
| Education, Arts & Media | 4 (25.0%) | 12 (75.0%) |
| Legal Services & Support | 5 (45.5%) | 6 (54.5%) |
| Education Instruction & Library | 4 (5.3%) | 71 (94.7%) |
| Arts, Media & Entertainment | 0 (0.0%) | 8 (100.0%) |
| Health Diagnosing & Treating | 22 (42.3%) | 30 (57.7%) |
| Health Technologists | 22 (59.5%) | 15 (40.5%) |
| Total (Category) | 231 (52.3%) | 211 (47.7%) |
| Total (Overall) | 610 (57.7%) | 447 (42.3%) |
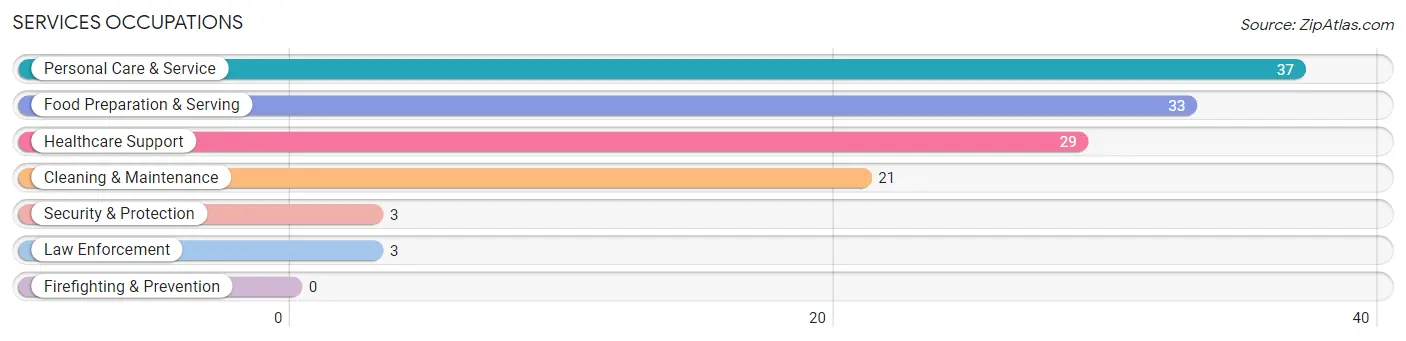
Services Occupations
The most common Services occupations in Naples are Personal Care & Service (37 | 3.5%), Food Preparation & Serving (33 | 3.1%), Healthcare Support (29 | 2.7%), Cleaning & Maintenance (21 | 2.0%), and Security & Protection (3 | 0.3%).
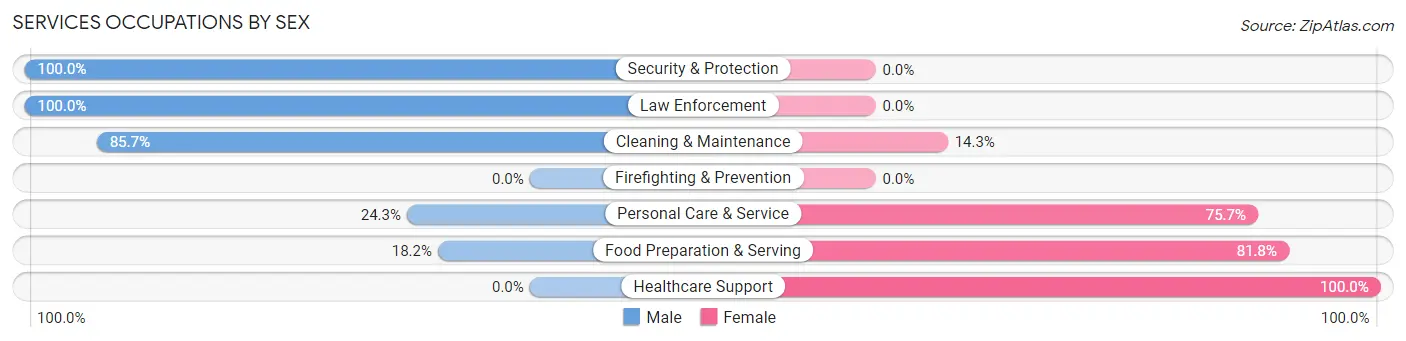
Services Occupations by Sex
Within the Services occupations in Naples, the most male-oriented occupations are Security & Protection (100.0%), Law Enforcement (100.0%), and Cleaning & Maintenance (85.7%), while the most female-oriented occupations are Healthcare Support (100.0%), Food Preparation & Serving (81.8%), and Personal Care & Service (75.7%).
| Occupation | Male | Female |
| Healthcare Support | 0 (0.0%) | 29 (100.0%) |
| Security & Protection | 3 (100.0%) | 0 (0.0%) |
| Firefighting & Prevention | 0 (0.0%) | 0 (0.0%) |
| Law Enforcement | 3 (100.0%) | 0 (0.0%) |
| Food Preparation & Serving | 6 (18.2%) | 27 (81.8%) |
| Cleaning & Maintenance | 18 (85.7%) | 3 (14.3%) |
| Personal Care & Service | 9 (24.3%) | 28 (75.7%) |
| Total (Category) | 36 (29.3%) | 87 (70.7%) |
| Total (Overall) | 610 (57.7%) | 447 (42.3%) |
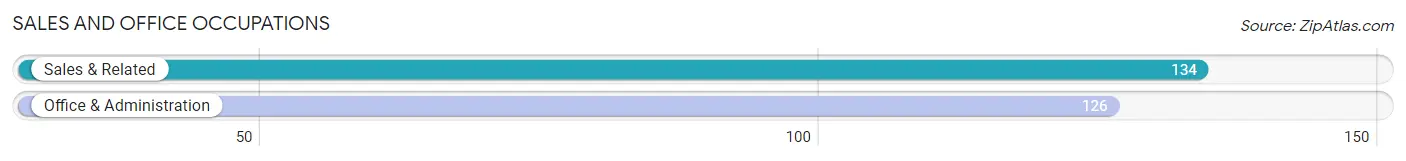
Sales and Office Occupations
The most common Sales and Office occupations in Naples are Sales & Related (134 | 12.7%), and Office & Administration (126 | 11.9%).
Sales and Office Occupations by Sex
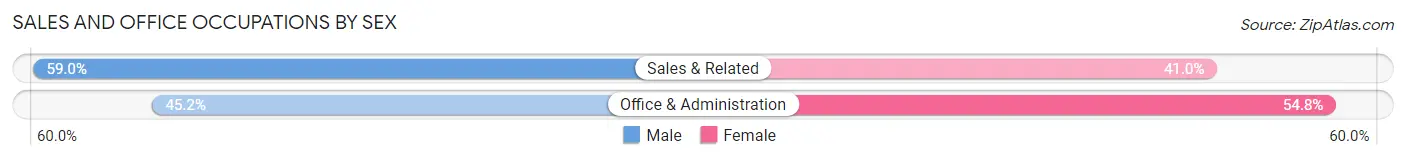
| Occupation | Male | Female |
| Sales & Related | 79 (59.0%) | 55 (41.0%) |
| Office & Administration | 57 (45.2%) | 69 (54.8%) |
| Total (Category) | 136 (52.3%) | 124 (47.7%) |
| Total (Overall) | 610 (57.7%) | 447 (42.3%) |
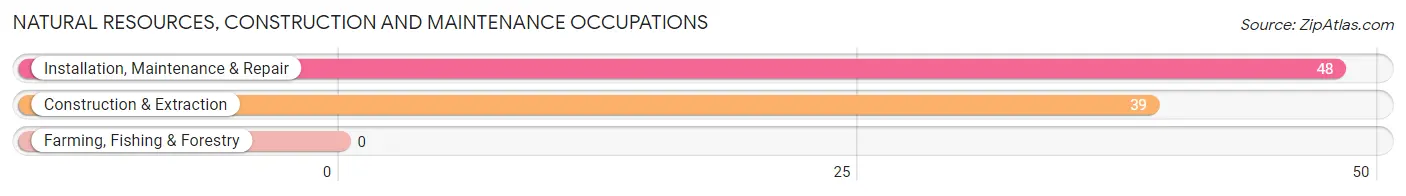
Natural Resources, Construction and Maintenance Occupations
The most common Natural Resources, Construction and Maintenance occupations in Naples are Installation, Maintenance & Repair (48 | 4.5%), and Construction & Extraction (39 | 3.7%).
Natural Resources, Construction and Maintenance Occupations by Sex
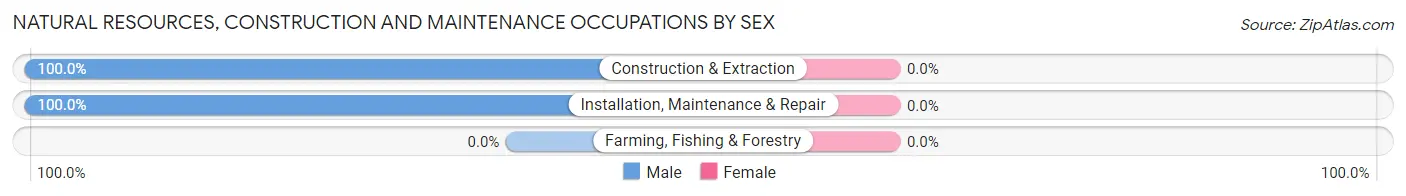
| Occupation | Male | Female |
| Farming, Fishing & Forestry | 0 (0.0%) | 0 (0.0%) |
| Construction & Extraction | 39 (100.0%) | 0 (0.0%) |
| Installation, Maintenance & Repair | 48 (100.0%) | 0 (0.0%) |
| Total (Category) | 87 (100.0%) | 0 (0.0%) |
| Total (Overall) | 610 (57.7%) | 447 (42.3%) |
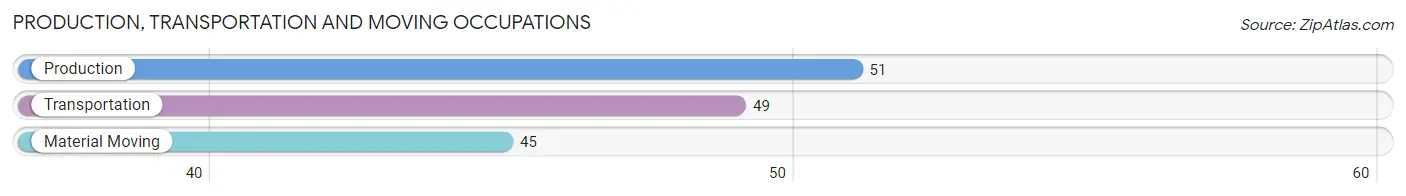
Production, Transportation and Moving Occupations
The most common Production, Transportation and Moving occupations in Naples are Production (51 | 4.8%), Transportation (49 | 4.6%), and Material Moving (45 | 4.3%).
Production, Transportation and Moving Occupations by Sex
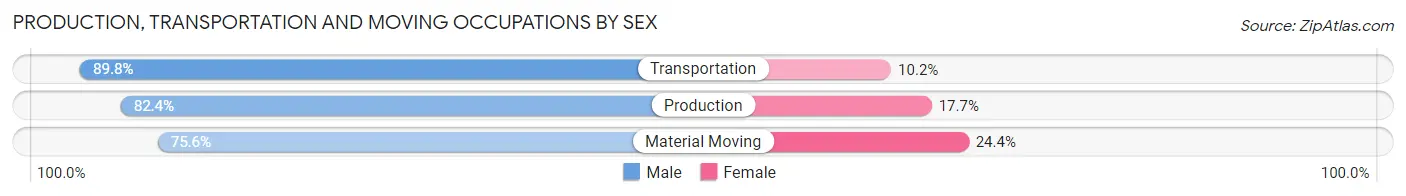
| Occupation | Male | Female |
| Production | 42 (82.4%) | 9 (17.6%) |
| Transportation | 44 (89.8%) | 5 (10.2%) |
| Material Moving | 34 (75.6%) | 11 (24.4%) |
| Total (Category) | 120 (82.8%) | 25 (17.2%) |
| Total (Overall) | 610 (57.7%) | 447 (42.3%) |
Employment Industries by Sex in Naples
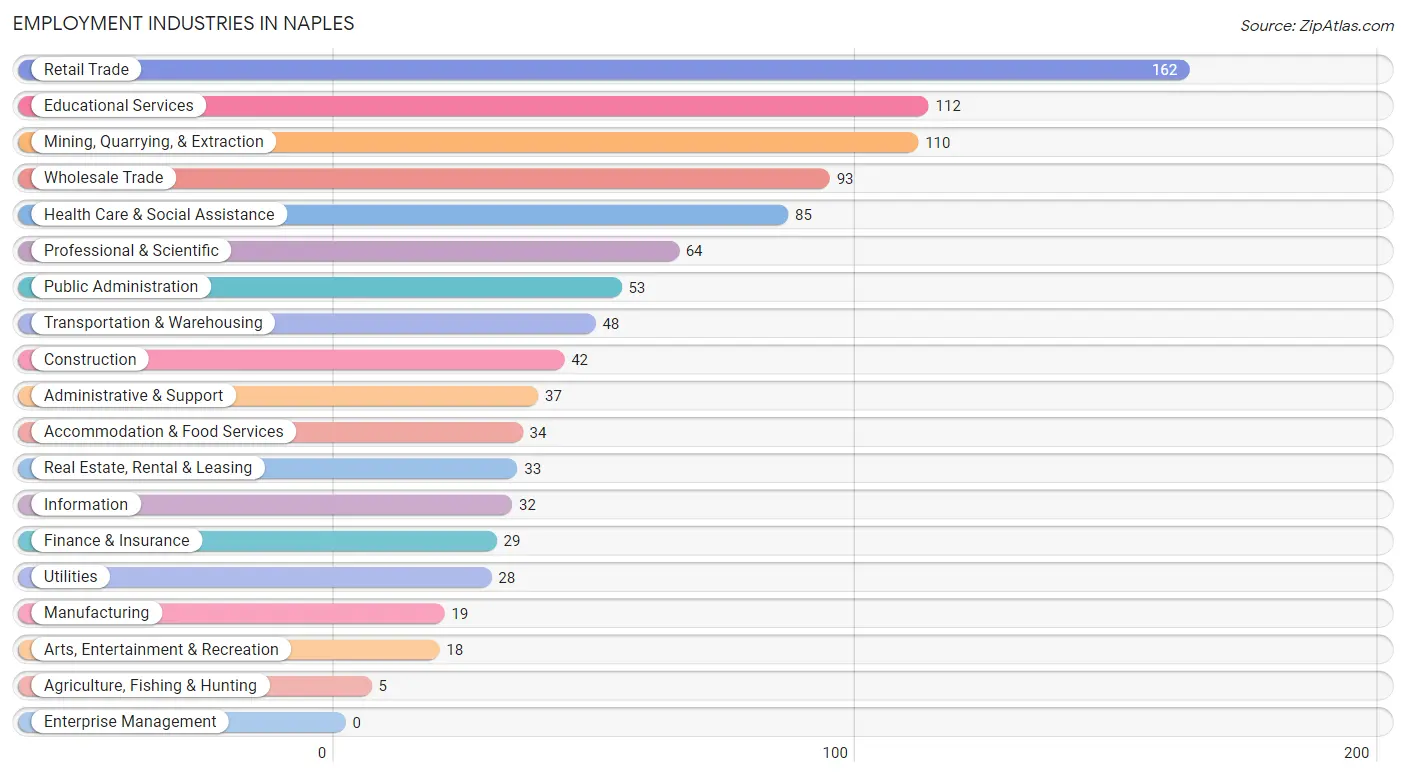
Employment Industries in Naples
The major employment industries in Naples include Retail Trade (162 | 15.3%), Educational Services (112 | 10.6%), Mining, Quarrying, & Extraction (110 | 10.4%), Wholesale Trade (93 | 8.8%), and Health Care & Social Assistance (85 | 8.0%).
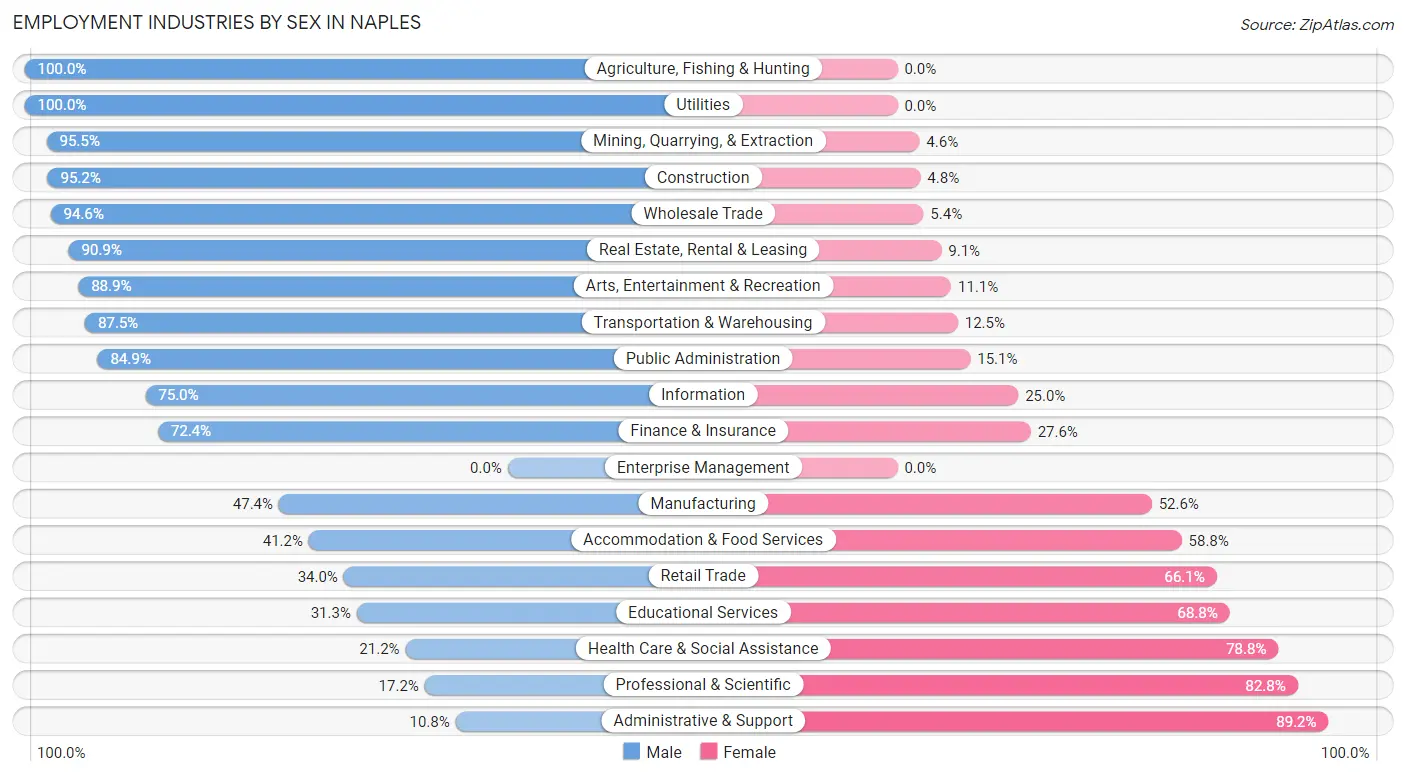
Employment Industries by Sex in Naples
The Naples industries that see more men than women are Agriculture, Fishing & Hunting (100.0%), Utilities (100.0%), and Mining, Quarrying, & Extraction (95.5%), whereas the industries that tend to have a higher number of women are Administrative & Support (89.2%), Professional & Scientific (82.8%), and Health Care & Social Assistance (78.8%).
| Industry | Male | Female |
| Agriculture, Fishing & Hunting | 5 (100.0%) | 0 (0.0%) |
| Mining, Quarrying, & Extraction | 105 (95.5%) | 5 (4.5%) |
| Construction | 40 (95.2%) | 2 (4.8%) |
| Manufacturing | 9 (47.4%) | 10 (52.6%) |
| Wholesale Trade | 88 (94.6%) | 5 (5.4%) |
| Retail Trade | 55 (34.0%) | 107 (66.0%) |
| Transportation & Warehousing | 42 (87.5%) | 6 (12.5%) |
| Utilities | 28 (100.0%) | 0 (0.0%) |
| Information | 24 (75.0%) | 8 (25.0%) |
| Finance & Insurance | 21 (72.4%) | 8 (27.6%) |
| Real Estate, Rental & Leasing | 30 (90.9%) | 3 (9.1%) |
| Professional & Scientific | 11 (17.2%) | 53 (82.8%) |
| Enterprise Management | 0 (0.0%) | 0 (0.0%) |
| Administrative & Support | 4 (10.8%) | 33 (89.2%) |
| Educational Services | 35 (31.2%) | 77 (68.8%) |
| Health Care & Social Assistance | 18 (21.2%) | 67 (78.8%) |
| Arts, Entertainment & Recreation | 16 (88.9%) | 2 (11.1%) |
| Accommodation & Food Services | 14 (41.2%) | 20 (58.8%) |
| Public Administration | 45 (84.9%) | 8 (15.1%) |
| Total | 610 (57.7%) | 447 (42.3%) |
Education in Naples
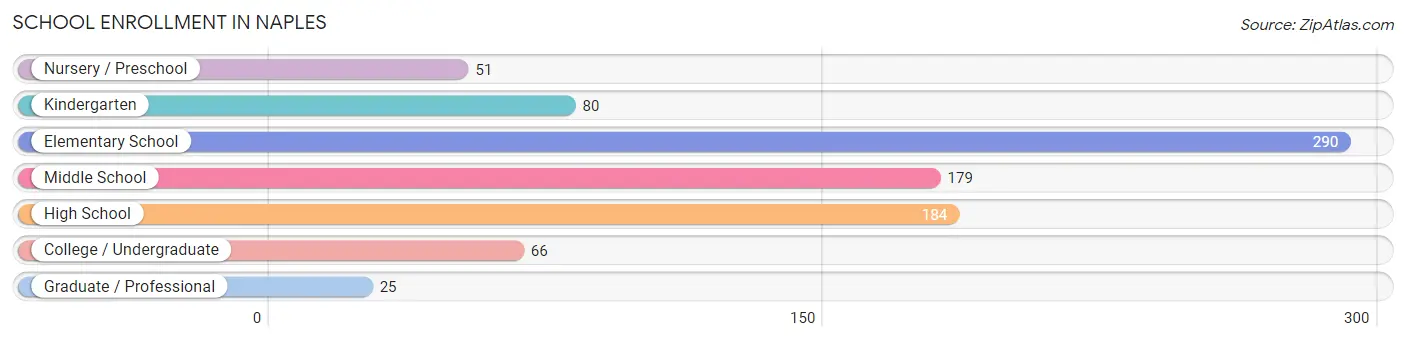
School Enrollment in Naples
The most common levels of schooling among the 875 students in Naples are elementary school (290 | 33.1%), high school (184 | 21.0%), and middle school (179 | 20.5%).
| School Level | # Students | % Students |
| Nursery / Preschool | 51 | 5.8% |
| Kindergarten | 80 | 9.1% |
| Elementary School | 290 | 33.1% |
| Middle School | 179 | 20.5% |
| High School | 184 | 21.0% |
| College / Undergraduate | 66 | 7.5% |
| Graduate / Professional | 25 | 2.9% |
| Total | 875 | 100.0% |
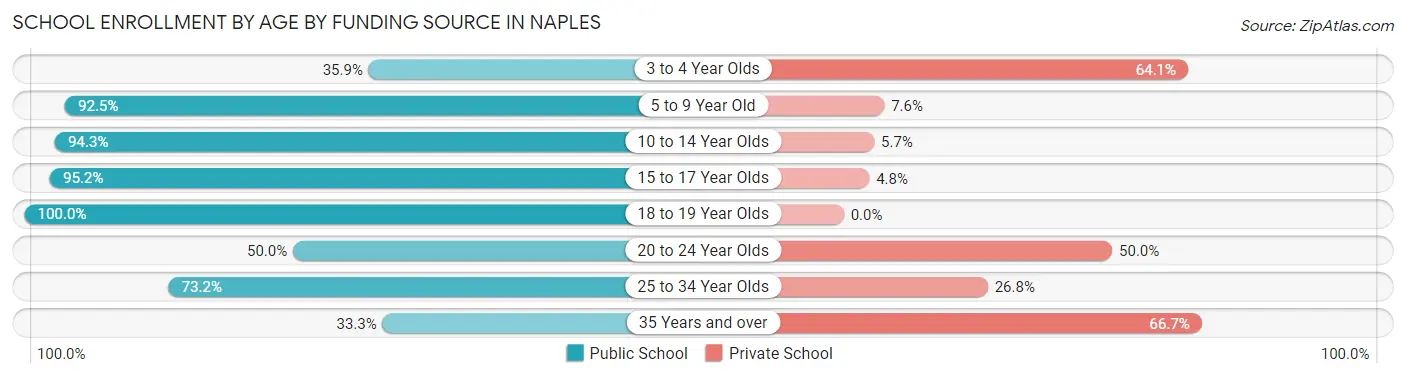
School Enrollment by Age by Funding Source in Naples
Out of a total of 875 students who are enrolled in schools in Naples, 107 (12.2%) attend a private institution, while the remaining 768 (87.8%) are enrolled in public schools. The age group of 35 years and over has the highest likelihood of being enrolled in private schools, with 16 (66.7% in the age bracket) enrolled. Conversely, the age group of 18 to 19 year olds has the lowest likelihood of being enrolled in a private school, with 66 (100.0% in the age bracket) attending a public institution.
| Age Bracket | Public School | Private School |
| 3 to 4 Year Olds | 14 (35.9%) | 25 (64.1%) |
| 5 to 9 Year Old | 306 (92.4%) | 25 (7.5%) |
| 10 to 14 Year Olds | 233 (94.3%) | 14 (5.7%) |
| 15 to 17 Year Olds | 100 (95.2%) | 5 (4.8%) |
| 18 to 19 Year Olds | 66 (100.0%) | 0 (0.0%) |
| 20 to 24 Year Olds | 11 (50.0%) | 11 (50.0%) |
| 25 to 34 Year Olds | 30 (73.2%) | 11 (26.8%) |
| 35 Years and over | 8 (33.3%) | 16 (66.7%) |
| Total | 768 (87.8%) | 107 (12.2%) |
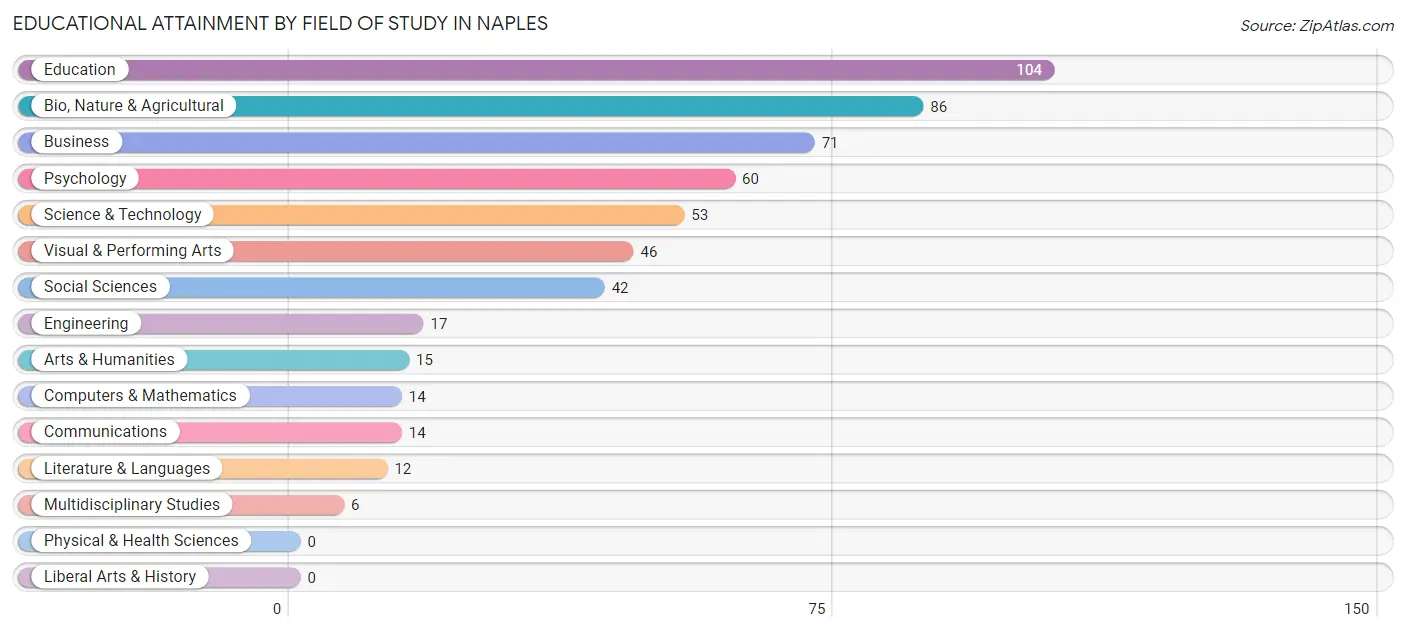
Educational Attainment by Field of Study in Naples
Education (104 | 19.3%), bio, nature & agricultural (86 | 15.9%), business (71 | 13.2%), psychology (60 | 11.1%), and science & technology (53 | 9.8%) are the most common fields of study among 540 individuals in Naples who have obtained a bachelor's degree or higher.
| Field of Study | # Graduates | % Graduates |
| Computers & Mathematics | 14 | 2.6% |
| Bio, Nature & Agricultural | 86 | 15.9% |
| Physical & Health Sciences | 0 | 0.0% |
| Psychology | 60 | 11.1% |
| Social Sciences | 42 | 7.8% |
| Engineering | 17 | 3.2% |
| Multidisciplinary Studies | 6 | 1.1% |
| Science & Technology | 53 | 9.8% |
| Business | 71 | 13.2% |
| Education | 104 | 19.3% |
| Literature & Languages | 12 | 2.2% |
| Liberal Arts & History | 0 | 0.0% |
| Visual & Performing Arts | 46 | 8.5% |
| Communications | 14 | 2.6% |
| Arts & Humanities | 15 | 2.8% |
| Total | 540 | 100.0% |
Transportation & Commute in Naples
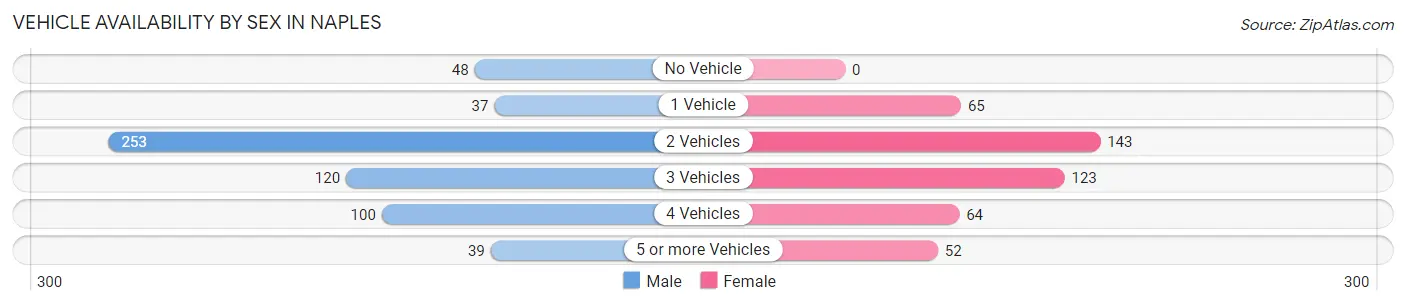
Vehicle Availability by Sex in Naples
The most prevalent vehicle ownership categories in Naples are males with 2 vehicles (253, accounting for 42.4%) and females with 2 vehicles (143, making up 56.6%).
| Vehicles Available | Male | Female |
| No Vehicle | 48 (8.0%) | 0 (0.0%) |
| 1 Vehicle | 37 (6.2%) | 65 (14.5%) |
| 2 Vehicles | 253 (42.4%) | 143 (32.0%) |
| 3 Vehicles | 120 (20.1%) | 123 (27.5%) |
| 4 Vehicles | 100 (16.8%) | 64 (14.3%) |
| 5 or more Vehicles | 39 (6.5%) | 52 (11.6%) |
| Total | 597 (100.0%) | 447 (100.0%) |
Commute Time in Naples
The most frequently occuring commute durations in Naples are 10 to 14 minutes (321 commuters, 32.9%), 5 to 9 minutes (206 commuters, 21.1%), and 15 to 19 minutes (144 commuters, 14.7%).
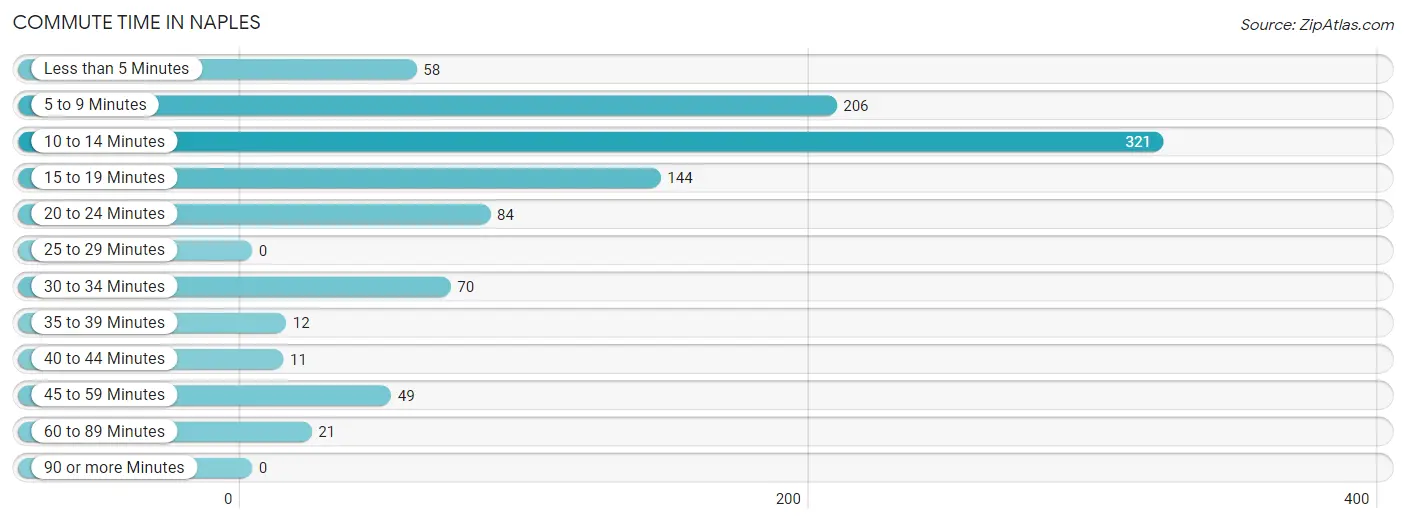
| Commute Time | # Commuters | % Commuters |
| Less than 5 Minutes | 58 | 5.9% |
| 5 to 9 Minutes | 206 | 21.1% |
| 10 to 14 Minutes | 321 | 32.9% |
| 15 to 19 Minutes | 144 | 14.7% |
| 20 to 24 Minutes | 84 | 8.6% |
| 25 to 29 Minutes | 0 | 0.0% |
| 30 to 34 Minutes | 70 | 7.2% |
| 35 to 39 Minutes | 12 | 1.2% |
| 40 to 44 Minutes | 11 | 1.1% |
| 45 to 59 Minutes | 49 | 5.0% |
| 60 to 89 Minutes | 21 | 2.1% |
| 90 or more Minutes | 0 | 0.0% |
Commute Time by Sex in Naples
The most common commute times in Naples are 10 to 14 minutes (181 commuters, 31.5%) for males and 10 to 14 minutes (140 commuters, 34.8%) for females.
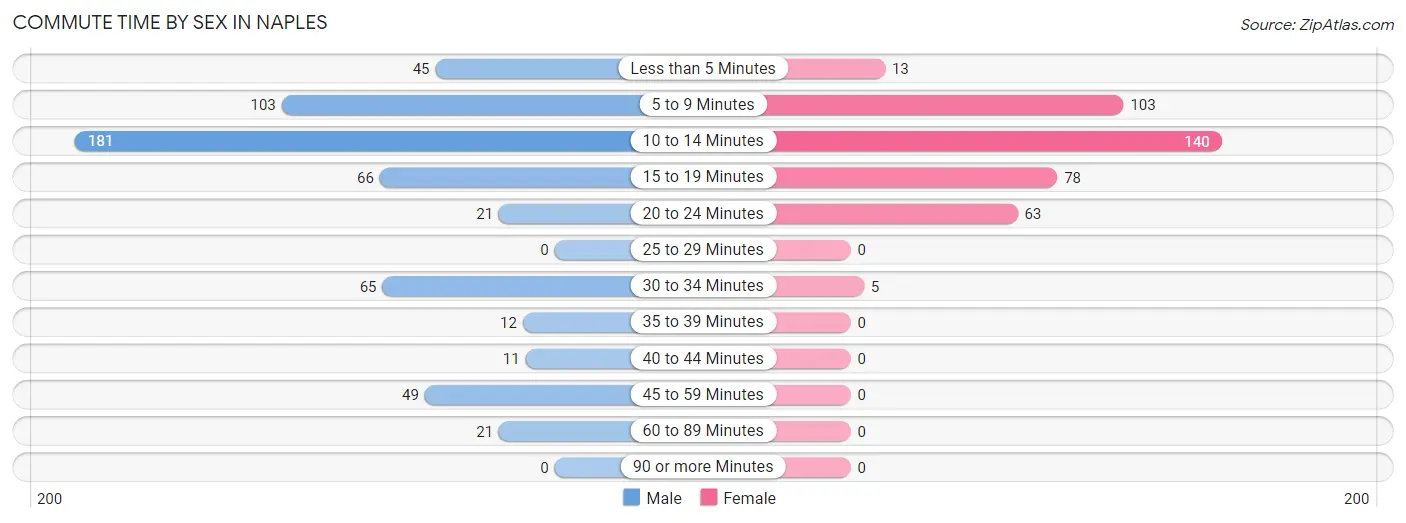
| Commute Time | Male | Female |
| Less than 5 Minutes | 45 (7.8%) | 13 (3.2%) |
| 5 to 9 Minutes | 103 (17.9%) | 103 (25.6%) |
| 10 to 14 Minutes | 181 (31.5%) | 140 (34.8%) |
| 15 to 19 Minutes | 66 (11.5%) | 78 (19.4%) |
| 20 to 24 Minutes | 21 (3.7%) | 63 (15.7%) |
| 25 to 29 Minutes | 0 (0.0%) | 0 (0.0%) |
| 30 to 34 Minutes | 65 (11.3%) | 5 (1.2%) |
| 35 to 39 Minutes | 12 (2.1%) | 0 (0.0%) |
| 40 to 44 Minutes | 11 (1.9%) | 0 (0.0%) |
| 45 to 59 Minutes | 49 (8.5%) | 0 (0.0%) |
| 60 to 89 Minutes | 21 (3.7%) | 0 (0.0%) |
| 90 or more Minutes | 0 (0.0%) | 0 (0.0%) |
Time of Departure to Work by Sex in Naples
The most frequent times of departure to work in Naples are 7:30 AM to 7:59 AM (107, 18.6%) for males and 7:00 AM to 7:29 AM (71, 17.7%) for females.
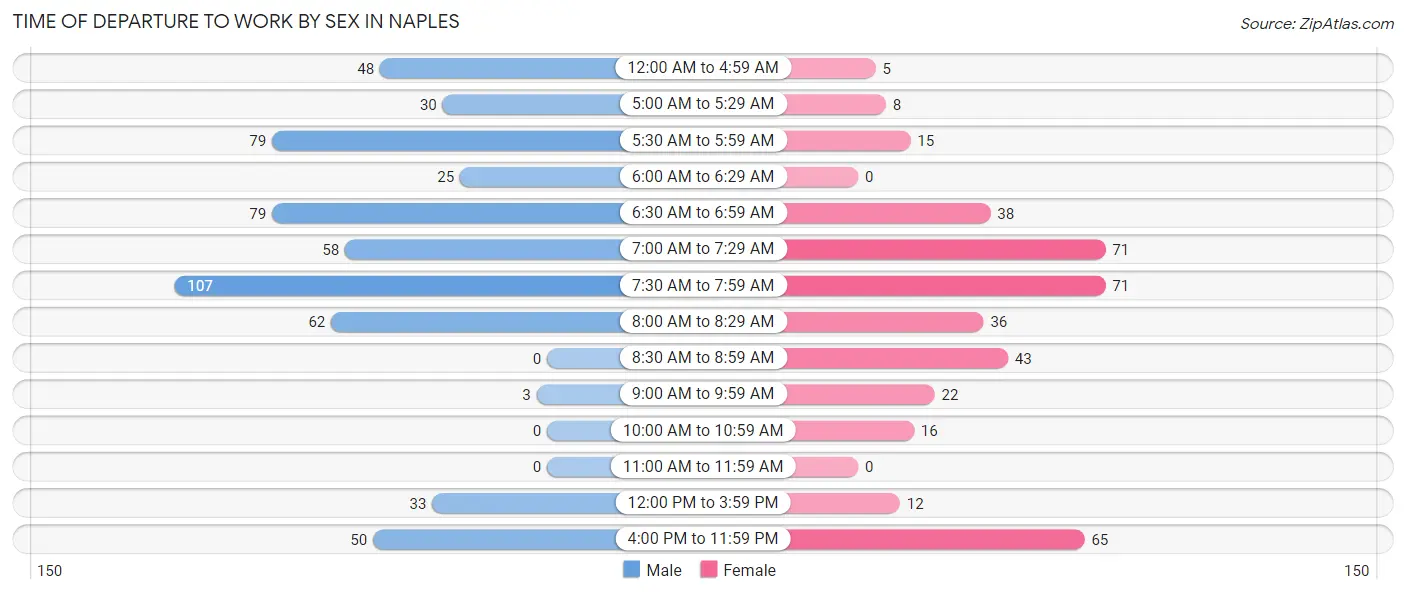
| Time of Departure | Male | Female |
| 12:00 AM to 4:59 AM | 48 (8.4%) | 5 (1.2%) |
| 5:00 AM to 5:29 AM | 30 (5.2%) | 8 (2.0%) |
| 5:30 AM to 5:59 AM | 79 (13.8%) | 15 (3.7%) |
| 6:00 AM to 6:29 AM | 25 (4.4%) | 0 (0.0%) |
| 6:30 AM to 6:59 AM | 79 (13.8%) | 38 (9.5%) |
| 7:00 AM to 7:29 AM | 58 (10.1%) | 71 (17.7%) |
| 7:30 AM to 7:59 AM | 107 (18.6%) | 71 (17.7%) |
| 8:00 AM to 8:29 AM | 62 (10.8%) | 36 (9.0%) |
| 8:30 AM to 8:59 AM | 0 (0.0%) | 43 (10.7%) |
| 9:00 AM to 9:59 AM | 3 (0.5%) | 22 (5.5%) |
| 10:00 AM to 10:59 AM | 0 (0.0%) | 16 (4.0%) |
| 11:00 AM to 11:59 AM | 0 (0.0%) | 0 (0.0%) |
| 12:00 PM to 3:59 PM | 33 (5.8%) | 12 (3.0%) |
| 4:00 PM to 11:59 PM | 50 (8.7%) | 65 (16.2%) |
| Total | 574 (100.0%) | 402 (100.0%) |
Housing Occupancy in Naples
Occupancy by Ownership in Naples
Of the total 862 dwellings in Naples, owner-occupied units account for 770 (89.3%), while renter-occupied units make up 92 (10.7%).
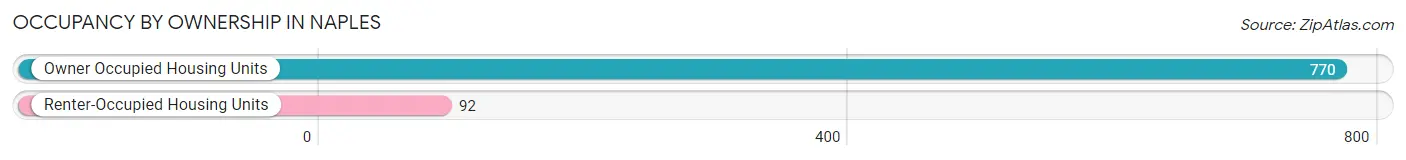
| Occupancy | # Housing Units | % Housing Units |
| Owner Occupied Housing Units | 770 | 89.3% |
| Renter-Occupied Housing Units | 92 | 10.7% |
| Total Occupied Housing Units | 862 | 100.0% |
Occupancy by Household Size in Naples
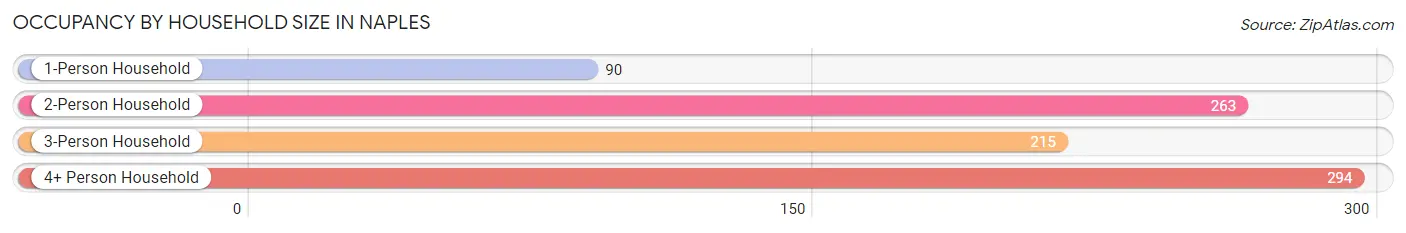
| Household Size | # Housing Units | % Housing Units |
| 1-Person Household | 90 | 10.4% |
| 2-Person Household | 263 | 30.5% |
| 3-Person Household | 215 | 24.9% |
| 4+ Person Household | 294 | 34.1% |
| Total Housing Units | 862 | 100.0% |
Occupancy by Ownership by Household Size in Naples
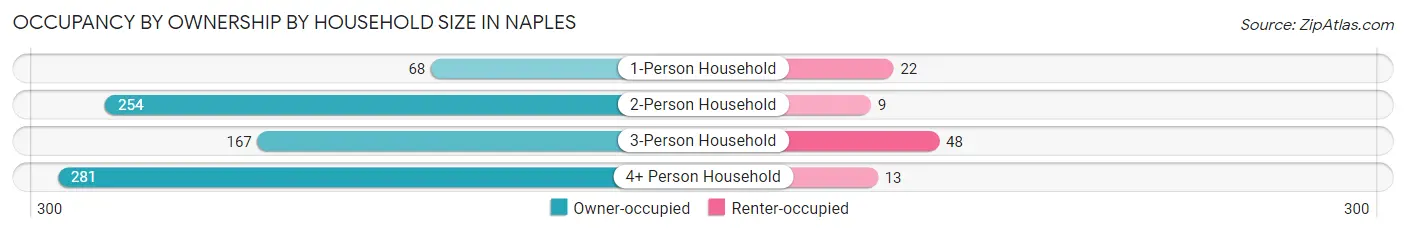
| Household Size | Owner-occupied | Renter-occupied |
| 1-Person Household | 68 (75.6%) | 22 (24.4%) |
| 2-Person Household | 254 (96.6%) | 9 (3.4%) |
| 3-Person Household | 167 (77.7%) | 48 (22.3%) |
| 4+ Person Household | 281 (95.6%) | 13 (4.4%) |
| Total Housing Units | 770 (89.3%) | 92 (10.7%) |
Occupancy by Educational Attainment in Naples
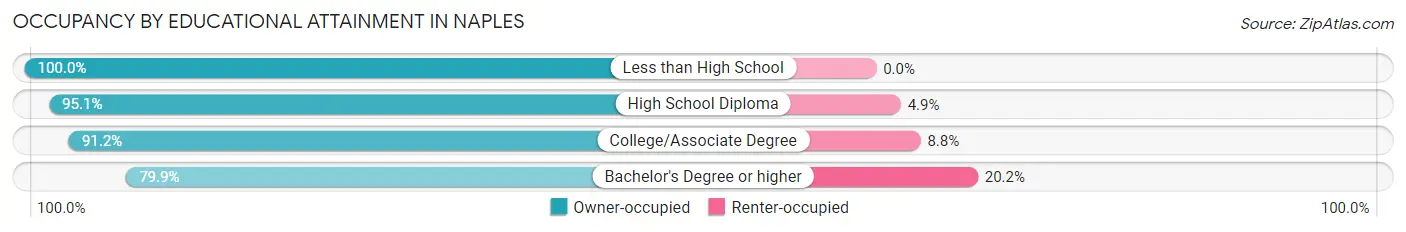
| Household Size | Owner-occupied | Renter-occupied |
| Less than High School | 45 (100.0%) | 0 (0.0%) |
| High School Diploma | 235 (95.1%) | 12 (4.9%) |
| College/Associate Degree | 280 (91.2%) | 27 (8.8%) |
| Bachelor's Degree or higher | 210 (79.8%) | 53 (20.2%) |
Occupancy by Age of Householder in Naples
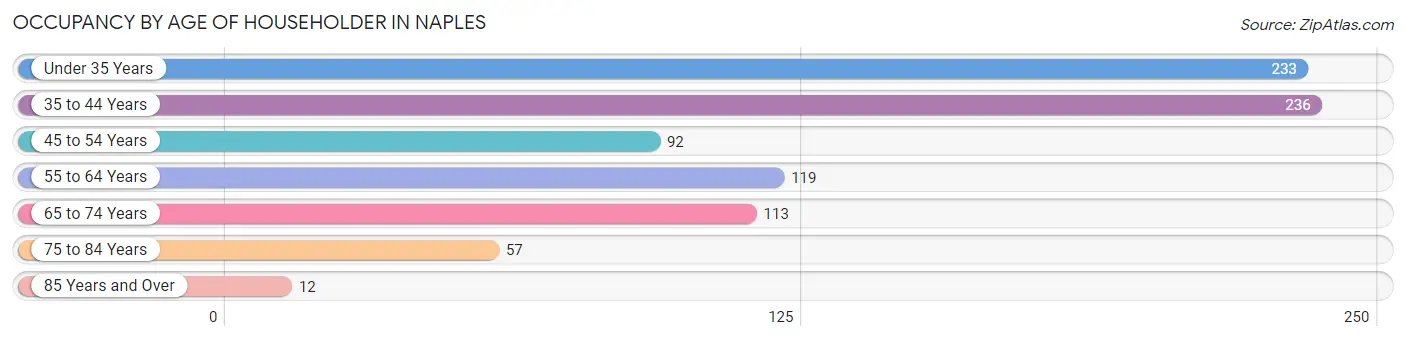
| Age Bracket | # Households | % Households |
| Under 35 Years | 233 | 27.0% |
| 35 to 44 Years | 236 | 27.4% |
| 45 to 54 Years | 92 | 10.7% |
| 55 to 64 Years | 119 | 13.8% |
| 65 to 74 Years | 113 | 13.1% |
| 75 to 84 Years | 57 | 6.6% |
| 85 Years and Over | 12 | 1.4% |
| Total | 862 | 100.0% |
Housing Finances in Naples
Median Income by Occupancy in Naples
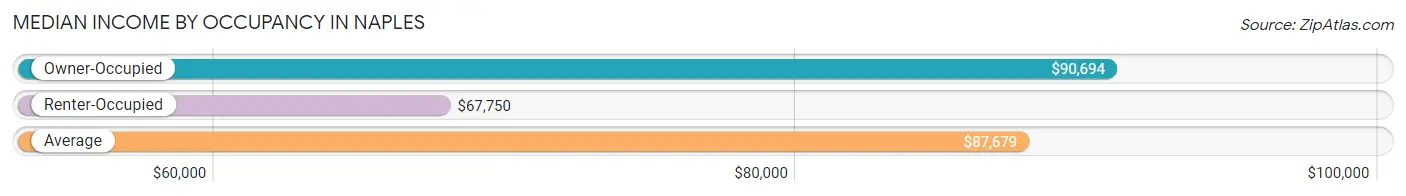
| Occupancy Type | # Households | Median Income |
| Owner-Occupied | 770 (89.3%) | $90,694 |
| Renter-Occupied | 92 (10.7%) | $67,750 |
| Average | 862 (100.0%) | $87,679 |
Occupancy by Householder Income Bracket in Naples
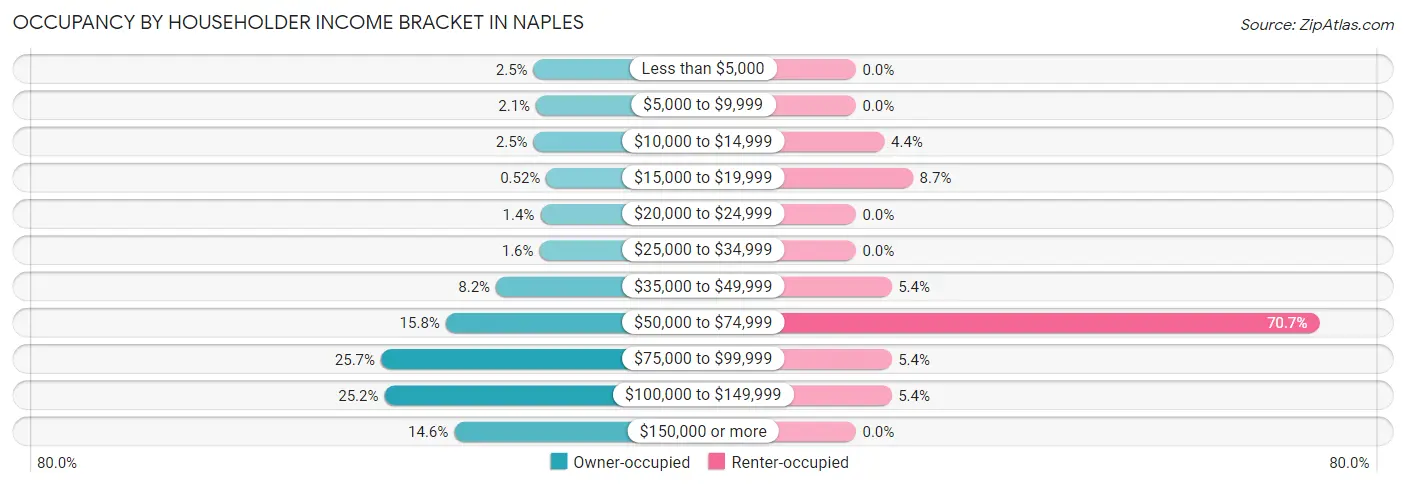
| Income Bracket | Owner-occupied | Renter-occupied |
| Less than $5,000 | 19 (2.5%) | 0 (0.0%) |
| $5,000 to $9,999 | 16 (2.1%) | 0 (0.0%) |
| $10,000 to $14,999 | 19 (2.5%) | 4 (4.3%) |
| $15,000 to $19,999 | 4 (0.5%) | 8 (8.7%) |
| $20,000 to $24,999 | 11 (1.4%) | 0 (0.0%) |
| $25,000 to $34,999 | 12 (1.6%) | 0 (0.0%) |
| $35,000 to $49,999 | 63 (8.2%) | 5 (5.4%) |
| $50,000 to $74,999 | 122 (15.8%) | 65 (70.7%) |
| $75,000 to $99,999 | 198 (25.7%) | 5 (5.4%) |
| $100,000 to $149,999 | 194 (25.2%) | 5 (5.4%) |
| $150,000 or more | 112 (14.5%) | 0 (0.0%) |
| Total | 770 (100.0%) | 92 (100.0%) |
Monthly Housing Cost Tiers in Naples
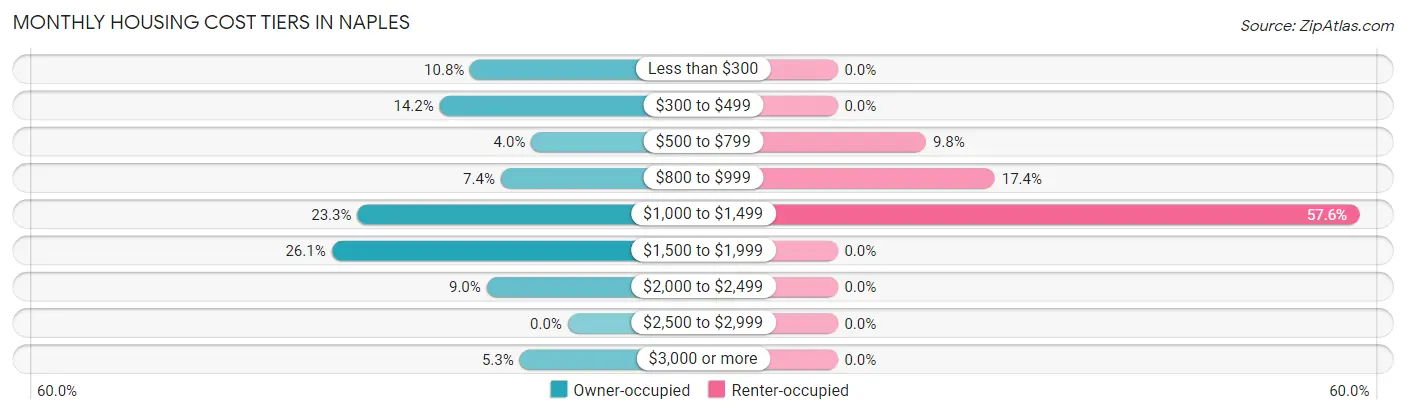
| Monthly Cost | Owner-occupied | Renter-occupied |
| Less than $300 | 83 (10.8%) | 0 (0.0%) |
| $300 to $499 | 109 (14.2%) | 0 (0.0%) |
| $500 to $799 | 31 (4.0%) | 9 (9.8%) |
| $800 to $999 | 57 (7.4%) | 16 (17.4%) |
| $1,000 to $1,499 | 179 (23.3%) | 53 (57.6%) |
| $1,500 to $1,999 | 201 (26.1%) | 0 (0.0%) |
| $2,000 to $2,499 | 69 (9.0%) | 0 (0.0%) |
| $2,500 to $2,999 | 0 (0.0%) | 0 (0.0%) |
| $3,000 or more | 41 (5.3%) | 0 (0.0%) |
| Total | 770 (100.0%) | 92 (100.0%) |
Physical Housing Characteristics in Naples
Housing Structures in Naples
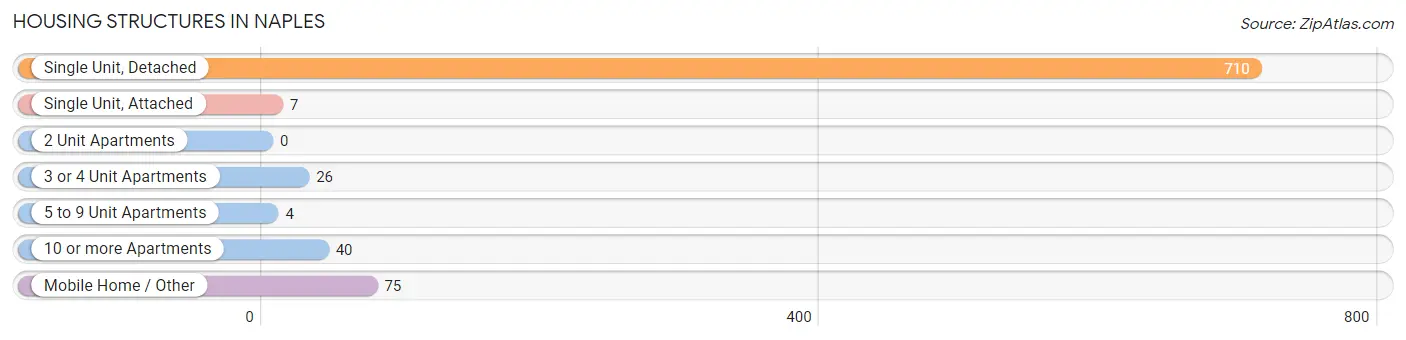
| Structure Type | # Housing Units | % Housing Units |
| Single Unit, Detached | 710 | 82.4% |
| Single Unit, Attached | 7 | 0.8% |
| 2 Unit Apartments | 0 | 0.0% |
| 3 or 4 Unit Apartments | 26 | 3.0% |
| 5 to 9 Unit Apartments | 4 | 0.5% |
| 10 or more Apartments | 40 | 4.6% |
| Mobile Home / Other | 75 | 8.7% |
| Total | 862 | 100.0% |
Housing Structures by Occupancy in Naples
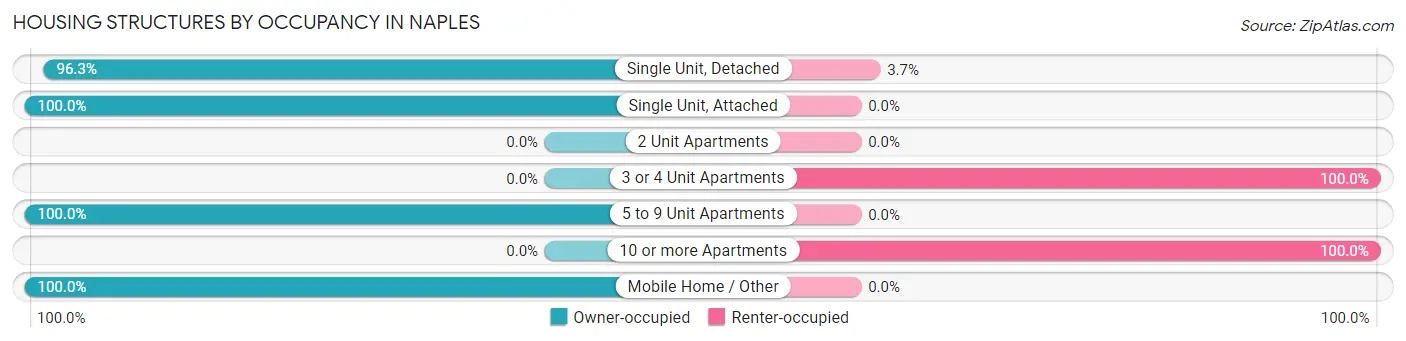
| Structure Type | Owner-occupied | Renter-occupied |
| Single Unit, Detached | 684 (96.3%) | 26 (3.7%) |
| Single Unit, Attached | 7 (100.0%) | 0 (0.0%) |
| 2 Unit Apartments | 0 (0.0%) | 0 (0.0%) |
| 3 or 4 Unit Apartments | 0 (0.0%) | 26 (100.0%) |
| 5 to 9 Unit Apartments | 4 (100.0%) | 0 (0.0%) |
| 10 or more Apartments | 0 (0.0%) | 40 (100.0%) |
| Mobile Home / Other | 75 (100.0%) | 0 (0.0%) |
| Total | 770 (89.3%) | 92 (10.7%) |
Housing Structures by Number of Rooms in Naples
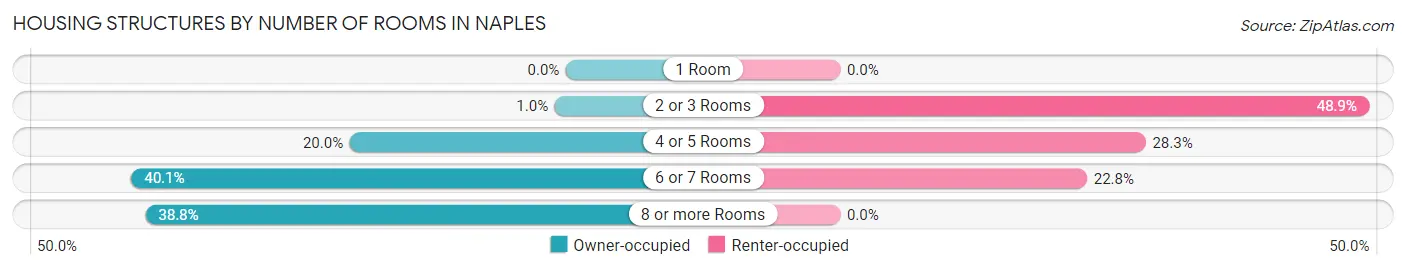
| Number of Rooms | Owner-occupied | Renter-occupied |
| 1 Room | 0 (0.0%) | 0 (0.0%) |
| 2 or 3 Rooms | 8 (1.0%) | 45 (48.9%) |
| 4 or 5 Rooms | 154 (20.0%) | 26 (28.3%) |
| 6 or 7 Rooms | 309 (40.1%) | 21 (22.8%) |
| 8 or more Rooms | 299 (38.8%) | 0 (0.0%) |
| Total | 770 (100.0%) | 92 (100.0%) |
Housing Structure by Heating Type in Naples
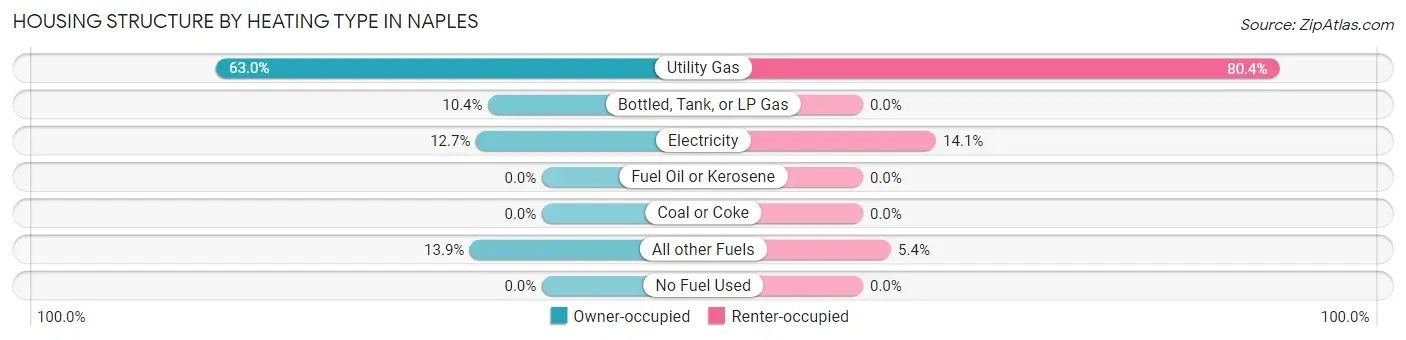
| Heating Type | Owner-occupied | Renter-occupied |
| Utility Gas | 485 (63.0%) | 74 (80.4%) |
| Bottled, Tank, or LP Gas | 80 (10.4%) | 0 (0.0%) |
| Electricity | 98 (12.7%) | 13 (14.1%) |
| Fuel Oil or Kerosene | 0 (0.0%) | 0 (0.0%) |
| Coal or Coke | 0 (0.0%) | 0 (0.0%) |
| All other Fuels | 107 (13.9%) | 5 (5.4%) |
| No Fuel Used | 0 (0.0%) | 0 (0.0%) |
| Total | 770 (100.0%) | 92 (100.0%) |
Household Vehicle Usage in Naples
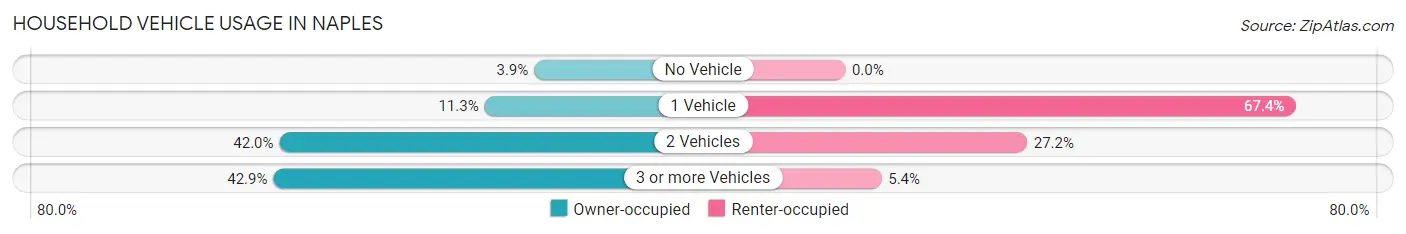
| Vehicles per Household | Owner-occupied | Renter-occupied |
| No Vehicle | 30 (3.9%) | 0 (0.0%) |
| 1 Vehicle | 87 (11.3%) | 62 (67.4%) |
| 2 Vehicles | 323 (41.9%) | 25 (27.2%) |
| 3 or more Vehicles | 330 (42.9%) | 5 (5.4%) |
| Total | 770 (100.0%) | 92 (100.0%) |
Real Estate & Mortgages in Naples
Real Estate and Mortgage Overview in Naples
| Characteristic | Without Mortgage | With Mortgage |
| Housing Units | 216 | 554 |
| Median Property Value | $238,300 | $277,200 |
| Median Household Income | $76,474 | $89 |
| Monthly Housing Costs | $357 | $36 |
| Real Estate Taxes | $1,212 | $45 |
Property Value by Mortgage Status in Naples
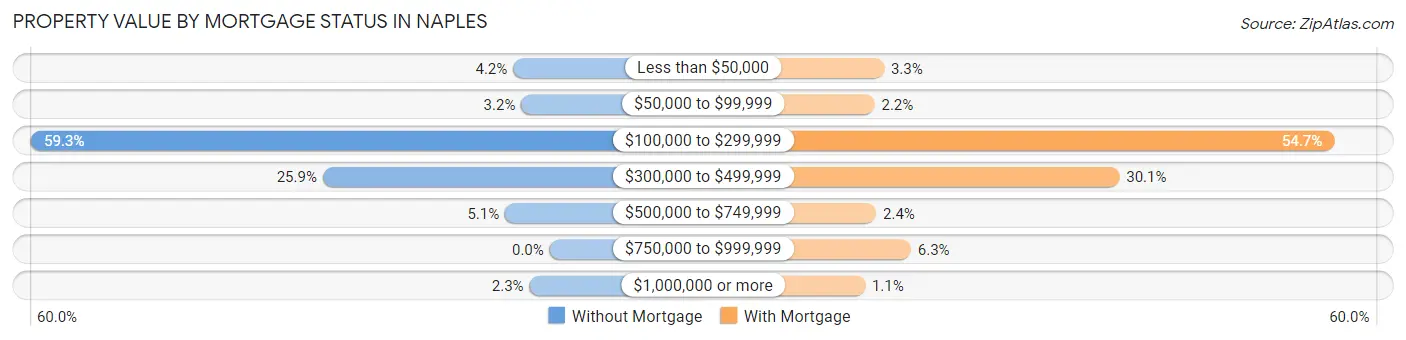
| Property Value | Without Mortgage | With Mortgage |
| Less than $50,000 | 9 (4.2%) | 18 (3.3%) |
| $50,000 to $99,999 | 7 (3.2%) | 12 (2.2%) |
| $100,000 to $299,999 | 128 (59.3%) | 303 (54.7%) |
| $300,000 to $499,999 | 56 (25.9%) | 167 (30.1%) |
| $500,000 to $749,999 | 11 (5.1%) | 13 (2.4%) |
| $750,000 to $999,999 | 0 (0.0%) | 35 (6.3%) |
| $1,000,000 or more | 5 (2.3%) | 6 (1.1%) |
| Total | 216 (100.0%) | 554 (100.0%) |
Household Income by Mortgage Status in Naples
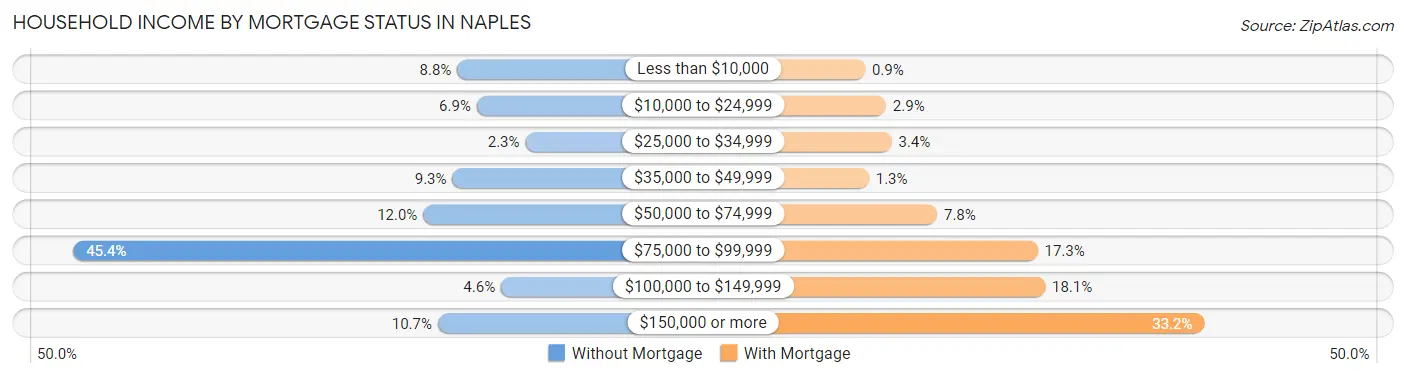
| Household Income | Without Mortgage | With Mortgage |
| Less than $10,000 | 19 (8.8%) | 5 (0.9%) |
| $10,000 to $24,999 | 15 (6.9%) | 16 (2.9%) |
| $25,000 to $34,999 | 5 (2.3%) | 19 (3.4%) |
| $35,000 to $49,999 | 20 (9.3%) | 7 (1.3%) |
| $50,000 to $74,999 | 26 (12.0%) | 43 (7.8%) |
| $75,000 to $99,999 | 98 (45.4%) | 96 (17.3%) |
| $100,000 to $149,999 | 10 (4.6%) | 100 (18.0%) |
| $150,000 or more | 23 (10.6%) | 184 (33.2%) |
| Total | 216 (100.0%) | 554 (100.0%) |
Property Value to Household Income Ratio in Naples
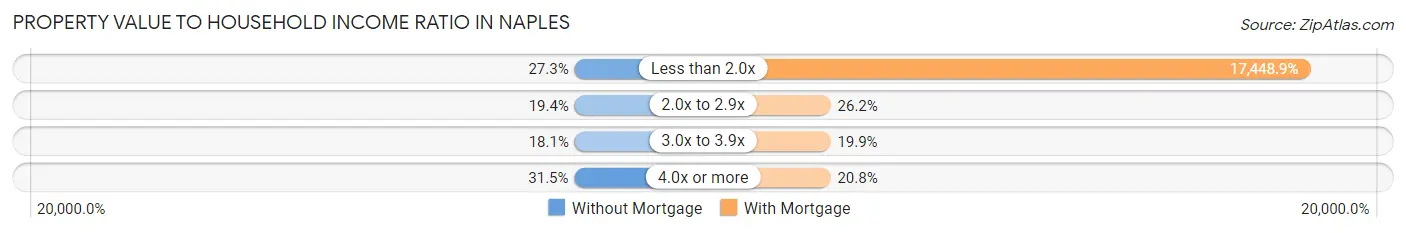
| Value-to-Income Ratio | Without Mortgage | With Mortgage |
| Less than 2.0x | 59 (27.3%) | 96,667 (17,448.9%) |
| 2.0x to 2.9x | 42 (19.4%) | 145 (26.2%) |
| 3.0x to 3.9x | 39 (18.1%) | 110 (19.9%) |
| 4.0x or more | 68 (31.5%) | 115 (20.8%) |
| Total | 216 (100.0%) | 554 (100.0%) |
Real Estate Taxes by Mortgage Status in Naples
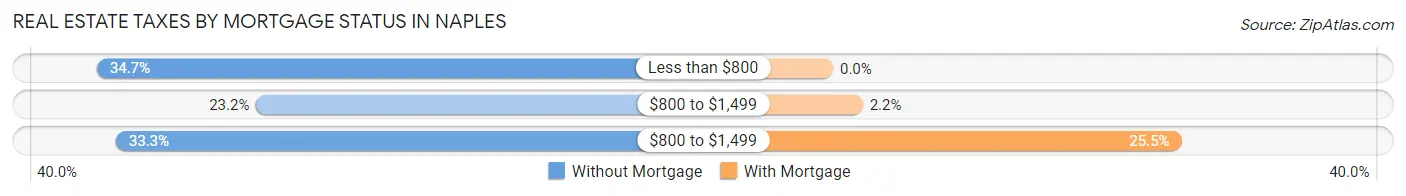
| Property Taxes | Without Mortgage | With Mortgage |
| Less than $800 | 75 (34.7%) | 0 (0.0%) |
| $800 to $1,499 | 50 (23.2%) | 12 (2.2%) |
| $800 to $1,499 | 72 (33.3%) | 141 (25.5%) |
| Total | 216 (100.0%) | 554 (100.0%) |
Health & Disability in Naples
Health Insurance Coverage by Age in Naples
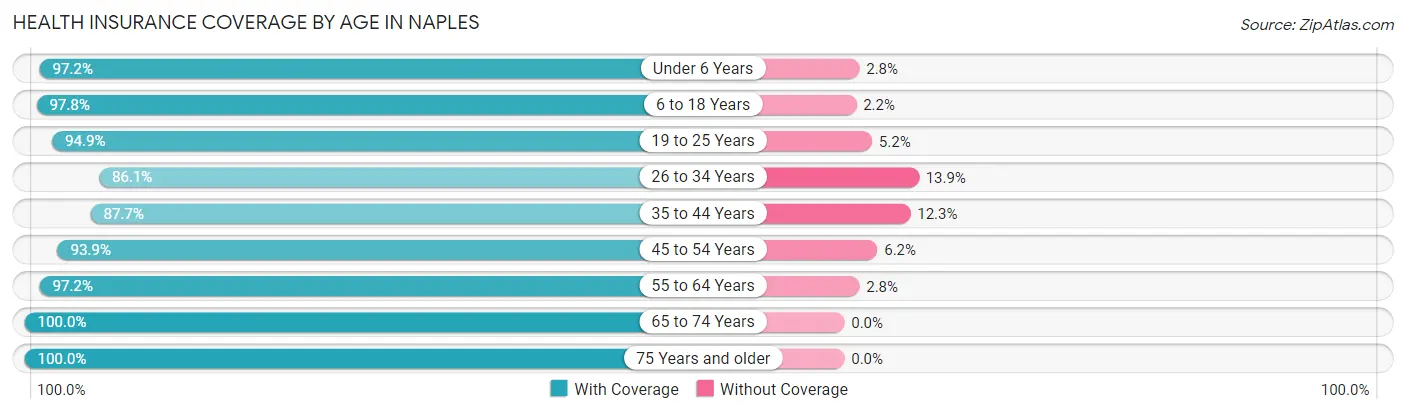
| Age Bracket | With Coverage | Without Coverage |
| Under 6 Years | 314 (97.2%) | 9 (2.8%) |
| 6 to 18 Years | 705 (97.8%) | 16 (2.2%) |
| 19 to 25 Years | 92 (94.9%) | 5 (5.1%) |
| 26 to 34 Years | 385 (86.1%) | 62 (13.9%) |
| 35 to 44 Years | 406 (87.7%) | 57 (12.3%) |
| 45 to 54 Years | 183 (93.9%) | 12 (6.1%) |
| 55 to 64 Years | 208 (97.2%) | 6 (2.8%) |
| 65 to 74 Years | 178 (100.0%) | 0 (0.0%) |
| 75 Years and older | 160 (100.0%) | 0 (0.0%) |
| Total | 2,631 (94.0%) | 167 (6.0%) |
Health Insurance Coverage by Citizenship Status in Naples
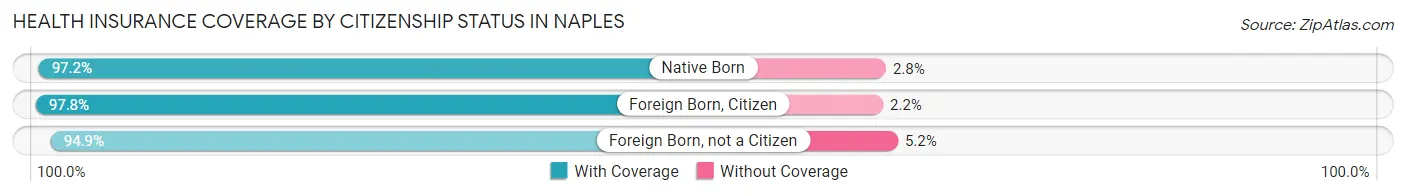
| Citizenship Status | With Coverage | Without Coverage |
| Native Born | 314 (97.2%) | 9 (2.8%) |
| Foreign Born, Citizen | 705 (97.8%) | 16 (2.2%) |
| Foreign Born, not a Citizen | 92 (94.9%) | 5 (5.1%) |
Health Insurance Coverage by Household Income in Naples
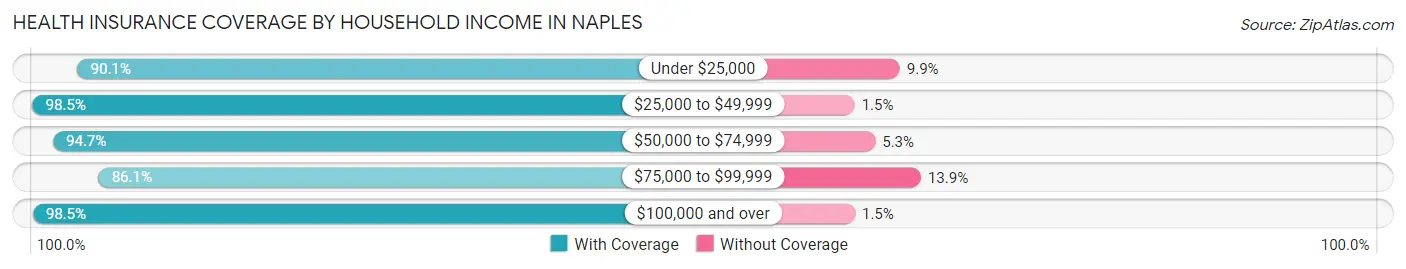
| Household Income | With Coverage | Without Coverage |
| Under $25,000 | 145 (90.1%) | 16 (9.9%) |
| $25,000 to $49,999 | 198 (98.5%) | 3 (1.5%) |
| $50,000 to $74,999 | 603 (94.7%) | 34 (5.3%) |
| $75,000 to $99,999 | 601 (86.1%) | 97 (13.9%) |
| $100,000 and over | 1,084 (98.5%) | 17 (1.5%) |
Public vs Private Health Insurance Coverage by Age in Naples
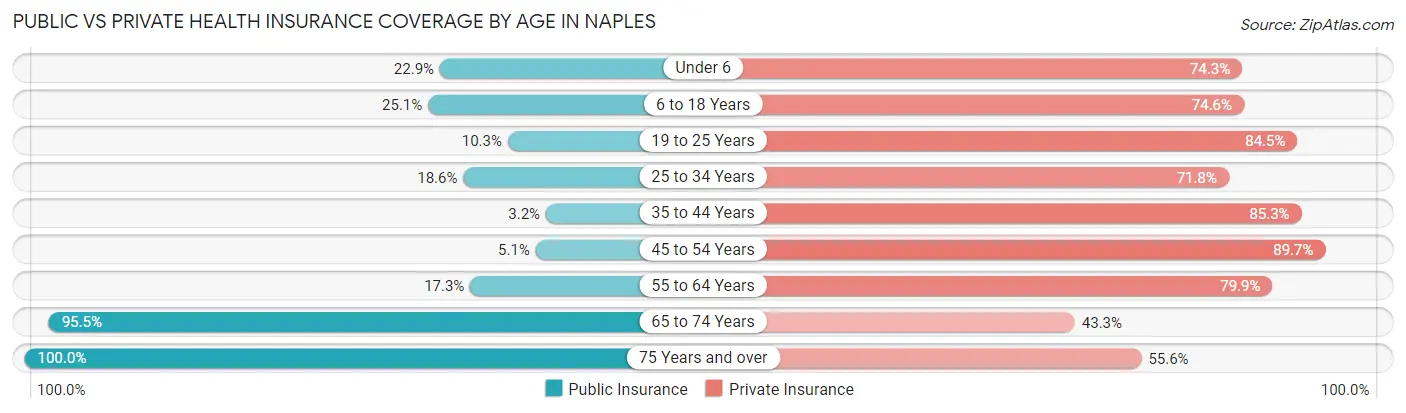
| Age Bracket | Public Insurance | Private Insurance |
| Under 6 | 74 (22.9%) | 240 (74.3%) |
| 6 to 18 Years | 181 (25.1%) | 538 (74.6%) |
| 19 to 25 Years | 10 (10.3%) | 82 (84.5%) |
| 25 to 34 Years | 83 (18.6%) | 321 (71.8%) |
| 35 to 44 Years | 15 (3.2%) | 395 (85.3%) |
| 45 to 54 Years | 10 (5.1%) | 175 (89.7%) |
| 55 to 64 Years | 37 (17.3%) | 171 (79.9%) |
| 65 to 74 Years | 170 (95.5%) | 77 (43.3%) |
| 75 Years and over | 160 (100.0%) | 89 (55.6%) |
| Total | 740 (26.5%) | 2,088 (74.6%) |
Disability Status by Sex by Age in Naples
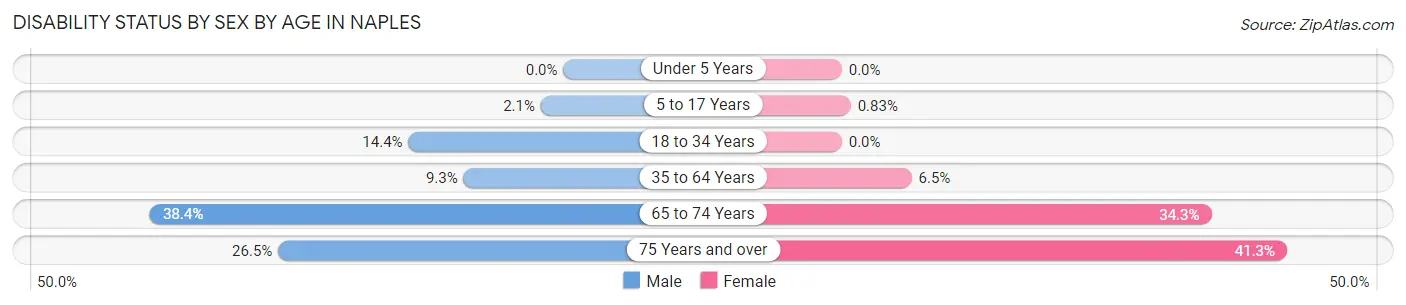
| Age Bracket | Male | Female |
| Under 5 Years | 0 (0.0%) | 0 (0.0%) |
| 5 to 17 Years | 7 (2.1%) | 3 (0.8%) |
| 18 to 34 Years | 42 (14.4%) | 0 (0.0%) |
| 35 to 64 Years | 45 (9.3%) | 25 (6.5%) |
| 65 to 74 Years | 28 (38.4%) | 36 (34.3%) |
| 75 Years and over | 18 (26.5%) | 38 (41.3%) |
Disability Class by Sex by Age in Naples
Disability Class: Hearing Difficulty
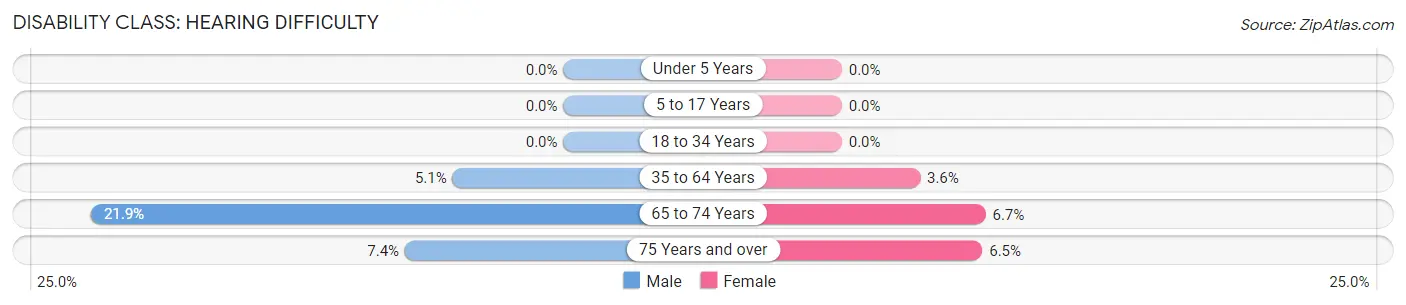
| Age Bracket | Male | Female |
| Under 5 Years | 0 (0.0%) | 0 (0.0%) |
| 5 to 17 Years | 0 (0.0%) | 0 (0.0%) |
| 18 to 34 Years | 0 (0.0%) | 0 (0.0%) |
| 35 to 64 Years | 25 (5.1%) | 14 (3.6%) |
| 65 to 74 Years | 16 (21.9%) | 7 (6.7%) |
| 75 Years and over | 5 (7.3%) | 6 (6.5%) |
Disability Class: Vision Difficulty
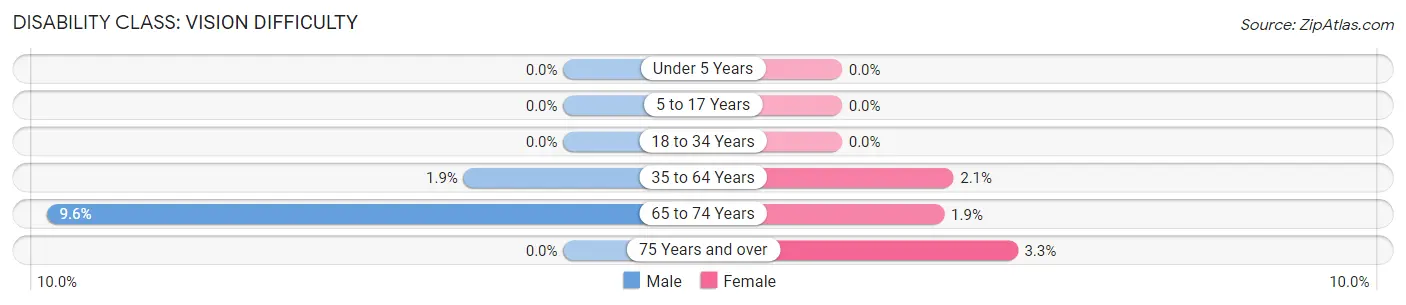
| Age Bracket | Male | Female |
| Under 5 Years | 0 (0.0%) | 0 (0.0%) |
| 5 to 17 Years | 0 (0.0%) | 0 (0.0%) |
| 18 to 34 Years | 0 (0.0%) | 0 (0.0%) |
| 35 to 64 Years | 9 (1.8%) | 8 (2.1%) |
| 65 to 74 Years | 7 (9.6%) | 2 (1.9%) |
| 75 Years and over | 0 (0.0%) | 3 (3.3%) |
Disability Class: Cognitive Difficulty
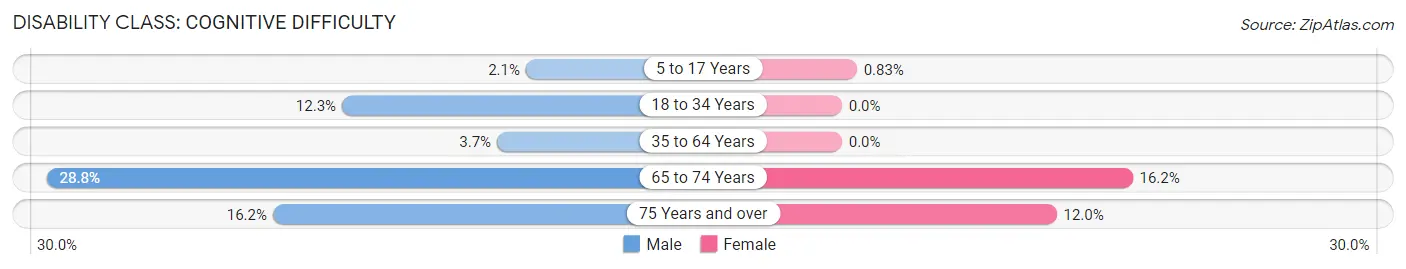
| Age Bracket | Male | Female |
| 5 to 17 Years | 7 (2.1%) | 3 (0.8%) |
| 18 to 34 Years | 36 (12.3%) | 0 (0.0%) |
| 35 to 64 Years | 18 (3.7%) | 0 (0.0%) |
| 65 to 74 Years | 21 (28.8%) | 17 (16.2%) |
| 75 Years and over | 11 (16.2%) | 11 (12.0%) |
Disability Class: Ambulatory Difficulty
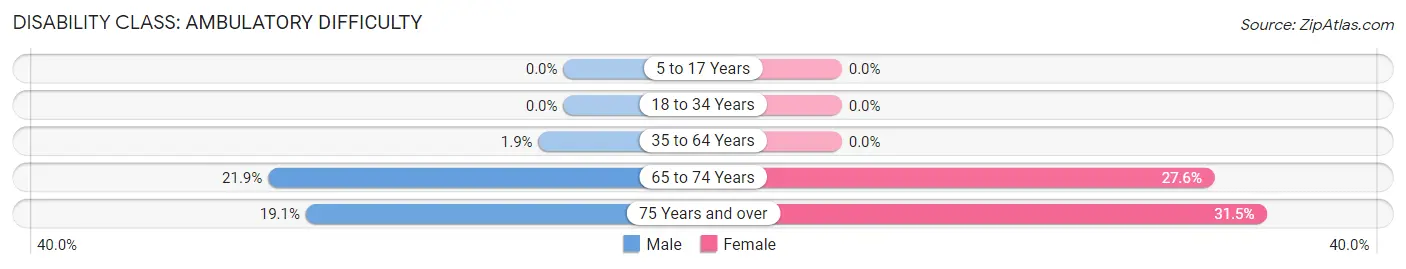
| Age Bracket | Male | Female |
| 5 to 17 Years | 0 (0.0%) | 0 (0.0%) |
| 18 to 34 Years | 0 (0.0%) | 0 (0.0%) |
| 35 to 64 Years | 9 (1.8%) | 0 (0.0%) |
| 65 to 74 Years | 16 (21.9%) | 29 (27.6%) |
| 75 Years and over | 13 (19.1%) | 29 (31.5%) |
Disability Class: Self-Care Difficulty
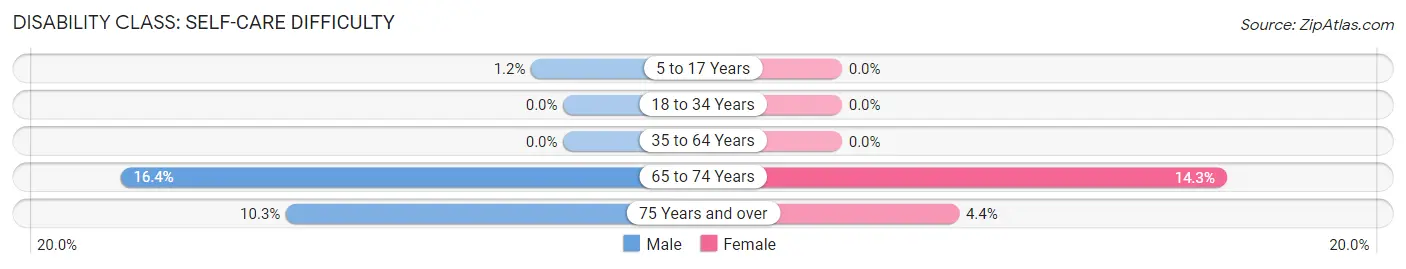
| Age Bracket | Male | Female |
| 5 to 17 Years | 4 (1.2%) | 0 (0.0%) |
| 18 to 34 Years | 0 (0.0%) | 0 (0.0%) |
| 35 to 64 Years | 0 (0.0%) | 0 (0.0%) |
| 65 to 74 Years | 12 (16.4%) | 15 (14.3%) |
| 75 Years and over | 7 (10.3%) | 4 (4.3%) |
Technology Access in Naples
Computing Device Access in Naples
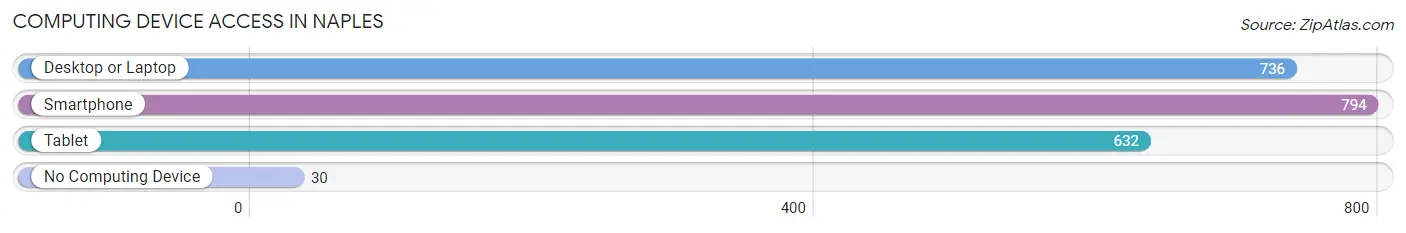
| Device Type | # Households | % Households |
| Desktop or Laptop | 736 | 85.4% |
| Smartphone | 794 | 92.1% |
| Tablet | 632 | 73.3% |
| No Computing Device | 30 | 3.5% |
| Total | 862 | 100.0% |
Internet Access in Naples
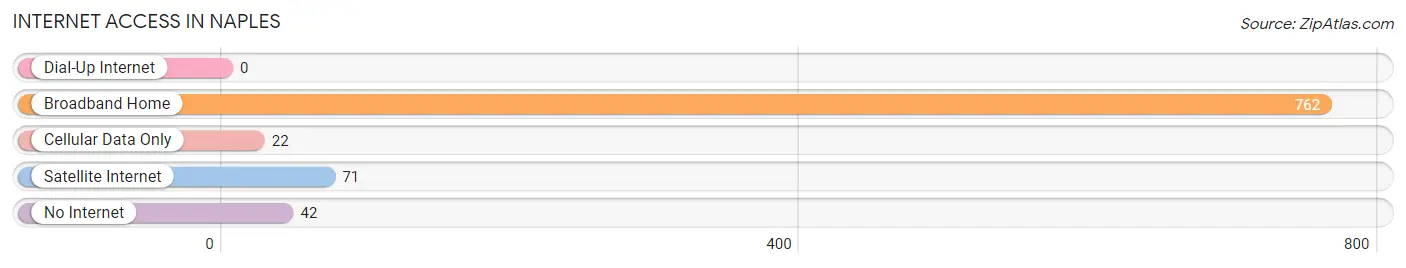
| Internet Type | # Households | % Households |
| Dial-Up Internet | 0 | 0.0% |
| Broadband Home | 762 | 88.4% |
| Cellular Data Only | 22 | 2.5% |
| Satellite Internet | 71 | 8.2% |
| No Internet | 42 | 4.9% |
| Total | 862 | 100.0% |
Naples Summary
Naples is a small town located in Rich County, Utah, United States. It is situated in the southeastern corner of the state, near the border with Wyoming. The population was estimated to be just over 200 people in 2020.
History
The area that is now Naples was first settled in the late 1800s by Mormon pioneers. The town was originally known as "Little Valley" and was later renamed Naples in honor of the Italian city. The town was incorporated in 1891 and has remained a small, rural community ever since.
Geography
Naples is located in the southeastern corner of Rich County, Utah, near the border with Wyoming. It is situated in the Bear River Valley, at an elevation of 5,890 feet (1,795 m). The town is surrounded by mountains, including the Bear River Range to the east and the Uinta Mountains to the west.
The climate in Naples is semi-arid, with hot summers and cold winters. The average annual temperature is around 45°F (7°C). The average annual precipitation is around 12 inches (30 cm).
Economy
The economy of Naples is largely based on agriculture and tourism. The town is home to several farms, which produce hay, wheat, and other crops. Tourism is also an important part of the local economy, with visitors coming to the area to enjoy the scenic beauty and outdoor activities.
Demographics
As of the 2020 census, the population of Naples was estimated to be just over 200 people. The racial makeup of the town was 97.5% White, 0.5% Native American, 0.5% Asian, and 1.5% from other races. The median household income was $41,250, and the median home value was $127,500.
Naples is a small, rural community with a rich history and a strong sense of community. The town is home to a variety of businesses, farms, and outdoor activities, making it a great place to live and visit.
Common Questions
What is the Total Population of Naples?
Total Population of Naples is 2,801.
What is the Total Male Population of Naples?
Total Male Population of Naples is 1,374.
What is the Total Female Population of Naples?
Total Female Population of Naples is 1,427.
What is the Ratio of Males per 100 Females in Naples?
There are 96.29 Males per 100 Females in Naples.
What is the Ratio of Females per 100 Males in Naples?
There are 103.86 Females per 100 Males in Naples.
What is the Median Population Age in Naples?
Median Population Age in Naples is 32.4 Years.
What is the Average Family Size in Naples
Average Family Size in Naples is 3.6 People.
What is the Average Household Size in Naples
Average Household Size in Naples is 3.2 People.
What is Per Capita Income in Naples?
Per Capita income in Naples is $26,786.
What is the Median Family Income in Naples?
Median Family Income in Naples is $90,098.
What is the Median Household income in Naples?
Median Household Income in Naples is $87,679.
What is Income or Wage Gap in Naples?
Income or Wage Gap in Naples is 52.0%.
Women in Naples earn 48.0 cents for every dollar earned by a man.
What is Family Income Deficit in Naples?
Family Income Deficit in Naples is $11,483.
Families that are below poverty line in Naples earn $11,483 less on average than the poverty threshold level.
What is Inequality or Gini Index in Naples?
Inequality or Gini Index in Naples is 0.30.
How Large is the Labor Force in Naples?
There are 1,082 People in the Labor Forcein in Naples.
What is the Percentage of People in the Labor Force in Naples?
57.3% of People are in the Labor Force in Naples.
What is the Unemployment Rate in Naples?
Unemployment Rate in Naples is 2.2%.