Cities with the Lowest Unemployment Rate Amomg Seniors Over the Age of 65 in Arkansas
RELATED REPORTS & OPTIONS
Lowest Unemployment | Senior > 65
Arkansas
Compare Cities
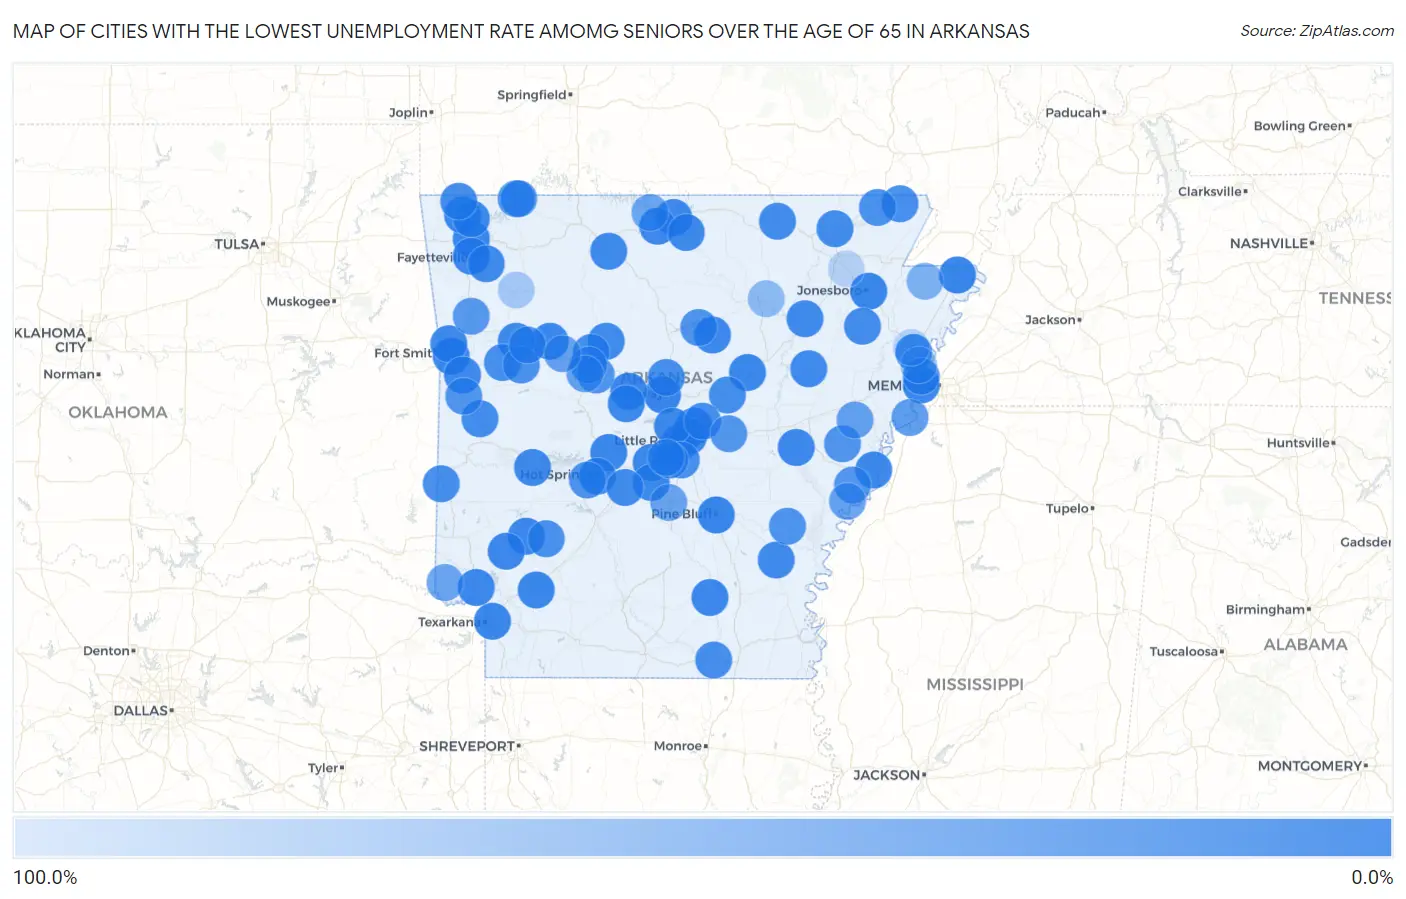
Map of Cities with the Lowest Unemployment Rate Amomg Seniors Over the Age of 65 in Arkansas
100.0%
0.0%
Cities with the Lowest Unemployment Rate Amomg Seniors Over the Age of 65 in Arkansas
| City | Senior Unemployment | vs State | vs National | |
| 1. | Pine Bluff | 0.40% | 2.7%(-2.30)#1 | 3.9%(-3.50)#32 |
| 2. | Blytheville | 0.70% | 2.7%(-2.00)#2 | 3.9%(-3.20)#126 |
| 3. | Conway | 0.90% | 2.7%(-1.80)#3 | 3.9%(-3.00)#156 |
| 4. | Sherwood | 1.5% | 2.7%(-1.20)#4 | 3.9%(-2.40)#453 |
| 5. | Hot Springs Village | 1.6% | 2.7%(-1.10)#5 | 3.9%(-2.30)#519 |
| 6. | Benton | 1.7% | 2.7%(-1.00)#6 | 3.9%(-2.20)#562 |
| 7. | Searcy | 1.8% | 2.7%(-0.900)#7 | 3.9%(-2.10)#636 |
| 8. | Little Rock | 1.9% | 2.7%(-0.800)#8 | 3.9%(-2.00)#672 |
| 9. | Murfreesboro | 2.0% | 2.7%(-0.700)#9 | 3.9%(-1.90)#792 |
| 10. | Clarksville | 2.3% | 2.7%(-0.400)#10 | 3.9%(-1.60)#977 |
| 11. | Oppelo | 2.3% | 2.7%(-0.400)#11 | 3.9%(-1.60)#993 |
| 12. | Springdale | 2.4% | 2.7%(-0.300)#12 | 3.9%(-1.50)#1,004 |
| 13. | Texarkana | 2.4% | 2.7%(-0.300)#13 | 3.9%(-1.50)#1,027 |
| 14. | Hope | 2.5% | 2.7%(-0.200)#14 | 3.9%(-1.40)#1,129 |
| 15. | Jonesboro | 2.6% | 2.7%(-0.100)#15 | 3.9%(-1.30)#1,165 |
| 16. | Bentonville | 2.6% | 2.7%(-0.100)#16 | 3.9%(-1.30)#1,167 |
| 17. | Hot Springs | 2.8% | 2.7%(+0.100)#17 | 3.9%(-1.10)#1,312 |
| 18. | Fayetteville | 3.1% | 2.7%(+0.400)#18 | 3.9%(-0.800)#1,536 |
| 19. | Helena West Helena | 3.1% | 2.7%(+0.400)#19 | 3.9%(-0.800)#1,580 |
| 20. | North Little Rock | 3.2% | 2.7%(+0.500)#20 | 3.9%(-0.700)#1,636 |
| 21. | Mountain Home | 3.3% | 2.7%(+0.600)#21 | 3.9%(-0.600)#1,747 |
| 22. | Fort Smith | 3.5% | 2.7%(+0.800)#22 | 3.9%(-0.400)#1,867 |
| 23. | Nashville | 3.8% | 2.7%(+1.10)#23 | 3.9%(-0.100)#2,129 |
| 24. | West Memphis | 4.1% | 2.7%(+1.40)#24 | 3.9%(+0.200)#2,342 |
| 25. | Cotter | 4.1% | 2.7%(+1.40)#25 | 3.9%(+0.200)#2,385 |
| 26. | Heber Springs | 4.2% | 2.7%(+1.50)#26 | 3.9%(+0.300)#2,438 |
| 27. | Maumelle | 4.3% | 2.7%(+1.60)#27 | 3.9%(+0.400)#2,492 |
| 28. | Ashdown | 4.3% | 2.7%(+1.60)#28 | 3.9%(+0.400)#2,514 |
| 29. | Warren | 4.4% | 2.7%(+1.70)#29 | 3.9%(+0.500)#2,585 |
| 30. | Clarendon | 4.5% | 2.7%(+1.80)#30 | 3.9%(+0.600)#2,684 |
| 31. | Turrell | 4.5% | 2.7%(+1.80)#31 | 3.9%(+0.600)#2,691 |
| 32. | Van Buren | 4.7% | 2.7%(+2.00)#32 | 3.9%(+0.800)#2,800 |
| 33. | Tull | 5.2% | 2.7%(+2.50)#33 | 3.9%(+1.30)#3,152 |
| 34. | Altus | 5.5% | 2.7%(+2.80)#34 | 3.9%(+1.60)#3,317 |
| 35. | Mount Ida | 5.6% | 2.7%(+2.90)#35 | 3.9%(+1.70)#3,378 |
| 36. | Rogers | 5.8% | 2.7%(+3.10)#36 | 3.9%(+1.90)#3,443 |
| 37. | Western Grove | 5.8% | 2.7%(+3.10)#37 | 3.9%(+1.90)#3,482 |
| 38. | Greenwood | 6.0% | 2.7%(+3.30)#38 | 3.9%(+2.10)#3,567 |
| 39. | Salesville | 6.0% | 2.7%(+3.30)#39 | 3.9%(+2.10)#3,590 |
| 40. | Perryville | 6.2% | 2.7%(+3.50)#40 | 3.9%(+2.30)#3,687 |
| 41. | Elkins | 6.5% | 2.7%(+3.80)#41 | 3.9%(+2.60)#3,850 |
| 42. | Mccrory | 7.0% | 2.7%(+4.30)#42 | 3.9%(+3.10)#4,081 |
| 43. | Dumas | 7.2% | 2.7%(+4.50)#43 | 3.9%(+3.30)#4,158 |
| 44. | Hector | 7.6% | 2.7%(+4.90)#44 | 3.9%(+3.70)#4,319 |
| 45. | Newport | 7.7% | 2.7%(+5.00)#45 | 3.9%(+3.80)#4,340 |
| 46. | Beaver | 8.3% | 2.7%(+5.60)#46 | 3.9%(+4.40)#4,583 |
| 47. | Waldron | 8.4% | 2.7%(+5.70)#47 | 3.9%(+4.50)#4,606 |
| 48. | Rockport | 8.6% | 2.7%(+5.90)#48 | 3.9%(+4.70)#4,677 |
| 49. | Harrisburg | 8.9% | 2.7%(+6.20)#49 | 3.9%(+5.00)#4,759 |
| 50. | Hardy | 9.2% | 2.7%(+6.50)#50 | 3.9%(+5.30)#4,873 |
| 51. | Bella Vista | 9.3% | 2.7%(+6.60)#51 | 3.9%(+5.40)#4,878 |
| 52. | Pocahontas | 9.4% | 2.7%(+6.70)#52 | 3.9%(+5.50)#4,926 |
| 53. | Beebe | 9.8% | 2.7%(+7.10)#53 | 3.9%(+5.90)#5,040 |
| 54. | Dover | 9.9% | 2.7%(+7.20)#54 | 3.9%(+6.00)#5,072 |
| 55. | Ratcliff | 9.9% | 2.7%(+7.20)#55 | 3.9%(+6.00)#5,084 |
| 56. | Wooster | 10.0% | 2.7%(+7.30)#56 | 3.9%(+6.10)#5,107 |
| 57. | Cove | 10.0% | 2.7%(+7.30)#57 | 3.9%(+6.10)#5,116 |
| 58. | Jacksonville | 11.2% | 2.7%(+8.50)#58 | 3.9%(+7.30)#5,387 |
| 59. | West Crossett | 11.3% | 2.7%(+8.60)#59 | 3.9%(+7.40)#5,413 |
| 60. | Landmark | 11.4% | 2.7%(+8.70)#60 | 3.9%(+7.50)#5,425 |
| 61. | Mcdougal | 12.5% | 2.7%(+9.80)#61 | 3.9%(+8.60)#5,648 |
| 62. | Marion | 13.2% | 2.7%(+10.5)#62 | 3.9%(+9.30)#5,728 |
| 63. | Paris | 13.8% | 2.7%(+11.1)#63 | 3.9%(+9.90)#5,822 |
| 64. | Delight | 14.2% | 2.7%(+11.5)#64 | 3.9%(+10.3)#5,892 |
| 65. | Corning | 15.7% | 2.7%(+13.0)#65 | 3.9%(+11.8)#6,040 |
| 66. | Coal Hill | 16.6% | 2.7%(+13.9)#66 | 3.9%(+12.7)#6,149 |
| 67. | Shannon Hills | 17.0% | 2.7%(+14.3)#67 | 3.9%(+13.1)#6,214 |
| 68. | Rockwell | 17.4% | 2.7%(+14.7)#68 | 3.9%(+13.5)#6,252 |
| 69. | Alexander | 17.8% | 2.7%(+15.1)#69 | 3.9%(+13.9)#6,290 |
| 70. | Gillett | 17.8% | 2.7%(+15.1)#70 | 3.9%(+13.9)#6,293 |
| 71. | Aubrey | 18.1% | 2.7%(+15.4)#71 | 3.9%(+14.2)#6,334 |
| 72. | Pottsville | 18.2% | 2.7%(+15.5)#72 | 3.9%(+14.3)#6,337 |
| 73. | Greers Ferry | 19.0% | 2.7%(+16.3)#73 | 3.9%(+15.1)#6,415 |
| 74. | Russellville | 19.3% | 2.7%(+16.6)#74 | 3.9%(+15.4)#6,430 |
| 75. | Mansfield | 20.5% | 2.7%(+17.8)#75 | 3.9%(+16.6)#6,529 |
| 76. | Lonoke | 22.1% | 2.7%(+19.4)#76 | 3.9%(+18.2)#6,610 |
| 77. | Lake View | 22.3% | 2.7%(+19.6)#77 | 3.9%(+18.4)#6,646 |
| 78. | Mountainburg | 24.9% | 2.7%(+22.2)#78 | 3.9%(+21.0)#6,751 |
| 79. | Holiday Island | 28.1% | 2.7%(+25.4)#79 | 3.9%(+24.2)#6,891 |
| 80. | Horseshoe Lake | 29.1% | 2.7%(+26.4)#80 | 3.9%(+25.2)#6,942 |
| 81. | Haynes | 33.3% | 2.7%(+30.6)#81 | 3.9%(+29.4)#7,091 |
| 82. | Dardanelle | 33.4% | 2.7%(+30.7)#82 | 3.9%(+29.5)#7,097 |
| 83. | Elaine | 36.7% | 2.7%(+34.0)#83 | 3.9%(+32.8)#7,165 |
| 84. | Knoxville | 37.3% | 2.7%(+34.6)#84 | 3.9%(+33.4)#7,175 |
| 85. | Sheridan | 38.7% | 2.7%(+36.0)#85 | 3.9%(+34.8)#7,201 |
| 86. | Foreman | 40.6% | 2.7%(+37.9)#86 | 3.9%(+36.7)#7,246 |
| 87. | Bull Shoals | 41.7% | 2.7%(+39.0)#87 | 3.9%(+37.8)#7,259 |
| 88. | Manila | 55.0% | 2.7%(+52.3)#88 | 3.9%(+51.1)#7,395 |
| 89. | Moorefield | 66.7% | 2.7%(+64.0)#89 | 3.9%(+62.8)#7,463 |
| 90. | Jericho | 74.9% | 2.7%(+72.2)#90 | 3.9%(+71.0)#7,486 |
| 91. | St Paul | 87.4% | 2.7%(+84.7)#91 | 3.9%(+83.5)#7,516 |
| 92. | Gilmore | 97.6% | 2.7%(+94.9)#92 | 3.9%(+93.7)#7,524 |
| 93. | Sedgwick | 100.0% | 2.7%(+97.3)#93 | 3.9%(+96.1)#7,598 |
Common Questions
What are the Top 10 Cities with the Lowest Unemployment Rate Amomg Seniors Over the Age of 65 in Arkansas?
Top 10 Cities with the Lowest Unemployment Rate Amomg Seniors Over the Age of 65 in Arkansas are:
#1
0.0%
#2
0.0%
#3
0.0%
#4
0.0%
#5
0.0%
#6
0.0%
#7
0.0%
#8
0.40%
#9
0.70%
#10
0.90%
What city has the Lowest Unemployment Rate Amomg Seniors Over the Age of 65 in Arkansas?
Pine Bluff has the Lowest Unemployment Rate Amomg Seniors Over the Age of 65 in Arkansas with 0.40%.
What is the Unemployment Rate Amomg Seniors Over the Age of 65 in the State of Arkansas?
Unemployment Rate Amomg Seniors Over the Age of 65 in Arkansas is 2.7%.
What is the Unemployment Rate Amomg Seniors Over the Age of 65 in the United States?
Unemployment Rate Amomg Seniors Over the Age of 65 in the United States is 3.9%.