Cities with the Lowest Unemployment Rate Amomg Seniors Over the Age of 65 in Kentucky
RELATED REPORTS & OPTIONS
Lowest Unemployment | Senior > 65
Kentucky
Compare Cities
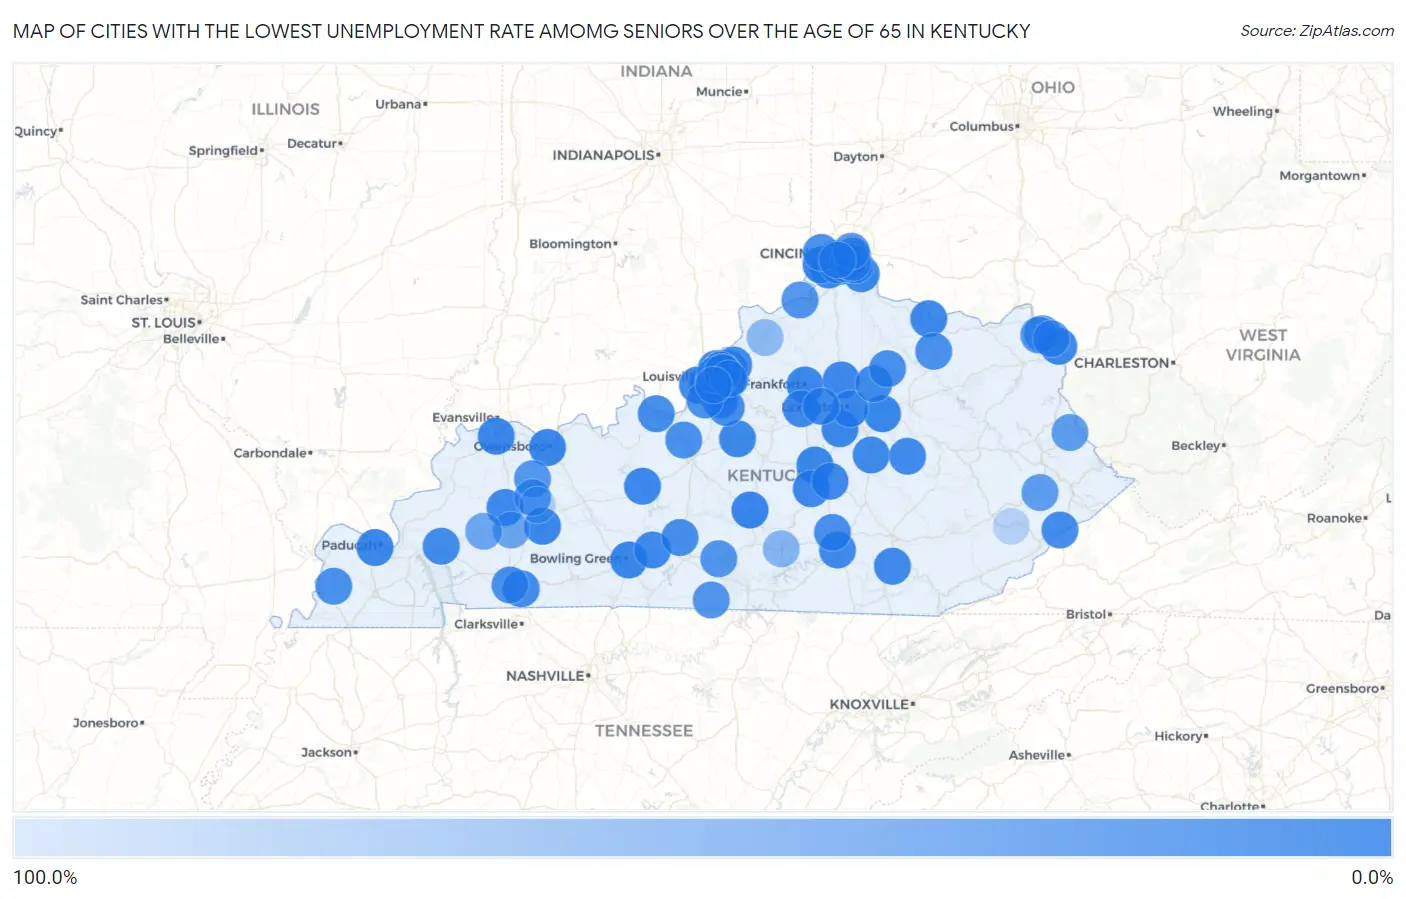
Map of Cities with the Lowest Unemployment Rate Amomg Seniors Over the Age of 65 in Kentucky
100.0%
0.0%
Cities with the Lowest Unemployment Rate Amomg Seniors Over the Age of 65 in Kentucky
| City | Senior Unemployment | vs State | vs National | |
| 1. | Campbellsville | 0.10% | 3.2%(-3.10)#1 | 3.9%(-3.80)#6 |
| 2. | Owensboro | 0.30% | 3.2%(-2.90)#2 | 3.9%(-3.60)#13 |
| 3. | Frankfort | 1.0% | 3.2%(-2.20)#3 | 3.9%(-2.90)#208 |
| 4. | Greenville | 1.0% | 3.2%(-2.20)#4 | 3.9%(-2.90)#229 |
| 5. | Henderson | 1.2% | 3.2%(-2.00)#5 | 3.9%(-2.70)#295 |
| 6. | Paducah | 1.7% | 3.2%(-1.50)#6 | 3.9%(-2.20)#569 |
| 7. | Alexandria | 1.9% | 3.2%(-1.30)#7 | 3.9%(-2.00)#706 |
| 8. | Edgewood | 1.9% | 3.2%(-1.30)#8 | 3.9%(-2.00)#713 |
| 9. | Bowling Green | 2.0% | 3.2%(-1.20)#9 | 3.9%(-1.90)#736 |
| 10. | Nicholasville | 2.1% | 3.2%(-1.10)#10 | 3.9%(-1.80)#812 |
| 11. | Danville | 2.1% | 3.2%(-1.10)#11 | 3.9%(-1.80)#828 |
| 12. | Florence | 2.2% | 3.2%(-1.000)#12 | 3.9%(-1.70)#881 |
| 13. | Burlington | 2.3% | 3.2%(-0.900)#13 | 3.9%(-1.60)#959 |
| 14. | Jeffersontown | 2.4% | 3.2%(-0.800)#14 | 3.9%(-1.50)#1,028 |
| 15. | Winchester | 2.4% | 3.2%(-0.800)#15 | 3.9%(-1.50)#1,040 |
| 16. | Villa Hills | 2.6% | 3.2%(-0.600)#16 | 3.9%(-1.30)#1,205 |
| 17. | Georgetown | 2.7% | 3.2%(-0.500)#17 | 3.9%(-1.20)#1,237 |
| 18. | Ashland | 2.7% | 3.2%(-0.500)#18 | 3.9%(-1.20)#1,251 |
| 19. | Erlanger | 2.8% | 3.2%(-0.400)#19 | 3.9%(-1.10)#1,329 |
| 20. | Lyndon | 2.8% | 3.2%(-0.400)#20 | 3.9%(-1.10)#1,340 |
| 21. | Graymoor Devondale | 2.9% | 3.2%(-0.300)#21 | 3.9%(-1.00)#1,439 |
| 22. | Langdon Place | 3.0% | 3.2%(-0.200)#22 | 3.9%(-0.900)#1,524 |
| 23. | Glenview | 3.0% | 3.2%(-0.200)#23 | 3.9%(-0.900)#1,526 |
| 24. | Maysville | 3.1% | 3.2%(-0.100)#24 | 3.9%(-0.800)#1,581 |
| 25. | Lexington | 3.2% | 3.2%(=0.000)#25 | 3.9%(-0.700)#1,617 |
| 26. | Bellemeade | 3.2% | 3.2%(=0.000)#26 | 3.9%(-0.700)#1,698 |
| 27. | Fincastle | 3.2% | 3.2%(=0.000)#27 | 3.9%(-0.700)#1,703 |
| 28. | Windy Hills | 3.3% | 3.2%(+0.100)#28 | 3.9%(-0.600)#1,771 |
| 29. | Woodland Hills | 3.5% | 3.2%(+0.300)#29 | 3.9%(-0.400)#1,927 |
| 30. | Moorland | 3.5% | 3.2%(+0.300)#30 | 3.9%(-0.400)#1,928 |
| 31. | Middletown | 3.7% | 3.2%(+0.500)#31 | 3.9%(-0.200)#2,039 |
| 32. | Lawrenceburg | 3.8% | 3.2%(+0.600)#32 | 3.9%(-0.100)#2,113 |
| 33. | Leitchfield | 3.9% | 3.2%(+0.700)#33 | 3.9%(=0.000)#2,204 |
| 34. | Anchorage | 3.9% | 3.2%(+0.700)#34 | 3.9%(=0.000)#2,219 |
| 35. | Brownsboro Farm | 3.9% | 3.2%(+0.700)#35 | 3.9%(=0.000)#2,228 |
| 36. | Hustonville | 4.0% | 3.2%(+0.800)#36 | 3.9%(+0.100)#2,313 |
| 37. | Audubon Park | 4.1% | 3.2%(+0.900)#37 | 3.9%(+0.200)#2,384 |
| 38. | Louisville | 4.2% | 3.2%(+1.00)#38 | 3.9%(+0.300)#2,396 |
| 39. | Madisonville | 4.3% | 3.2%(+1.10)#39 | 3.9%(+0.400)#2,491 |
| 40. | Covington | 4.5% | 3.2%(+1.30)#40 | 3.9%(+0.600)#2,628 |
| 41. | Bardstown | 4.5% | 3.2%(+1.30)#41 | 3.9%(+0.600)#2,650 |
| 42. | Cold Spring | 4.6% | 3.2%(+1.40)#42 | 3.9%(+0.700)#2,748 |
| 43. | Smiths Grove | 4.7% | 3.2%(+1.50)#43 | 3.9%(+0.800)#2,846 |
| 44. | Shively | 5.7% | 3.2%(+2.50)#44 | 3.9%(+1.80)#3,406 |
| 45. | Fort Thomas | 5.8% | 3.2%(+2.60)#45 | 3.9%(+1.90)#3,455 |
| 46. | Stanford | 5.8% | 3.2%(+2.60)#46 | 3.9%(+1.90)#3,465 |
| 47. | Hollow Creek | 6.0% | 3.2%(+2.80)#47 | 3.9%(+2.10)#3,586 |
| 48. | Richmond | 6.2% | 3.2%(+3.00)#48 | 3.9%(+2.30)#3,645 |
| 49. | Irvine | 6.2% | 3.2%(+3.00)#49 | 3.9%(+2.30)#3,679 |
| 50. | Versailles | 6.4% | 3.2%(+3.20)#50 | 3.9%(+2.50)#3,772 |
| 51. | Paris | 6.4% | 3.2%(+3.20)#51 | 3.9%(+2.50)#3,773 |
| 52. | Heritage Creek | 6.6% | 3.2%(+3.40)#52 | 3.9%(+2.70)#3,909 |
| 53. | Ferguson | 6.6% | 3.2%(+3.40)#53 | 3.9%(+2.70)#3,914 |
| 54. | Corbin | 7.2% | 3.2%(+4.00)#54 | 3.9%(+3.30)#4,153 |
| 55. | St Matthews | 7.8% | 3.2%(+4.60)#55 | 3.9%(+3.90)#4,364 |
| 56. | Crestwood | 8.0% | 3.2%(+4.80)#56 | 3.9%(+4.10)#4,454 |
| 57. | Eddyville | 8.2% | 3.2%(+5.00)#57 | 3.9%(+4.30)#4,526 |
| 58. | Kingsley | 8.8% | 3.2%(+5.60)#58 | 3.9%(+4.90)#4,733 |
| 59. | Brandenburg | 9.0% | 3.2%(+5.80)#59 | 3.9%(+5.10)#4,784 |
| 60. | Pembroke | 9.0% | 3.2%(+5.80)#60 | 3.9%(+5.10)#4,798 |
| 61. | Jenkins | 9.2% | 3.2%(+6.00)#61 | 3.9%(+5.30)#4,867 |
| 62. | Mount Washington | 11.0% | 3.2%(+7.80)#62 | 3.9%(+7.10)#5,317 |
| 63. | Millersburg | 11.1% | 3.2%(+7.90)#63 | 3.9%(+7.20)#5,363 |
| 64. | Meadowview Estates | 11.1% | 3.2%(+7.90)#64 | 3.9%(+7.20)#5,383 |
| 65. | Southgate | 11.5% | 3.2%(+8.30)#65 | 3.9%(+7.60)#5,448 |
| 66. | Science Hill | 11.7% | 3.2%(+8.50)#66 | 3.9%(+7.80)#5,489 |
| 67. | Cave City | 12.5% | 3.2%(+9.30)#67 | 3.9%(+8.60)#5,629 |
| 68. | Flemingsburg | 12.7% | 3.2%(+9.50)#68 | 3.9%(+8.80)#5,665 |
| 69. | Hopkinsville | 13.8% | 3.2%(+10.6)#69 | 3.9%(+9.90)#5,814 |
| 70. | Barbourmeade | 13.9% | 3.2%(+10.7)#70 | 3.9%(+10.00)#5,834 |
| 71. | Radcliff | 14.1% | 3.2%(+10.9)#71 | 3.9%(+10.2)#5,846 |
| 72. | Francisville | 14.1% | 3.2%(+10.9)#72 | 3.9%(+10.2)#5,849 |
| 73. | Wilder | 14.1% | 3.2%(+10.9)#73 | 3.9%(+10.2)#5,852 |
| 74. | Arlington | 14.3% | 3.2%(+11.1)#74 | 3.9%(+10.4)#5,912 |
| 75. | Plantation | 15.7% | 3.2%(+12.5)#75 | 3.9%(+11.8)#6,048 |
| 76. | Hollyvilla | 15.7% | 3.2%(+12.5)#76 | 3.9%(+11.8)#6,050 |
| 77. | Brownsboro Village | 15.7% | 3.2%(+12.5)#77 | 3.9%(+11.8)#6,051 |
| 78. | Briarwood | 15.9% | 3.2%(+12.7)#78 | 3.9%(+12.0)#6,072 |
| 79. | Highland Heights | 17.8% | 3.2%(+14.6)#79 | 3.9%(+13.9)#6,288 |
| 80. | Warsaw | 19.0% | 3.2%(+15.8)#80 | 3.9%(+15.1)#6,410 |
| 81. | Edmonton | 19.4% | 3.2%(+16.2)#81 | 3.9%(+15.5)#6,439 |
| 82. | Tompkinsville | 19.9% | 3.2%(+16.7)#82 | 3.9%(+16.0)#6,458 |
| 83. | Wurtland | 22.1% | 3.2%(+18.9)#83 | 3.9%(+18.2)#6,613 |
| 84. | Calhoun | 22.1% | 3.2%(+18.9)#84 | 3.9%(+18.2)#6,615 |
| 85. | Sacramento | 22.1% | 3.2%(+18.9)#85 | 3.9%(+18.2)#6,618 |
| 86. | Greenup | 22.8% | 3.2%(+19.6)#86 | 3.9%(+18.9)#6,657 |
| 87. | Dayton | 23.3% | 3.2%(+20.1)#87 | 3.9%(+19.4)#6,689 |
| 88. | Russell | 24.4% | 3.2%(+21.2)#88 | 3.9%(+20.5)#6,731 |
| 89. | Douglass Hills | 25.0% | 3.2%(+21.8)#89 | 3.9%(+21.1)#6,765 |
| 90. | Wayland | 28.5% | 3.2%(+25.3)#90 | 3.9%(+24.6)#6,913 |
| 91. | Crescent Springs | 29.0% | 3.2%(+25.8)#91 | 3.9%(+25.1)#6,938 |
| 92. | Inez | 30.7% | 3.2%(+27.5)#92 | 3.9%(+26.8)#6,988 |
| 93. | Nortonville | 40.0% | 3.2%(+36.8)#93 | 3.9%(+36.1)#7,226 |
| 94. | West Buechel | 40.6% | 3.2%(+37.4)#94 | 3.9%(+36.7)#7,245 |
| 95. | Dawson Springs | 41.3% | 3.2%(+38.1)#95 | 3.9%(+37.4)#7,254 |
| 96. | Russell Springs | 62.2% | 3.2%(+59.0)#96 | 3.9%(+58.3)#7,433 |
| 97. | Campbellsburg | 66.7% | 3.2%(+63.5)#97 | 3.9%(+62.8)#7,461 |
| 98. | Bremen | 99.5% | 3.2%(+96.3)#98 | 3.9%(+95.6)#7,532 |
| 99. | Vicco | 100.0% | 3.2%(+96.8)#99 | 3.9%(+96.1)#7,585 |
Common Questions
What are the Top 10 Cities with the Lowest Unemployment Rate Amomg Seniors Over the Age of 65 in Kentucky?
Top 10 Cities with the Lowest Unemployment Rate Amomg Seniors Over the Age of 65 in Kentucky are:
#1
0.0%
#2
0.10%
#3
0.30%
#4
1.0%
#5
1.0%
#6
1.2%
#7
1.7%
#8
1.9%
#9
1.9%
#10
2.0%
What city has the Lowest Unemployment Rate Amomg Seniors Over the Age of 65 in Kentucky?
Campbellsville has the Lowest Unemployment Rate Amomg Seniors Over the Age of 65 in Kentucky with 0.10%.
What is the Unemployment Rate Amomg Seniors Over the Age of 65 in the State of Kentucky?
Unemployment Rate Amomg Seniors Over the Age of 65 in Kentucky is 3.2%.
What is the Unemployment Rate Amomg Seniors Over the Age of 65 in the United States?
Unemployment Rate Amomg Seniors Over the Age of 65 in the United States is 3.9%.