McCormick County, SC
McCormick County Map

McCormick County Overview
9,612
TOTAL POPULATION
5,187
MALE POPULATION
4,425
FEMALE POPULATION
117.22
MALES / 100 FEMALES
85.31
FEMALES / 100 MALES
57.9
MEDIAN AGE
2.6
AVG FAMILY SIZE
2.2
AVG HOUSEHOLD SIZE
$32,017
PER CAPITA INCOME
$76,354
AVG FAMILY INCOME
$55,569
AVG HOUSEHOLD INCOME
18.0%
WAGE / INCOME GAP [ % ]
82.0¢/ $1
WAGE / INCOME GAP [ $ ]
$12,458
FAMILY INCOME DEFICIT
0.46
INEQUALITY / GINI INDEX
3,486
LABOR FORCE [ PEOPLE ]
40.0%
PERCENT IN LABOR FORCE
6.4%
UNEMPLOYMENT RATE
McCormick County Area Codes
Race in McCormick County
The most populous races in McCormick County are White / Caucasian (5,071 | 52.8%), Black / African American (4,177 | 43.5%), and Two or more Races (250 | 2.6%).

| Race | # Population | % Population |
| Asian | 22 | 0.2% |
| Black / African American | 4,177 | 43.5% |
| Hawaiian / Pacific | 11 | 0.1% |
| Hispanic or Latino | 60 | 0.6% |
| Native / Alaskan | 0 | 0.0% |
| White / Caucasian | 5,071 | 52.8% |
| Two or more Races | 250 | 2.6% |
| Some other Race | 81 | 0.8% |
| Total | 9,612 | 100.0% |
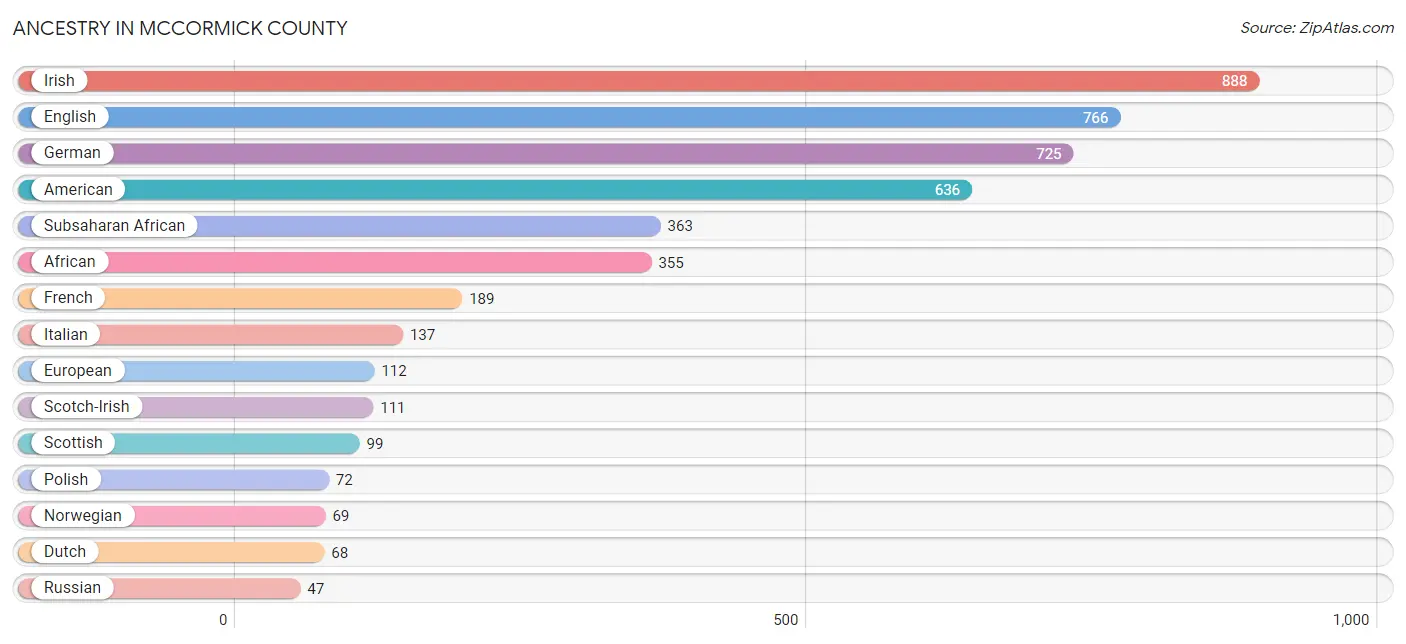
Ancestry in McCormick County
The most populous ancestries reported in McCormick County are Irish (888 | 9.2%), English (766 | 8.0%), German (725 | 7.5%), American (636 | 6.6%), and Subsaharan African (363 | 3.8%), together accounting for 35.1% of all McCormick County residents.
| Ancestry | # Population | % Population |
| African | 355 | 3.7% |
| American | 636 | 6.6% |
| Arab | 5 | 0.1% |
| Austrian | 7 | 0.1% |
| Belgian | 3 | 0.0% |
| British | 11 | 0.1% |
| Central American | 12 | 0.1% |
| Cherokee | 8 | 0.1% |
| Chippewa | 3 | 0.0% |
| Croatian | 21 | 0.2% |
| Danish | 8 | 0.1% |
| Dutch | 68 | 0.7% |
| Eastern European | 1 | 0.0% |
| English | 766 | 8.0% |
| European | 112 | 1.2% |
| French | 189 | 2.0% |
| French Canadian | 8 | 0.1% |
| German | 725 | 7.5% |
| Greek | 14 | 0.2% |
| Haitian | 5 | 0.1% |
| Honduran | 12 | 0.1% |
| Hungarian | 37 | 0.4% |
| Irish | 888 | 9.2% |
| Italian | 137 | 1.4% |
| Jamaican | 2 | 0.0% |
| Korean | 22 | 0.2% |
| Macedonian | 5 | 0.1% |
| Native Hawaiian | 11 | 0.1% |
| Navajo | 23 | 0.2% |
| Norwegian | 69 | 0.7% |
| Polish | 72 | 0.7% |
| Puerto Rican | 21 | 0.2% |
| Russian | 47 | 0.5% |
| Scandinavian | 20 | 0.2% |
| Scotch-Irish | 111 | 1.1% |
| Scottish | 99 | 1.0% |
| Slovak | 7 | 0.1% |
| Slovene | 3 | 0.0% |
| South African | 8 | 0.1% |
| Spaniard | 27 | 0.3% |
| Subsaharan African | 363 | 3.8% |
| Swedish | 46 | 0.5% |
| Swiss | 6 | 0.1% |
| Welsh | 36 | 0.4% | View All 44 Rows |
Immigrants in McCormick County
The most numerous immigrant groups reported in McCormick County came from Europe (62 | 0.6%), Germany (43 | 0.4%), Western Europe (43 | 0.4%), Asia (37 | 0.4%), and Latin America (26 | 0.3%), together accounting for 2.2% of all McCormick County residents.

| Immigration Origin | # Population | % Population |
| Africa | 5 | 0.1% |
| Asia | 37 | 0.4% |
| Caribbean | 7 | 0.1% |
| Central America | 19 | 0.2% |
| China | 15 | 0.2% |
| Eastern Asia | 15 | 0.2% |
| England | 3 | 0.0% |
| Europe | 62 | 0.6% |
| Germany | 43 | 0.4% |
| Honduras | 12 | 0.1% |
| Hong Kong | 15 | 0.2% |
| Ireland | 7 | 0.1% |
| Jamaica | 2 | 0.0% |
| Latin America | 26 | 0.3% |
| Northern Africa | 5 | 0.1% |
| Northern Europe | 19 | 0.2% |
| Panama | 7 | 0.1% |
| Philippines | 22 | 0.2% |
| South Eastern Asia | 22 | 0.2% |
| Trinidad and Tobago | 5 | 0.1% |
| Western Europe | 43 | 0.4% | View All 21 Rows |
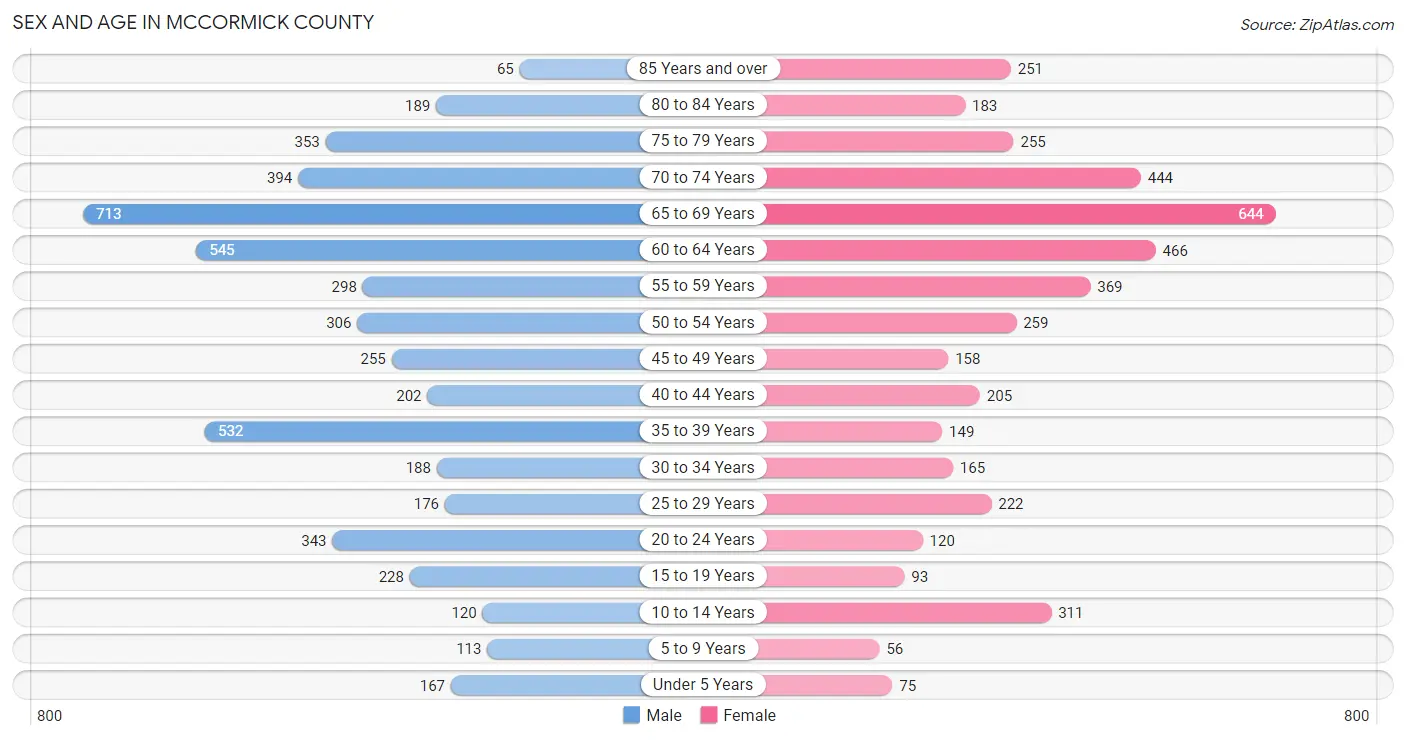
Sex and Age in McCormick County
Sex and Age in McCormick County
The most populous age groups in McCormick County are 65 to 69 Years (713 | 13.8%) for men and 65 to 69 Years (644 | 14.5%) for women.
| Age Bracket | Male | Female |
| Under 5 Years | 167 (3.2%) | 75 (1.7%) |
| 5 to 9 Years | 113 (2.2%) | 56 (1.3%) |
| 10 to 14 Years | 120 (2.3%) | 311 (7.0%) |
| 15 to 19 Years | 228 (4.4%) | 93 (2.1%) |
| 20 to 24 Years | 343 (6.6%) | 120 (2.7%) |
| 25 to 29 Years | 176 (3.4%) | 222 (5.0%) |
| 30 to 34 Years | 188 (3.6%) | 165 (3.7%) |
| 35 to 39 Years | 532 (10.3%) | 149 (3.4%) |
| 40 to 44 Years | 202 (3.9%) | 205 (4.6%) |
| 45 to 49 Years | 255 (4.9%) | 158 (3.6%) |
| 50 to 54 Years | 306 (5.9%) | 259 (5.9%) |
| 55 to 59 Years | 298 (5.8%) | 369 (8.3%) |
| 60 to 64 Years | 545 (10.5%) | 466 (10.5%) |
| 65 to 69 Years | 713 (13.8%) | 644 (14.5%) |
| 70 to 74 Years | 394 (7.6%) | 444 (10.0%) |
| 75 to 79 Years | 353 (6.8%) | 255 (5.8%) |
| 80 to 84 Years | 189 (3.6%) | 183 (4.1%) |
| 85 Years and over | 65 (1.3%) | 251 (5.7%) |
| Total | 5,187 (100.0%) | 4,425 (100.0%) |
Families and Households in McCormick County
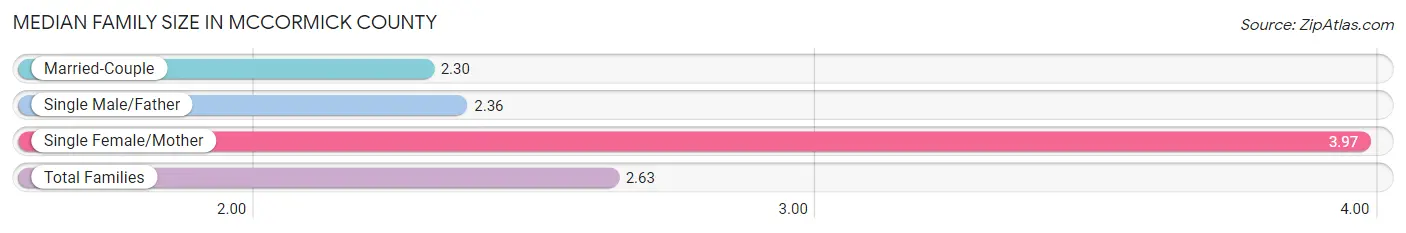
Median Family Size in McCormick County
The median family size in McCormick County is 2.63 persons per family, with single female/mother families (514 | 19.9%) accounting for the largest median family size of 3.97 persons per family. On the other hand, married-couple families (1,961 | 76.1%) represent the smallest median family size with 2.30 persons per family.
| Family Type | # Families | Family Size |
| Married-Couple | 1,961 (76.1%) | 2.30 |
| Single Male/Father | 103 (4.0%) | 2.36 |
| Single Female/Mother | 514 (19.9%) | 3.97 |
| Total Families | 2,578 (100.0%) | 2.63 |
Median Household Size in McCormick County
The median household size in McCormick County is 2.19 persons per household, with single female/mother households (514 | 13.0%) accounting for the largest median household size of 4.03 persons per household. non-family households (1,369 | 34.7%) represent the smallest median household size with 1.23 persons per household.

| Household Type | # Households | Household Size |
| Married-Couple | 1,961 (49.7%) | 2.37 |
| Single Male/Father | 103 (2.6%) | 2.36 |
| Single Female/Mother | 514 (13.0%) | 4.03 |
| Non-family | 1,369 (34.7%) | 1.23 |
| Total Households | 3,947 (100.0%) | 2.19 |
Household Size by Marriage Status in McCormick County
Out of a total of 3,947 households in McCormick County, 2,578 (65.3%) are family households, while 1,369 (34.7%) are nonfamily households. The most numerous type of family households are 2-person households, comprising 1,976, and the most common type of nonfamily households are 1-person households, comprising 1,214.

| Household Size | Family Households | Nonfamily Households |
| 1-Person Households | - | 1,214 (30.8%) |
| 2-Person Households | 1,976 (50.1%) | 121 (3.1%) |
| 3-Person Households | 350 (8.9%) | 0 (0.0%) |
| 4-Person Households | 108 (2.7%) | 0 (0.0%) |
| 5-Person Households | 84 (2.1%) | 15 (0.4%) |
| 6-Person Households | 39 (1.0%) | 19 (0.5%) |
| 7+ Person Households | 21 (0.5%) | 0 (0.0%) |
| Total | 2,578 (65.3%) | 1,369 (34.7%) |
Female Fertility in McCormick County
Fertility by Age in McCormick County
Average fertility rate in McCormick County is 96.0 births per 1,000 women. Women in the age bracket of 20 to 34 years have the highest fertility rate with 221.0 births per 1,000 women. Women in the age bracket of 20 to 34 years acount for 100.0% of all women with births.

| Age Bracket | Women with Births | Births / 1,000 Women |
| 15 to 19 years | 0 (0.0%) | 0.0 |
| 20 to 34 years | 112 (100.0%) | 221.0 |
| 35 to 50 years | 0 (0.0%) | 0.0 |
| Total | 112 (100.0%) | 96.0 |
Fertility by Age by Marriage Status in McCormick County
50.0% of women with births (112) in McCormick County are married. The highest percentage of unmarried women with births falls into 20 to 34 years age bracket with 50.0% of them unmarried at the time of birth, while the lowest percentage of unmarried women with births belong to 20 to 34 years age bracket with 50.0% of them unmarried.

| Age Bracket | Married | Unmarried |
| 15 to 19 years | 0 (0.0%) | 0 (0.0%) |
| 20 to 34 years | 56 (50.0%) | 56 (50.0%) |
| 35 to 50 years | 0 (0.0%) | 0 (0.0%) |
| Total | 56 (50.0%) | 56 (50.0%) |
Fertility by Education in McCormick County

| Educational Attainment | Women with Births | Births / 1,000 Women |
| Less than High School | 0 (0.0%) | 0.0 |
| High School Diploma | 24 (21.4%) | 99.0 |
| College or Associate's Degree | 65 (58.0%) | 114.0 |
| Bachelor's Degree | 23 (20.5%) | 121.0 |
| Graduate Degree | 0 (0.0%) | 0.0 |
| Total | 112 (100.0%) | 96.0 |
Fertility by Education by Marriage Status in McCormick County
50.0% of women with births in McCormick County are unmarried. Women with the educational attainment of college or associate's degree are most likely to be married with 78.5% of them married at childbirth, while women with the educational attainment of bachelor's degree are least likely to be married with 100.0% of them unmarried at childbirth.

| Educational Attainment | Married | Unmarried |
| Less than High School | 0 (0.0%) | 0 (0.0%) |
| High School Diploma | 5 (20.8%) | 19 (79.2%) |
| College or Associate's Degree | 51 (78.5%) | 14 (21.5%) |
| Bachelor's Degree | 0 (0.0%) | 23 (100.0%) |
| Graduate Degree | 0 (0.0%) | 0 (0.0%) |
| Total | 56 (50.0%) | 56 (50.0%) |
Income in McCormick County
Income Overview in McCormick County
Per Capita Income in McCormick County is $32,017, while median incomes of families and households are $76,354 and $55,569 respectively.
| Characteristic | Number | Measure |
| Per Capita Income | 9,612 | $32,017 |
| Median Family Income | 2,578 | $76,354 |
| Mean Family Income | 2,578 | $88,737 |
| Median Household Income | 3,947 | $55,569 |
| Mean Household Income | 3,947 | $72,282 |
| Income Deficit | 2,578 | $12,458 |
| Wage / Income Gap (%) | 9,612 | 18.04% |
| Wage / Income Gap ($) | 9,612 | 81.96¢ per $1 |
| Gini / Inequality Index | 9,612 | 0.46 |
Earnings by Sex in McCormick County
Average Earnings in McCormick County are $37,096, $38,800 for men and $31,799 for women, a difference of 18.0%.

| Sex | Number | Average Earnings |
| Male | 2,024 (55.1%) | $38,800 |
| Female | 1,647 (44.9%) | $31,799 |
| Total | 3,671 (100.0%) | $37,096 |
Earnings by Sex by Income Bracket in McCormick County
The most common earnings brackets in McCormick County are $35,000 to $39,999 for men (258 | 12.8%) and $65,000 to $74,999 for women (153 | 9.3%).

| Income | Male | Female |
| $2,499 or less | 119 (5.9%) | 83 (5.0%) |
| $2,500 to $4,999 | 71 (3.5%) | 71 (4.3%) |
| $5,000 to $7,499 | 77 (3.8%) | 96 (5.8%) |
| $7,500 to $9,999 | 43 (2.1%) | 26 (1.6%) |
| $10,000 to $12,499 | 38 (1.9%) | 123 (7.5%) |
| $12,500 to $14,999 | 54 (2.7%) | 87 (5.3%) |
| $15,000 to $17,499 | 79 (3.9%) | 22 (1.3%) |
| $17,500 to $19,999 | 14 (0.7%) | 44 (2.7%) |
| $20,000 to $22,499 | 27 (1.3%) | 72 (4.4%) |
| $22,500 to $24,999 | 9 (0.4%) | 58 (3.5%) |
| $25,000 to $29,999 | 146 (7.2%) | 112 (6.8%) |
| $30,000 to $34,999 | 185 (9.1%) | 125 (7.6%) |
| $35,000 to $39,999 | 258 (12.8%) | 72 (4.4%) |
| $40,000 to $44,999 | 118 (5.8%) | 115 (7.0%) |
| $45,000 to $49,999 | 62 (3.1%) | 112 (6.8%) |
| $50,000 to $54,999 | 111 (5.5%) | 63 (3.8%) |
| $55,000 to $64,999 | 233 (11.5%) | 101 (6.1%) |
| $65,000 to $74,999 | 86 (4.3%) | 153 (9.3%) |
| $75,000 to $99,999 | 158 (7.8%) | 47 (2.9%) |
| $100,000+ | 136 (6.7%) | 65 (4.0%) |
| Total | 2,024 (100.0%) | 1,647 (100.0%) |
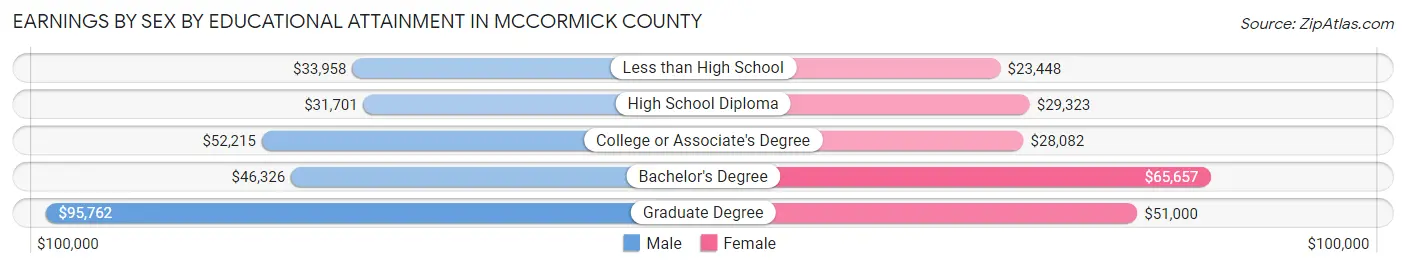
Earnings by Sex by Educational Attainment in McCormick County
Average earnings in McCormick County are $39,130 for men and $33,676 for women, a difference of 13.9%. Men with an educational attainment of graduate degree enjoy the highest average annual earnings of $95,762, while those with high school diploma education earn the least with $31,701. Women with an educational attainment of bachelor's degree earn the most with the average annual earnings of $65,657, while those with less than high school education have the smallest earnings of $23,448.
| Educational Attainment | Male Income | Female Income |
| Less than High School | $33,958 | $23,448 |
| High School Diploma | $31,701 | $29,323 |
| College or Associate's Degree | $52,215 | $28,082 |
| Bachelor's Degree | $46,326 | $65,657 |
| Graduate Degree | $95,762 | $51,000 |
| Total | $39,130 | $33,676 |
Family Income in McCormick County
Family Income Brackets in McCormick County
According to the McCormick County family income data, there are 534 families falling into the $75,000 to $99,999 income range, which is the most common income bracket and makes up 20.7% of all families. Conversely, the $10,000 to $14,999 income bracket is the least frequent group with only 34 families (1.3%) belonging to this category.
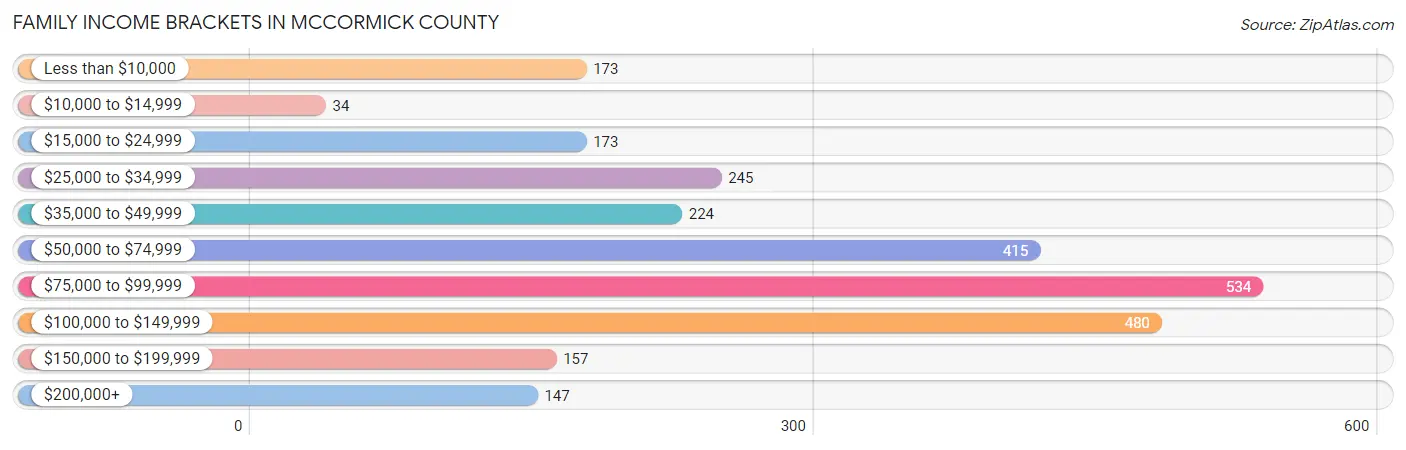
| Income Bracket | # Families | % Families |
| Less than $10,000 | 173 | 6.7% |
| $10,000 to $14,999 | 34 | 1.3% |
| $15,000 to $24,999 | 173 | 6.7% |
| $25,000 to $34,999 | 245 | 9.5% |
| $35,000 to $49,999 | 224 | 8.7% |
| $50,000 to $74,999 | 415 | 16.1% |
| $75,000 to $99,999 | 534 | 20.7% |
| $100,000 to $149,999 | 480 | 18.6% |
| $150,000 to $199,999 | 157 | 6.1% |
| $200,000+ | 147 | 5.7% |
Family Income by Famaliy Size in McCormick County
6-person families (39 | 1.5%) account for the highest median family income in McCormick County with $87,614 per family, while 2-person families (1,979 | 76.8%) have the highest median income of $38,216 per family member.

| Income Bracket | # Families | Median Income |
| 2-Person Families | 1,979 (76.8%) | $76,432 |
| 3-Person Families | 348 (13.5%) | $59,688 |
| 4-Person Families | 144 (5.6%) | $72,500 |
| 5-Person Families | 47 (1.8%) | $0 |
| 6-Person Families | 39 (1.5%) | $87,614 |
| 7+ Person Families | 21 (0.8%) | $0 |
| Total | 2,578 (100.0%) | $76,354 |
Family Income by Number of Earners in McCormick County
The median family income in McCormick County is $76,354, with families comprising 3+ earners (138) having the highest median family income of $136,125, while families with no earners (1,203) have the lowest median family income of $60,060, accounting for 5.3% and 46.7% of families, respectively.

| Number of Earners | # Families | Median Income |
| No Earners | 1,203 (46.7%) | $60,060 |
| 1 Earner | 681 (26.4%) | $70,260 |
| 2 Earners | 556 (21.6%) | $98,587 |
| 3+ Earners | 138 (5.3%) | $136,125 |
| Total | 2,578 (100.0%) | $76,354 |
Household Income in McCormick County
Household Income Brackets in McCormick County
With 671 households falling in the category, the $50,000 to $74,999 income range is the most frequent in McCormick County, accounting for 17.0% of all households. In contrast, only 146 households (3.7%) fall into the $200,000+ income bracket, making it the least populous group.

| Income Bracket | # Households | % Households |
| Less than $10,000 | 316 | 8.0% |
| $10,000 to $14,999 | 245 | 6.2% |
| $15,000 to $24,999 | 359 | 9.1% |
| $25,000 to $34,999 | 407 | 10.3% |
| $35,000 to $49,999 | 450 | 11.4% |
| $50,000 to $74,999 | 671 | 17.0% |
| $75,000 to $99,999 | 663 | 16.8% |
| $100,000 to $149,999 | 537 | 13.6% |
| $150,000 to $199,999 | 158 | 4.0% |
| $200,000+ | 146 | 3.7% |
Household Income by Householder Age in McCormick County
The median household income in McCormick County is $55,569, with the highest median household income of $64,457 found in the 45 to 64 years age bracket for the primary householder. A total of 1,280 households (32.4%) fall into this category. Meanwhile, the 15 to 24 years age bracket for the primary householder has the lowest median household income of $9,777, with 51 households (1.3%) in this group.

| Income Bracket | # Households | Median Income |
| 15 to 24 Years | 51 (1.3%) | $9,777 |
| 25 to 44 Years | 504 (12.8%) | $39,167 |
| 45 to 64 Years | 1,280 (32.4%) | $64,457 |
| 65+ Years | 2,112 (53.5%) | $56,226 |
| Total | 3,947 (100.0%) | $55,569 |
Poverty in McCormick County
Income Below Poverty by Sex and Age in McCormick County
With 15.6% poverty level for males and 17.7% for females among the residents of McCormick County, 15 year old males and under 5 year old females are the most vulnerable to poverty, with 16 males (94.1%) and 50 females (66.7%) in their respective age groups living below the poverty level.

| Age Bracket | Male | Female |
| Under 5 Years | 37 (22.2%) | 50 (66.7%) |
| 5 Years | 5 (41.7%) | 0 (0.0%) |
| 6 to 11 Years | 54 (45.4%) | 18 (9.3%) |
| 12 to 14 Years | 6 (26.1%) | 74 (52.5%) |
| 15 Years | 16 (94.1%) | 0 (0.0%) |
| 16 and 17 Years | 61 (67.0%) | 16 (59.3%) |
| 18 to 24 Years | 90 (21.7%) | 27 (18.4%) |
| 25 to 34 Years | 84 (40.6%) | 66 (17.1%) |
| 35 to 44 Years | 106 (21.1%) | 77 (21.7%) |
| 45 to 54 Years | 82 (22.4%) | 63 (15.1%) |
| 55 to 64 Years | 1 (0.2%) | 134 (16.1%) |
| 65 to 74 Years | 84 (8.0%) | 115 (10.6%) |
| 75 Years and over | 33 (5.8%) | 136 (20.0%) |
| Total | 659 (15.6%) | 776 (17.7%) |
Income Above Poverty by Sex and Age in McCormick County
According to the poverty statistics in McCormick County, males aged 55 to 64 years and females aged 15 years are the age groups that are most secure financially, with 99.9% of males and 100.0% of females in these age groups living above the poverty line.

| Age Bracket | Male | Female |
| Under 5 Years | 130 (77.8%) | 25 (33.3%) |
| 5 Years | 7 (58.3%) | 0 (0.0%) |
| 6 to 11 Years | 65 (54.6%) | 175 (90.7%) |
| 12 to 14 Years | 17 (73.9%) | 67 (47.5%) |
| 15 Years | 1 (5.9%) | 39 (100.0%) |
| 16 and 17 Years | 30 (33.0%) | 11 (40.7%) |
| 18 to 24 Years | 325 (78.3%) | 120 (81.6%) |
| 25 to 34 Years | 123 (59.4%) | 321 (83.0%) |
| 35 to 44 Years | 397 (78.9%) | 277 (78.2%) |
| 45 to 54 Years | 284 (77.6%) | 354 (84.9%) |
| 55 to 64 Years | 672 (99.9%) | 701 (84.0%) |
| 65 to 74 Years | 967 (92.0%) | 973 (89.4%) |
| 75 Years and over | 540 (94.2%) | 545 (80.0%) |
| Total | 3,558 (84.4%) | 3,608 (82.3%) |
Income Below Poverty Among Married-Couple Families in McCormick County
The poverty statistics for married-couple families in McCormick County show that 3.9% or 77 of the total 1,961 families live below the poverty line. Families with no children have the highest poverty rate of 4.2%, comprising of 77 families. On the other hand, families with 1 or 2 children have the lowest poverty rate of 0.0%, which includes 0 families.

| Children | Above Poverty | Below Poverty |
| No Children | 1,760 (95.8%) | 77 (4.2%) |
| 1 or 2 Children | 113 (100.0%) | 0 (0.0%) |
| 3 or 4 Children | 11 (100.0%) | 0 (0.0%) |
| 5 or more Children | 0 (0.0%) | 0 (0.0%) |
| Total | 1,884 (96.1%) | 77 (3.9%) |
Income Below Poverty Among Single-Parent Households in McCormick County
According to the poverty data in McCormick County, 53.4% or 55 single-father households and 28.6% or 147 single-mother households are living below the poverty line. Among single-father households, those with no children have the highest poverty rate, with 35 households (61.4%) experiencing poverty. Likewise, among single-mother households, those with 3 or 4 children have the highest poverty rate, with 58 households (77.3%) falling below the poverty line.

| Children | Single Father | Single Mother |
| No Children | 35 (61.4%) | 33 (12.9%) |
| 1 or 2 Children | 20 (43.5%) | 56 (30.6%) |
| 3 or 4 Children | 0 (0.0%) | 58 (77.3%) |
| 5 or more Children | 0 (0.0%) | 0 (0.0%) |
| Total | 55 (53.4%) | 147 (28.6%) |
Income Below Poverty Among Married-Couple vs Single-Parent Households in McCormick County
The poverty data for McCormick County shows that 77 of the married-couple family households (3.9%) and 202 of the single-parent households (32.7%) are living below the poverty level. Within the married-couple family households, those with no children have the highest poverty rate, with 77 households (4.2%) falling below the poverty line. Among the single-parent households, those with 3 or 4 children have the highest poverty rate, with 58 household (77.3%) living below poverty.

| Children | Married-Couple Families | Single-Parent Households |
| No Children | 77 (4.2%) | 68 (21.7%) |
| 1 or 2 Children | 0 (0.0%) | 76 (33.2%) |
| 3 or 4 Children | 0 (0.0%) | 58 (77.3%) |
| 5 or more Children | 0 (0.0%) | 0 (0.0%) |
| Total | 77 (3.9%) | 202 (32.7%) |
Employment Characteristics in McCormick County
Employment by Class of Employer in McCormick County
Among the 3,174 employed individuals in McCormick County, private company employees (1,976 | 62.3%), state government employees (409 | 12.9%), and local government employees (275 | 8.7%) make up the most common classes of employment.
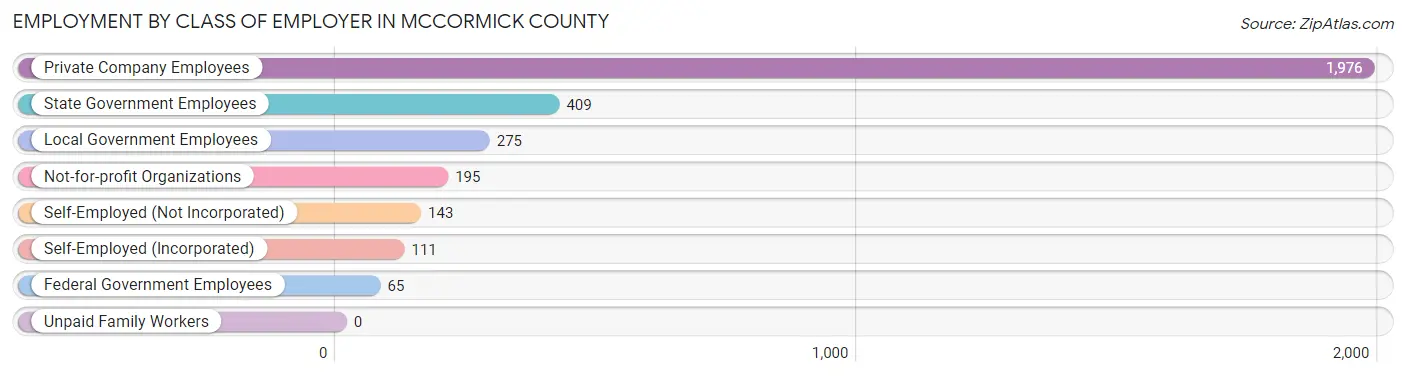
| Employer Class | # Employees | % Employees |
| Private Company Employees | 1,976 | 62.3% |
| Self-Employed (Incorporated) | 111 | 3.5% |
| Self-Employed (Not Incorporated) | 143 | 4.5% |
| Not-for-profit Organizations | 195 | 6.1% |
| Local Government Employees | 275 | 8.7% |
| State Government Employees | 409 | 12.9% |
| Federal Government Employees | 65 | 2.1% |
| Unpaid Family Workers | 0 | 0.0% |
| Total | 3,174 | 100.0% |
Employment Status by Age in McCormick County
According to the labor force statistics for McCormick County, out of the total population over 16 years of age (8,714), 40.0% or 3,486 individuals are in the labor force, with 6.4% or 223 of them unemployed. The age group with the highest labor force participation rate is 20 to 24 years, with 85.1% or 394 individuals in the labor force. Within the labor force, the 16 to 19 years age range has the highest percentage of unemployed individuals, with 22.4% or 11 of them being unemployed.

| Age Bracket | In Labor Force | Unemployed |
| 16 to 19 Years | 49 (18.5%) | 11 (22.4%) |
| 20 to 24 Years | 394 (85.1%) | 31 (7.9%) |
| 25 to 29 Years | 301 (75.6%) | 53 (17.6%) |
| 30 to 34 Years | 284 (80.5%) | 48 (16.9%) |
| 35 to 44 Years | 654 (60.1%) | 54 (8.3%) |
| 45 to 54 Years | 520 (53.2%) | 2 (0.4%) |
| 55 to 59 Years | 360 (54.0%) | 8 (2.2%) |
| 60 to 64 Years | 469 (46.4%) | 0 (0.0%) |
| 65 to 74 Years | 386 (17.6%) | 17 (4.4%) |
| 75 Years and over | 69 (5.3%) | 0 (0.0%) |
| Total | 3,486 (40.0%) | 223 (6.4%) |
Employment Status by Educational Attainment in McCormick County
According to labor force statistics for McCormick County, 57.6% of individuals (2,589) out of the total population between 25 and 64 years of age (4,495) are in the labor force, with 6.4% or 166 of them being unemployed. The group with the highest labor force participation rate are those with the educational attainment of bachelor's degree or higher, with 82.0% or 571 individuals in the labor force. Within the labor force, individuals with high school diploma education have the highest percentage of unemployment, with 13.9% or 115 of them being unemployed.

| Educational Attainment | In Labor Force | Unemployed |
| Less than High School | 193 (31.2%) | 0 (0.0%) |
| High School Diploma | 829 (49.7%) | 232 (13.9%) |
| College / Associate Degree | 996 (65.9%) | 76 (5.0%) |
| Bachelor's Degree or higher | 571 (82.0%) | 0 (0.0%) |
| Total | 2,589 (57.6%) | 288 (6.4%) |
Employment Occupations by Sex in McCormick County
Management, Business, Science and Arts Occupations
The most common Management, Business, Science and Arts occupations in McCormick County are Health Diagnosing & Treating (377 | 11.6%), Management (348 | 10.7%), Health Technologists (331 | 10.1%), Community & Social Service (312 | 9.6%), and Education Instruction & Library (226 | 6.9%).

Management, Business, Science and Arts Occupations by Sex
Within the Management, Business, Science and Arts occupations in McCormick County, the most male-oriented occupations are Architecture & Engineering (100.0%), Legal Services & Support (100.0%), and Education, Arts & Media (78.5%), while the most female-oriented occupations are Health Technologists (96.1%), Health Diagnosing & Treating (91.5%), and Arts, Media & Entertainment (87.5%).

| Occupation | Male | Female |
| Management | 248 (71.3%) | 100 (28.7%) |
| Business & Financial | 35 (59.3%) | 24 (40.7%) |
| Computers, Engineering & Science | 55 (76.4%) | 17 (23.6%) |
| Computers & Mathematics | 7 (35.0%) | 13 (65.0%) |
| Architecture & Engineering | 42 (100.0%) | 0 (0.0%) |
| Life, Physical & Social Science | 6 (60.0%) | 4 (40.0%) |
| Community & Social Service | 104 (33.3%) | 208 (66.7%) |
| Education, Arts & Media | 51 (78.5%) | 14 (21.5%) |
| Legal Services & Support | 5 (100.0%) | 0 (0.0%) |
| Education Instruction & Library | 46 (20.3%) | 180 (79.6%) |
| Arts, Media & Entertainment | 2 (12.5%) | 14 (87.5%) |
| Health Diagnosing & Treating | 32 (8.5%) | 345 (91.5%) |
| Health Technologists | 13 (3.9%) | 318 (96.1%) |
| Total (Category) | 474 (40.6%) | 694 (59.4%) |
| Total (Overall) | 1,723 (52.8%) | 1,540 (47.2%) |
Services Occupations
The most common Services occupations in McCormick County are Security & Protection (208 | 6.4%), Food Preparation & Serving (156 | 4.8%), Cleaning & Maintenance (142 | 4.3%), Firefighting & Prevention (135 | 4.1%), and Healthcare Support (109 | 3.3%).

Services Occupations by Sex
Within the Services occupations in McCormick County, the most male-oriented occupations are Firefighting & Prevention (85.2%), Cleaning & Maintenance (74.7%), and Security & Protection (71.2%), while the most female-oriented occupations are Healthcare Support (100.0%), Law Enforcement (54.8%), and Personal Care & Service (48.0%).
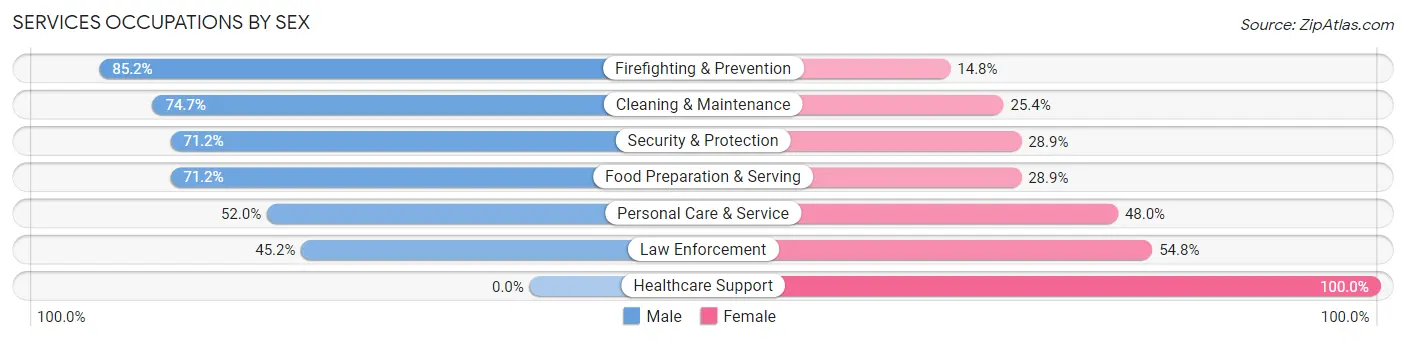
| Occupation | Male | Female |
| Healthcare Support | 0 (0.0%) | 109 (100.0%) |
| Security & Protection | 148 (71.2%) | 60 (28.8%) |
| Firefighting & Prevention | 115 (85.2%) | 20 (14.8%) |
| Law Enforcement | 33 (45.2%) | 40 (54.8%) |
| Food Preparation & Serving | 111 (71.2%) | 45 (28.8%) |
| Cleaning & Maintenance | 106 (74.7%) | 36 (25.4%) |
| Personal Care & Service | 26 (52.0%) | 24 (48.0%) |
| Total (Category) | 391 (58.8%) | 274 (41.2%) |
| Total (Overall) | 1,723 (52.8%) | 1,540 (47.2%) |
Sales and Office Occupations
The most common Sales and Office occupations in McCormick County are Sales & Related (309 | 9.5%), and Office & Administration (272 | 8.3%).

Sales and Office Occupations by Sex

| Occupation | Male | Female |
| Sales & Related | 126 (40.8%) | 183 (59.2%) |
| Office & Administration | 79 (29.0%) | 193 (71.0%) |
| Total (Category) | 205 (35.3%) | 376 (64.7%) |
| Total (Overall) | 1,723 (52.8%) | 1,540 (47.2%) |
Natural Resources, Construction and Maintenance Occupations
The most common Natural Resources, Construction and Maintenance occupations in McCormick County are Construction & Extraction (118 | 3.6%), Installation, Maintenance & Repair (115 | 3.5%), and Farming, Fishing & Forestry (53 | 1.6%).
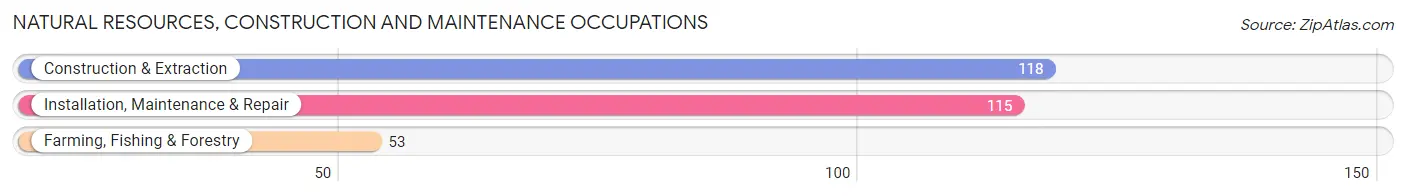
Natural Resources, Construction and Maintenance Occupations by Sex

| Occupation | Male | Female |
| Farming, Fishing & Forestry | 24 (45.3%) | 29 (54.7%) |
| Construction & Extraction | 115 (97.5%) | 3 (2.5%) |
| Installation, Maintenance & Repair | 115 (100.0%) | 0 (0.0%) |
| Total (Category) | 254 (88.8%) | 32 (11.2%) |
| Total (Overall) | 1,723 (52.8%) | 1,540 (47.2%) |
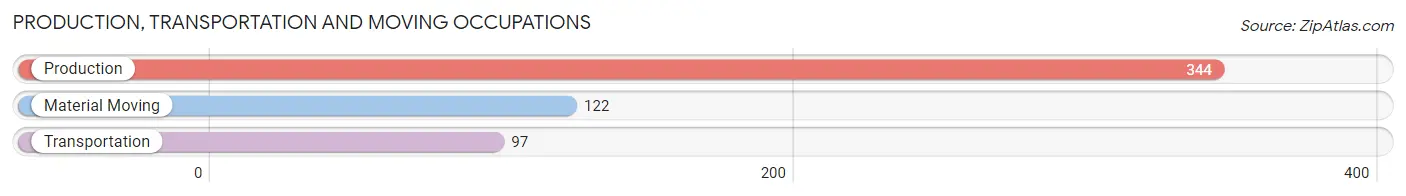
Production, Transportation and Moving Occupations
The most common Production, Transportation and Moving occupations in McCormick County are Production (344 | 10.5%), Material Moving (122 | 3.7%), and Transportation (97 | 3.0%).
Production, Transportation and Moving Occupations by Sex

| Occupation | Male | Female |
| Production | 211 (61.3%) | 133 (38.7%) |
| Transportation | 97 (100.0%) | 0 (0.0%) |
| Material Moving | 91 (74.6%) | 31 (25.4%) |
| Total (Category) | 399 (70.9%) | 164 (29.1%) |
| Total (Overall) | 1,723 (52.8%) | 1,540 (47.2%) |
Employment Industries by Sex in McCormick County
Employment Industries in McCormick County
The major employment industries in McCormick County include Manufacturing (582 | 17.8%), Health Care & Social Assistance (532 | 16.3%), Educational Services (315 | 9.7%), Retail Trade (265 | 8.1%), and Public Administration (263 | 8.1%).

Employment Industries by Sex in McCormick County
The McCormick County industries that see more men than women are Wholesale Trade (100.0%), Construction (97.9%), and Transportation & Warehousing (81.0%), whereas the industries that tend to have a higher number of women are Health Care & Social Assistance (89.8%), Utilities (73.7%), and Educational Services (67.0%).

| Industry | Male | Female |
| Agriculture, Fishing & Hunting | 60 (63.8%) | 34 (36.2%) |
| Mining, Quarrying, & Extraction | 0 (0.0%) | 0 (0.0%) |
| Construction | 187 (97.9%) | 4 (2.1%) |
| Manufacturing | 453 (77.8%) | 129 (22.2%) |
| Wholesale Trade | 34 (100.0%) | 0 (0.0%) |
| Retail Trade | 175 (66.0%) | 90 (34.0%) |
| Transportation & Warehousing | 81 (81.0%) | 19 (19.0%) |
| Utilities | 5 (26.3%) | 14 (73.7%) |
| Information | 7 (41.2%) | 10 (58.8%) |
| Finance & Insurance | 32 (45.1%) | 39 (54.9%) |
| Real Estate, Rental & Leasing | 13 (43.3%) | 17 (56.7%) |
| Professional & Scientific | 59 (75.6%) | 19 (24.4%) |
| Enterprise Management | 0 (0.0%) | 0 (0.0%) |
| Administrative & Support | 131 (65.2%) | 70 (34.8%) |
| Educational Services | 104 (33.0%) | 211 (67.0%) |
| Health Care & Social Assistance | 54 (10.2%) | 478 (89.8%) |
| Arts, Entertainment & Recreation | 63 (57.3%) | 47 (42.7%) |
| Accommodation & Food Services | 101 (66.9%) | 50 (33.1%) |
| Public Administration | 92 (35.0%) | 171 (65.0%) |
| Total | 1,723 (52.8%) | 1,540 (47.2%) |
Education in McCormick County
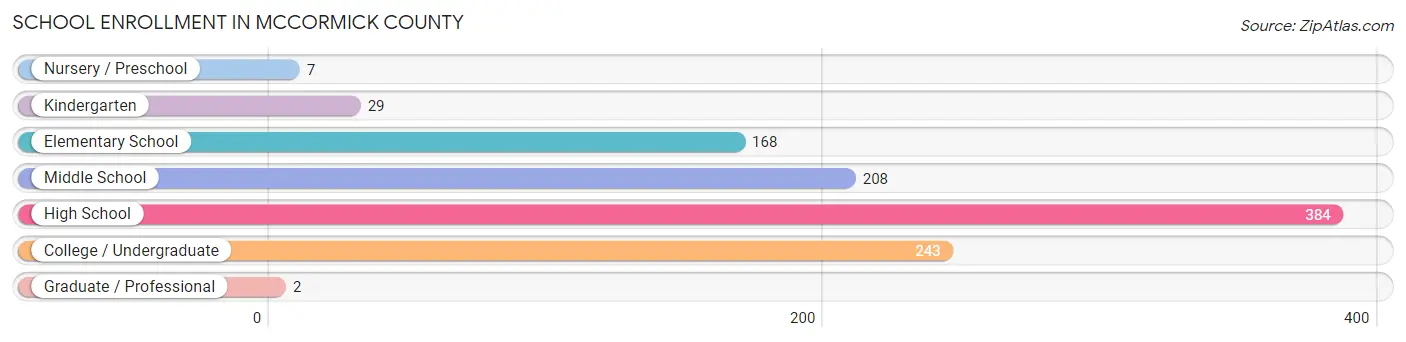
School Enrollment in McCormick County
The most common levels of schooling among the 1,041 students in McCormick County are high school (384 | 36.9%), college / undergraduate (243 | 23.3%), and middle school (208 | 20.0%).
| School Level | # Students | % Students |
| Nursery / Preschool | 7 | 0.7% |
| Kindergarten | 29 | 2.8% |
| Elementary School | 168 | 16.1% |
| Middle School | 208 | 20.0% |
| High School | 384 | 36.9% |
| College / Undergraduate | 243 | 23.3% |
| Graduate / Professional | 2 | 0.2% |
| Total | 1,041 | 100.0% |
School Enrollment by Age by Funding Source in McCormick County
Out of a total of 1,041 students who are enrolled in schools in McCormick County, 197 (18.9%) attend a private institution, while the remaining 844 (81.1%) are enrolled in public schools. The age group of 35 years and over has the highest likelihood of being enrolled in private schools, with 103 (54.5% in the age bracket) enrolled. Conversely, the age group of 3 to 4 year olds has the lowest likelihood of being enrolled in a private school, with 7 (100.0% in the age bracket) attending a public institution.

| Age Bracket | Public School | Private School |
| 3 to 4 Year Olds | 7 (100.0%) | 0 (0.0%) |
| 5 to 9 Year Old | 159 (94.1%) | 10 (5.9%) |
| 10 to 14 Year Olds | 259 (84.9%) | 46 (15.1%) |
| 15 to 17 Year Olds | 188 (100.0%) | 0 (0.0%) |
| 18 to 19 Year Olds | 69 (76.7%) | 21 (23.3%) |
| 20 to 24 Year Olds | 70 (85.4%) | 12 (14.6%) |
| 25 to 34 Year Olds | 6 (54.5%) | 5 (45.5%) |
| 35 Years and over | 86 (45.5%) | 103 (54.5%) |
| Total | 844 (81.1%) | 197 (18.9%) |
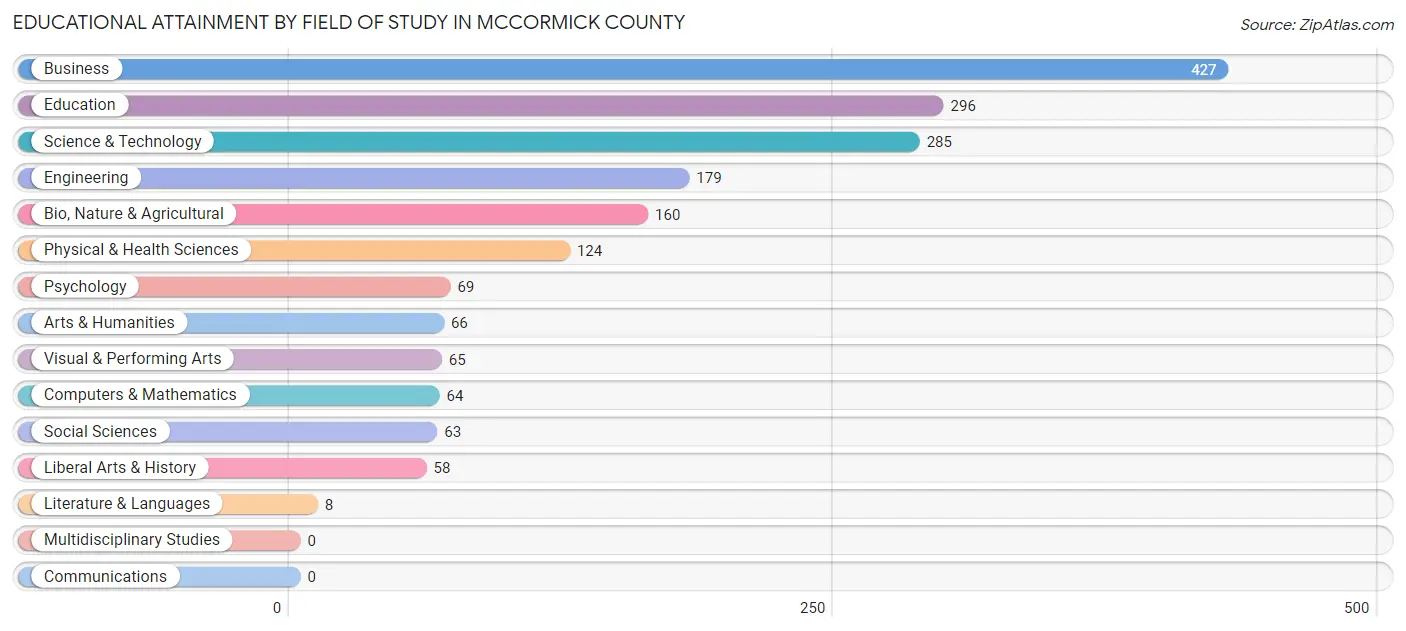
Educational Attainment by Field of Study in McCormick County
Business (427 | 22.9%), education (296 | 15.9%), science & technology (285 | 15.3%), engineering (179 | 9.6%), and bio, nature & agricultural (160 | 8.6%) are the most common fields of study among 1,864 individuals in McCormick County who have obtained a bachelor's degree or higher.
| Field of Study | # Graduates | % Graduates |
| Computers & Mathematics | 64 | 3.4% |
| Bio, Nature & Agricultural | 160 | 8.6% |
| Physical & Health Sciences | 124 | 6.7% |
| Psychology | 69 | 3.7% |
| Social Sciences | 63 | 3.4% |
| Engineering | 179 | 9.6% |
| Multidisciplinary Studies | 0 | 0.0% |
| Science & Technology | 285 | 15.3% |
| Business | 427 | 22.9% |
| Education | 296 | 15.9% |
| Literature & Languages | 8 | 0.4% |
| Liberal Arts & History | 58 | 3.1% |
| Visual & Performing Arts | 65 | 3.5% |
| Communications | 0 | 0.0% |
| Arts & Humanities | 66 | 3.5% |
| Total | 1,864 | 100.0% |
Transportation & Commute in McCormick County
Vehicle Availability by Sex in McCormick County
The most prevalent vehicle ownership categories in McCormick County are males with 2 vehicles (599, accounting for 36.3%) and females with 2 vehicles (502, making up 39.4%).

| Vehicles Available | Male | Female |
| No Vehicle | 35 (2.1%) | 49 (3.2%) |
| 1 Vehicle | 319 (19.4%) | 364 (23.9%) |
| 2 Vehicles | 599 (36.3%) | 502 (33.0%) |
| 3 Vehicles | 439 (26.6%) | 445 (29.2%) |
| 4 Vehicles | 206 (12.5%) | 127 (8.3%) |
| 5 or more Vehicles | 51 (3.1%) | 35 (2.3%) |
| Total | 1,649 (100.0%) | 1,522 (100.0%) |
Commute Time in McCormick County
The most frequently occuring commute durations in McCormick County are 30 to 34 minutes (479 commuters, 16.0%), 40 to 44 minutes (433 commuters, 14.5%), and 45 to 59 minutes (420 commuters, 14.1%).

| Commute Time | # Commuters | % Commuters |
| Less than 5 Minutes | 177 | 5.9% |
| 5 to 9 Minutes | 209 | 7.0% |
| 10 to 14 Minutes | 332 | 11.1% |
| 15 to 19 Minutes | 175 | 5.9% |
| 20 to 24 Minutes | 150 | 5.0% |
| 25 to 29 Minutes | 168 | 5.6% |
| 30 to 34 Minutes | 479 | 16.0% |
| 35 to 39 Minutes | 73 | 2.4% |
| 40 to 44 Minutes | 433 | 14.5% |
| 45 to 59 Minutes | 420 | 14.1% |
| 60 to 89 Minutes | 161 | 5.4% |
| 90 or more Minutes | 211 | 7.1% |
Commute Time by Sex in McCormick County
The most common commute times in McCormick County are 30 to 34 minutes (275 commuters, 17.8%) for males and 40 to 44 minutes (238 commuters, 16.5%) for females.

| Commute Time | Male | Female |
| Less than 5 Minutes | 63 (4.1%) | 114 (7.9%) |
| 5 to 9 Minutes | 99 (6.4%) | 110 (7.6%) |
| 10 to 14 Minutes | 177 (11.4%) | 155 (10.8%) |
| 15 to 19 Minutes | 57 (3.7%) | 118 (8.2%) |
| 20 to 24 Minutes | 85 (5.5%) | 65 (4.5%) |
| 25 to 29 Minutes | 53 (3.4%) | 115 (8.0%) |
| 30 to 34 Minutes | 275 (17.8%) | 204 (14.2%) |
| 35 to 39 Minutes | 28 (1.8%) | 45 (3.1%) |
| 40 to 44 Minutes | 195 (12.6%) | 238 (16.5%) |
| 45 to 59 Minutes | 199 (12.9%) | 221 (15.3%) |
| 60 to 89 Minutes | 117 (7.6%) | 44 (3.1%) |
| 90 or more Minutes | 200 (12.9%) | 11 (0.8%) |
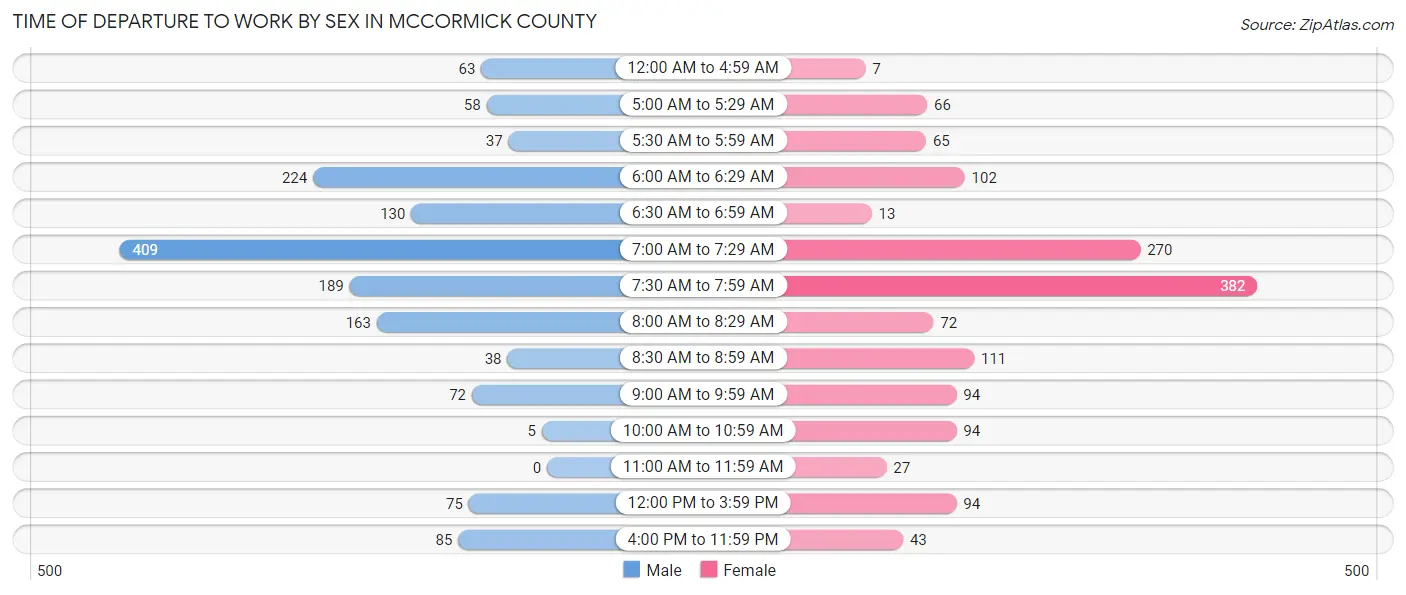
Time of Departure to Work by Sex in McCormick County
The most frequent times of departure to work in McCormick County are 7:00 AM to 7:29 AM (409, 26.4%) for males and 7:30 AM to 7:59 AM (382, 26.5%) for females.
| Time of Departure | Male | Female |
| 12:00 AM to 4:59 AM | 63 (4.1%) | 7 (0.5%) |
| 5:00 AM to 5:29 AM | 58 (3.7%) | 66 (4.6%) |
| 5:30 AM to 5:59 AM | 37 (2.4%) | 65 (4.5%) |
| 6:00 AM to 6:29 AM | 224 (14.5%) | 102 (7.1%) |
| 6:30 AM to 6:59 AM | 130 (8.4%) | 13 (0.9%) |
| 7:00 AM to 7:29 AM | 409 (26.4%) | 270 (18.8%) |
| 7:30 AM to 7:59 AM | 189 (12.2%) | 382 (26.5%) |
| 8:00 AM to 8:29 AM | 163 (10.5%) | 72 (5.0%) |
| 8:30 AM to 8:59 AM | 38 (2.5%) | 111 (7.7%) |
| 9:00 AM to 9:59 AM | 72 (4.6%) | 94 (6.5%) |
| 10:00 AM to 10:59 AM | 5 (0.3%) | 94 (6.5%) |
| 11:00 AM to 11:59 AM | 0 (0.0%) | 27 (1.9%) |
| 12:00 PM to 3:59 PM | 75 (4.8%) | 94 (6.5%) |
| 4:00 PM to 11:59 PM | 85 (5.5%) | 43 (3.0%) |
| Total | 1,548 (100.0%) | 1,440 (100.0%) |
Housing Occupancy in McCormick County
Occupancy by Ownership in McCormick County
Of the total 3,947 dwellings in McCormick County, owner-occupied units account for 3,310 (83.9%), while renter-occupied units make up 637 (16.1%).

| Occupancy | # Housing Units | % Housing Units |
| Owner Occupied Housing Units | 3,310 | 83.9% |
| Renter-Occupied Housing Units | 637 | 16.1% |
| Total Occupied Housing Units | 3,947 | 100.0% |
Occupancy by Household Size in McCormick County

| Household Size | # Housing Units | % Housing Units |
| 1-Person Household | 1,214 | 30.8% |
| 2-Person Household | 2,097 | 53.1% |
| 3-Person Household | 350 | 8.9% |
| 4+ Person Household | 286 | 7.2% |
| Total Housing Units | 3,947 | 100.0% |
Occupancy by Ownership by Household Size in McCormick County

| Household Size | Owner-occupied | Renter-occupied |
| 1-Person Household | 937 (77.2%) | 277 (22.8%) |
| 2-Person Household | 1,904 (90.8%) | 193 (9.2%) |
| 3-Person Household | 266 (76.0%) | 84 (24.0%) |
| 4+ Person Household | 203 (71.0%) | 83 (29.0%) |
| Total Housing Units | 3,310 (83.9%) | 637 (16.1%) |
Occupancy by Educational Attainment in McCormick County

| Household Size | Owner-occupied | Renter-occupied |
| Less than High School | 518 (86.2%) | 83 (13.8%) |
| High School Diploma | 858 (76.5%) | 264 (23.5%) |
| College/Associate Degree | 965 (80.4%) | 235 (19.6%) |
| Bachelor's Degree or higher | 969 (94.6%) | 55 (5.4%) |
Occupancy by Age of Householder in McCormick County

| Age Bracket | # Households | % Households |
| Under 35 Years | 219 | 5.6% |
| 35 to 44 Years | 336 | 8.5% |
| 45 to 54 Years | 414 | 10.5% |
| 55 to 64 Years | 866 | 21.9% |
| 65 to 74 Years | 1,287 | 32.6% |
| 75 to 84 Years | 577 | 14.6% |
| 85 Years and Over | 248 | 6.3% |
| Total | 3,947 | 100.0% |
Housing Finances in McCormick County
Median Income by Occupancy in McCormick County

| Occupancy Type | # Households | Median Income |
| Owner-Occupied | 3,310 (83.9%) | $60,909 |
| Renter-Occupied | 637 (16.1%) | $28,399 |
| Average | 3,947 (100.0%) | $55,569 |
Occupancy by Householder Income Bracket in McCormick County

| Income Bracket | Owner-occupied | Renter-occupied |
| Less than $5,000 | 77 (2.3%) | 77 (12.1%) |
| $5,000 to $9,999 | 110 (3.3%) | 52 (8.2%) |
| $10,000 to $14,999 | 150 (4.5%) | 95 (14.9%) |
| $15,000 to $19,999 | 178 (5.4%) | 51 (8.0%) |
| $20,000 to $24,999 | 115 (3.5%) | 14 (2.2%) |
| $25,000 to $34,999 | 317 (9.6%) | 88 (13.8%) |
| $35,000 to $49,999 | 362 (10.9%) | 88 (13.8%) |
| $50,000 to $74,999 | 614 (18.5%) | 56 (8.8%) |
| $75,000 to $99,999 | 575 (17.4%) | 90 (14.1%) |
| $100,000 to $149,999 | 509 (15.4%) | 26 (4.1%) |
| $150,000 or more | 303 (9.1%) | 0 (0.0%) |
| Total | 3,310 (100.0%) | 637 (100.0%) |
Monthly Housing Cost Tiers in McCormick County

| Monthly Cost | Owner-occupied | Renter-occupied |
| Less than $300 | 431 (13.0%) | 33 (5.2%) |
| $300 to $499 | 788 (23.8%) | 110 (17.3%) |
| $500 to $799 | 1,015 (30.7%) | 172 (27.0%) |
| $800 to $999 | 274 (8.3%) | 194 (30.5%) |
| $1,000 to $1,499 | 395 (11.9%) | 23 (3.6%) |
| $1,500 to $1,999 | 172 (5.2%) | 52 (8.2%) |
| $2,000 to $2,499 | 96 (2.9%) | 10 (1.6%) |
| $2,500 to $2,999 | 81 (2.5%) | 0 (0.0%) |
| $3,000 or more | 58 (1.8%) | 0 (0.0%) |
| Total | 3,310 (100.0%) | 637 (100.0%) |
Physical Housing Characteristics in McCormick County
Housing Structures in McCormick County

| Structure Type | # Housing Units | % Housing Units |
| Single Unit, Detached | 3,050 | 77.3% |
| Single Unit, Attached | 17 | 0.4% |
| 2 Unit Apartments | 49 | 1.2% |
| 3 or 4 Unit Apartments | 100 | 2.5% |
| 5 to 9 Unit Apartments | 74 | 1.9% |
| 10 or more Apartments | 16 | 0.4% |
| Mobile Home / Other | 641 | 16.2% |
| Total | 3,947 | 100.0% |
Housing Structures by Occupancy in McCormick County

| Structure Type | Owner-occupied | Renter-occupied |
| Single Unit, Detached | 2,744 (90.0%) | 306 (10.0%) |
| Single Unit, Attached | 17 (100.0%) | 0 (0.0%) |
| 2 Unit Apartments | 0 (0.0%) | 49 (100.0%) |
| 3 or 4 Unit Apartments | 28 (28.0%) | 72 (72.0%) |
| 5 to 9 Unit Apartments | 0 (0.0%) | 74 (100.0%) |
| 10 or more Apartments | 0 (0.0%) | 16 (100.0%) |
| Mobile Home / Other | 521 (81.3%) | 120 (18.7%) |
| Total | 3,310 (83.9%) | 637 (16.1%) |
Housing Structures by Number of Rooms in McCormick County

| Number of Rooms | Owner-occupied | Renter-occupied |
| 1 Room | 5 (0.2%) | 8 (1.3%) |
| 2 or 3 Rooms | 72 (2.2%) | 70 (11.0%) |
| 4 or 5 Rooms | 1,203 (36.3%) | 443 (69.5%) |
| 6 or 7 Rooms | 1,301 (39.3%) | 73 (11.5%) |
| 8 or more Rooms | 729 (22.0%) | 43 (6.8%) |
| Total | 3,310 (100.0%) | 637 (100.0%) |
Housing Structure by Heating Type in McCormick County

| Heating Type | Owner-occupied | Renter-occupied |
| Utility Gas | 139 (4.2%) | 95 (14.9%) |
| Bottled, Tank, or LP Gas | 424 (12.8%) | 30 (4.7%) |
| Electricity | 2,568 (77.6%) | 512 (80.4%) |
| Fuel Oil or Kerosene | 101 (3.0%) | 0 (0.0%) |
| Coal or Coke | 0 (0.0%) | 0 (0.0%) |
| All other Fuels | 67 (2.0%) | 0 (0.0%) |
| No Fuel Used | 11 (0.3%) | 0 (0.0%) |
| Total | 3,310 (100.0%) | 637 (100.0%) |
Household Vehicle Usage in McCormick County

| Vehicles per Household | Owner-occupied | Renter-occupied |
| No Vehicle | 69 (2.1%) | 131 (20.6%) |
| 1 Vehicle | 946 (28.6%) | 378 (59.3%) |
| 2 Vehicles | 1,431 (43.2%) | 58 (9.1%) |
| 3 or more Vehicles | 864 (26.1%) | 70 (11.0%) |
| Total | 3,310 (100.0%) | 637 (100.0%) |
Real Estate & Mortgages in McCormick County
Real Estate and Mortgage Overview in McCormick County
| Characteristic | Without Mortgage | With Mortgage |
| Housing Units | 2,062 | 1,248 |
| Median Property Value | $114,200 | $136,600 |
| Median Household Income | $55,290 | $141 |
| Monthly Housing Costs | $466 | $58 |
| Real Estate Taxes | $795 | $97 |
Property Value by Mortgage Status in McCormick County

| Property Value | Without Mortgage | With Mortgage |
| Less than $50,000 | 307 (14.9%) | 128 (10.3%) |
| $50,000 to $99,999 | 596 (28.9%) | 349 (28.0%) |
| $100,000 to $299,999 | 715 (34.7%) | 328 (26.3%) |
| $300,000 to $499,999 | 308 (14.9%) | 214 (17.2%) |
| $500,000 to $749,999 | 107 (5.2%) | 150 (12.0%) |
| $750,000 to $999,999 | 6 (0.3%) | 58 (4.6%) |
| $1,000,000 or more | 23 (1.1%) | 21 (1.7%) |
| Total | 2,062 (100.0%) | 1,248 (100.0%) |
Household Income by Mortgage Status in McCormick County
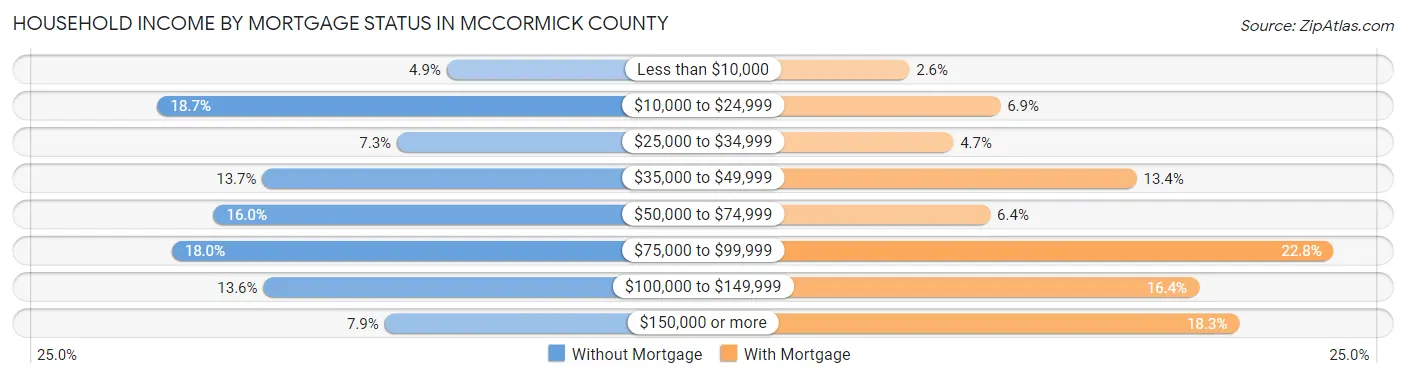
| Household Income | Without Mortgage | With Mortgage |
| Less than $10,000 | 101 (4.9%) | 32 (2.6%) |
| $10,000 to $24,999 | 385 (18.7%) | 86 (6.9%) |
| $25,000 to $34,999 | 150 (7.3%) | 58 (4.6%) |
| $35,000 to $49,999 | 282 (13.7%) | 167 (13.4%) |
| $50,000 to $74,999 | 330 (16.0%) | 80 (6.4%) |
| $75,000 to $99,999 | 371 (18.0%) | 284 (22.8%) |
| $100,000 to $149,999 | 281 (13.6%) | 204 (16.4%) |
| $150,000 or more | 162 (7.9%) | 228 (18.3%) |
| Total | 2,062 (100.0%) | 1,248 (100.0%) |
Property Value to Household Income Ratio in McCormick County

| Value-to-Income Ratio | Without Mortgage | With Mortgage |
| Less than 2.0x | 909 (44.1%) | 69,274 (5,550.8%) |
| 2.0x to 2.9x | 434 (21.0%) | 511 (40.9%) |
| 3.0x to 3.9x | 147 (7.1%) | 175 (14.0%) |
| 4.0x or more | 548 (26.6%) | 131 (10.5%) |
| Total | 2,062 (100.0%) | 1,248 (100.0%) |
Real Estate Taxes by Mortgage Status in McCormick County
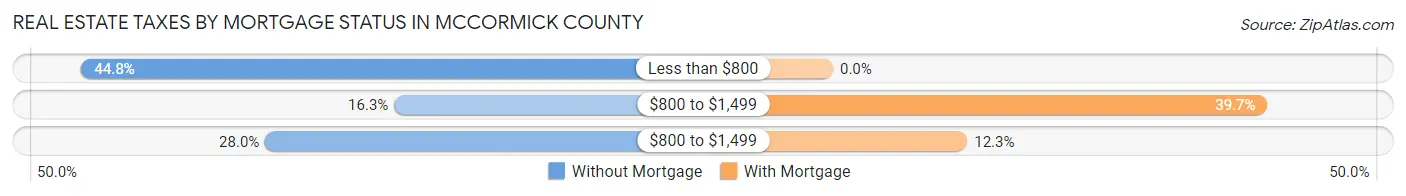
| Property Taxes | Without Mortgage | With Mortgage |
| Less than $800 | 924 (44.8%) | 0 (0.0%) |
| $800 to $1,499 | 335 (16.3%) | 495 (39.7%) |
| $800 to $1,499 | 578 (28.0%) | 153 (12.3%) |
| Total | 2,062 (100.0%) | 1,248 (100.0%) |
Health & Disability in McCormick County
Health Insurance Coverage by Age in McCormick County

| Age Bracket | With Coverage | Without Coverage |
| Under 6 Years | 254 (100.0%) | 0 (0.0%) |
| 6 to 18 Years | 767 (97.2%) | 22 (2.8%) |
| 19 to 25 Years | 547 (88.9%) | 68 (11.1%) |
| 26 to 34 Years | 356 (77.4%) | 104 (22.6%) |
| 35 to 44 Years | 723 (84.4%) | 134 (15.6%) |
| 45 to 54 Years | 687 (87.7%) | 96 (12.3%) |
| 55 to 64 Years | 1,454 (96.4%) | 54 (3.6%) |
| 65 to 74 Years | 2,139 (100.0%) | 0 (0.0%) |
| 75 Years and older | 1,254 (100.0%) | 0 (0.0%) |
| Total | 8,181 (94.5%) | 478 (5.5%) |
Health Insurance Coverage by Citizenship Status in McCormick County

| Citizenship Status | With Coverage | Without Coverage |
| Native Born | 254 (100.0%) | 0 (0.0%) |
| Foreign Born, Citizen | 767 (97.2%) | 22 (2.8%) |
| Foreign Born, not a Citizen | 547 (88.9%) | 68 (11.1%) |
Health Insurance Coverage by Household Income in McCormick County

| Household Income | With Coverage | Without Coverage |
| Under $25,000 | 1,450 (89.4%) | 172 (10.6%) |
| $25,000 to $49,999 | 1,411 (97.0%) | 44 (3.0%) |
| $50,000 to $74,999 | 1,311 (97.6%) | 32 (2.4%) |
| $75,000 to $99,999 | 1,693 (97.8%) | 39 (2.2%) |
| $100,000 and over | 2,305 (92.6%) | 185 (7.4%) |
Public vs Private Health Insurance Coverage by Age in McCormick County
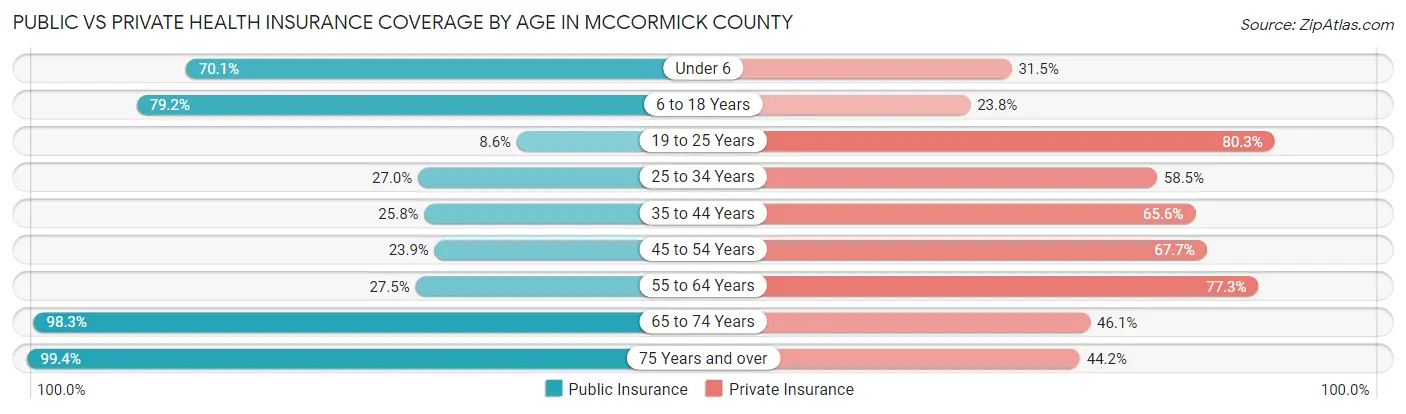
| Age Bracket | Public Insurance | Private Insurance |
| Under 6 | 178 (70.1%) | 80 (31.5%) |
| 6 to 18 Years | 625 (79.2%) | 188 (23.8%) |
| 19 to 25 Years | 53 (8.6%) | 494 (80.3%) |
| 25 to 34 Years | 124 (27.0%) | 269 (58.5%) |
| 35 to 44 Years | 221 (25.8%) | 562 (65.6%) |
| 45 to 54 Years | 187 (23.9%) | 530 (67.7%) |
| 55 to 64 Years | 414 (27.5%) | 1,166 (77.3%) |
| 65 to 74 Years | 2,103 (98.3%) | 986 (46.1%) |
| 75 Years and over | 1,247 (99.4%) | 554 (44.2%) |
| Total | 5,152 (59.5%) | 4,829 (55.8%) |
Disability Status by Sex by Age in McCormick County
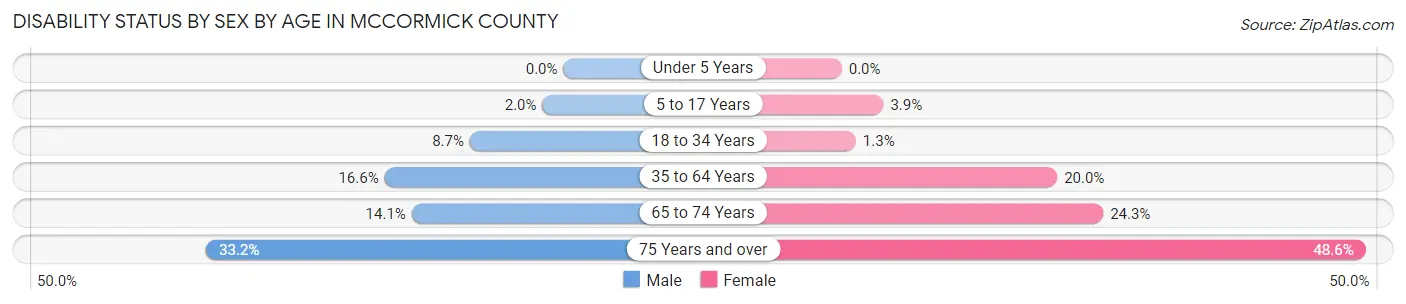
| Age Bracket | Male | Female |
| Under 5 Years | 0 (0.0%) | 0 (0.0%) |
| 5 to 17 Years | 6 (1.9%) | 16 (3.9%) |
| 18 to 34 Years | 54 (8.7%) | 7 (1.3%) |
| 35 to 64 Years | 256 (16.6%) | 321 (20.0%) |
| 65 to 74 Years | 148 (14.1%) | 264 (24.3%) |
| 75 Years and over | 190 (33.2%) | 331 (48.6%) |
Disability Class by Sex by Age in McCormick County
Disability Class: Hearing Difficulty
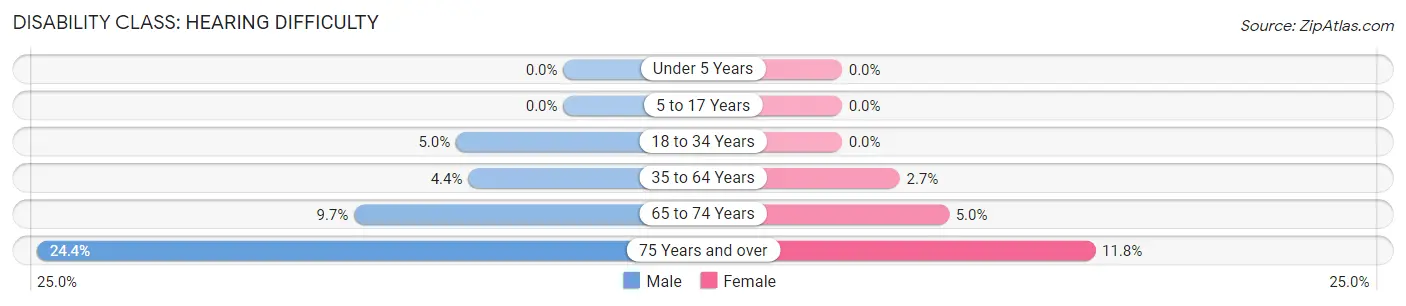
| Age Bracket | Male | Female |
| Under 5 Years | 0 (0.0%) | 0 (0.0%) |
| 5 to 17 Years | 0 (0.0%) | 0 (0.0%) |
| 18 to 34 Years | 31 (5.0%) | 0 (0.0%) |
| 35 to 64 Years | 68 (4.4%) | 43 (2.7%) |
| 65 to 74 Years | 102 (9.7%) | 54 (5.0%) |
| 75 Years and over | 140 (24.4%) | 80 (11.7%) |
Disability Class: Vision Difficulty

| Age Bracket | Male | Female |
| Under 5 Years | 0 (0.0%) | 0 (0.0%) |
| 5 to 17 Years | 0 (0.0%) | 0 (0.0%) |
| 18 to 34 Years | 0 (0.0%) | 0 (0.0%) |
| 35 to 64 Years | 28 (1.8%) | 24 (1.5%) |
| 65 to 74 Years | 29 (2.8%) | 79 (7.3%) |
| 75 Years and over | 22 (3.8%) | 83 (12.2%) |
Disability Class: Cognitive Difficulty

| Age Bracket | Male | Female |
| 5 to 17 Years | 3 (1.0%) | 16 (3.9%) |
| 18 to 34 Years | 23 (3.7%) | 7 (1.3%) |
| 35 to 64 Years | 106 (6.9%) | 82 (5.1%) |
| 65 to 74 Years | 42 (4.0%) | 90 (8.3%) |
| 75 Years and over | 49 (8.6%) | 137 (20.1%) |
Disability Class: Ambulatory Difficulty

| Age Bracket | Male | Female |
| 5 to 17 Years | 0 (0.0%) | 0 (0.0%) |
| 18 to 34 Years | 0 (0.0%) | 0 (0.0%) |
| 35 to 64 Years | 101 (6.6%) | 283 (17.6%) |
| 65 to 74 Years | 62 (5.9%) | 171 (15.7%) |
| 75 Years and over | 50 (8.7%) | 264 (38.8%) |
Disability Class: Self-Care Difficulty

| Age Bracket | Male | Female |
| 5 to 17 Years | 3 (1.0%) | 0 (0.0%) |
| 18 to 34 Years | 0 (0.0%) | 0 (0.0%) |
| 35 to 64 Years | 26 (1.7%) | 67 (4.2%) |
| 65 to 74 Years | 29 (2.8%) | 66 (6.1%) |
| 75 Years and over | 22 (3.8%) | 134 (19.7%) |
Technology Access in McCormick County
Computing Device Access in McCormick County

| Device Type | # Households | % Households |
| Desktop or Laptop | 2,457 | 62.3% |
| Smartphone | 2,957 | 74.9% |
| Tablet | 1,912 | 48.4% |
| No Computing Device | 662 | 16.8% |
| Total | 3,947 | 100.0% |
Internet Access in McCormick County

| Internet Type | # Households | % Households |
| Dial-Up Internet | 11 | 0.3% |
| Broadband Home | 2,526 | 64.0% |
| Cellular Data Only | 475 | 12.0% |
| Satellite Internet | 224 | 5.7% |
| No Internet | 863 | 21.9% |
| Total | 3,947 | 100.0% |
McCormick County Summary
Mccormick County is located in the western part of South Carolina, in the Piedmont region of the state. It is bordered by Abbeville County to the north, Greenwood County to the east, Edgefield County to the south, and Elbert County, Georgia to the west. The county seat is McCormick, and the county has a total area of 441 square miles.
History
Mccormick County was formed in 1916 from parts of Abbeville and Edgefield counties. It was named for Cyrus Hall McCormick, the inventor of the mechanical reaper. The county was originally part of the Creek Nation, and the area was home to several Native American tribes, including the Catawba, Cherokee, and Creek.
The first European settlers arrived in the area in the late 1700s, and the county was officially established in 1816. The county was largely agricultural, and cotton was the main crop. The county was also home to several sawmills and gristmills, which provided lumber and grain for the local population.
In the late 1800s, the county began to develop a manufacturing industry, with several textile mills being established. The county also became a popular tourist destination, with several resorts and hotels being built in the area.
Geography
Mccormick County is located in the western part of South Carolina, in the Piedmont region of the state. It is bordered by Abbeville County to the north, Greenwood County to the east, Edgefield County to the south, and Elbert County, Georgia to the west. The county seat is McCormick, and the county has a total area of 441 square miles.
The terrain of the county is mostly rolling hills, with some flat areas in the northern part of the county. The Savannah River forms the western border of the county, and the Little River forms the eastern border. The county is home to several lakes, including Lake Thurmond, Lake Russell, and Lake Hartwell.
Economy
Mccormick County has a diverse economy, with a mix of agriculture, manufacturing, and tourism. The county is home to several large agricultural operations, including poultry farms, cattle farms, and timber operations. The county is also home to several manufacturing companies, including textile mills, furniture factories, and automotive parts manufacturers.
The county is also a popular tourist destination, with several resorts and hotels located in the area. The county is home to several state parks, including Hickory Knob State Park and Lake Thurmond. The county is also home to several golf courses, and is a popular destination for fishing and boating.
Demographics
As of the 2010 census, Mccormick County had a population of 10,233. The population was 53.3% White, 43.2% African American, 0.5% Native American, 0.3% Asian, 0.1% Pacific Islander, and 2.6% from two or more races. The median household income was $35,945, and the median family income was $45,945.
The county is served by the McCormick County School District, which includes four elementary schools, one middle school, and one high school. The county is also home to several private schools, including the McCormick Christian Academy and the McCormick Montessori School.
Common Questions
What is the Total Population of McCormick County?
Total Population of McCormick County is 9,612.
What is the Total Male Population of McCormick County?
Total Male Population of McCormick County is 5,187.
What is the Total Female Population of McCormick County?
Total Female Population of McCormick County is 4,425.
What is the Ratio of Males per 100 Females in McCormick County?
There are 117.22 Males per 100 Females in McCormick County.
What is the Ratio of Females per 100 Males in McCormick County?
There are 85.31 Females per 100 Males in McCormick County.
What is the Median Population Age in McCormick County?
Median Population Age in McCormick County is 57.9 Years.
What is the Average Family Size in McCormick County
Average Family Size in McCormick County is 2.6 People.
What is the Average Household Size in McCormick County
Average Household Size in McCormick County is 2.2 People.
What is Per Capita Income in McCormick County?
Per Capita income in McCormick County is $32,017.
What is the Median Family Income in McCormick County?
Median Family Income in McCormick County is $76,354.
What is the Median Household income in McCormick County?
Median Household Income in McCormick County is $55,569.
What is Income or Wage Gap in McCormick County?
Income or Wage Gap in McCormick County is 18.0%.
Women in McCormick County earn 82.0 cents for every dollar earned by a man.
What is Family Income Deficit in McCormick County?
Family Income Deficit in McCormick County is $12,458.
Families that are below poverty line in McCormick County earn $12,458 less on average than the poverty threshold level.
What is Inequality or Gini Index in McCormick County?
Inequality or Gini Index in McCormick County is 0.46.
How Large is the Labor Force in McCormick County?
There are 3,486 People in the Labor Forcein in McCormick County.
What is the Percentage of People in the Labor Force in McCormick County?
40.0% of People are in the Labor Force in McCormick County.
What is the Unemployment Rate in McCormick County?
Unemployment Rate in McCormick County is 6.4%.