Jasper County, SC
Jasper County Map

Jasper County Overview
29,444
TOTAL POPULATION
14,678
MALE POPULATION
14,766
FEMALE POPULATION
99.40
MALES / 100 FEMALES
100.60
FEMALES / 100 MALES
43.6
MEDIAN AGE
2.9
AVG FAMILY SIZE
2.4
AVG HOUSEHOLD SIZE
$31,228
PER CAPITA INCOME
$67,643
AVG FAMILY INCOME
$60,452
AVG HOUSEHOLD INCOME
22.0%
WAGE / INCOME GAP [ % ]
78.0¢/ $1
WAGE / INCOME GAP [ $ ]
0.46
INEQUALITY / GINI INDEX
13,023
LABOR FORCE [ PEOPLE ]
53.5%
PERCENT IN LABOR FORCE
6.3%
UNEMPLOYMENT RATE
Jasper County Area Codes
Race in Jasper County
The most populous races in Jasper County are White / Caucasian (14,314 | 48.6%), Black / African American (10,993 | 37.3%), and Hispanic or Latino (4,153 | 14.1%).

| Race | # Population | % Population |
| Asian | 177 | 0.6% |
| Black / African American | 10,993 | 37.3% |
| Hawaiian / Pacific | 0 | 0.0% |
| Hispanic or Latino | 4,153 | 14.1% |
| Native / Alaskan | 68 | 0.2% |
| White / Caucasian | 14,314 | 48.6% |
| Two or more Races | 1,964 | 6.7% |
| Some other Race | 1,928 | 6.6% |
| Total | 29,444 | 100.0% |
Ancestry in Jasper County
The most populous ancestries reported in Jasper County are German (2,335 | 7.9%), Irish (2,263 | 7.7%), Mexican (2,018 | 6.9%), English (1,642 | 5.6%), and American (1,535 | 5.2%), together accounting for 33.3% of all Jasper County residents.

| Ancestry | # Population | % Population |
| African | 414 | 1.4% |
| American | 1,535 | 5.2% |
| Arab | 105 | 0.4% |
| Argentinean | 13 | 0.0% |
| Armenian | 10 | 0.0% |
| Australian | 45 | 0.2% |
| Austrian | 18 | 0.1% |
| Barbadian | 27 | 0.1% |
| Bhutanese | 76 | 0.3% |
| Bolivian | 124 | 0.4% |
| British | 161 | 0.5% |
| Burmese | 93 | 0.3% |
| Canadian | 191 | 0.6% |
| Celtic | 11 | 0.0% |
| Central American | 1,127 | 3.8% |
| Cherokee | 126 | 0.4% |
| Choctaw | 24 | 0.1% |
| Colombian | 104 | 0.4% |
| Costa Rican | 82 | 0.3% |
| Croatian | 14 | 0.1% |
| Cuban | 101 | 0.3% |
| Czech | 52 | 0.2% |
| Danish | 24 | 0.1% |
| Dominican | 16 | 0.1% |
| Dutch | 293 | 1.0% |
| Eastern European | 79 | 0.3% |
| Egyptian | 6 | 0.0% |
| English | 1,642 | 5.6% |
| Ethiopian | 2 | 0.0% |
| European | 262 | 0.9% |
| French | 344 | 1.2% |
| French American Indian | 8 | 0.0% |
| French Canadian | 212 | 0.7% |
| German | 2,335 | 7.9% |
| Greek | 52 | 0.2% |
| Guatemalan | 284 | 1.0% |
| Haitian | 26 | 0.1% |
| Honduran | 715 | 2.4% |
| Hungarian | 37 | 0.1% |
| Indian (Asian) | 11 | 0.0% |
| Irish | 2,263 | 7.7% |
| Italian | 958 | 3.3% |
| Jamaican | 26 | 0.1% |
| Korean | 30 | 0.1% |
| Lebanese | 64 | 0.2% |
| Lithuanian | 26 | 0.1% |
| Lumbee | 5 | 0.0% |
| Malaysian | 147 | 0.5% |
| Mexican | 2,018 | 6.9% |
| Nicaraguan | 46 | 0.2% |
| Norwegian | 119 | 0.4% |
| Pakistani | 145 | 0.5% |
| Polish | 330 | 1.1% |
| Portuguese | 46 | 0.2% |
| Pueblo | 59 | 0.2% |
| Puerto Rican | 270 | 0.9% |
| Romanian | 29 | 0.1% |
| Russian | 54 | 0.2% |
| Scandinavian | 46 | 0.2% |
| Scotch-Irish | 271 | 0.9% |
| Scottish | 379 | 1.3% |
| Seminole | 2 | 0.0% |
| Slavic | 39 | 0.1% |
| Slovak | 14 | 0.1% |
| South American | 276 | 0.9% |
| Spaniard | 64 | 0.2% |
| Subsaharan African | 421 | 1.4% |
| Swedish | 175 | 0.6% |
| Swiss | 69 | 0.2% |
| Trinidadian and Tobagonian | 40 | 0.1% |
| Ukrainian | 73 | 0.3% |
| Venezuelan | 35 | 0.1% |
| Welsh | 58 | 0.2% | View All 73 Rows |
Immigrants in Jasper County
The most numerous immigrant groups reported in Jasper County came from Latin America (2,289 | 7.8%), Central America (1,754 | 6.0%), Mexico (1,118 | 3.8%), Honduras (453 | 1.5%), and Caribbean (329 | 1.1%), together accounting for 20.2% of all Jasper County residents.

| Immigration Origin | # Population | % Population |
| Africa | 6 | 0.0% |
| Argentina | 13 | 0.0% |
| Asia | 174 | 0.6% |
| Bolivia | 67 | 0.2% |
| Canada | 126 | 0.4% |
| Caribbean | 329 | 1.1% |
| Central America | 1,754 | 6.0% |
| China | 21 | 0.1% |
| Colombia | 93 | 0.3% |
| Costa Rica | 33 | 0.1% |
| Cuba | 101 | 0.3% |
| Dominican Republic | 16 | 0.1% |
| Eastern Asia | 81 | 0.3% |
| Eastern Europe | 58 | 0.2% |
| England | 44 | 0.2% |
| Europe | 322 | 1.1% |
| Germany | 173 | 0.6% |
| Guatemala | 118 | 0.4% |
| Guyana | 10 | 0.0% |
| Honduras | 453 | 1.5% |
| Hungary | 15 | 0.1% |
| Israel | 28 | 0.1% |
| Italy | 5 | 0.0% |
| Jamaica | 212 | 0.7% |
| Japan | 6 | 0.0% |
| Korea | 54 | 0.2% |
| Laos | 22 | 0.1% |
| Latin America | 2,289 | 7.8% |
| Mexico | 1,118 | 3.8% |
| Nicaragua | 32 | 0.1% |
| Northern Europe | 68 | 0.2% |
| Philippines | 23 | 0.1% |
| Scotland | 11 | 0.0% |
| South America | 206 | 0.7% |
| South Eastern Asia | 65 | 0.2% |
| Southern Europe | 23 | 0.1% |
| Spain | 18 | 0.1% |
| Sweden | 13 | 0.0% |
| Thailand | 20 | 0.1% |
| Ukraine | 43 | 0.2% |
| Uruguay | 12 | 0.0% |
| Venezuela | 11 | 0.0% |
| Western Africa | 6 | 0.0% |
| Western Asia | 28 | 0.1% |
| Western Europe | 173 | 0.6% | View All 45 Rows |
Sex and Age in Jasper County
Sex and Age in Jasper County
The most populous age groups in Jasper County are 60 to 64 Years (1,126 | 7.7%) for men and 60 to 64 Years (1,331 | 9.0%) for women.

| Age Bracket | Male | Female |
| Under 5 Years | 746 (5.1%) | 885 (6.0%) |
| 5 to 9 Years | 720 (4.9%) | 919 (6.2%) |
| 10 to 14 Years | 823 (5.6%) | 594 (4.0%) |
| 15 to 19 Years | 896 (6.1%) | 634 (4.3%) |
| 20 to 24 Years | 1,107 (7.5%) | 758 (5.1%) |
| 25 to 29 Years | 959 (6.5%) | 1,118 (7.6%) |
| 30 to 34 Years | 775 (5.3%) | 609 (4.1%) |
| 35 to 39 Years | 1,036 (7.1%) | 1,039 (7.0%) |
| 40 to 44 Years | 936 (6.4%) | 583 (4.0%) |
| 45 to 49 Years | 815 (5.6%) | 857 (5.8%) |
| 50 to 54 Years | 876 (6.0%) | 800 (5.4%) |
| 55 to 59 Years | 1,025 (7.0%) | 1,216 (8.2%) |
| 60 to 64 Years | 1,126 (7.7%) | 1,331 (9.0%) |
| 65 to 69 Years | 929 (6.3%) | 1,236 (8.4%) |
| 70 to 74 Years | 960 (6.5%) | 1,034 (7.0%) |
| 75 to 79 Years | 444 (3.0%) | 625 (4.2%) |
| 80 to 84 Years | 315 (2.1%) | 235 (1.6%) |
| 85 Years and over | 190 (1.3%) | 293 (2.0%) |
| Total | 14,678 (100.0%) | 14,766 (100.0%) |
Families and Households in Jasper County
Median Family Size in Jasper County
The median family size in Jasper County is 2.92 persons per family, with single female/mother families (1,707 | 22.3%) accounting for the largest median family size of 3.26 persons per family. On the other hand, married-couple families (5,511 | 72.1%) represent the smallest median family size with 2.80 persons per family.

| Family Type | # Families | Family Size |
| Married-Couple | 5,511 (72.1%) | 2.80 |
| Single Male/Father | 423 (5.5%) | 3.08 |
| Single Female/Mother | 1,707 (22.3%) | 3.26 |
| Total Families | 7,641 (100.0%) | 2.92 |
Median Household Size in Jasper County
The median household size in Jasper County is 2.43 persons per household, with single female/mother households (1,707 | 14.5%) accounting for the largest median household size of 3.61 persons per household. non-family households (4,154 | 35.2%) represent the smallest median household size with 1.28 persons per household.

| Household Type | # Households | Household Size |
| Married-Couple | 5,511 (46.7%) | 2.85 |
| Single Male/Father | 423 (3.6%) | 3.47 |
| Single Female/Mother | 1,707 (14.5%) | 3.61 |
| Non-family | 4,154 (35.2%) | 1.28 |
| Total Households | 11,795 (100.0%) | 2.43 |
Household Size by Marriage Status in Jasper County
Out of a total of 11,795 households in Jasper County, 7,641 (64.8%) are family households, while 4,154 (35.2%) are nonfamily households. The most numerous type of family households are 2-person households, comprising 4,447, and the most common type of nonfamily households are 1-person households, comprising 3,366.

| Household Size | Family Households | Nonfamily Households |
| 1-Person Households | - | 3,366 (28.5%) |
| 2-Person Households | 4,447 (37.7%) | 478 (4.1%) |
| 3-Person Households | 1,400 (11.9%) | 145 (1.2%) |
| 4-Person Households | 1,005 (8.5%) | 0 (0.0%) |
| 5-Person Households | 494 (4.2%) | 165 (1.4%) |
| 6-Person Households | 164 (1.4%) | 0 (0.0%) |
| 7+ Person Households | 131 (1.1%) | 0 (0.0%) |
| Total | 7,641 (64.8%) | 4,154 (35.2%) |
Female Fertility in Jasper County
Fertility by Age in Jasper County
Average fertility rate in Jasper County is 89.0 births per 1,000 women. Women in the age bracket of 20 to 34 years have the highest fertility rate with 135.0 births per 1,000 women. Women in the age bracket of 20 to 34 years acount for 65.7% of all women with births.

| Age Bracket | Women with Births | Births / 1,000 Women |
| 15 to 19 years | 0 (0.0%) | 0.0 |
| 20 to 34 years | 335 (65.7%) | 135.0 |
| 35 to 50 years | 175 (34.3%) | 67.0 |
| Total | 510 (100.0%) | 89.0 |
Fertility by Age by Marriage Status in Jasper County
60.6% of women with births (510) in Jasper County are married. The highest percentage of unmarried women with births falls into 20 to 34 years age bracket with 55.8% of them unmarried at the time of birth, while the lowest percentage of unmarried women with births belong to 35 to 50 years age bracket with 8.0% of them unmarried.
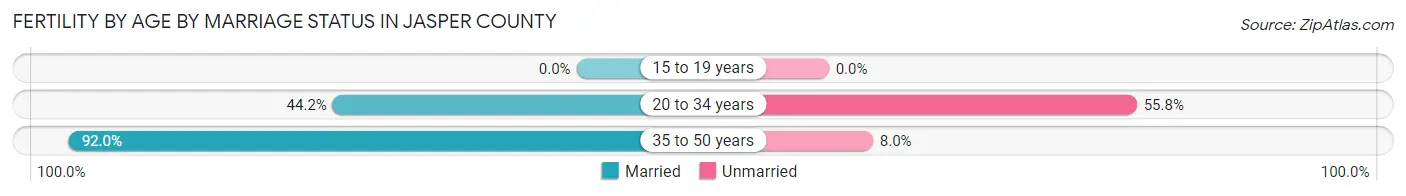
| Age Bracket | Married | Unmarried |
| 15 to 19 years | 0 (0.0%) | 0 (0.0%) |
| 20 to 34 years | 148 (44.2%) | 187 (55.8%) |
| 35 to 50 years | 161 (92.0%) | 14 (8.0%) |
| Total | 309 (60.6%) | 201 (39.4%) |
Fertility by Education in Jasper County

| Educational Attainment | Women with Births | Births / 1,000 Women |
| Less than High School | 0 (0.0%) | 0.0 |
| High School Diploma | 52 (10.2%) | 35.0 |
| College or Associate's Degree | 298 (58.4%) | 123.0 |
| Bachelor's Degree | 160 (31.4%) | 199.0 |
| Graduate Degree | 0 (0.0%) | 0.0 |
| Total | 510 (100.0%) | 89.0 |
Fertility by Education by Marriage Status in Jasper County
39.4% of women with births in Jasper County are unmarried. Women with the educational attainment of college or associate's degree are most likely to be married with 83.6% of them married at childbirth, while women with the educational attainment of bachelor's degree are least likely to be married with 81.9% of them unmarried at childbirth.

| Educational Attainment | Married | Unmarried |
| Less than High School | 0 (0.0%) | 0 (0.0%) |
| High School Diploma | 31 (59.6%) | 21 (40.4%) |
| College or Associate's Degree | 249 (83.6%) | 49 (16.4%) |
| Bachelor's Degree | 29 (18.1%) | 131 (81.9%) |
| Graduate Degree | 0 (0.0%) | 0 (0.0%) |
| Total | 309 (60.6%) | 201 (39.4%) |
Income in Jasper County
Income Overview in Jasper County
Per Capita Income in Jasper County is $31,228, while median incomes of families and households are $67,643 and $60,452 respectively.
| Characteristic | Number | Measure |
| Per Capita Income | 29,444 | $31,228 |
| Median Family Income | 7,641 | $67,643 |
| Mean Family Income | 7,641 | $89,256 |
| Median Household Income | 11,795 | $60,452 |
| Mean Household Income | 11,795 | $75,441 |
| Income Deficit | 7,641 | $0 |
| Wage / Income Gap (%) | 29,444 | 21.98% |
| Wage / Income Gap ($) | 29,444 | 78.02¢ per $1 |
| Gini / Inequality Index | 29,444 | 0.46 |
Earnings by Sex in Jasper County
Average Earnings in Jasper County are $32,829, $36,420 for men and $28,416 for women, a difference of 22.0%.

| Sex | Number | Average Earnings |
| Male | 7,111 (51.8%) | $36,420 |
| Female | 6,616 (48.2%) | $28,416 |
| Total | 13,727 (100.0%) | $32,829 |
Earnings by Sex by Income Bracket in Jasper County
The most common earnings brackets in Jasper County are $100,000+ for men (897 | 12.6%) and $30,000 to $34,999 for women (885 | 13.4%).

| Income | Male | Female |
| $2,499 or less | 351 (4.9%) | 535 (8.1%) |
| $2,500 to $4,999 | 161 (2.3%) | 383 (5.8%) |
| $5,000 to $7,499 | 359 (5.1%) | 174 (2.6%) |
| $7,500 to $9,999 | 116 (1.6%) | 183 (2.8%) |
| $10,000 to $12,499 | 274 (3.8%) | 304 (4.6%) |
| $12,500 to $14,999 | 121 (1.7%) | 201 (3.0%) |
| $15,000 to $17,499 | 123 (1.7%) | 202 (3.0%) |
| $17,500 to $19,999 | 173 (2.4%) | 142 (2.1%) |
| $20,000 to $22,499 | 117 (1.7%) | 422 (6.4%) |
| $22,500 to $24,999 | 253 (3.6%) | 410 (6.2%) |
| $25,000 to $29,999 | 441 (6.2%) | 537 (8.1%) |
| $30,000 to $34,999 | 786 (11.1%) | 885 (13.4%) |
| $35,000 to $39,999 | 782 (11.0%) | 671 (10.1%) |
| $40,000 to $44,999 | 206 (2.9%) | 327 (4.9%) |
| $45,000 to $49,999 | 362 (5.1%) | 260 (3.9%) |
| $50,000 to $54,999 | 126 (1.8%) | 95 (1.4%) |
| $55,000 to $64,999 | 570 (8.0%) | 206 (3.1%) |
| $65,000 to $74,999 | 337 (4.7%) | 204 (3.1%) |
| $75,000 to $99,999 | 556 (7.8%) | 290 (4.4%) |
| $100,000+ | 897 (12.6%) | 185 (2.8%) |
| Total | 7,111 (100.0%) | 6,616 (100.0%) |
Earnings by Sex by Educational Attainment in Jasper County
Average earnings in Jasper County are $39,293 for men and $30,189 for women, a difference of 23.2%. Men with an educational attainment of graduate degree enjoy the highest average annual earnings of $120,026, while those with less than high school education earn the least with $30,091. Women with an educational attainment of graduate degree earn the most with the average annual earnings of $49,516, while those with less than high school education have the smallest earnings of $25,025.

| Educational Attainment | Male Income | Female Income |
| Less than High School | $30,091 | $25,025 |
| High School Diploma | $37,168 | $26,477 |
| College or Associate's Degree | $45,560 | $31,069 |
| Bachelor's Degree | $53,821 | $28,583 |
| Graduate Degree | $120,026 | $49,516 |
| Total | $39,293 | $30,189 |
Family Income in Jasper County
Family Income Brackets in Jasper County
According to the Jasper County family income data, there are 1,727 families falling into the $50,000 to $74,999 income range, which is the most common income bracket and makes up 22.6% of all families. Conversely, the $10,000 to $14,999 income bracket is the least frequent group with only 199 families (2.6%) belonging to this category.

| Income Bracket | # Families | % Families |
| Less than $10,000 | 367 | 4.8% |
| $10,000 to $14,999 | 199 | 2.6% |
| $15,000 to $24,999 | 382 | 5.0% |
| $25,000 to $34,999 | 413 | 5.4% |
| $35,000 to $49,999 | 1,223 | 16.0% |
| $50,000 to $74,999 | 1,727 | 22.6% |
| $75,000 to $99,999 | 1,108 | 14.5% |
| $100,000 to $149,999 | 1,245 | 16.3% |
| $150,000 to $199,999 | 497 | 6.5% |
| $200,000+ | 481 | 6.3% |
Family Income by Famaliy Size in Jasper County
7+ person families (131 | 1.7%) account for the highest median family income in Jasper County with $77,634 per family, while 2-person families (4,599 | 60.2%) have the highest median income of $35,234 per family member.
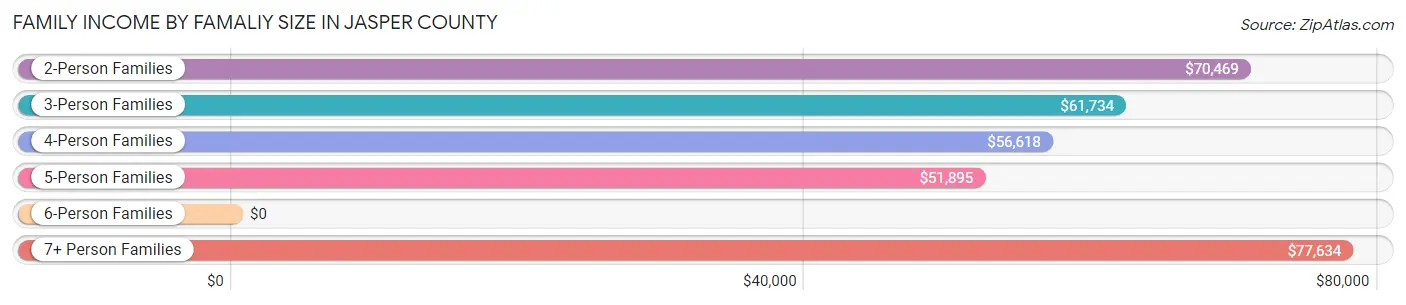
| Income Bracket | # Families | Median Income |
| 2-Person Families | 4,599 (60.2%) | $70,469 |
| 3-Person Families | 1,452 (19.0%) | $61,734 |
| 4-Person Families | 1,098 (14.4%) | $56,618 |
| 5-Person Families | 307 (4.0%) | $51,895 |
| 6-Person Families | 54 (0.7%) | $0 |
| 7+ Person Families | 131 (1.7%) | $77,634 |
| Total | 7,641 (100.0%) | $67,643 |
Family Income by Number of Earners in Jasper County
The median family income in Jasper County is $67,643, with families comprising 3+ earners (560) having the highest median family income of $90,473, while families with no earners (1,905) have the lowest median family income of $53,828, accounting for 7.3% and 24.9% of families, respectively.

| Number of Earners | # Families | Median Income |
| No Earners | 1,905 (24.9%) | $53,828 |
| 1 Earner | 2,781 (36.4%) | $55,707 |
| 2 Earners | 2,395 (31.3%) | $88,250 |
| 3+ Earners | 560 (7.3%) | $90,473 |
| Total | 7,641 (100.0%) | $67,643 |
Household Income in Jasper County
Household Income Brackets in Jasper County
With 2,253 households falling in the category, the $50,000 to $74,999 income range is the most frequent in Jasper County, accounting for 19.1% of all households. In contrast, only 507 households (4.3%) fall into the $200,000+ income bracket, making it the least populous group.

| Income Bracket | # Households | % Households |
| Less than $10,000 | 1,168 | 9.9% |
| $10,000 to $14,999 | 613 | 5.2% |
| $15,000 to $24,999 | 755 | 6.4% |
| $25,000 to $34,999 | 755 | 6.4% |
| $35,000 to $49,999 | 1,781 | 15.1% |
| $50,000 to $74,999 | 2,253 | 19.1% |
| $75,000 to $99,999 | 1,698 | 14.4% |
| $100,000 to $149,999 | 1,640 | 13.9% |
| $150,000 to $199,999 | 625 | 5.3% |
| $200,000+ | 507 | 4.3% |
Household Income by Householder Age in Jasper County
The median household income in Jasper County is $60,452, with the highest median household income of $68,732 found in the 45 to 64 years age bracket for the primary householder. A total of 4,283 households (36.3%) fall into this category. Meanwhile, the 15 to 24 years age bracket for the primary householder has the lowest median household income of $0, with 307 households (2.6%) in this group.

| Income Bracket | # Households | Median Income |
| 15 to 24 Years | 307 (2.6%) | $0 |
| 25 to 44 Years | 3,373 (28.6%) | $53,475 |
| 45 to 64 Years | 4,283 (36.3%) | $68,732 |
| 65+ Years | 3,832 (32.5%) | $55,521 |
| Total | 11,795 (100.0%) | $60,452 |
Poverty in Jasper County
Income Below Poverty by Sex and Age in Jasper County
With 15.8% poverty level for males and 20.0% for females among the residents of Jasper County, under 5 year old males and 5 year old females are the most vulnerable to poverty, with 254 males (39.9%) and 119 females (55.1%) in their respective age groups living below the poverty level.

| Age Bracket | Male | Female |
| Under 5 Years | 254 (39.9%) | 155 (27.5%) |
| 5 Years | 12 (8.6%) | 119 (55.1%) |
| 6 to 11 Years | 254 (32.0%) | 284 (30.4%) |
| 12 to 14 Years | 35 (5.7%) | 135 (39.1%) |
| 15 Years | 19 (10.6%) | 48 (20.4%) |
| 16 and 17 Years | 21 (7.5%) | 39 (17.3%) |
| 18 to 24 Years | 362 (24.4%) | 54 (5.8%) |
| 25 to 34 Years | 90 (5.9%) | 600 (34.7%) |
| 35 to 44 Years | 243 (13.1%) | 348 (21.4%) |
| 45 to 54 Years | 270 (17.8%) | 165 (10.0%) |
| 55 to 64 Years | 279 (13.4%) | 308 (12.1%) |
| 65 to 74 Years | 85 (4.7%) | 303 (13.5%) |
| 75 Years and over | 261 (27.7%) | 321 (28.2%) |
| Total | 2,185 (15.8%) | 2,879 (20.0%) |
Income Above Poverty by Sex and Age in Jasper County
According to the poverty statistics in Jasper County, males aged 65 to 74 years and females aged 18 to 24 years are the age groups that are most secure financially, with 95.3% of males and 94.2% of females in these age groups living above the poverty line.

| Age Bracket | Male | Female |
| Under 5 Years | 383 (60.1%) | 409 (72.5%) |
| 5 Years | 127 (91.4%) | 97 (44.9%) |
| 6 to 11 Years | 539 (68.0%) | 651 (69.6%) |
| 12 to 14 Years | 576 (94.3%) | 210 (60.9%) |
| 15 Years | 161 (89.4%) | 187 (79.6%) |
| 16 and 17 Years | 258 (92.5%) | 186 (82.7%) |
| 18 to 24 Years | 1,121 (75.6%) | 878 (94.2%) |
| 25 to 34 Years | 1,447 (94.1%) | 1,127 (65.3%) |
| 35 to 44 Years | 1,610 (86.9%) | 1,274 (78.5%) |
| 45 to 54 Years | 1,246 (82.2%) | 1,492 (90.0%) |
| 55 to 64 Years | 1,805 (86.6%) | 2,239 (87.9%) |
| 65 to 74 Years | 1,735 (95.3%) | 1,947 (86.5%) |
| 75 Years and over | 681 (72.3%) | 817 (71.8%) |
| Total | 11,689 (84.3%) | 11,514 (80.0%) |
Income Below Poverty Among Married-Couple Families in Jasper County
The poverty statistics for married-couple families in Jasper County show that 6.5% or 359 of the total 5,511 families live below the poverty line. Families with 3 or 4 children have the highest poverty rate of 23.7%, comprising of 60 families. On the other hand, families with 5 or more children have the lowest poverty rate of 0.0%, which includes 0 families.

| Children | Above Poverty | Below Poverty |
| No Children | 3,783 (94.4%) | 226 (5.6%) |
| 1 or 2 Children | 1,173 (94.1%) | 73 (5.9%) |
| 3 or 4 Children | 193 (76.3%) | 60 (23.7%) |
| 5 or more Children | 3 (100.0%) | 0 (0.0%) |
| Total | 5,152 (93.5%) | 359 (6.5%) |
Income Below Poverty Among Single-Parent Households in Jasper County
According to the poverty data in Jasper County, 16.3% or 69 single-father households and 25.5% or 435 single-mother households are living below the poverty line. Among single-father households, those with 1 or 2 children have the highest poverty rate, with 69 households (32.7%) experiencing poverty. Likewise, among single-mother households, those with 3 or 4 children have the highest poverty rate, with 94 households (52.5%) falling below the poverty line.

| Children | Single Father | Single Mother |
| No Children | 0 (0.0%) | 13 (1.8%) |
| 1 or 2 Children | 69 (32.7%) | 328 (40.5%) |
| 3 or 4 Children | 0 (0.0%) | 94 (52.5%) |
| 5 or more Children | 0 (0.0%) | 0 (0.0%) |
| Total | 69 (16.3%) | 435 (25.5%) |
Income Below Poverty Among Married-Couple vs Single-Parent Households in Jasper County
The poverty data for Jasper County shows that 359 of the married-couple family households (6.5%) and 504 of the single-parent households (23.7%) are living below the poverty level. Within the married-couple family households, those with 3 or 4 children have the highest poverty rate, with 60 households (23.7%) falling below the poverty line. Among the single-parent households, those with 3 or 4 children have the highest poverty rate, with 94 household (40.2%) living below poverty.

| Children | Married-Couple Families | Single-Parent Households |
| No Children | 226 (5.6%) | 13 (1.5%) |
| 1 or 2 Children | 73 (5.9%) | 397 (38.9%) |
| 3 or 4 Children | 60 (23.7%) | 94 (40.2%) |
| 5 or more Children | 0 (0.0%) | 0 (0.0%) |
| Total | 359 (6.5%) | 504 (23.7%) |
Employment Characteristics in Jasper County
Employment by Class of Employer in Jasper County
Among the 11,940 employed individuals in Jasper County, private company employees (8,120 | 68.0%), not-for-profit organizations (1,113 | 9.3%), and self-employed (not incorporated) (685 | 5.7%) make up the most common classes of employment.

| Employer Class | # Employees | % Employees |
| Private Company Employees | 8,120 | 68.0% |
| Self-Employed (Incorporated) | 390 | 3.3% |
| Self-Employed (Not Incorporated) | 685 | 5.7% |
| Not-for-profit Organizations | 1,113 | 9.3% |
| Local Government Employees | 603 | 5.1% |
| State Government Employees | 552 | 4.6% |
| Federal Government Employees | 477 | 4.0% |
| Unpaid Family Workers | 0 | 0.0% |
| Total | 11,940 | 100.0% |
Employment Status by Age in Jasper County
According to the labor force statistics for Jasper County, out of the total population over 16 years of age (24,342), 53.5% or 13,023 individuals are in the labor force, with 6.3% or 820 of them unemployed. The age group with the highest labor force participation rate is 25 to 29 years, with 82.4% or 1,711 individuals in the labor force. Within the labor force, the 20 to 24 years age range has the highest percentage of unemployed individuals, with 20.4% or 286 of them being unemployed.

| Age Bracket | In Labor Force | Unemployed |
| 16 to 19 Years | 322 (28.9%) | 18 (5.6%) |
| 20 to 24 Years | 1,402 (75.2%) | 286 (20.4%) |
| 25 to 29 Years | 1,711 (82.4%) | 209 (12.2%) |
| 30 to 34 Years | 889 (64.2%) | 14 (1.6%) |
| 35 to 44 Years | 2,793 (77.7%) | 134 (4.8%) |
| 45 to 54 Years | 2,471 (73.8%) | 84 (3.4%) |
| 55 to 59 Years | 1,477 (65.9%) | 15 (1.0%) |
| 60 to 64 Years | 934 (38.0%) | 49 (5.2%) |
| 65 to 74 Years | 940 (22.6%) | 13 (1.4%) |
| 75 Years and over | 84 (4.0%) | 0 (0.0%) |
| Total | 13,023 (53.5%) | 820 (6.3%) |
Employment Status by Educational Attainment in Jasper County
According to labor force statistics for Jasper County, 68.0% of individuals (10,269) out of the total population between 25 and 64 years of age (15,101) are in the labor force, with 4.9% or 503 of them being unemployed. The group with the highest labor force participation rate are those with the educational attainment of bachelor's degree or higher, with 73.6% or 2,102 individuals in the labor force. Within the labor force, individuals with high school diploma education have the highest percentage of unemployment, with 6.5% or 259 of them being unemployed.

| Educational Attainment | In Labor Force | Unemployed |
| Less than High School | 839 (51.0%) | 59 (3.6%) |
| High School Diploma | 3,984 (67.9%) | 381 (6.5%) |
| College / Associate Degree | 3,346 (70.7%) | 251 (5.3%) |
| Bachelor's Degree or higher | 2,102 (73.6%) | 49 (1.7%) |
| Total | 10,269 (68.0%) | 740 (4.9%) |
Employment Occupations by Sex in Jasper County
Management, Business, Science and Arts Occupations
The most common Management, Business, Science and Arts occupations in Jasper County are Community & Social Service (966 | 8.0%), Management (706 | 5.8%), Education Instruction & Library (667 | 5.5%), Health Diagnosing & Treating (490 | 4.0%), and Computers, Engineering & Science (431 | 3.5%).

Management, Business, Science and Arts Occupations by Sex
Within the Management, Business, Science and Arts occupations in Jasper County, the most male-oriented occupations are Architecture & Engineering (100.0%), Computers, Engineering & Science (81.2%), and Management (61.5%), while the most female-oriented occupations are Legal Services & Support (100.0%), Health Diagnosing & Treating (78.0%), and Community & Social Service (74.7%).

| Occupation | Male | Female |
| Management | 434 (61.5%) | 272 (38.5%) |
| Business & Financial | 152 (53.9%) | 130 (46.1%) |
| Computers, Engineering & Science | 350 (81.2%) | 81 (18.8%) |
| Computers & Mathematics | 95 (54.0%) | 81 (46.0%) |
| Architecture & Engineering | 255 (100.0%) | 0 (0.0%) |
| Life, Physical & Social Science | 0 (0.0%) | 0 (0.0%) |
| Community & Social Service | 244 (25.3%) | 722 (74.7%) |
| Education, Arts & Media | 28 (26.9%) | 76 (73.1%) |
| Legal Services & Support | 0 (0.0%) | 105 (100.0%) |
| Education Instruction & Library | 178 (26.7%) | 489 (73.3%) |
| Arts, Media & Entertainment | 38 (42.2%) | 52 (57.8%) |
| Health Diagnosing & Treating | 108 (22.0%) | 382 (78.0%) |
| Health Technologists | 93 (35.2%) | 171 (64.8%) |
| Total (Category) | 1,288 (44.8%) | 1,587 (55.2%) |
| Total (Overall) | 6,388 (52.6%) | 5,766 (47.4%) |
Services Occupations
The most common Services occupations in Jasper County are Cleaning & Maintenance (1,052 | 8.7%), Food Preparation & Serving (543 | 4.5%), Healthcare Support (372 | 3.1%), Security & Protection (361 | 3.0%), and Firefighting & Prevention (238 | 2.0%).
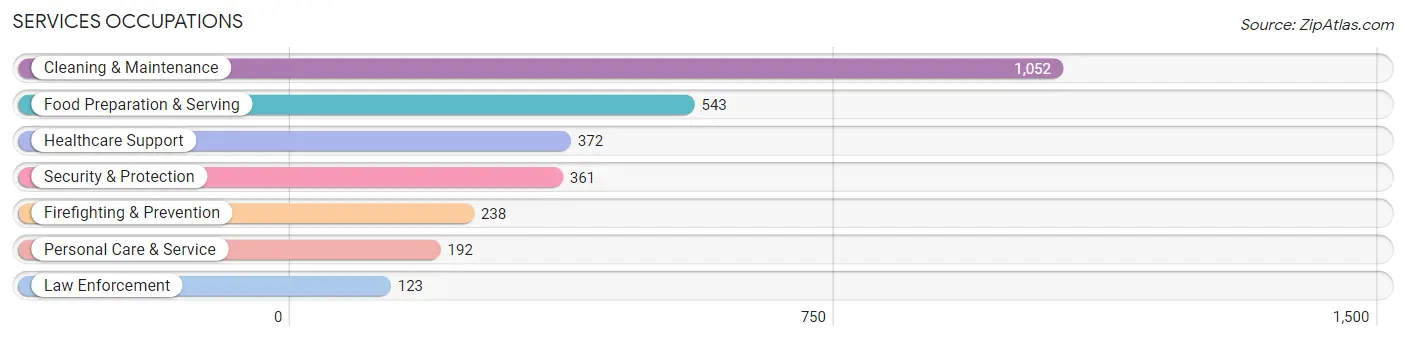
Services Occupations by Sex
Within the Services occupations in Jasper County, the most male-oriented occupations are Law Enforcement (100.0%), Security & Protection (73.7%), and Firefighting & Prevention (60.1%), while the most female-oriented occupations are Personal Care & Service (80.7%), Healthcare Support (79.0%), and Food Preparation & Serving (57.1%).

| Occupation | Male | Female |
| Healthcare Support | 78 (21.0%) | 294 (79.0%) |
| Security & Protection | 266 (73.7%) | 95 (26.3%) |
| Firefighting & Prevention | 143 (60.1%) | 95 (39.9%) |
| Law Enforcement | 123 (100.0%) | 0 (0.0%) |
| Food Preparation & Serving | 233 (42.9%) | 310 (57.1%) |
| Cleaning & Maintenance | 526 (50.0%) | 526 (50.0%) |
| Personal Care & Service | 37 (19.3%) | 155 (80.7%) |
| Total (Category) | 1,140 (45.2%) | 1,380 (54.8%) |
| Total (Overall) | 6,388 (52.6%) | 5,766 (47.4%) |
Sales and Office Occupations
The most common Sales and Office occupations in Jasper County are Office & Administration (2,082 | 17.1%), and Sales & Related (1,353 | 11.1%).
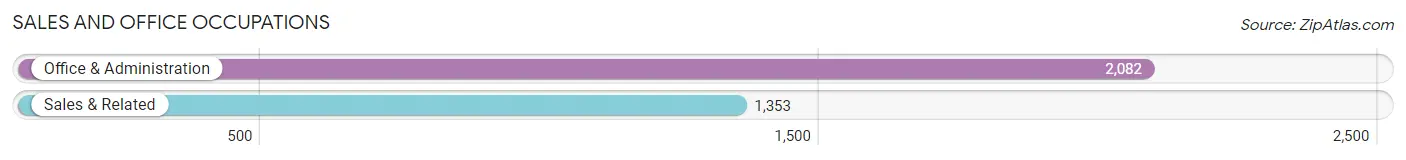
Sales and Office Occupations by Sex

| Occupation | Male | Female |
| Sales & Related | 586 (43.3%) | 767 (56.7%) |
| Office & Administration | 336 (16.1%) | 1,746 (83.9%) |
| Total (Category) | 922 (26.8%) | 2,513 (73.2%) |
| Total (Overall) | 6,388 (52.6%) | 5,766 (47.4%) |
Natural Resources, Construction and Maintenance Occupations
The most common Natural Resources, Construction and Maintenance occupations in Jasper County are Construction & Extraction (1,203 | 9.9%), Installation, Maintenance & Repair (536 | 4.4%), and Farming, Fishing & Forestry (117 | 1.0%).

Natural Resources, Construction and Maintenance Occupations by Sex

| Occupation | Male | Female |
| Farming, Fishing & Forestry | 117 (100.0%) | 0 (0.0%) |
| Construction & Extraction | 1,178 (97.9%) | 25 (2.1%) |
| Installation, Maintenance & Repair | 536 (100.0%) | 0 (0.0%) |
| Total (Category) | 1,831 (98.7%) | 25 (1.3%) |
| Total (Overall) | 6,388 (52.6%) | 5,766 (47.4%) |
Production, Transportation and Moving Occupations
The most common Production, Transportation and Moving occupations in Jasper County are Material Moving (756 | 6.2%), Production (429 | 3.5%), and Transportation (283 | 2.3%).

Production, Transportation and Moving Occupations by Sex
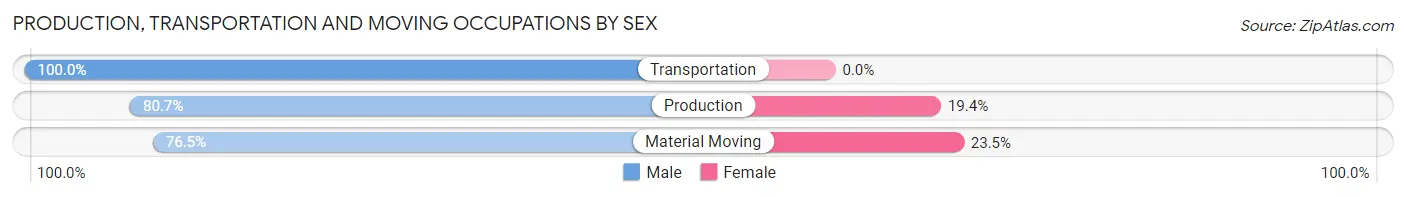
| Occupation | Male | Female |
| Production | 346 (80.6%) | 83 (19.4%) |
| Transportation | 283 (100.0%) | 0 (0.0%) |
| Material Moving | 578 (76.5%) | 178 (23.5%) |
| Total (Category) | 1,207 (82.2%) | 261 (17.8%) |
| Total (Overall) | 6,388 (52.6%) | 5,766 (47.4%) |
Employment Industries by Sex in Jasper County
Employment Industries in Jasper County
The major employment industries in Jasper County include Retail Trade (1,957 | 16.1%), Construction (1,464 | 12.0%), Health Care & Social Assistance (1,398 | 11.5%), Accommodation & Food Services (1,156 | 9.5%), and Administrative & Support (975 | 8.0%).

Employment Industries by Sex in Jasper County
The Jasper County industries that see more men than women are Utilities (90.9%), Wholesale Trade (89.8%), and Construction (89.1%), whereas the industries that tend to have a higher number of women are Finance & Insurance (84.7%), Health Care & Social Assistance (82.4%), and Enterprise Management (77.4%).

| Industry | Male | Female |
| Agriculture, Fishing & Hunting | 207 (83.8%) | 40 (16.2%) |
| Mining, Quarrying, & Extraction | 0 (0.0%) | 0 (0.0%) |
| Construction | 1,304 (89.1%) | 160 (10.9%) |
| Manufacturing | 474 (69.1%) | 212 (30.9%) |
| Wholesale Trade | 44 (89.8%) | 5 (10.2%) |
| Retail Trade | 969 (49.5%) | 988 (50.5%) |
| Transportation & Warehousing | 376 (78.8%) | 101 (21.2%) |
| Utilities | 191 (90.9%) | 19 (9.0%) |
| Information | 92 (65.2%) | 49 (34.7%) |
| Finance & Insurance | 65 (15.3%) | 360 (84.7%) |
| Real Estate, Rental & Leasing | 28 (23.3%) | 92 (76.7%) |
| Professional & Scientific | 162 (40.9%) | 234 (59.1%) |
| Enterprise Management | 14 (22.6%) | 48 (77.4%) |
| Administrative & Support | 618 (63.4%) | 357 (36.6%) |
| Educational Services | 251 (29.5%) | 600 (70.5%) |
| Health Care & Social Assistance | 246 (17.6%) | 1,152 (82.4%) |
| Arts, Entertainment & Recreation | 135 (78.5%) | 37 (21.5%) |
| Accommodation & Food Services | 530 (45.9%) | 626 (54.1%) |
| Public Administration | 305 (40.7%) | 445 (59.3%) |
| Total | 6,388 (52.6%) | 5,766 (47.4%) |
Education in Jasper County
School Enrollment in Jasper County
The most common levels of schooling among the 5,895 students in Jasper County are high school (1,485 | 25.2%), middle school (1,302 | 22.1%), and elementary school (1,294 | 22.0%).

| School Level | # Students | % Students |
| Nursery / Preschool | 391 | 6.6% |
| Kindergarten | 200 | 3.4% |
| Elementary School | 1,294 | 22.0% |
| Middle School | 1,302 | 22.1% |
| High School | 1,485 | 25.2% |
| College / Undergraduate | 939 | 15.9% |
| Graduate / Professional | 284 | 4.8% |
| Total | 5,895 | 100.0% |
School Enrollment by Age by Funding Source in Jasper County
Out of a total of 5,895 students who are enrolled in schools in Jasper County, 1,244 (21.1%) attend a private institution, while the remaining 4,651 (78.9%) are enrolled in public schools. The age group of 35 years and over has the highest likelihood of being enrolled in private schools, with 86 (48.0% in the age bracket) enrolled. Conversely, the age group of 3 to 4 year olds has the lowest likelihood of being enrolled in a private school, with 326 (97.3% in the age bracket) attending a public institution.
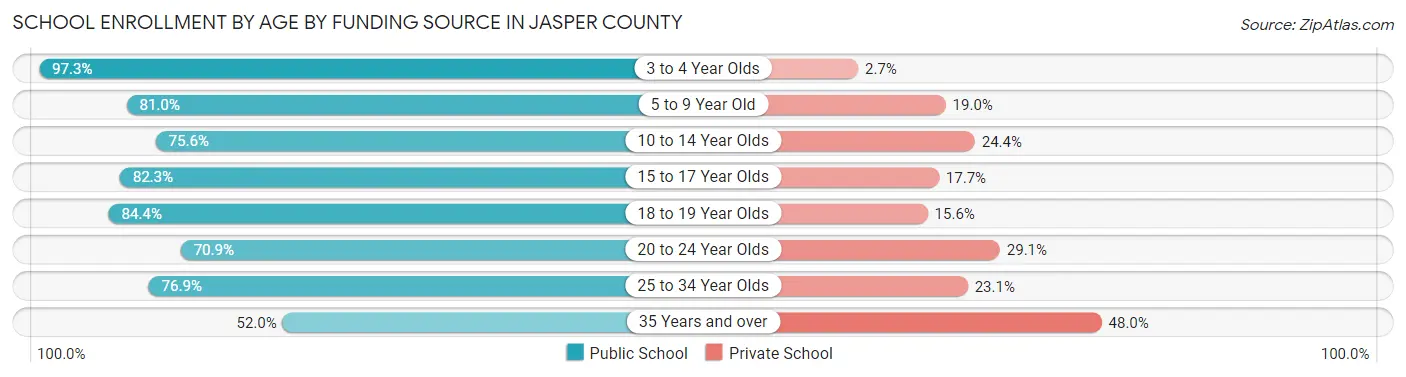
| Age Bracket | Public School | Private School |
| 3 to 4 Year Olds | 326 (97.3%) | 9 (2.7%) |
| 5 to 9 Year Old | 1,232 (81.0%) | 289 (19.0%) |
| 10 to 14 Year Olds | 1,071 (75.6%) | 346 (24.4%) |
| 15 to 17 Year Olds | 756 (82.3%) | 163 (17.7%) |
| 18 to 19 Year Olds | 383 (84.4%) | 71 (15.6%) |
| 20 to 24 Year Olds | 412 (70.9%) | 169 (29.1%) |
| 25 to 34 Year Olds | 376 (76.9%) | 113 (23.1%) |
| 35 Years and over | 93 (52.0%) | 86 (48.0%) |
| Total | 4,651 (78.9%) | 1,244 (21.1%) |
Educational Attainment by Field of Study in Jasper County
Education (956 | 17.9%), business (953 | 17.9%), social sciences (536 | 10.1%), engineering (492 | 9.2%), and science & technology (482 | 9.0%) are the most common fields of study among 5,332 individuals in Jasper County who have obtained a bachelor's degree or higher.

| Field of Study | # Graduates | % Graduates |
| Computers & Mathematics | 177 | 3.3% |
| Bio, Nature & Agricultural | 250 | 4.7% |
| Physical & Health Sciences | 96 | 1.8% |
| Psychology | 265 | 5.0% |
| Social Sciences | 536 | 10.1% |
| Engineering | 492 | 9.2% |
| Multidisciplinary Studies | 24 | 0.4% |
| Science & Technology | 482 | 9.0% |
| Business | 953 | 17.9% |
| Education | 956 | 17.9% |
| Literature & Languages | 22 | 0.4% |
| Liberal Arts & History | 332 | 6.2% |
| Visual & Performing Arts | 330 | 6.2% |
| Communications | 86 | 1.6% |
| Arts & Humanities | 331 | 6.2% |
| Total | 5,332 | 100.0% |
Transportation & Commute in Jasper County
Vehicle Availability by Sex in Jasper County
The most prevalent vehicle ownership categories in Jasper County are males with 2 vehicles (2,912, accounting for 45.7%) and females with 2 vehicles (2,131, making up 52.3%).
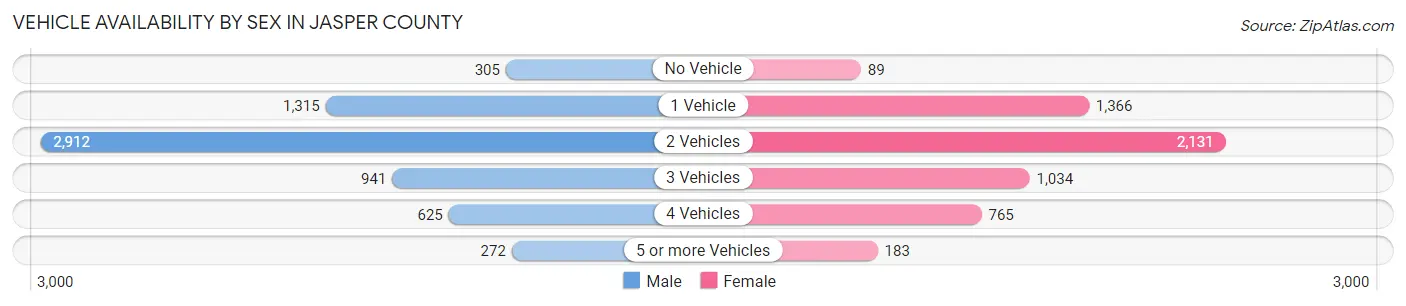
| Vehicles Available | Male | Female |
| No Vehicle | 305 (4.8%) | 89 (1.6%) |
| 1 Vehicle | 1,315 (20.6%) | 1,366 (24.5%) |
| 2 Vehicles | 2,912 (45.7%) | 2,131 (38.3%) |
| 3 Vehicles | 941 (14.8%) | 1,034 (18.6%) |
| 4 Vehicles | 625 (9.8%) | 765 (13.7%) |
| 5 or more Vehicles | 272 (4.3%) | 183 (3.3%) |
| Total | 6,370 (100.0%) | 5,568 (100.0%) |
Commute Time in Jasper County
The most frequently occuring commute durations in Jasper County are 30 to 34 minutes (2,448 commuters, 21.4%), 45 to 59 minutes (1,532 commuters, 13.4%), and 5 to 9 minutes (1,294 commuters, 11.3%).

| Commute Time | # Commuters | % Commuters |
| Less than 5 Minutes | 470 | 4.1% |
| 5 to 9 Minutes | 1,294 | 11.3% |
| 10 to 14 Minutes | 750 | 6.6% |
| 15 to 19 Minutes | 771 | 6.7% |
| 20 to 24 Minutes | 1,137 | 9.9% |
| 25 to 29 Minutes | 1,167 | 10.2% |
| 30 to 34 Minutes | 2,448 | 21.4% |
| 35 to 39 Minutes | 438 | 3.8% |
| 40 to 44 Minutes | 501 | 4.4% |
| 45 to 59 Minutes | 1,532 | 13.4% |
| 60 to 89 Minutes | 798 | 7.0% |
| 90 or more Minutes | 149 | 1.3% |
Commute Time by Sex in Jasper County
The most common commute times in Jasper County are 30 to 34 minutes (1,364 commuters, 22.5%) for males and 30 to 34 minutes (1,084 commuters, 20.1%) for females.

| Commute Time | Male | Female |
| Less than 5 Minutes | 398 (6.6%) | 72 (1.3%) |
| 5 to 9 Minutes | 659 (10.9%) | 635 (11.8%) |
| 10 to 14 Minutes | 351 (5.8%) | 399 (7.4%) |
| 15 to 19 Minutes | 313 (5.2%) | 458 (8.5%) |
| 20 to 24 Minutes | 715 (11.8%) | 422 (7.8%) |
| 25 to 29 Minutes | 449 (7.4%) | 718 (13.3%) |
| 30 to 34 Minutes | 1,364 (22.5%) | 1,084 (20.1%) |
| 35 to 39 Minutes | 287 (4.7%) | 151 (2.8%) |
| 40 to 44 Minutes | 100 (1.7%) | 401 (7.4%) |
| 45 to 59 Minutes | 865 (14.3%) | 667 (12.4%) |
| 60 to 89 Minutes | 442 (7.3%) | 356 (6.6%) |
| 90 or more Minutes | 118 (1.9%) | 31 (0.6%) |
Time of Departure to Work by Sex in Jasper County
The most frequent times of departure to work in Jasper County are 6:30 AM to 6:59 AM (1,021, 16.9%) for males and 7:00 AM to 7:29 AM (889, 16.5%) for females.

| Time of Departure | Male | Female |
| 12:00 AM to 4:59 AM | 299 (4.9%) | 139 (2.6%) |
| 5:00 AM to 5:29 AM | 139 (2.3%) | 151 (2.8%) |
| 5:30 AM to 5:59 AM | 531 (8.8%) | 104 (1.9%) |
| 6:00 AM to 6:29 AM | 866 (14.3%) | 524 (9.7%) |
| 6:30 AM to 6:59 AM | 1,021 (16.9%) | 759 (14.1%) |
| 7:00 AM to 7:29 AM | 977 (16.1%) | 889 (16.5%) |
| 7:30 AM to 7:59 AM | 699 (11.5%) | 630 (11.7%) |
| 8:00 AM to 8:29 AM | 531 (8.8%) | 549 (10.2%) |
| 8:30 AM to 8:59 AM | 159 (2.6%) | 322 (6.0%) |
| 9:00 AM to 9:59 AM | 235 (3.9%) | 335 (6.2%) |
| 10:00 AM to 10:59 AM | 246 (4.1%) | 274 (5.1%) |
| 11:00 AM to 11:59 AM | 57 (0.9%) | 51 (0.9%) |
| 12:00 PM to 3:59 PM | 257 (4.2%) | 370 (6.9%) |
| 4:00 PM to 11:59 PM | 44 (0.7%) | 297 (5.5%) |
| Total | 6,061 (100.0%) | 5,394 (100.0%) |
Housing Occupancy in Jasper County
Occupancy by Ownership in Jasper County
Of the total 11,795 dwellings in Jasper County, owner-occupied units account for 8,667 (73.5%), while renter-occupied units make up 3,128 (26.5%).

| Occupancy | # Housing Units | % Housing Units |
| Owner Occupied Housing Units | 8,667 | 73.5% |
| Renter-Occupied Housing Units | 3,128 | 26.5% |
| Total Occupied Housing Units | 11,795 | 100.0% |
Occupancy by Household Size in Jasper County
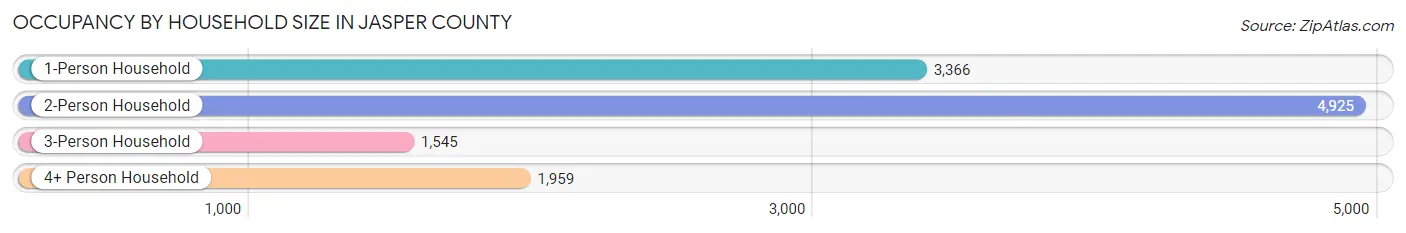
| Household Size | # Housing Units | % Housing Units |
| 1-Person Household | 3,366 | 28.5% |
| 2-Person Household | 4,925 | 41.7% |
| 3-Person Household | 1,545 | 13.1% |
| 4+ Person Household | 1,959 | 16.6% |
| Total Housing Units | 11,795 | 100.0% |
Occupancy by Ownership by Household Size in Jasper County
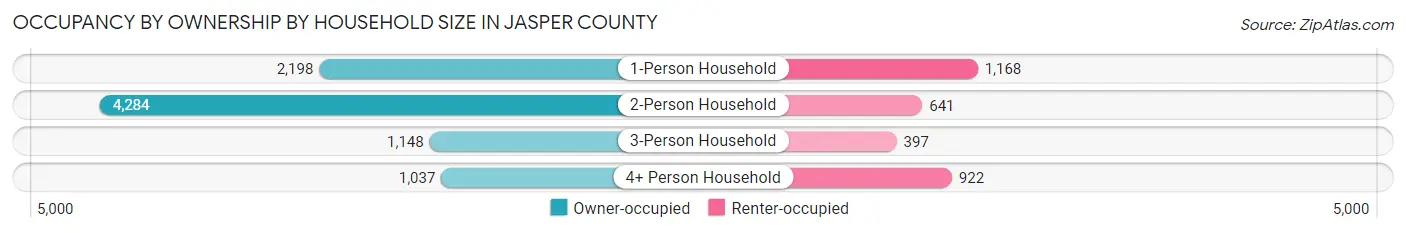
| Household Size | Owner-occupied | Renter-occupied |
| 1-Person Household | 2,198 (65.3%) | 1,168 (34.7%) |
| 2-Person Household | 4,284 (87.0%) | 641 (13.0%) |
| 3-Person Household | 1,148 (74.3%) | 397 (25.7%) |
| 4+ Person Household | 1,037 (52.9%) | 922 (47.1%) |
| Total Housing Units | 8,667 (73.5%) | 3,128 (26.5%) |
Occupancy by Educational Attainment in Jasper County

| Household Size | Owner-occupied | Renter-occupied |
| Less than High School | 652 (77.2%) | 193 (22.8%) |
| High School Diploma | 2,912 (74.7%) | 989 (25.4%) |
| College/Associate Degree | 2,663 (64.7%) | 1,454 (35.3%) |
| Bachelor's Degree or higher | 2,440 (83.2%) | 492 (16.8%) |
Occupancy by Age of Householder in Jasper County

| Age Bracket | # Households | % Households |
| Under 35 Years | 1,727 | 14.6% |
| 35 to 44 Years | 1,953 | 16.6% |
| 45 to 54 Years | 1,807 | 15.3% |
| 55 to 64 Years | 2,476 | 21.0% |
| 65 to 74 Years | 2,375 | 20.1% |
| 75 to 84 Years | 1,119 | 9.5% |
| 85 Years and Over | 338 | 2.9% |
| Total | 11,795 | 100.0% |
Housing Finances in Jasper County
Median Income by Occupancy in Jasper County

| Occupancy Type | # Households | Median Income |
| Owner-Occupied | 8,667 (73.5%) | $62,904 |
| Renter-Occupied | 3,128 (26.5%) | $46,671 |
| Average | 11,795 (100.0%) | $60,452 |
Occupancy by Householder Income Bracket in Jasper County

| Income Bracket | Owner-occupied | Renter-occupied |
| Less than $5,000 | 526 (6.1%) | 322 (10.3%) |
| $5,000 to $9,999 | 138 (1.6%) | 187 (6.0%) |
| $10,000 to $14,999 | 392 (4.5%) | 218 (7.0%) |
| $15,000 to $19,999 | 307 (3.5%) | 149 (4.8%) |
| $20,000 to $24,999 | 184 (2.1%) | 120 (3.8%) |
| $25,000 to $34,999 | 582 (6.7%) | 178 (5.7%) |
| $35,000 to $49,999 | 1,282 (14.8%) | 497 (15.9%) |
| $50,000 to $74,999 | 1,707 (19.7%) | 542 (17.3%) |
| $75,000 to $99,999 | 1,188 (13.7%) | 513 (16.4%) |
| $100,000 to $149,999 | 1,401 (16.2%) | 234 (7.5%) |
| $150,000 or more | 960 (11.1%) | 168 (5.4%) |
| Total | 8,667 (100.0%) | 3,128 (100.0%) |
Monthly Housing Cost Tiers in Jasper County
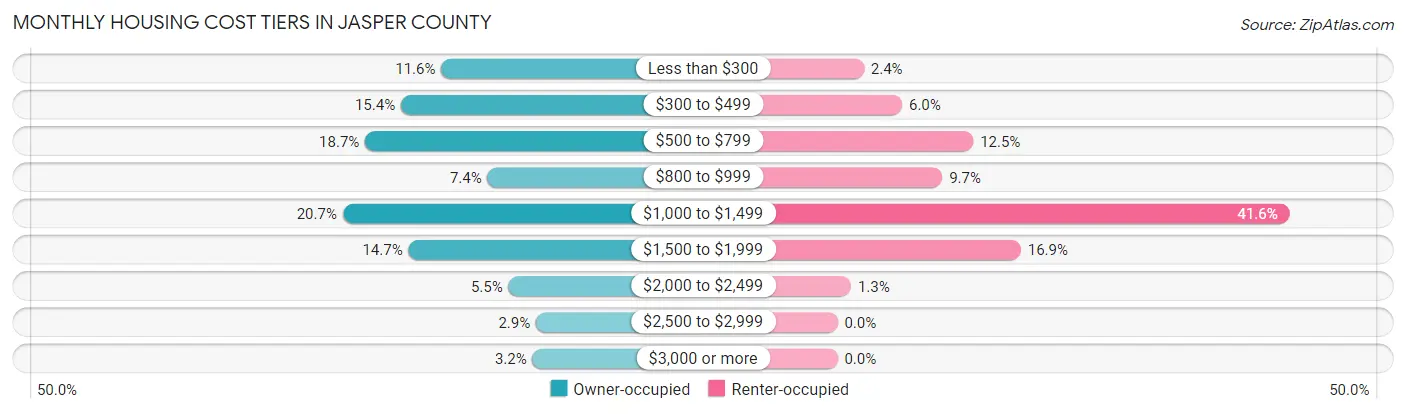
| Monthly Cost | Owner-occupied | Renter-occupied |
| Less than $300 | 1,009 (11.6%) | 76 (2.4%) |
| $300 to $499 | 1,330 (15.3%) | 186 (5.9%) |
| $500 to $799 | 1,616 (18.6%) | 391 (12.5%) |
| $800 to $999 | 640 (7.4%) | 302 (9.7%) |
| $1,000 to $1,499 | 1,795 (20.7%) | 1,302 (41.6%) |
| $1,500 to $1,999 | 1,271 (14.7%) | 528 (16.9%) |
| $2,000 to $2,499 | 472 (5.4%) | 39 (1.3%) |
| $2,500 to $2,999 | 253 (2.9%) | 0 (0.0%) |
| $3,000 or more | 281 (3.2%) | 0 (0.0%) |
| Total | 8,667 (100.0%) | 3,128 (100.0%) |
Physical Housing Characteristics in Jasper County
Housing Structures in Jasper County

| Structure Type | # Housing Units | % Housing Units |
| Single Unit, Detached | 6,659 | 56.5% |
| Single Unit, Attached | 395 | 3.4% |
| 2 Unit Apartments | 4 | 0.0% |
| 3 or 4 Unit Apartments | 341 | 2.9% |
| 5 to 9 Unit Apartments | 387 | 3.3% |
| 10 or more Apartments | 716 | 6.1% |
| Mobile Home / Other | 3,293 | 27.9% |
| Total | 11,795 | 100.0% |
Housing Structures by Occupancy in Jasper County

| Structure Type | Owner-occupied | Renter-occupied |
| Single Unit, Detached | 6,157 (92.5%) | 502 (7.5%) |
| Single Unit, Attached | 195 (49.4%) | 200 (50.6%) |
| 2 Unit Apartments | 0 (0.0%) | 4 (100.0%) |
| 3 or 4 Unit Apartments | 0 (0.0%) | 341 (100.0%) |
| 5 to 9 Unit Apartments | 0 (0.0%) | 387 (100.0%) |
| 10 or more Apartments | 0 (0.0%) | 716 (100.0%) |
| Mobile Home / Other | 2,315 (70.3%) | 978 (29.7%) |
| Total | 8,667 (73.5%) | 3,128 (26.5%) |
Housing Structures by Number of Rooms in Jasper County

| Number of Rooms | Owner-occupied | Renter-occupied |
| 1 Room | 20 (0.2%) | 23 (0.7%) |
| 2 or 3 Rooms | 206 (2.4%) | 628 (20.1%) |
| 4 or 5 Rooms | 2,896 (33.4%) | 1,759 (56.2%) |
| 6 or 7 Rooms | 3,803 (43.9%) | 625 (20.0%) |
| 8 or more Rooms | 1,742 (20.1%) | 93 (3.0%) |
| Total | 8,667 (100.0%) | 3,128 (100.0%) |
Housing Structure by Heating Type in Jasper County

| Heating Type | Owner-occupied | Renter-occupied |
| Utility Gas | 1,921 (22.2%) | 20 (0.6%) |
| Bottled, Tank, or LP Gas | 527 (6.1%) | 217 (6.9%) |
| Electricity | 6,080 (70.2%) | 2,872 (91.8%) |
| Fuel Oil or Kerosene | 0 (0.0%) | 0 (0.0%) |
| Coal or Coke | 0 (0.0%) | 0 (0.0%) |
| All other Fuels | 0 (0.0%) | 0 (0.0%) |
| No Fuel Used | 139 (1.6%) | 19 (0.6%) |
| Total | 8,667 (100.0%) | 3,128 (100.0%) |
Household Vehicle Usage in Jasper County

| Vehicles per Household | Owner-occupied | Renter-occupied |
| No Vehicle | 269 (3.1%) | 157 (5.0%) |
| 1 Vehicle | 3,073 (35.5%) | 1,612 (51.5%) |
| 2 Vehicles | 3,373 (38.9%) | 1,151 (36.8%) |
| 3 or more Vehicles | 1,952 (22.5%) | 208 (6.7%) |
| Total | 8,667 (100.0%) | 3,128 (100.0%) |
Real Estate & Mortgages in Jasper County
Real Estate and Mortgage Overview in Jasper County
| Characteristic | Without Mortgage | With Mortgage |
| Housing Units | 3,701 | 4,966 |
| Median Property Value | $173,300 | $305,300 |
| Median Household Income | $44,841 | $735 |
| Monthly Housing Costs | $417 | $268 |
| Real Estate Taxes | $1,026 | $535 |
Property Value by Mortgage Status in Jasper County

| Property Value | Without Mortgage | With Mortgage |
| Less than $50,000 | 732 (19.8%) | 267 (5.4%) |
| $50,000 to $99,999 | 319 (8.6%) | 686 (13.8%) |
| $100,000 to $299,999 | 1,416 (38.3%) | 1,481 (29.8%) |
| $300,000 to $499,999 | 595 (16.1%) | 1,831 (36.9%) |
| $500,000 to $749,999 | 626 (16.9%) | 524 (10.5%) |
| $750,000 to $999,999 | 0 (0.0%) | 56 (1.1%) |
| $1,000,000 or more | 13 (0.4%) | 121 (2.4%) |
| Total | 3,701 (100.0%) | 4,966 (100.0%) |
Household Income by Mortgage Status in Jasper County

| Household Income | Without Mortgage | With Mortgage |
| Less than $10,000 | 451 (12.2%) | 89 (1.8%) |
| $10,000 to $24,999 | 613 (16.6%) | 213 (4.3%) |
| $25,000 to $34,999 | 369 (10.0%) | 270 (5.4%) |
| $35,000 to $49,999 | 549 (14.8%) | 213 (4.3%) |
| $50,000 to $74,999 | 681 (18.4%) | 733 (14.8%) |
| $75,000 to $99,999 | 454 (12.3%) | 1,026 (20.7%) |
| $100,000 to $149,999 | 359 (9.7%) | 734 (14.8%) |
| $150,000 or more | 225 (6.1%) | 1,042 (21.0%) |
| Total | 3,701 (100.0%) | 4,966 (100.0%) |
Property Value to Household Income Ratio in Jasper County

| Value-to-Income Ratio | Without Mortgage | With Mortgage |
| Less than 2.0x | 861 (23.3%) | 75,276 (1,515.8%) |
| 2.0x to 2.9x | 505 (13.6%) | 1,446 (29.1%) |
| 3.0x to 3.9x | 443 (12.0%) | 931 (18.8%) |
| 4.0x or more | 1,655 (44.7%) | 663 (13.4%) |
| Total | 3,701 (100.0%) | 4,966 (100.0%) |
Real Estate Taxes by Mortgage Status in Jasper County

| Property Taxes | Without Mortgage | With Mortgage |
| Less than $800 | 1,574 (42.5%) | 86 (1.7%) |
| $800 to $1,499 | 461 (12.5%) | 1,069 (21.5%) |
| $800 to $1,499 | 1,245 (33.6%) | 1,013 (20.4%) |
| Total | 3,701 (100.0%) | 4,966 (100.0%) |
Health & Disability in Jasper County
Health Insurance Coverage by Age in Jasper County

| Age Bracket | With Coverage | Without Coverage |
| Under 6 Years | 1,916 (96.5%) | 70 (3.5%) |
| 6 to 18 Years | 3,779 (93.3%) | 269 (6.7%) |
| 19 to 25 Years | 1,712 (77.6%) | 493 (22.4%) |
| 26 to 34 Years | 2,255 (75.4%) | 737 (24.6%) |
| 35 to 44 Years | 2,356 (67.8%) | 1,119 (32.2%) |
| 45 to 54 Years | 2,420 (76.3%) | 753 (23.7%) |
| 55 to 64 Years | 4,209 (90.9%) | 422 (9.1%) |
| 65 to 74 Years | 4,057 (99.7%) | 13 (0.3%) |
| 75 Years and older | 2,079 (100.0%) | 1 (0.1%) |
| Total | 24,783 (86.5%) | 3,877 (13.5%) |
Health Insurance Coverage by Citizenship Status in Jasper County

| Citizenship Status | With Coverage | Without Coverage |
| Native Born | 1,916 (96.5%) | 70 (3.5%) |
| Foreign Born, Citizen | 3,779 (93.3%) | 269 (6.7%) |
| Foreign Born, not a Citizen | 1,712 (77.6%) | 493 (22.4%) |
Health Insurance Coverage by Household Income in Jasper County

| Household Income | With Coverage | Without Coverage |
| Under $25,000 | 3,538 (79.8%) | 893 (20.2%) |
| $25,000 to $49,999 | 5,206 (84.7%) | 940 (15.3%) |
| $50,000 to $74,999 | 5,302 (89.1%) | 647 (10.9%) |
| $75,000 to $99,999 | 3,575 (79.1%) | 942 (20.8%) |
| $100,000 and over | 7,108 (94.0%) | 455 (6.0%) |
Public vs Private Health Insurance Coverage by Age in Jasper County
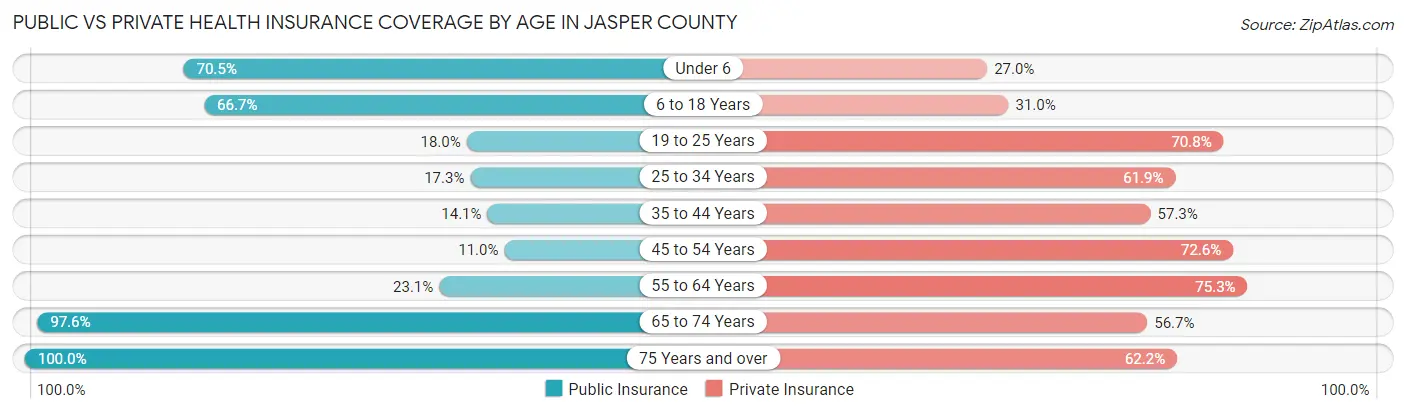
| Age Bracket | Public Insurance | Private Insurance |
| Under 6 | 1,400 (70.5%) | 536 (27.0%) |
| 6 to 18 Years | 2,699 (66.7%) | 1,253 (30.9%) |
| 19 to 25 Years | 396 (18.0%) | 1,562 (70.8%) |
| 25 to 34 Years | 517 (17.3%) | 1,852 (61.9%) |
| 35 to 44 Years | 490 (14.1%) | 1,992 (57.3%) |
| 45 to 54 Years | 348 (11.0%) | 2,304 (72.6%) |
| 55 to 64 Years | 1,068 (23.1%) | 3,486 (75.3%) |
| 65 to 74 Years | 3,974 (97.6%) | 2,308 (56.7%) |
| 75 Years and over | 2,079 (100.0%) | 1,294 (62.2%) |
| Total | 12,971 (45.3%) | 16,587 (57.9%) |
Disability Status by Sex by Age in Jasper County

| Age Bracket | Male | Female |
| Under 5 Years | 0 (0.0%) | 0 (0.0%) |
| 5 to 17 Years | 152 (7.6%) | 30 (1.5%) |
| 18 to 34 Years | 73 (2.5%) | 297 (11.2%) |
| 35 to 64 Years | 856 (15.7%) | 868 (14.9%) |
| 65 to 74 Years | 443 (24.3%) | 333 (14.8%) |
| 75 Years and over | 279 (29.6%) | 684 (60.1%) |
Disability Class by Sex by Age in Jasper County
Disability Class: Hearing Difficulty
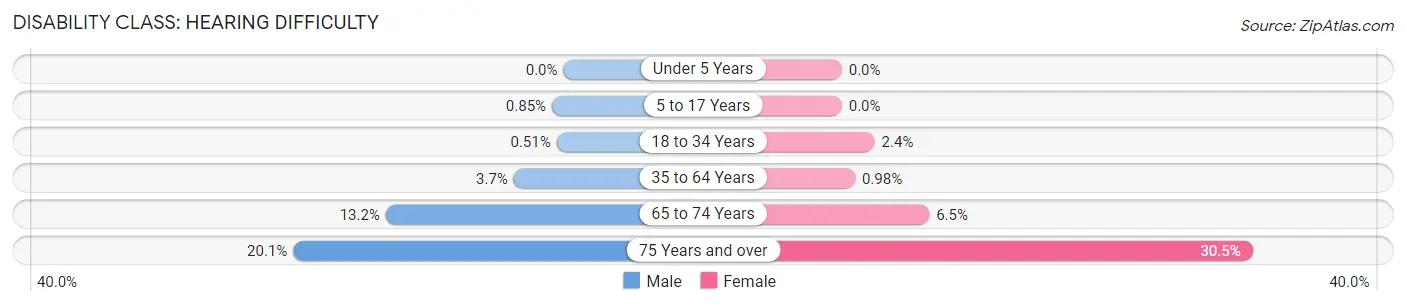
| Age Bracket | Male | Female |
| Under 5 Years | 0 (0.0%) | 0 (0.0%) |
| 5 to 17 Years | 17 (0.9%) | 0 (0.0%) |
| 18 to 34 Years | 15 (0.5%) | 65 (2.4%) |
| 35 to 64 Years | 201 (3.7%) | 57 (1.0%) |
| 65 to 74 Years | 240 (13.2%) | 146 (6.5%) |
| 75 Years and over | 189 (20.1%) | 347 (30.5%) |
Disability Class: Vision Difficulty

| Age Bracket | Male | Female |
| Under 5 Years | 0 (0.0%) | 0 (0.0%) |
| 5 to 17 Years | 0 (0.0%) | 0 (0.0%) |
| 18 to 34 Years | 10 (0.3%) | 19 (0.7%) |
| 35 to 64 Years | 116 (2.1%) | 415 (7.1%) |
| 65 to 74 Years | 60 (3.3%) | 73 (3.2%) |
| 75 Years and over | 16 (1.7%) | 140 (12.3%) |
Disability Class: Cognitive Difficulty

| Age Bracket | Male | Female |
| 5 to 17 Years | 152 (7.6%) | 30 (1.5%) |
| 18 to 34 Years | 48 (1.6%) | 145 (5.4%) |
| 35 to 64 Years | 382 (7.0%) | 343 (5.9%) |
| 65 to 74 Years | 97 (5.3%) | 44 (2.0%) |
| 75 Years and over | 51 (5.4%) | 53 (4.7%) |
Disability Class: Ambulatory Difficulty

| Age Bracket | Male | Female |
| 5 to 17 Years | 22 (1.1%) | 0 (0.0%) |
| 18 to 34 Years | 0 (0.0%) | 0 (0.0%) |
| 35 to 64 Years | 507 (9.3%) | 409 (7.0%) |
| 65 to 74 Years | 157 (8.6%) | 205 (9.1%) |
| 75 Years and over | 106 (11.3%) | 444 (39.0%) |
Disability Class: Self-Care Difficulty

| Age Bracket | Male | Female |
| 5 to 17 Years | 0 (0.0%) | 0 (0.0%) |
| 18 to 34 Years | 0 (0.0%) | 0 (0.0%) |
| 35 to 64 Years | 254 (4.7%) | 66 (1.1%) |
| 65 to 74 Years | 93 (5.1%) | 47 (2.1%) |
| 75 Years and over | 11 (1.2%) | 107 (9.4%) |
Technology Access in Jasper County
Computing Device Access in Jasper County

| Device Type | # Households | % Households |
| Desktop or Laptop | 7,992 | 67.8% |
| Smartphone | 9,998 | 84.8% |
| Tablet | 6,953 | 59.0% |
| No Computing Device | 1,405 | 11.9% |
| Total | 11,795 | 100.0% |
Internet Access in Jasper County

| Internet Type | # Households | % Households |
| Dial-Up Internet | 0 | 0.0% |
| Broadband Home | 7,227 | 61.3% |
| Cellular Data Only | 1,574 | 13.3% |
| Satellite Internet | 805 | 6.8% |
| No Internet | 2,533 | 21.5% |
| Total | 11,795 | 100.0% |
Jasper County Summary
Jasper County is located in the Lowcountry region of South Carolina, and is bordered by Beaufort, Hampton, and Colleton Counties. The county seat is Ridgeland, and the county was named after Revolutionary War hero Sergeant William Jasper. The county has a total area of 576 square miles, and a population of 24,777 as of the 2010 census.
Geography
Jasper County is located in the Lowcountry region of South Carolina, and is bordered by Beaufort, Hampton, and Colleton Counties. The county is mostly rural, with the majority of the land being used for agricultural purposes. The terrain is mostly flat, with some rolling hills in the northern part of the county. The county is home to several rivers, including the Coosawhatchie, the New, and the Chechessee. The county is also home to several state parks, including the Hunting Island State Park, the Colleton State Park, and the Edisto Beach State Park.
Economy
The economy of Jasper County is largely based on agriculture, with the majority of the land being used for farming. The county is home to several large farms, including the Jasper County Farm Bureau, which is the largest farm in the county. Other major industries in the county include timber, manufacturing, and tourism. The county is also home to several large employers, including the Jasper County School District, the Jasper County Hospital, and the Jasper County Sheriff's Office.
Demographics
As of the 2010 census, Jasper County had a population of 24,777. The racial makeup of the county was 68.3% White, 28.2% African American, 0.4% Native American, 0.7% Asian, 0.1% Pacific Islander, 0.7% from other races, and 1.6% from two or more races. Hispanic or Latino of any race were 2.2% of the population.
The median income for a household in the county was $37,945, and the median income for a family was $45,945. The per capita income for the county was $19,845. About 17.2% of families and 21.2% of the population were below the poverty line, including 28.2% of those under age 18 and 16.2% of those age 65 or over.
Education
Jasper County is served by the Jasper County School District, which consists of seven elementary schools, two middle schools, and two high schools. The district also operates a virtual school, which offers online courses for students in grades K-12. The district also operates a career and technology center, which offers career and technical education programs for students in grades 9-12.
Conclusion
Jasper County is a rural county located in the Lowcountry region of South Carolina. The county is largely agricultural, with the majority of the land being used for farming. The county is also home to several large employers, including the Jasper County School District, the Jasper County Hospital, and the Jasper County Sheriff's Office. The population of the county is 24,777, and the median income for a household is $37,945. The county is served by the Jasper County School District, which consists of seven elementary schools, two middle schools, and two high schools.
Common Questions
What is the Total Population of Jasper County?
Total Population of Jasper County is 29,444.
What is the Total Male Population of Jasper County?
Total Male Population of Jasper County is 14,678.
What is the Total Female Population of Jasper County?
Total Female Population of Jasper County is 14,766.
What is the Ratio of Males per 100 Females in Jasper County?
There are 99.40 Males per 100 Females in Jasper County.
What is the Ratio of Females per 100 Males in Jasper County?
There are 100.60 Females per 100 Males in Jasper County.
What is the Median Population Age in Jasper County?
Median Population Age in Jasper County is 43.6 Years.
What is the Average Family Size in Jasper County
Average Family Size in Jasper County is 2.9 People.
What is the Average Household Size in Jasper County
Average Household Size in Jasper County is 2.4 People.
What is Per Capita Income in Jasper County?
Per Capita income in Jasper County is $31,228.
What is the Median Family Income in Jasper County?
Median Family Income in Jasper County is $67,643.
What is the Median Household income in Jasper County?
Median Household Income in Jasper County is $60,452.
What is Income or Wage Gap in Jasper County?
Income or Wage Gap in Jasper County is 22.0%.
Women in Jasper County earn 78.0 cents for every dollar earned by a man.
What is Inequality or Gini Index in Jasper County?
Inequality or Gini Index in Jasper County is 0.46.
How Large is the Labor Force in Jasper County?
There are 13,023 People in the Labor Forcein in Jasper County.
What is the Percentage of People in the Labor Force in Jasper County?
53.5% of People are in the Labor Force in Jasper County.
What is the Unemployment Rate in Jasper County?
Unemployment Rate in Jasper County is 6.3%.