Cities with the Most Immigrants from Laos in Oklahoma
RELATED REPORTS & OPTIONS
Laos
Oklahoma
Compare Cities
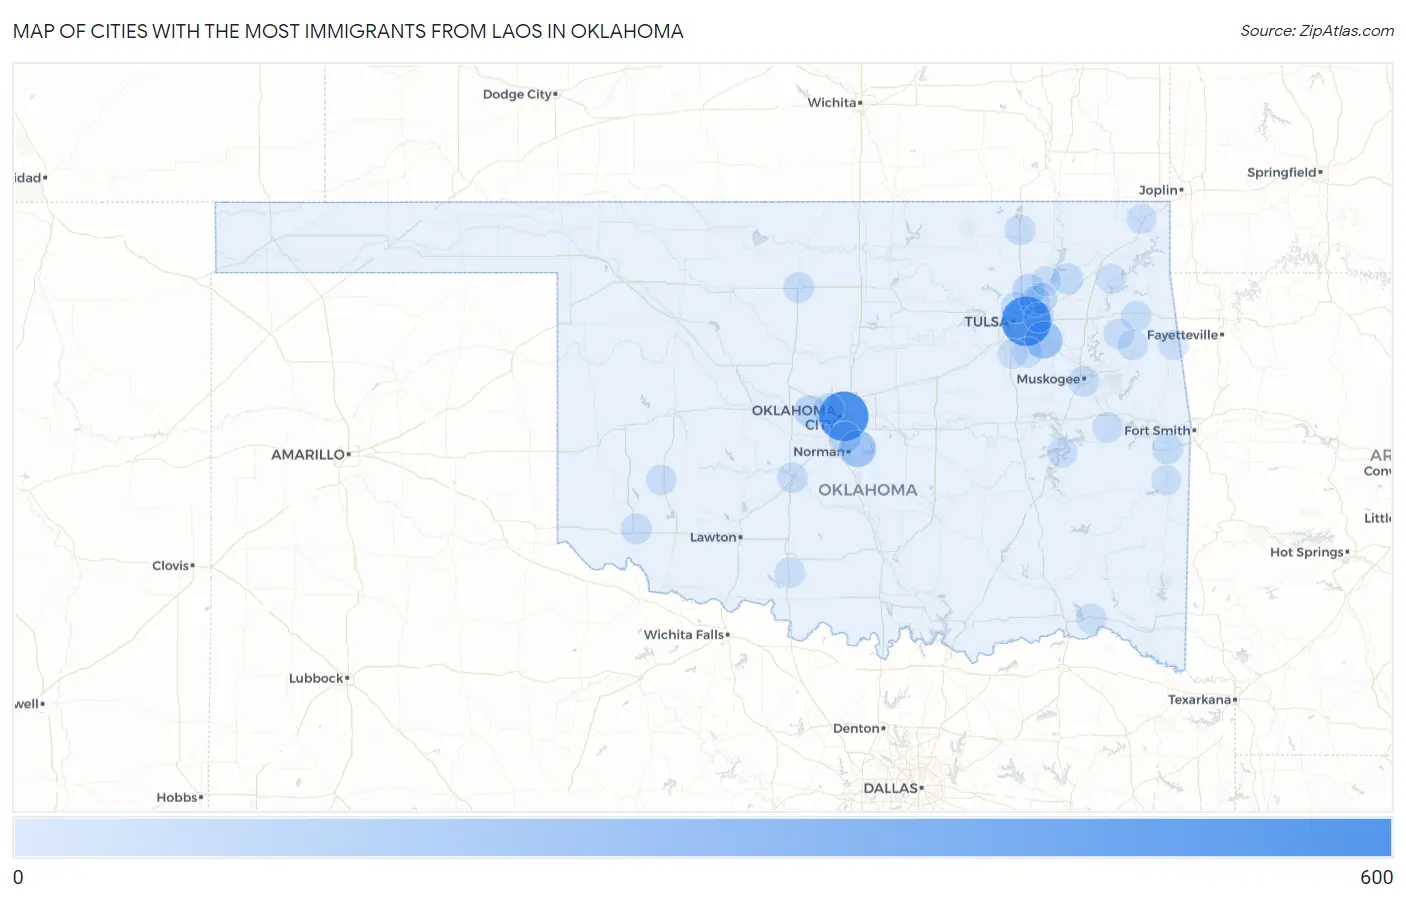
Map of Cities with the Most Immigrants from Laos in Oklahoma
0
600
Cities with the Most Immigrants from Laos in Oklahoma
| City | Laos | vs State | vs National | |
| 1. | Oklahoma City | 544 | 2,834(19.20%)#1 | 174,982(0.31%)#50 |
| 2. | Tulsa | 542 | 2,834(19.12%)#2 | 174,982(0.31%)#52 |
| 3. | Broken Arrow | 198 | 2,834(6.99%)#3 | 174,982(0.11%)#133 |
| 4. | Norman | 180 | 2,834(6.35%)#4 | 174,982(0.10%)#148 |
| 5. | Collinsville | 67 | 2,834(2.36%)#5 | 174,982(0.04%)#399 |
| 6. | Yukon | 51 | 2,834(1.80%)#6 | 174,982(0.03%)#486 |
| 7. | Moore | 50 | 2,834(1.76%)#7 | 174,982(0.03%)#491 |
| 8. | Limestone | 34 | 2,834(1.20%)#8 | 174,982(0.02%)#657 |
| 9. | Bushyhead | 32 | 2,834(1.13%)#9 | 174,982(0.02%)#677 |
| 10. | Spiro | 29 | 2,834(1.02%)#10 | 174,982(0.02%)#715 |
| 11. | Turley | 25 | 2,834(0.88%)#11 | 174,982(0.01%)#808 |
| 12. | Warr Acres | 24 | 2,834(0.85%)#12 | 174,982(0.01%)#824 |
| 13. | Dewey | 19 | 2,834(0.67%)#13 | 174,982(0.01%)#920 |
| 14. | Altus | 17 | 2,834(0.60%)#14 | 174,982(0.01%)#975 |
| 15. | Chickasha | 17 | 2,834(0.60%)#15 | 174,982(0.01%)#977 |
| 16. | Enid | 16 | 2,834(0.56%)#16 | 174,982(0.01%)#999 |
| 17. | Muskogee | 16 | 2,834(0.56%)#17 | 174,982(0.01%)#1,002 |
| 18. | Owasso | 12 | 2,834(0.42%)#18 | 174,982(0.01%)#1,117 |
| 19. | Hobart | 10 | 2,834(0.35%)#19 | 174,982(0.01%)#1,225 |
| 20. | Peggs | 10 | 2,834(0.35%)#20 | 174,982(0.01%)#1,234 |
| 21. | Bixby | 8 | 2,834(0.28%)#21 | 174,982(0.00%)#1,289 |
| 22. | Steely Hollow | 8 | 2,834(0.28%)#22 | 174,982(0.00%)#1,320 |
| 23. | Catoosa | 7 | 2,834(0.25%)#23 | 174,982(0.00%)#1,339 |
| 24. | Simms | 7 | 2,834(0.25%)#24 | 174,982(0.00%)#1,355 |
| 25. | Leach | 6 | 2,834(0.21%)#25 | 174,982(0.00%)#1,393 |
| 26. | Glenpool | 4 | 2,834(0.14%)#26 | 174,982(0.00%)#1,457 |
| 27. | Poteau | 4 | 2,834(0.14%)#27 | 174,982(0.00%)#1,460 |
| 28. | Oologah | 4 | 2,834(0.14%)#28 | 174,982(0.00%)#1,473 |
| 29. | Comanche | 4 | 2,834(0.14%)#29 | 174,982(0.00%)#1,475 |
| 30. | Fort Towson | 4 | 2,834(0.14%)#30 | 174,982(0.00%)#1,480 |
| 31. | Carlton Landing | 3 | 2,834(0.11%)#31 | 174,982(0.00%)#1,520 |
| 32. | Westville | 2 | 2,834(0.07%)#32 | 174,982(0.00%)#1,536 |
| 33. | Pensacola | 2 | 2,834(0.07%)#33 | 174,982(0.00%)#1,552 |
| 34. | Miami | 1 | 2,834(0.04%)#34 | 174,982(0.00%)#1,560 |
Common Questions
What are the Top 10 Cities with the Most Immigrants from Laos in Oklahoma?
Top 10 Cities with the Most Immigrants from Laos in Oklahoma are:
#1
544
#2
542
#3
198
#4
180
#5
67
#6
51
#7
50
#8
34
#9
32
#10
29
What city has the Most Immigrants from Laos in Oklahoma?
Oklahoma City has the Most Immigrants from Laos in Oklahoma with 544.
What is the Total Immigrants from Laos in the State of Oklahoma?
Total Immigrants from Laos in Oklahoma is 2,834.
What is the Total Immigrants from Laos in the United States?
Total Immigrants from Laos in the United States is 174,982.