Tulsa, OK
Tulsa Map
Tulsa Overview
411,938
TOTAL POPULATION
201,571
MALE POPULATION
210,367
FEMALE POPULATION
95.82
MALES / 100 FEMALES
104.36
FEMALES / 100 MALES
35.6
MEDIAN AGE
3.2
AVG FAMILY SIZE
2.4
AVG HOUSEHOLD SIZE
$36,490
PER CAPITA INCOME
$74,430
AVG FAMILY INCOME
$56,648
AVG HOUSEHOLD INCOME
25.2%
WAGE / INCOME GAP [ % ]
74.8¢/ $1
WAGE / INCOME GAP [ $ ]
$12,243
FAMILY INCOME DEFICIT
0.51
INEQUALITY / GINI INDEX
209,252
LABOR FORCE [ PEOPLE ]
64.7%
PERCENT IN LABOR FORCE
5.8%
UNEMPLOYMENT RATE
Tulsa Zip Codes
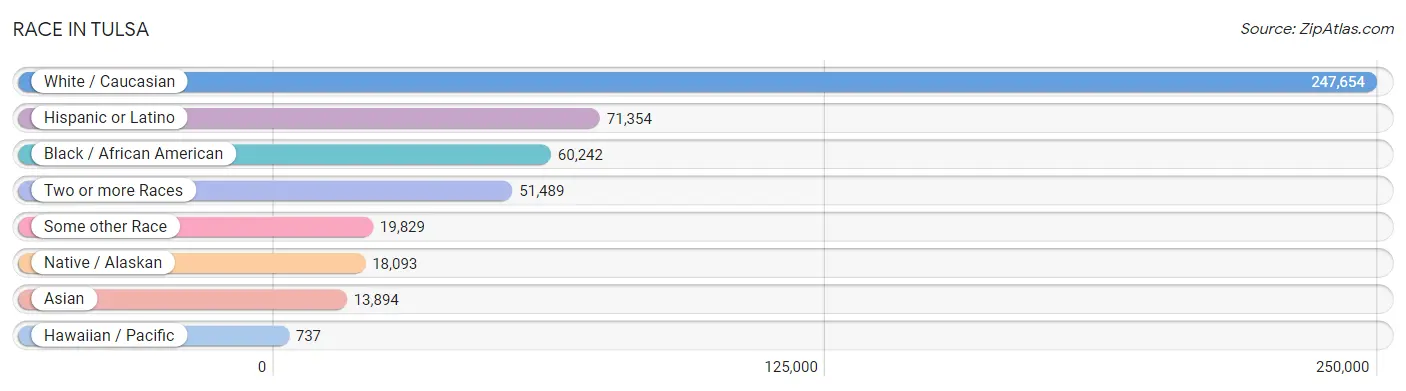
Race in Tulsa
The most populous races in Tulsa are White / Caucasian (247,654 | 60.1%), Hispanic or Latino (71,354 | 17.3%), and Black / African American (60,242 | 14.6%).
| Race | # Population | % Population |
| Asian | 13,894 | 3.4% |
| Black / African American | 60,242 | 14.6% |
| Hawaiian / Pacific | 737 | 0.2% |
| Hispanic or Latino | 71,354 | 17.3% |
| Native / Alaskan | 18,093 | 4.4% |
| White / Caucasian | 247,654 | 60.1% |
| Two or more Races | 51,489 | 12.5% |
| Some other Race | 19,829 | 4.8% |
| Total | 411,938 | 100.0% |
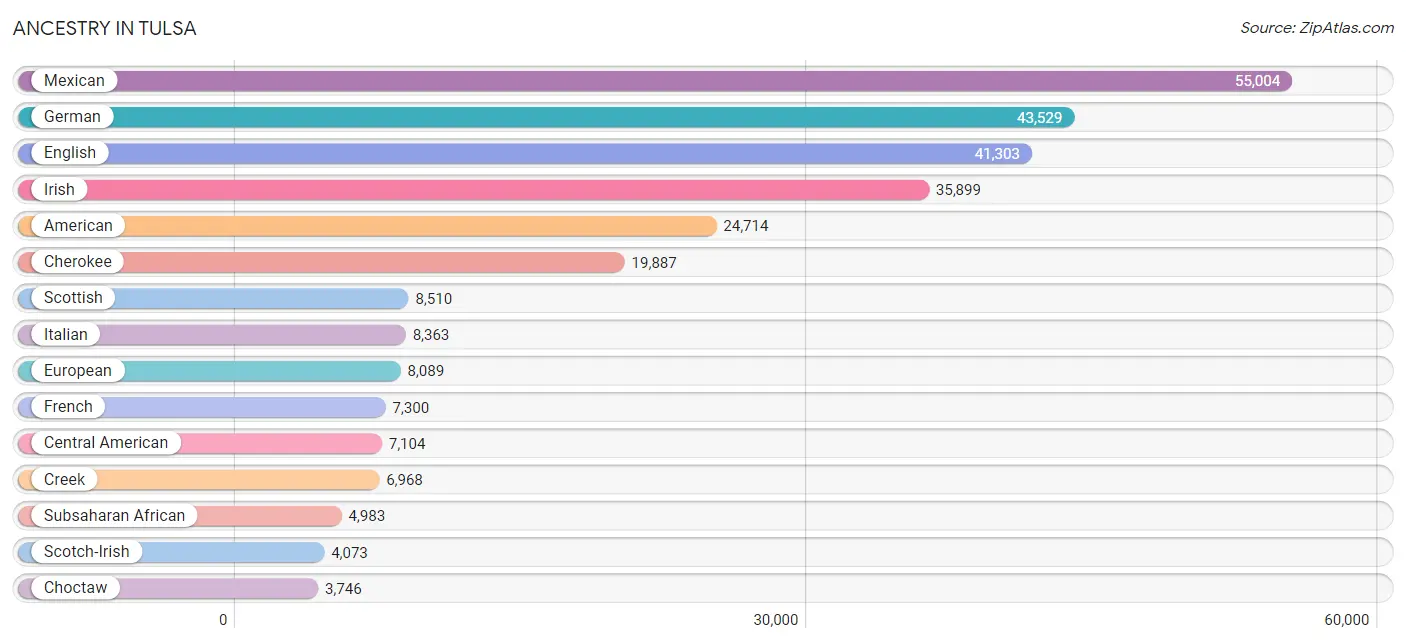
Ancestry in Tulsa
The most populous ancestries reported in Tulsa are Mexican (55,004 | 13.4%), German (43,529 | 10.6%), English (41,303 | 10.0%), Irish (35,899 | 8.7%), and American (24,714 | 6.0%), together accounting for 48.7% of all Tulsa residents.
| Ancestry | # Population | % Population |
| Afghan | 244 | 0.1% |
| African | 3,081 | 0.7% |
| Alaskan Athabascan | 9 | 0.0% |
| Albanian | 5 | 0.0% |
| Aleut | 34 | 0.0% |
| Alsatian | 7 | 0.0% |
| American | 24,714 | 6.0% |
| Apache | 418 | 0.1% |
| Arab | 2,527 | 0.6% |
| Arapaho | 14 | 0.0% |
| Argentinean | 115 | 0.0% |
| Armenian | 185 | 0.0% |
| Australian | 153 | 0.0% |
| Austrian | 438 | 0.1% |
| Bahamian | 50 | 0.0% |
| Bangladeshi | 1,804 | 0.4% |
| Barbadian | 27 | 0.0% |
| Basque | 22 | 0.0% |
| Belgian | 119 | 0.0% |
| Belizean | 47 | 0.0% |
| Bhutanese | 963 | 0.2% |
| Blackfeet | 406 | 0.1% |
| Bolivian | 33 | 0.0% |
| Brazilian | 431 | 0.1% |
| British | 2,850 | 0.7% |
| British West Indian | 3 | 0.0% |
| Bulgarian | 44 | 0.0% |
| Burmese | 897 | 0.2% |
| Cajun | 148 | 0.0% |
| Canadian | 342 | 0.1% |
| Cape Verdean | 11 | 0.0% |
| Celtic | 54 | 0.0% |
| Central American | 7,104 | 1.7% |
| Central American Indian | 368 | 0.1% |
| Cherokee | 19,887 | 4.8% |
| Cheyenne | 142 | 0.0% |
| Chickasaw | 889 | 0.2% |
| Chilean | 184 | 0.0% |
| Chippewa | 114 | 0.0% |
| Choctaw | 3,746 | 0.9% |
| Colombian | 527 | 0.1% |
| Comanche | 250 | 0.1% |
| Costa Rican | 211 | 0.1% |
| Creek | 6,968 | 1.7% |
| Croatian | 230 | 0.1% |
| Crow | 6 | 0.0% |
| Cuban | 539 | 0.1% |
| Czech | 1,150 | 0.3% |
| Czechoslovakian | 174 | 0.0% |
| Danish | 733 | 0.2% |
| Delaware | 248 | 0.1% |
| Dominican | 436 | 0.1% |
| Dutch | 3,118 | 0.8% |
| Dutch West Indian | 473 | 0.1% |
| Eastern European | 606 | 0.2% |
| Ecuadorian | 230 | 0.1% |
| Egyptian | 291 | 0.1% |
| English | 41,303 | 10.0% |
| Estonian | 50 | 0.0% |
| Ethiopian | 114 | 0.0% |
| European | 8,089 | 2.0% |
| Fijian | 69 | 0.0% |
| Filipino | 52 | 0.0% |
| Finnish | 229 | 0.1% |
| French | 7,300 | 1.8% |
| French American Indian | 28 | 0.0% |
| French Canadian | 617 | 0.2% |
| German | 43,529 | 10.6% |
| German Russian | 81 | 0.0% |
| Ghanaian | 54 | 0.0% |
| Greek | 720 | 0.2% |
| Guamanian / Chamorro | 84 | 0.0% |
| Guatemalan | 3,427 | 0.8% |
| Haitian | 136 | 0.0% |
| Honduran | 1,913 | 0.5% |
| Hopi | 5 | 0.0% |
| Hungarian | 612 | 0.2% |
| Icelander | 144 | 0.0% |
| Indian (Asian) | 2,196 | 0.5% |
| Indonesian | 2,750 | 0.7% |
| Inupiat | 23 | 0.0% |
| Iranian | 558 | 0.1% |
| Iraqi | 100 | 0.0% |
| Irish | 35,899 | 8.7% |
| Iroquois | 308 | 0.1% |
| Israeli | 281 | 0.1% |
| Italian | 8,363 | 2.0% |
| Jamaican | 414 | 0.1% |
| Japanese | 63 | 0.0% |
| Jordanian | 49 | 0.0% |
| Kenyan | 226 | 0.1% |
| Kiowa | 408 | 0.1% |
| Korean | 1,357 | 0.3% |
| Laotian | 152 | 0.0% |
| Latvian | 67 | 0.0% |
| Lebanese | 836 | 0.2% |
| Liberian | 106 | 0.0% |
| Lithuanian | 295 | 0.1% |
| Lumbee | 52 | 0.0% |
| Luxembourger | 29 | 0.0% |
| Malaysian | 141 | 0.0% |
| Marshallese | 40 | 0.0% |
| Mexican | 55,004 | 13.4% |
| Mexican American Indian | 644 | 0.2% |
| Mongolian | 6 | 0.0% |
| Moroccan | 6 | 0.0% |
| Native Hawaiian | 478 | 0.1% |
| Navajo | 423 | 0.1% |
| New Zealander | 4 | 0.0% |
| Nicaraguan | 51 | 0.0% |
| Nigerian | 937 | 0.2% |
| Northern European | 808 | 0.2% |
| Norwegian | 3,067 | 0.7% |
| Osage | 918 | 0.2% |
| Ottawa | 46 | 0.0% |
| Pakistani | 189 | 0.1% |
| Palestinian | 127 | 0.0% |
| Panamanian | 341 | 0.1% |
| Pennsylvania German | 87 | 0.0% |
| Peruvian | 467 | 0.1% |
| Pima | 52 | 0.0% |
| Polish | 3,581 | 0.9% |
| Portuguese | 712 | 0.2% |
| Potawatomi | 353 | 0.1% |
| Pueblo | 66 | 0.0% |
| Puerto Rican | 2,597 | 0.6% |
| Romanian | 288 | 0.1% |
| Russian | 1,232 | 0.3% |
| Salvadoran | 1,034 | 0.3% |
| Samoan | 168 | 0.0% |
| Scandinavian | 1,172 | 0.3% |
| Scotch-Irish | 4,073 | 1.0% |
| Scottish | 8,510 | 2.1% |
| Seminole | 591 | 0.1% |
| Serbian | 7 | 0.0% |
| Sioux | 297 | 0.1% |
| Slavic | 130 | 0.0% |
| Slovak | 168 | 0.0% |
| Slovene | 83 | 0.0% |
| South American | 2,762 | 0.7% |
| South American Indian | 54 | 0.0% |
| Spaniard | 921 | 0.2% |
| Spanish | 609 | 0.2% |
| Spanish American | 31 | 0.0% |
| Spanish American Indian | 6 | 0.0% |
| Sri Lankan | 2,094 | 0.5% |
| Subsaharan African | 4,983 | 1.2% |
| Sudanese | 35 | 0.0% |
| Swedish | 2,688 | 0.6% |
| Swiss | 560 | 0.1% |
| Syrian | 347 | 0.1% |
| Thai | 2,889 | 0.7% |
| Tlingit-Haida | 16 | 0.0% |
| Tohono O'Odham | 9 | 0.0% |
| Tongan | 11 | 0.0% |
| Trinidadian and Tobagonian | 49 | 0.0% |
| Tsimshian | 1 | 0.0% |
| Turkish | 179 | 0.0% |
| Ugandan | 53 | 0.0% |
| Ukrainian | 782 | 0.2% |
| Uruguayan | 25 | 0.0% |
| Venezuelan | 1,169 | 0.3% |
| Vietnamese | 119 | 0.0% |
| Welsh | 2,214 | 0.5% |
| West Indian | 221 | 0.1% |
| Yugoslavian | 60 | 0.0% |
| Zimbabwean | 8 | 0.0% | View All 167 Rows |
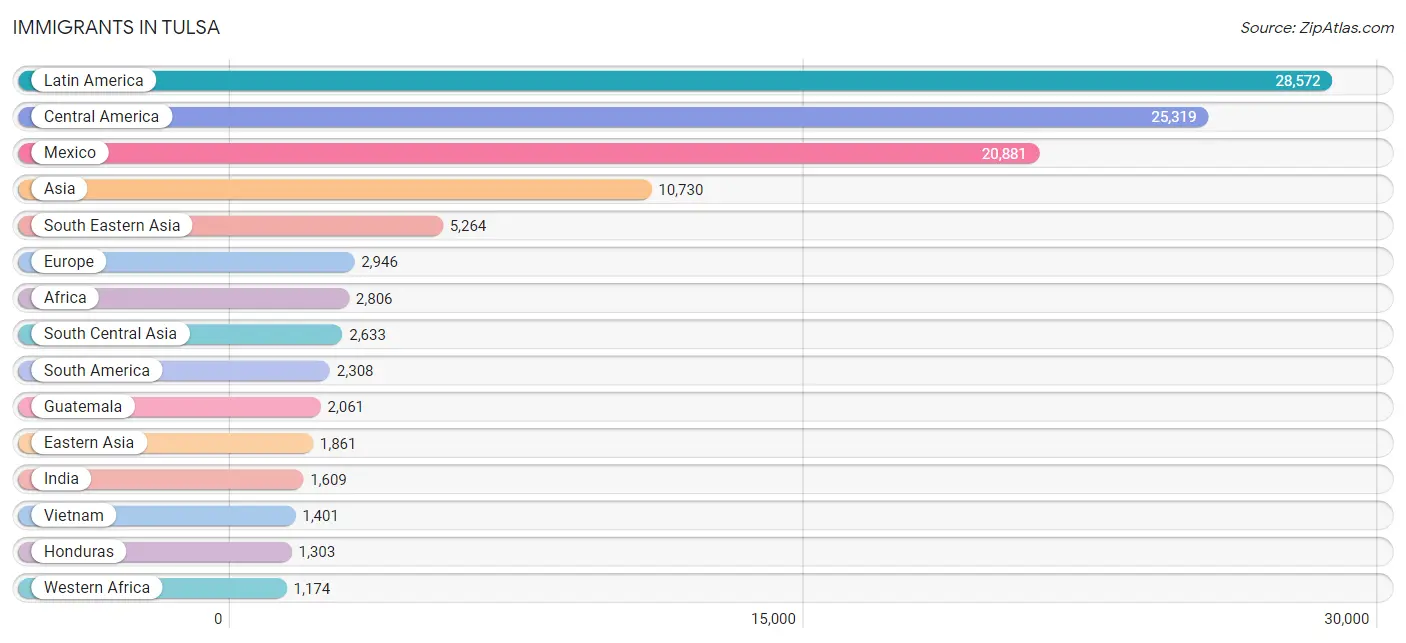
Immigrants in Tulsa
The most numerous immigrant groups reported in Tulsa came from Latin America (28,572 | 6.9%), Central America (25,319 | 6.1%), Mexico (20,881 | 5.1%), Asia (10,730 | 2.6%), and South Eastern Asia (5,264 | 1.3%), together accounting for 22.0% of all Tulsa residents.
| Immigration Origin | # Population | % Population |
| Afghanistan | 249 | 0.1% |
| Africa | 2,806 | 0.7% |
| Argentina | 70 | 0.0% |
| Armenia | 14 | 0.0% |
| Asia | 10,730 | 2.6% |
| Australia | 80 | 0.0% |
| Austria | 61 | 0.0% |
| Bahamas | 57 | 0.0% |
| Bangladesh | 151 | 0.0% |
| Barbados | 27 | 0.0% |
| Belarus | 20 | 0.0% |
| Belgium | 37 | 0.0% |
| Belize | 26 | 0.0% |
| Bolivia | 28 | 0.0% |
| Brazil | 360 | 0.1% |
| Bulgaria | 11 | 0.0% |
| Cambodia | 10 | 0.0% |
| Cameroon | 39 | 0.0% |
| Canada | 494 | 0.1% |
| Caribbean | 945 | 0.2% |
| Central America | 25,319 | 6.1% |
| Chile | 77 | 0.0% |
| China | 1,061 | 0.3% |
| Colombia | 312 | 0.1% |
| Congo | 23 | 0.0% |
| Costa Rica | 48 | 0.0% |
| Cuba | 231 | 0.1% |
| Czechoslovakia | 19 | 0.0% |
| Denmark | 26 | 0.0% |
| Dominican Republic | 281 | 0.1% |
| Eastern Africa | 890 | 0.2% |
| Eastern Asia | 1,861 | 0.4% |
| Eastern Europe | 931 | 0.2% |
| Ecuador | 163 | 0.0% |
| Egypt | 245 | 0.1% |
| El Salvador | 858 | 0.2% |
| England | 406 | 0.1% |
| Eritrea | 65 | 0.0% |
| Ethiopia | 102 | 0.0% |
| Europe | 2,946 | 0.7% |
| France | 66 | 0.0% |
| Germany | 556 | 0.1% |
| Ghana | 123 | 0.0% |
| Greece | 46 | 0.0% |
| Guatemala | 2,061 | 0.5% |
| Guyana | 46 | 0.0% |
| Haiti | 63 | 0.0% |
| Honduras | 1,303 | 0.3% |
| Hong Kong | 70 | 0.0% |
| Hungary | 1 | 0.0% |
| India | 1,609 | 0.4% |
| Indonesia | 85 | 0.0% |
| Iran | 178 | 0.0% |
| Iraq | 78 | 0.0% |
| Ireland | 26 | 0.0% |
| Israel | 23 | 0.0% |
| Italy | 86 | 0.0% |
| Jamaica | 216 | 0.1% |
| Japan | 260 | 0.1% |
| Jordan | 76 | 0.0% |
| Kazakhstan | 41 | 0.0% |
| Kenya | 319 | 0.1% |
| Korea | 540 | 0.1% |
| Kuwait | 45 | 0.0% |
| Laos | 542 | 0.1% |
| Latin America | 28,572 | 6.9% |
| Latvia | 17 | 0.0% |
| Lebanon | 178 | 0.0% |
| Liberia | 159 | 0.0% |
| Lithuania | 8 | 0.0% |
| Malaysia | 388 | 0.1% |
| Mexico | 20,881 | 5.1% |
| Micronesia | 273 | 0.1% |
| Middle Africa | 127 | 0.0% |
| Moldova | 56 | 0.0% |
| Morocco | 24 | 0.0% |
| Nepal | 64 | 0.0% |
| Netherlands | 93 | 0.0% |
| Nicaragua | 61 | 0.0% |
| Nigeria | 694 | 0.2% |
| Northern Africa | 415 | 0.1% |
| Northern Europe | 810 | 0.2% |
| Norway | 28 | 0.0% |
| Oceania | 472 | 0.1% |
| Pakistan | 314 | 0.1% |
| Panama | 51 | 0.0% |
| Peru | 312 | 0.1% |
| Philippines | 469 | 0.1% |
| Poland | 167 | 0.0% |
| Portugal | 42 | 0.0% |
| Romania | 56 | 0.0% |
| Russia | 198 | 0.1% |
| Saudi Arabia | 117 | 0.0% |
| Scotland | 76 | 0.0% |
| Singapore | 9 | 0.0% |
| South Africa | 77 | 0.0% |
| South America | 2,308 | 0.6% |
| South Central Asia | 2,633 | 0.6% |
| South Eastern Asia | 5,264 | 1.3% |
| Southern Europe | 375 | 0.1% |
| Spain | 201 | 0.1% |
| Sri Lanka | 12 | 0.0% |
| Sudan | 24 | 0.0% |
| Sweden | 47 | 0.0% |
| Switzerland | 7 | 0.0% |
| Syria | 165 | 0.0% |
| Taiwan | 52 | 0.0% |
| Thailand | 275 | 0.1% |
| Trinidad and Tobago | 67 | 0.0% |
| Turkey | 89 | 0.0% |
| Uganda | 53 | 0.0% |
| Ukraine | 335 | 0.1% |
| Uruguay | 12 | 0.0% |
| Uzbekistan | 15 | 0.0% |
| Venezuela | 925 | 0.2% |
| Vietnam | 1,401 | 0.3% |
| Western Africa | 1,174 | 0.3% |
| Western Asia | 943 | 0.2% |
| Western Europe | 820 | 0.2% |
| Yemen | 19 | 0.0% |
| Zaire | 57 | 0.0% |
| Zimbabwe | 50 | 0.0% | View All 122 Rows |
Sex and Age in Tulsa
Sex and Age in Tulsa
The most populous age groups in Tulsa are 25 to 29 Years (15,892 | 7.9%) for men and 25 to 29 Years (16,321 | 7.8%) for women.
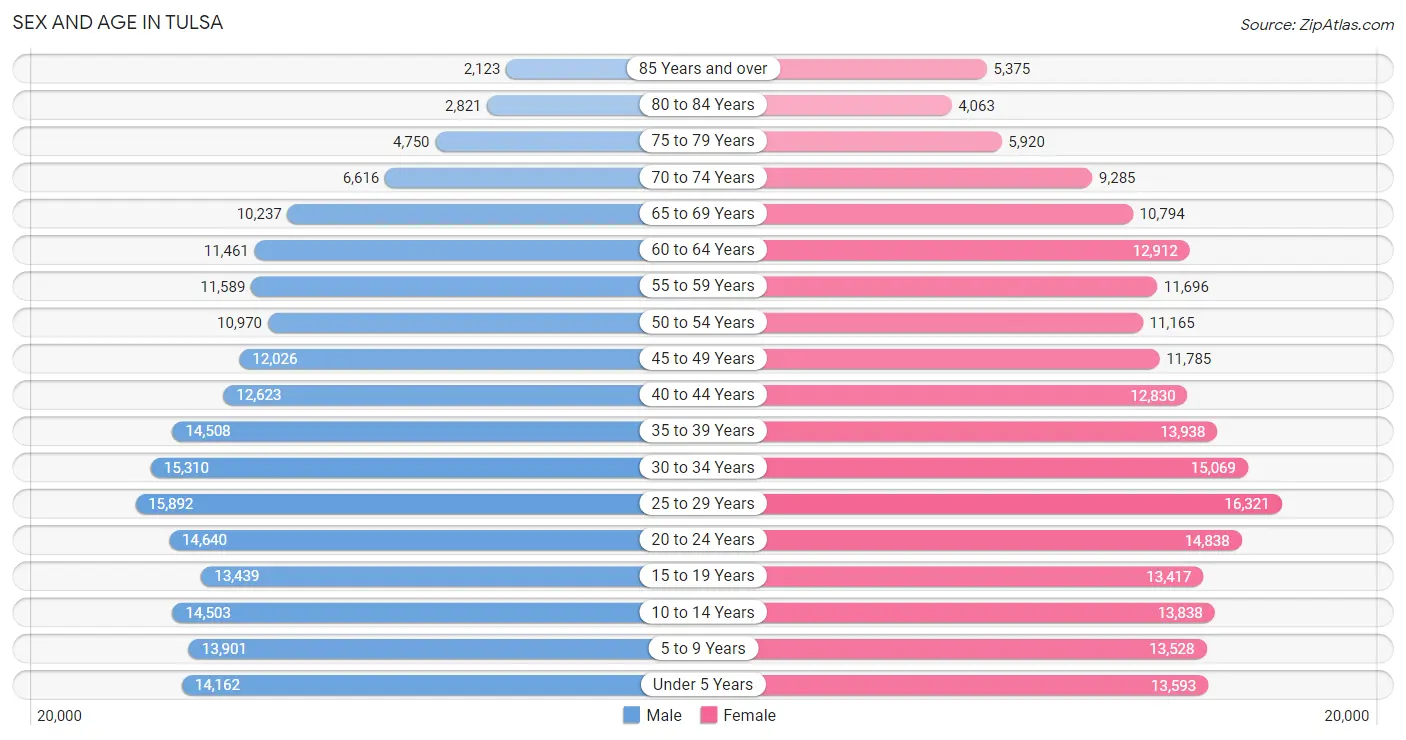
| Age Bracket | Male | Female |
| Under 5 Years | 14,162 (7.0%) | 13,593 (6.5%) |
| 5 to 9 Years | 13,901 (6.9%) | 13,528 (6.4%) |
| 10 to 14 Years | 14,503 (7.2%) | 13,838 (6.6%) |
| 15 to 19 Years | 13,439 (6.7%) | 13,417 (6.4%) |
| 20 to 24 Years | 14,640 (7.3%) | 14,838 (7.0%) |
| 25 to 29 Years | 15,892 (7.9%) | 16,321 (7.8%) |
| 30 to 34 Years | 15,310 (7.6%) | 15,069 (7.2%) |
| 35 to 39 Years | 14,508 (7.2%) | 13,938 (6.6%) |
| 40 to 44 Years | 12,623 (6.3%) | 12,830 (6.1%) |
| 45 to 49 Years | 12,026 (6.0%) | 11,785 (5.6%) |
| 50 to 54 Years | 10,970 (5.4%) | 11,165 (5.3%) |
| 55 to 59 Years | 11,589 (5.8%) | 11,696 (5.6%) |
| 60 to 64 Years | 11,461 (5.7%) | 12,912 (6.1%) |
| 65 to 69 Years | 10,237 (5.1%) | 10,794 (5.1%) |
| 70 to 74 Years | 6,616 (3.3%) | 9,285 (4.4%) |
| 75 to 79 Years | 4,750 (2.4%) | 5,920 (2.8%) |
| 80 to 84 Years | 2,821 (1.4%) | 4,063 (1.9%) |
| 85 Years and over | 2,123 (1.1%) | 5,375 (2.6%) |
| Total | 201,571 (100.0%) | 210,367 (100.0%) |
Families and Households in Tulsa
Median Family Size in Tulsa
The median family size in Tulsa is 3.17 persons per family, with married-couple families (64,007 | 67.0%) accounting for the largest median family size of 3.21 persons per family. On the other hand, single male/father families (8,741 | 9.1%) represent the smallest median family size with 2.88 persons per family.
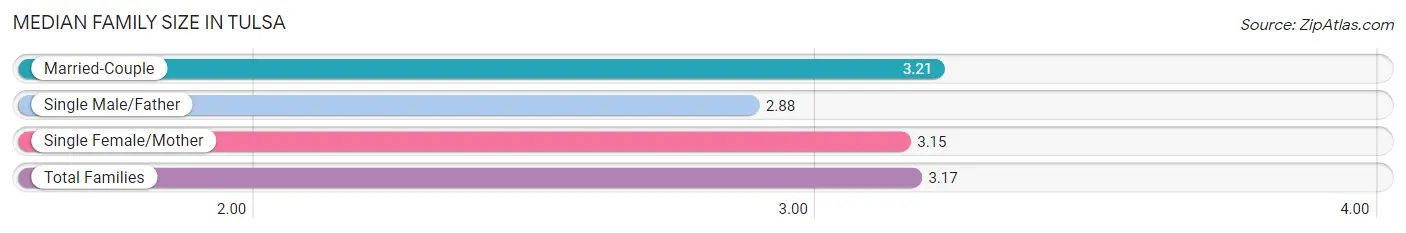
| Family Type | # Families | Family Size |
| Married-Couple | 64,007 (67.0%) | 3.21 |
| Single Male/Father | 8,741 (9.1%) | 2.88 |
| Single Female/Mother | 22,747 (23.8%) | 3.15 |
| Total Families | 95,495 (100.0%) | 3.17 |
Median Household Size in Tulsa
The median household size in Tulsa is 2.38 persons per household, with single female/mother households (22,747 | 13.4%) accounting for the largest median household size of 3.35 persons per household. non-family households (74,288 | 43.8%) represent the smallest median household size with 1.25 persons per household.
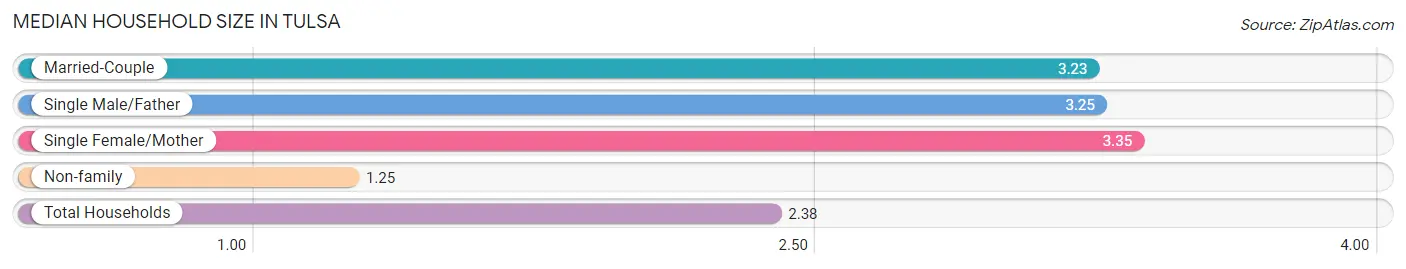
| Household Type | # Households | Household Size |
| Married-Couple | 64,007 (37.7%) | 3.23 |
| Single Male/Father | 8,741 (5.1%) | 3.25 |
| Single Female/Mother | 22,747 (13.4%) | 3.35 |
| Non-family | 74,288 (43.8%) | 1.25 |
| Total Households | 169,783 (100.0%) | 2.38 |
Household Size by Marriage Status in Tulsa
Out of a total of 169,783 households in Tulsa, 95,495 (56.2%) are family households, while 74,288 (43.8%) are nonfamily households. The most numerous type of family households are 2-person households, comprising 43,449, and the most common type of nonfamily households are 1-person households, comprising 60,460.
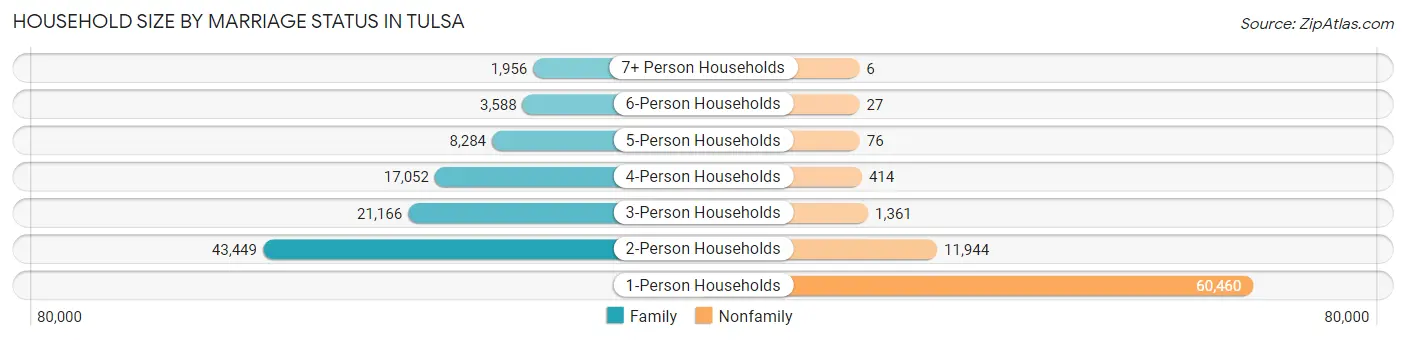
| Household Size | Family Households | Nonfamily Households |
| 1-Person Households | - | 60,460 (35.6%) |
| 2-Person Households | 43,449 (25.6%) | 11,944 (7.0%) |
| 3-Person Households | 21,166 (12.5%) | 1,361 (0.8%) |
| 4-Person Households | 17,052 (10.0%) | 414 (0.2%) |
| 5-Person Households | 8,284 (4.9%) | 76 (0.0%) |
| 6-Person Households | 3,588 (2.1%) | 27 (0.0%) |
| 7+ Person Households | 1,956 (1.1%) | 6 (0.0%) |
| Total | 95,495 (56.2%) | 74,288 (43.8%) |
Female Fertility in Tulsa
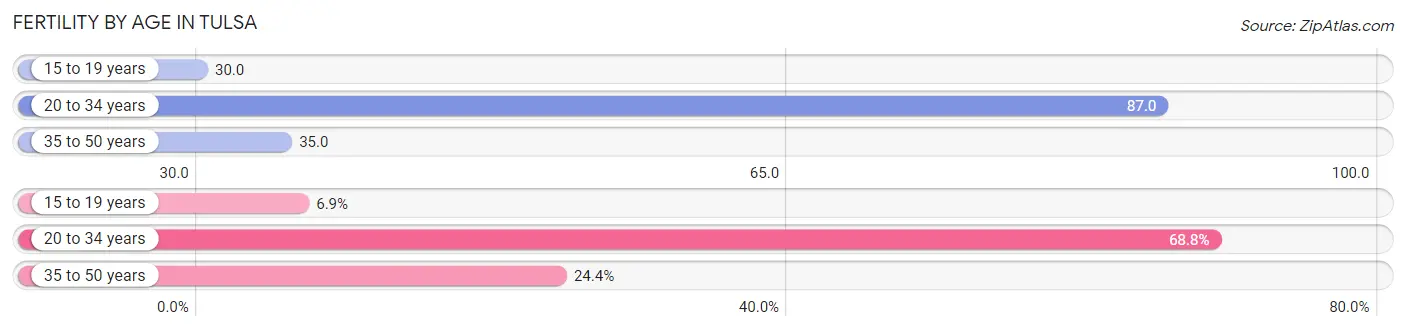
Fertility by Age in Tulsa
Average fertility rate in Tulsa is 58.0 births per 1,000 women. Women in the age bracket of 20 to 34 years have the highest fertility rate with 87.0 births per 1,000 women. Women in the age bracket of 20 to 34 years acount for 68.8% of all women with births.
| Age Bracket | Women with Births | Births / 1,000 Women |
| 15 to 19 years | 400 (6.9%) | 30.0 |
| 20 to 34 years | 4,002 (68.8%) | 87.0 |
| 35 to 50 years | 1,418 (24.4%) | 35.0 |
| Total | 5,820 (100.0%) | 58.0 |
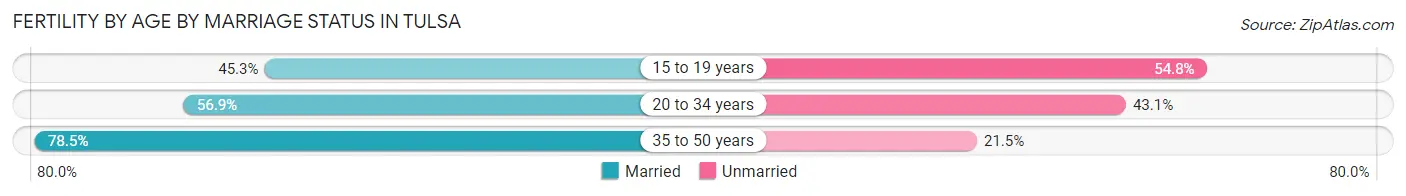
Fertility by Age by Marriage Status in Tulsa
61.4% of women with births (5,820) in Tulsa are married. The highest percentage of unmarried women with births falls into 15 to 19 years age bracket with 54.7% of them unmarried at the time of birth, while the lowest percentage of unmarried women with births belong to 35 to 50 years age bracket with 21.5% of them unmarried.
| Age Bracket | Married | Unmarried |
| 15 to 19 years | 181 (45.3%) | 219 (54.7%) |
| 20 to 34 years | 2,277 (56.9%) | 1,725 (43.1%) |
| 35 to 50 years | 1,113 (78.5%) | 305 (21.5%) |
| Total | 3,573 (61.4%) | 2,247 (38.6%) |
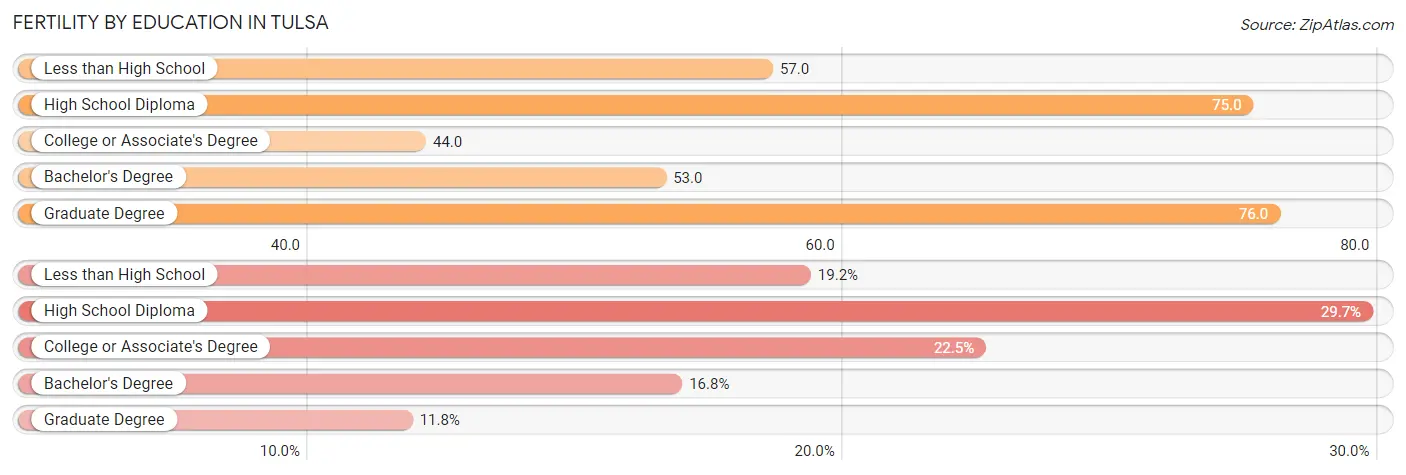
Fertility by Education in Tulsa
Average fertility rate in Tulsa is 58.0 births per 1,000 women. Women with the education attainment of graduate degree have the highest fertility rate of 76.0 births per 1,000 women, while women with the education attainment of college or associate's degree have the lowest fertility at 44.0 births per 1,000 women. Women with the education attainment of high school diploma represent 29.7% of all women with births.
| Educational Attainment | Women with Births | Births / 1,000 Women |
| Less than High School | 1,118 (19.2%) | 57.0 |
| High School Diploma | 1,731 (29.7%) | 75.0 |
| College or Associate's Degree | 1,309 (22.5%) | 44.0 |
| Bachelor's Degree | 978 (16.8%) | 53.0 |
| Graduate Degree | 684 (11.7%) | 76.0 |
| Total | 5,820 (100.0%) | 58.0 |
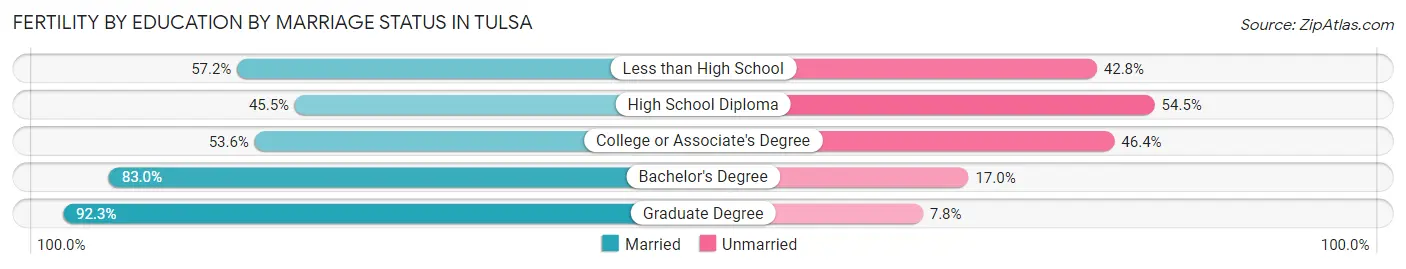
Fertility by Education by Marriage Status in Tulsa
38.6% of women with births in Tulsa are unmarried. Women with the educational attainment of graduate degree are most likely to be married with 92.2% of them married at childbirth, while women with the educational attainment of high school diploma are least likely to be married with 54.5% of them unmarried at childbirth.
| Educational Attainment | Married | Unmarried |
| Less than High School | 639 (57.2%) | 479 (42.8%) |
| High School Diploma | 788 (45.5%) | 943 (54.5%) |
| College or Associate's Degree | 702 (53.6%) | 607 (46.4%) |
| Bachelor's Degree | 812 (83.0%) | 166 (17.0%) |
| Graduate Degree | 631 (92.2%) | 53 (7.7%) |
| Total | 3,573 (61.4%) | 2,247 (38.6%) |
Income in Tulsa
Income Overview in Tulsa
Per Capita Income in Tulsa is $36,490, while median incomes of families and households are $74,430 and $56,648 respectively.
| Characteristic | Number | Measure |
| Per Capita Income | 411,938 | $36,490 |
| Median Family Income | 95,495 | $74,430 |
| Mean Family Income | 95,495 | $108,093 |
| Median Household Income | 169,783 | $56,648 |
| Mean Household Income | 169,783 | $86,593 |
| Income Deficit | 95,495 | $12,243 |
| Wage / Income Gap (%) | 411,938 | 25.15% |
| Wage / Income Gap ($) | 411,938 | 74.85¢ per $1 |
| Gini / Inequality Index | 411,938 | 0.51 |
Earnings by Sex in Tulsa
Average Earnings in Tulsa are $35,765, $41,141 for men and $30,794 for women, a difference of 25.2%.
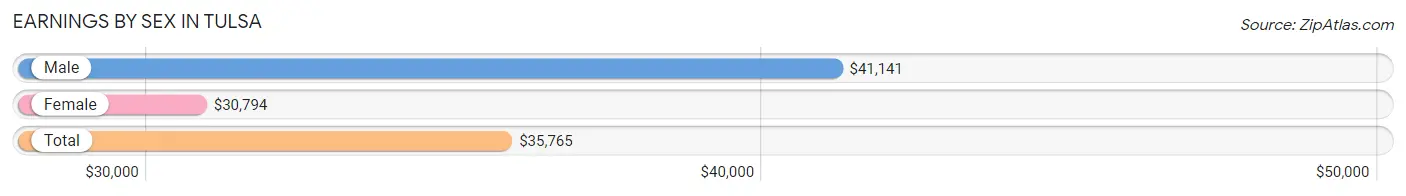
| Sex | Number | Average Earnings |
| Male | 114,948 (52.6%) | $41,141 |
| Female | 103,371 (47.3%) | $30,794 |
| Total | 218,319 (100.0%) | $35,765 |
Earnings by Sex by Income Bracket in Tulsa
The most common earnings brackets in Tulsa are $100,000+ for men (16,807 | 14.6%) and $25,000 to $29,999 for women (8,091 | 7.8%).
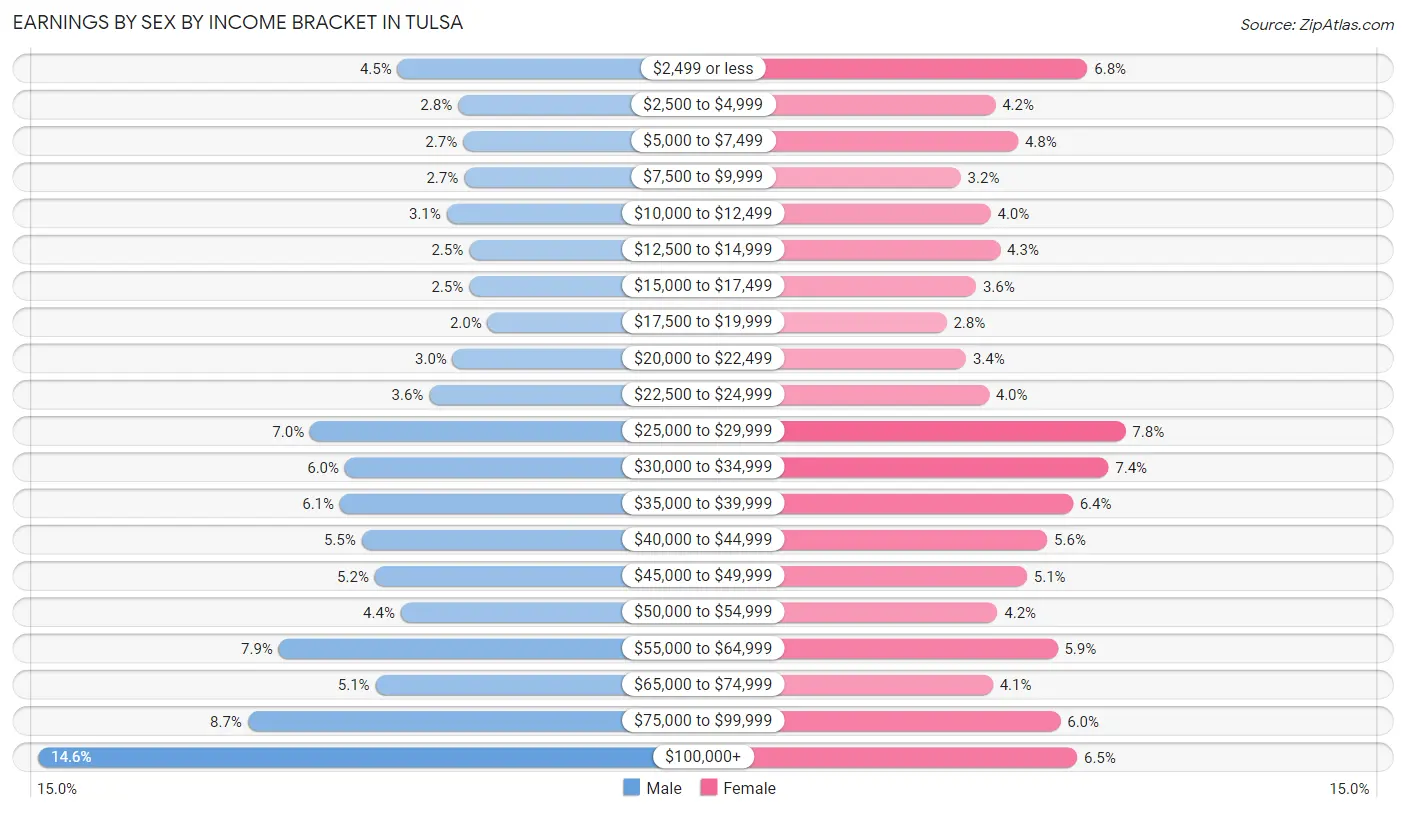
| Income | Male | Female |
| $2,499 or less | 5,195 (4.5%) | 6,986 (6.8%) |
| $2,500 to $4,999 | 3,236 (2.8%) | 4,309 (4.2%) |
| $5,000 to $7,499 | 3,082 (2.7%) | 4,968 (4.8%) |
| $7,500 to $9,999 | 3,050 (2.6%) | 3,313 (3.2%) |
| $10,000 to $12,499 | 3,612 (3.1%) | 4,180 (4.0%) |
| $12,500 to $14,999 | 2,883 (2.5%) | 4,459 (4.3%) |
| $15,000 to $17,499 | 2,886 (2.5%) | 3,753 (3.6%) |
| $17,500 to $19,999 | 2,282 (2.0%) | 2,892 (2.8%) |
| $20,000 to $22,499 | 3,415 (3.0%) | 3,462 (3.4%) |
| $22,500 to $24,999 | 4,175 (3.6%) | 4,128 (4.0%) |
| $25,000 to $29,999 | 8,021 (7.0%) | 8,091 (7.8%) |
| $30,000 to $34,999 | 6,900 (6.0%) | 7,602 (7.3%) |
| $35,000 to $39,999 | 7,060 (6.1%) | 6,562 (6.4%) |
| $40,000 to $44,999 | 6,355 (5.5%) | 5,816 (5.6%) |
| $45,000 to $49,999 | 5,929 (5.2%) | 5,231 (5.1%) |
| $50,000 to $54,999 | 5,093 (4.4%) | 4,376 (4.2%) |
| $55,000 to $64,999 | 9,033 (7.9%) | 6,119 (5.9%) |
| $65,000 to $74,999 | 5,904 (5.1%) | 4,240 (4.1%) |
| $75,000 to $99,999 | 10,030 (8.7%) | 6,201 (6.0%) |
| $100,000+ | 16,807 (14.6%) | 6,683 (6.5%) |
| Total | 114,948 (100.0%) | 103,371 (100.0%) |
Earnings by Sex by Educational Attainment in Tulsa
Average earnings in Tulsa are $46,738 for men and $35,183 for women, a difference of 24.7%. Men with an educational attainment of graduate degree enjoy the highest average annual earnings of $92,122, while those with less than high school education earn the least with $31,354. Women with an educational attainment of graduate degree earn the most with the average annual earnings of $58,442, while those with less than high school education have the smallest earnings of $21,228.
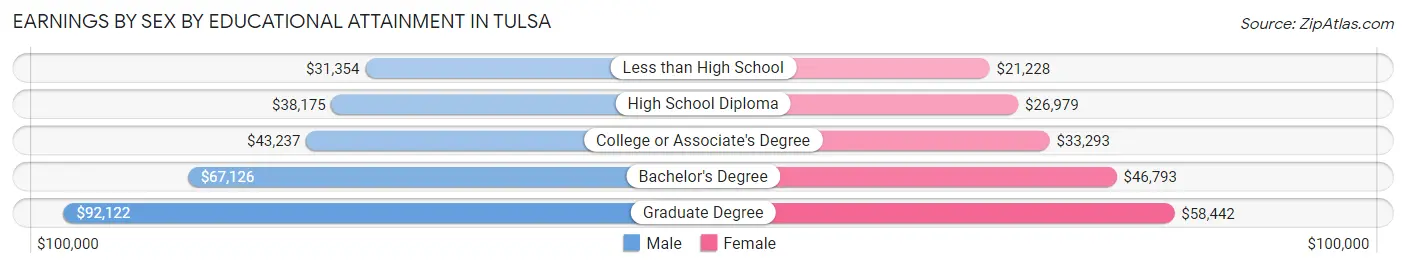
| Educational Attainment | Male Income | Female Income |
| Less than High School | $31,354 | $21,228 |
| High School Diploma | $38,175 | $26,979 |
| College or Associate's Degree | $43,237 | $33,293 |
| Bachelor's Degree | $67,126 | $46,793 |
| Graduate Degree | $92,122 | $58,442 |
| Total | $46,738 | $35,183 |
Family Income in Tulsa
Family Income Brackets in Tulsa
According to the Tulsa family income data, there are 16,139 families falling into the $50,000 to $74,999 income range, which is the most common income bracket and makes up 16.9% of all families. Conversely, the $10,000 to $14,999 income bracket is the least frequent group with only 2,674 families (2.8%) belonging to this category.
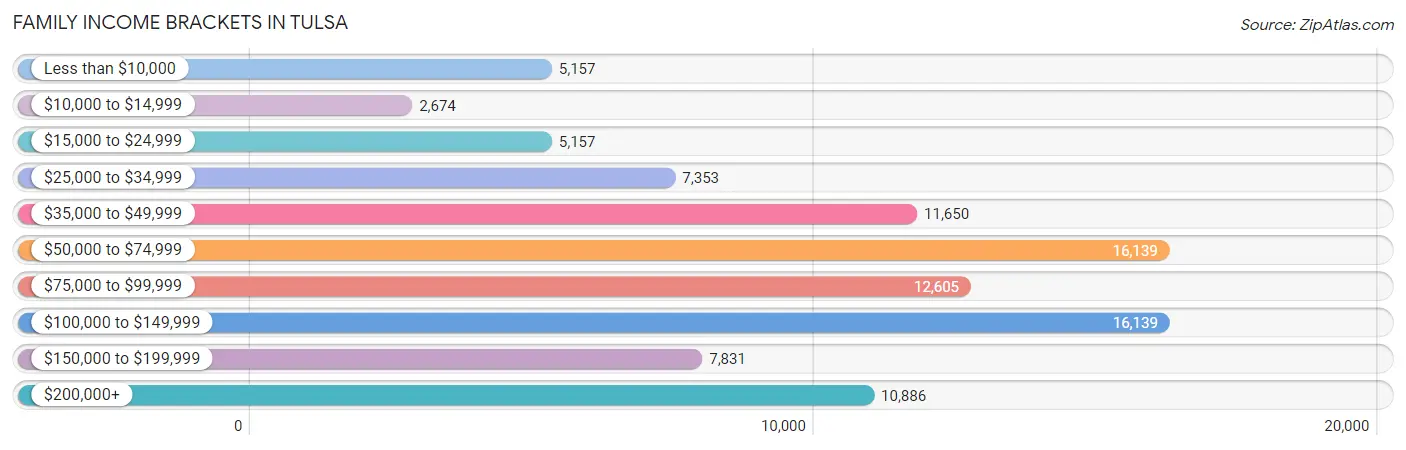
| Income Bracket | # Families | % Families |
| Less than $10,000 | 5,157 | 5.4% |
| $10,000 to $14,999 | 2,674 | 2.8% |
| $15,000 to $24,999 | 5,157 | 5.4% |
| $25,000 to $34,999 | 7,353 | 7.7% |
| $35,000 to $49,999 | 11,650 | 12.2% |
| $50,000 to $74,999 | 16,139 | 16.9% |
| $75,000 to $99,999 | 12,605 | 13.2% |
| $100,000 to $149,999 | 16,139 | 16.9% |
| $150,000 to $199,999 | 7,831 | 8.2% |
| $200,000+ | 10,886 | 11.4% |
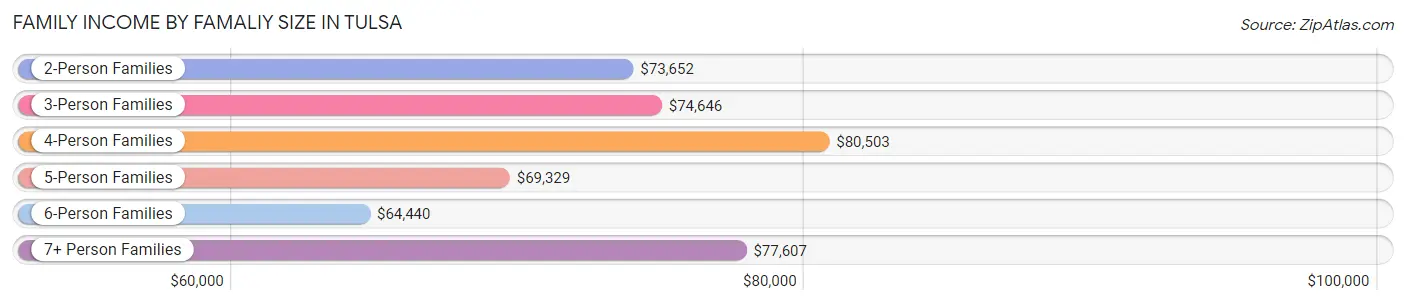
Family Income by Famaliy Size in Tulsa
4-person families (16,294 | 17.1%) account for the highest median family income in Tulsa with $80,503 per family, while 2-person families (46,840 | 49.0%) have the highest median income of $36,826 per family member.
| Income Bracket | # Families | Median Income |
| 2-Person Families | 46,840 (49.0%) | $73,652 |
| 3-Person Families | 19,895 (20.8%) | $74,646 |
| 4-Person Families | 16,294 (17.1%) | $80,503 |
| 5-Person Families | 7,607 (8.0%) | $69,329 |
| 6-Person Families | 3,168 (3.3%) | $64,440 |
| 7+ Person Families | 1,691 (1.8%) | $77,607 |
| Total | 95,495 (100.0%) | $74,430 |
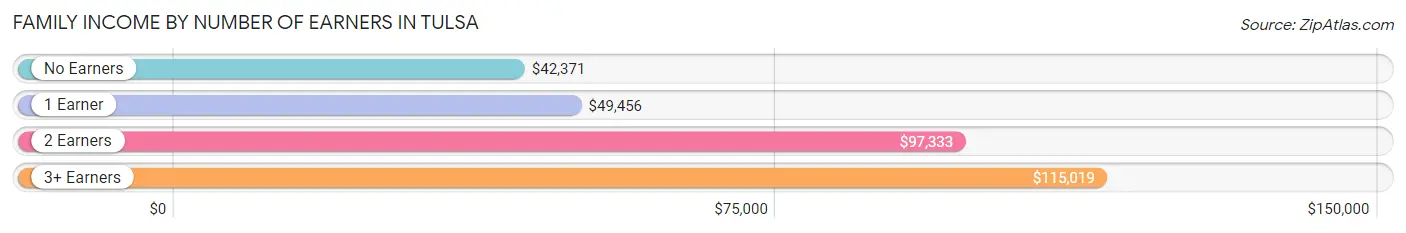
Family Income by Number of Earners in Tulsa
The median family income in Tulsa is $74,430, with families comprising 3+ earners (8,647) having the highest median family income of $115,019, while families with no earners (13,068) have the lowest median family income of $42,371, accounting for 9.0% and 13.7% of families, respectively.
| Number of Earners | # Families | Median Income |
| No Earners | 13,068 (13.7%) | $42,371 |
| 1 Earner | 34,942 (36.6%) | $49,456 |
| 2 Earners | 38,838 (40.7%) | $97,333 |
| 3+ Earners | 8,647 (9.0%) | $115,019 |
| Total | 95,495 (100.0%) | $74,430 |
Household Income in Tulsa
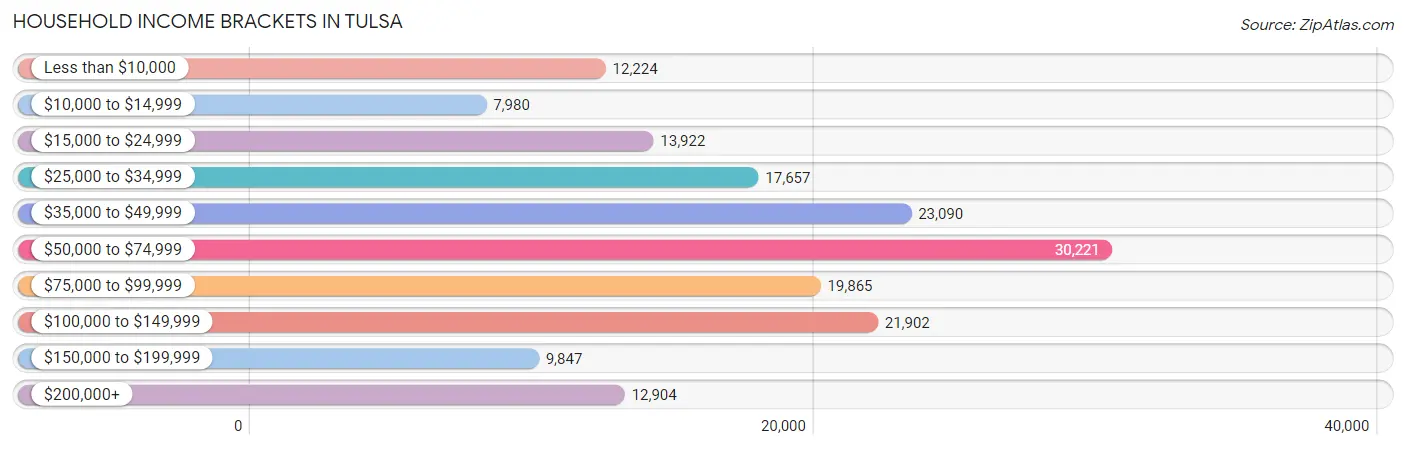
Household Income Brackets in Tulsa
With 30,221 households falling in the category, the $50,000 to $74,999 income range is the most frequent in Tulsa, accounting for 17.8% of all households. In contrast, only 7,980 households (4.7%) fall into the $10,000 to $14,999 income bracket, making it the least populous group.
| Income Bracket | # Households | % Households |
| Less than $10,000 | 12,224 | 7.2% |
| $10,000 to $14,999 | 7,980 | 4.7% |
| $15,000 to $24,999 | 13,922 | 8.2% |
| $25,000 to $34,999 | 17,657 | 10.4% |
| $35,000 to $49,999 | 23,090 | 13.6% |
| $50,000 to $74,999 | 30,221 | 17.8% |
| $75,000 to $99,999 | 19,865 | 11.7% |
| $100,000 to $149,999 | 21,902 | 12.9% |
| $150,000 to $199,999 | 9,847 | 5.8% |
| $200,000+ | 12,904 | 7.6% |
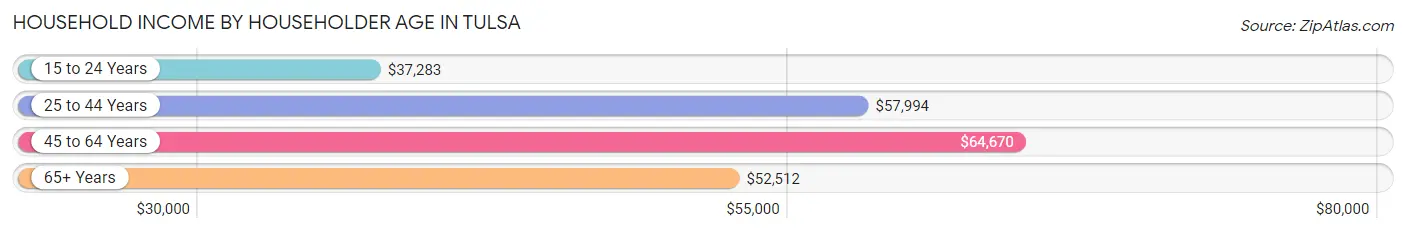
Household Income by Householder Age in Tulsa
The median household income in Tulsa is $56,648, with the highest median household income of $64,670 found in the 45 to 64 years age bracket for the primary householder. A total of 55,933 households (32.9%) fall into this category. Meanwhile, the 15 to 24 years age bracket for the primary householder has the lowest median household income of $37,283, with 10,606 households (6.2%) in this group.
| Income Bracket | # Households | Median Income |
| 15 to 24 Years | 10,606 (6.2%) | $37,283 |
| 25 to 44 Years | 61,279 (36.1%) | $57,994 |
| 45 to 64 Years | 55,933 (32.9%) | $64,670 |
| 65+ Years | 41,965 (24.7%) | $52,512 |
| Total | 169,783 (100.0%) | $56,648 |
Poverty in Tulsa
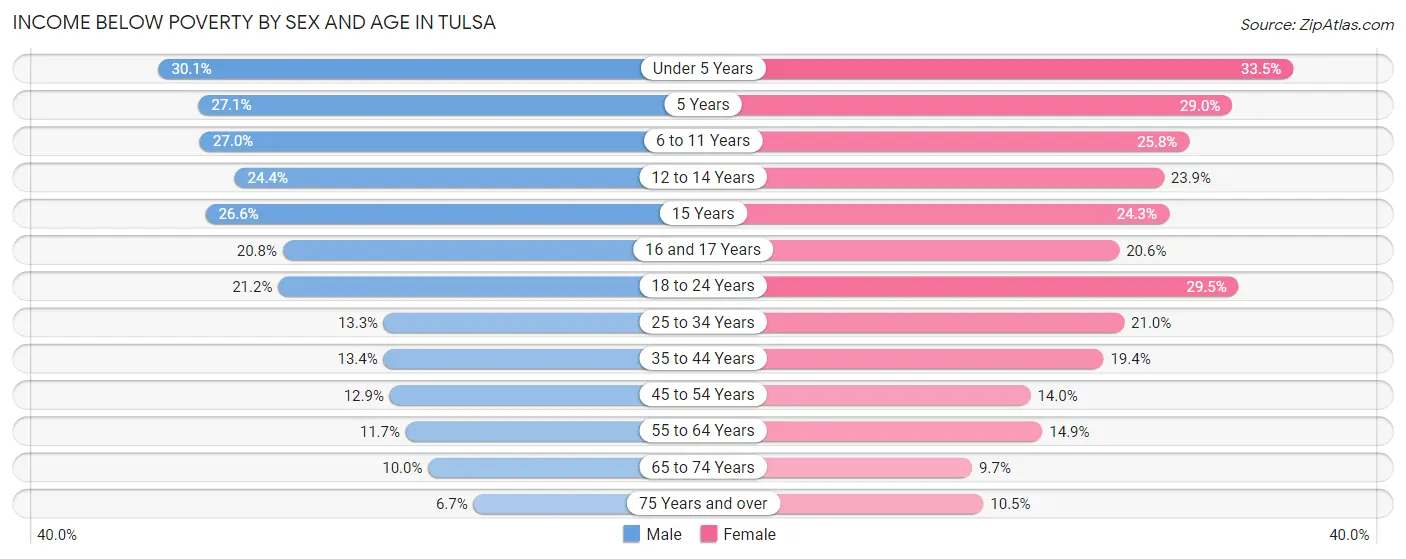
Income Below Poverty by Sex and Age in Tulsa
With 16.6% poverty level for males and 19.7% for females among the residents of Tulsa, under 5 year old males and under 5 year old females are the most vulnerable to poverty, with 4,186 males (30.1%) and 4,480 females (33.5%) in their respective age groups living below the poverty level.
| Age Bracket | Male | Female |
| Under 5 Years | 4,186 (30.1%) | 4,480 (33.5%) |
| 5 Years | 707 (27.1%) | 664 (29.0%) |
| 6 to 11 Years | 4,602 (27.0%) | 4,340 (25.8%) |
| 12 to 14 Years | 2,057 (24.4%) | 1,907 (23.9%) |
| 15 Years | 649 (26.6%) | 617 (24.3%) |
| 16 and 17 Years | 1,103 (20.8%) | 1,051 (20.6%) |
| 18 to 24 Years | 3,973 (21.2%) | 5,482 (29.5%) |
| 25 to 34 Years | 4,080 (13.3%) | 6,546 (21.0%) |
| 35 to 44 Years | 3,574 (13.4%) | 5,190 (19.4%) |
| 45 to 54 Years | 2,949 (12.9%) | 3,205 (14.0%) |
| 55 to 64 Years | 2,649 (11.7%) | 3,647 (14.9%) |
| 65 to 74 Years | 1,674 (10.0%) | 1,917 (9.7%) |
| 75 Years and over | 631 (6.7%) | 1,514 (10.5%) |
| Total | 32,834 (16.6%) | 40,560 (19.7%) |
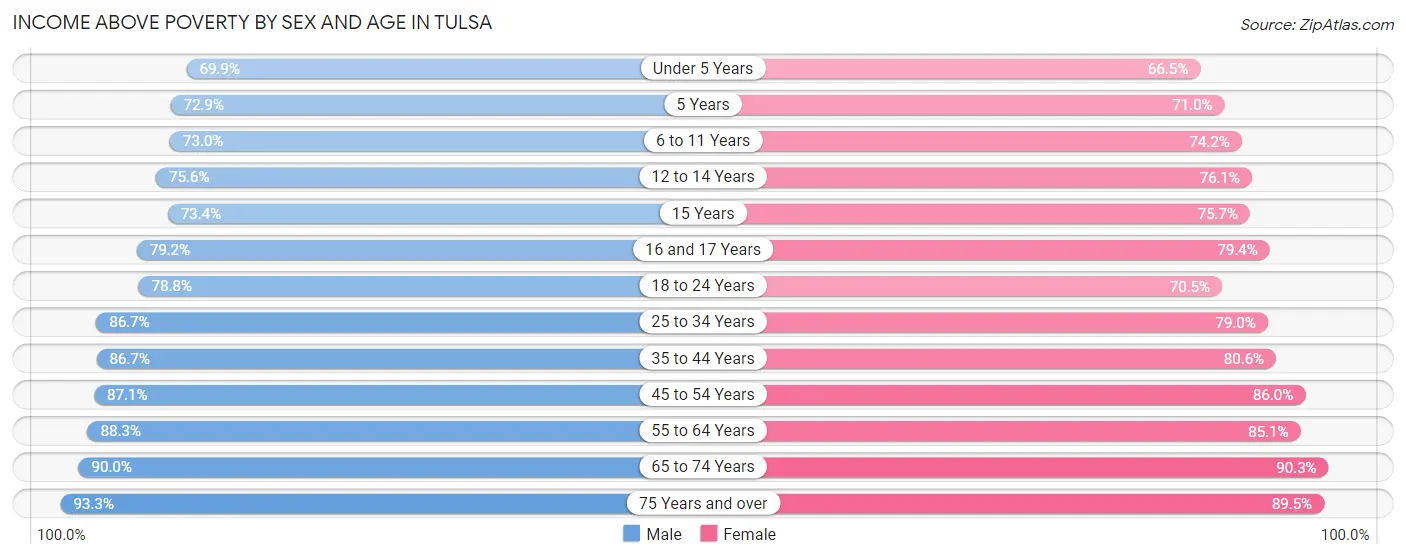
Income Above Poverty by Sex and Age in Tulsa
According to the poverty statistics in Tulsa, males aged 75 years and over and females aged 65 to 74 years are the age groups that are most secure financially, with 93.3% of males and 90.3% of females in these age groups living above the poverty line.
| Age Bracket | Male | Female |
| Under 5 Years | 9,740 (69.9%) | 8,889 (66.5%) |
| 5 Years | 1,902 (72.9%) | 1,627 (71.0%) |
| 6 to 11 Years | 12,456 (73.0%) | 12,491 (74.2%) |
| 12 to 14 Years | 6,373 (75.6%) | 6,068 (76.1%) |
| 15 Years | 1,794 (73.4%) | 1,924 (75.7%) |
| 16 and 17 Years | 4,191 (79.2%) | 4,050 (79.4%) |
| 18 to 24 Years | 14,795 (78.8%) | 13,125 (70.5%) |
| 25 to 34 Years | 26,548 (86.7%) | 24,678 (79.0%) |
| 35 to 44 Years | 23,197 (86.7%) | 21,516 (80.6%) |
| 45 to 54 Years | 19,936 (87.1%) | 19,665 (86.0%) |
| 55 to 64 Years | 19,990 (88.3%) | 20,853 (85.1%) |
| 65 to 74 Years | 15,014 (90.0%) | 17,896 (90.3%) |
| 75 Years and over | 8,828 (93.3%) | 12,887 (89.5%) |
| Total | 164,764 (83.4%) | 165,669 (80.3%) |
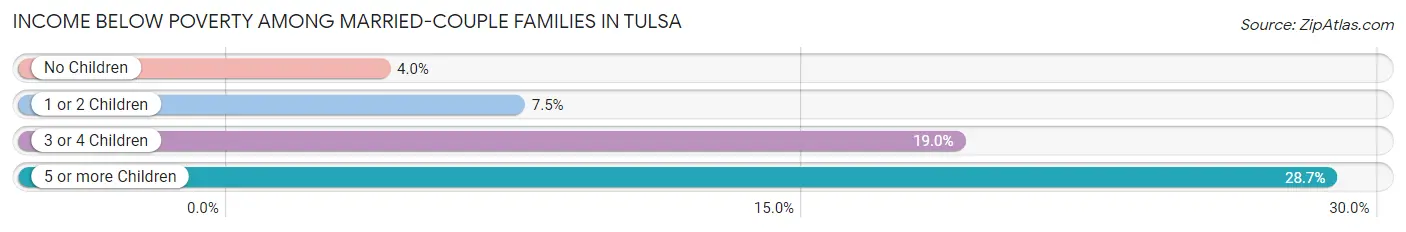
Income Below Poverty Among Married-Couple Families in Tulsa
The poverty statistics for married-couple families in Tulsa show that 6.8% or 4,373 of the total 64,007 families live below the poverty line. Families with 5 or more children have the highest poverty rate of 28.7%, comprising of 165 families. On the other hand, families with no children have the lowest poverty rate of 4.0%, which includes 1,461 families.
| Children | Above Poverty | Below Poverty |
| No Children | 35,374 (96.0%) | 1,461 (4.0%) |
| 1 or 2 Children | 18,534 (92.5%) | 1,501 (7.5%) |
| 3 or 4 Children | 5,316 (81.0%) | 1,246 (19.0%) |
| 5 or more Children | 410 (71.3%) | 165 (28.7%) |
| Total | 59,634 (93.2%) | 4,373 (6.8%) |
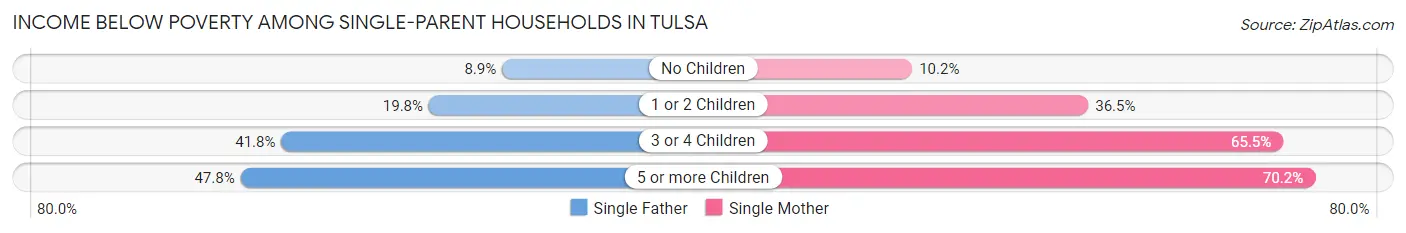
Income Below Poverty Among Single-Parent Households in Tulsa
According to the poverty data in Tulsa, 16.9% or 1,475 single-father households and 32.1% or 7,293 single-mother households are living below the poverty line. Among single-father households, those with 5 or more children have the highest poverty rate, with 11 households (47.8%) experiencing poverty. Likewise, among single-mother households, those with 5 or more children have the highest poverty rate, with 269 households (70.2%) falling below the poverty line.
| Children | Single Father | Single Mother |
| No Children | 351 (8.9%) | 778 (10.2%) |
| 1 or 2 Children | 784 (19.8%) | 4,288 (36.4%) |
| 3 or 4 Children | 329 (41.7%) | 1,958 (65.5%) |
| 5 or more Children | 11 (47.8%) | 269 (70.2%) |
| Total | 1,475 (16.9%) | 7,293 (32.1%) |
Income Below Poverty Among Married-Couple vs Single-Parent Households in Tulsa
The poverty data for Tulsa shows that 4,373 of the married-couple family households (6.8%) and 8,768 of the single-parent households (27.9%) are living below the poverty level. Within the married-couple family households, those with 5 or more children have the highest poverty rate, with 165 households (28.7%) falling below the poverty line. Among the single-parent households, those with 5 or more children have the highest poverty rate, with 280 household (69.0%) living below poverty.
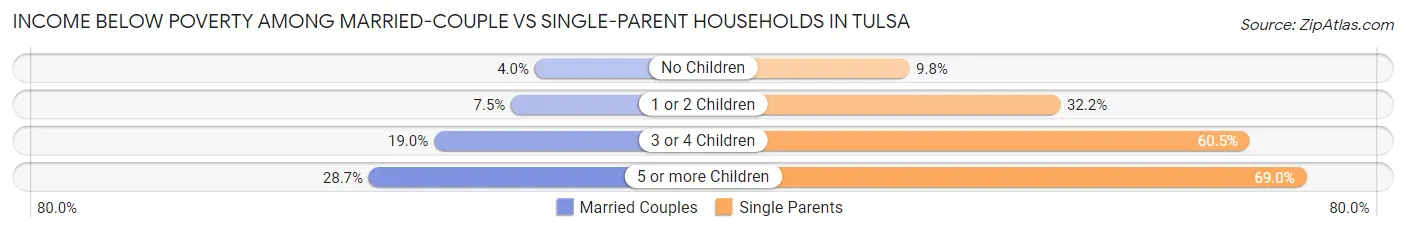
| Children | Married-Couple Families | Single-Parent Households |
| No Children | 1,461 (4.0%) | 1,129 (9.8%) |
| 1 or 2 Children | 1,501 (7.5%) | 5,072 (32.2%) |
| 3 or 4 Children | 1,246 (19.0%) | 2,287 (60.5%) |
| 5 or more Children | 165 (28.7%) | 280 (69.0%) |
| Total | 4,373 (6.8%) | 8,768 (27.9%) |
Employment Characteristics in Tulsa
Employment by Class of Employer in Tulsa
Among the 193,318 employed individuals in Tulsa, private company employees (136,106 | 70.4%), not-for-profit organizations (17,275 | 8.9%), and self-employed (not incorporated) (12,157 | 6.3%) make up the most common classes of employment.
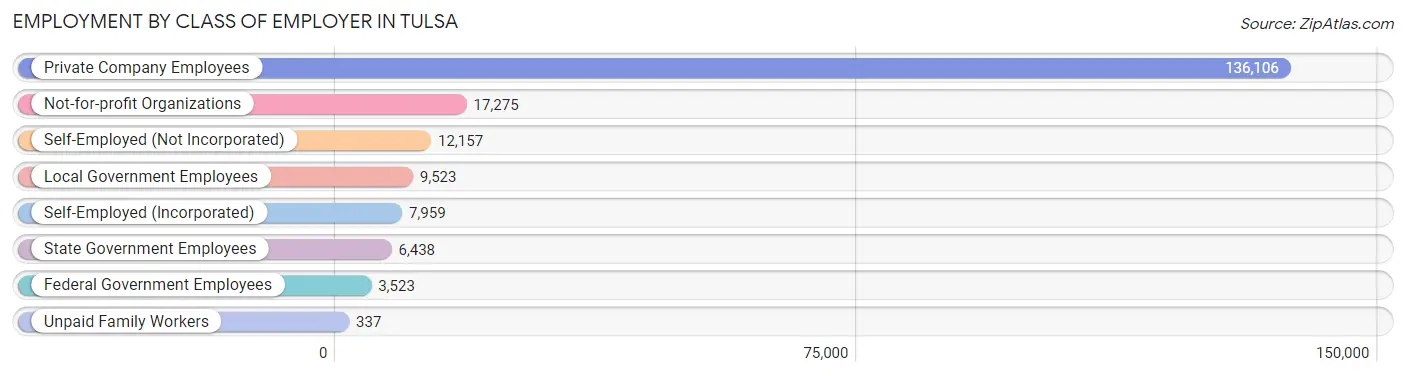
| Employer Class | # Employees | % Employees |
| Private Company Employees | 136,106 | 70.4% |
| Self-Employed (Incorporated) | 7,959 | 4.1% |
| Self-Employed (Not Incorporated) | 12,157 | 6.3% |
| Not-for-profit Organizations | 17,275 | 8.9% |
| Local Government Employees | 9,523 | 4.9% |
| State Government Employees | 6,438 | 3.3% |
| Federal Government Employees | 3,523 | 1.8% |
| Unpaid Family Workers | 337 | 0.2% |
| Total | 193,318 | 100.0% |
Employment Status by Age in Tulsa
According to the labor force statistics for Tulsa, out of the total population over 16 years of age (323,419), 64.7% or 209,252 individuals are in the labor force, with 5.8% or 12,137 of them unemployed. The age group with the highest labor force participation rate is 25 to 29 years, with 84.3% or 27,156 individuals in the labor force. Within the labor force, the 16 to 19 years age range has the highest percentage of unemployed individuals, with 14.4% or 1,329 of them being unemployed.
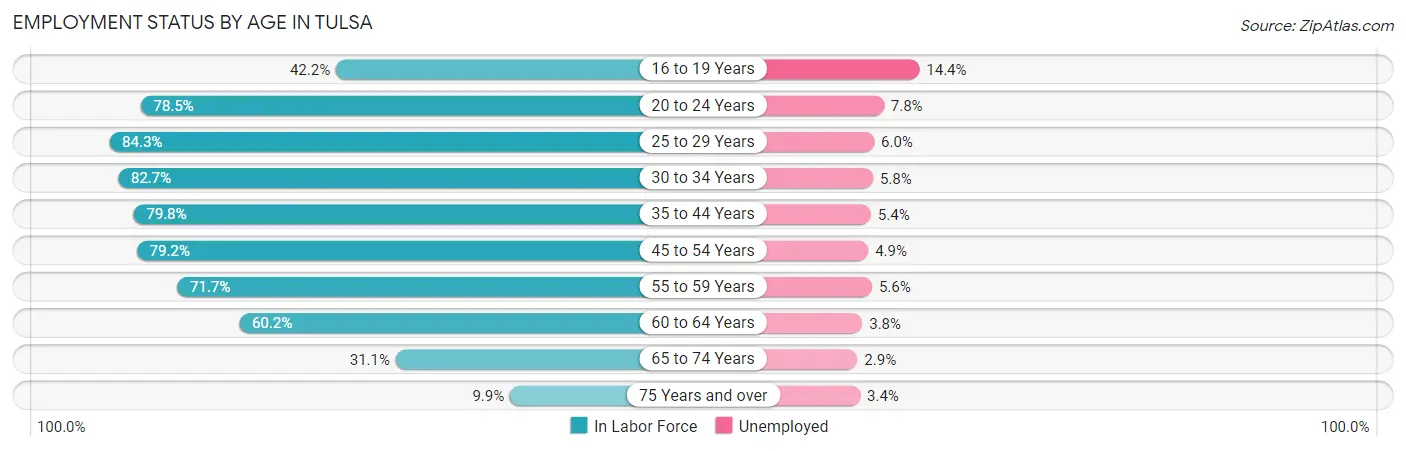
| Age Bracket | In Labor Force | Unemployed |
| 16 to 19 Years | 9,226 (42.2%) | 1,329 (14.4%) |
| 20 to 24 Years | 23,140 (78.5%) | 1,805 (7.8%) |
| 25 to 29 Years | 27,156 (84.3%) | 1,629 (6.0%) |
| 30 to 34 Years | 25,123 (82.7%) | 1,457 (5.8%) |
| 35 to 44 Years | 43,011 (79.8%) | 2,323 (5.4%) |
| 45 to 54 Years | 36,389 (79.2%) | 1,783 (4.9%) |
| 55 to 59 Years | 16,695 (71.7%) | 935 (5.6%) |
| 60 to 64 Years | 14,673 (60.2%) | 558 (3.8%) |
| 65 to 74 Years | 11,486 (31.1%) | 333 (2.9%) |
| 75 Years and over | 2,480 (9.9%) | 84 (3.4%) |
| Total | 209,252 (64.7%) | 12,137 (5.8%) |
Employment Status by Educational Attainment in Tulsa
According to labor force statistics for Tulsa, 77.6% of individuals (163,034) out of the total population between 25 and 64 years of age (210,095) are in the labor force, with 5.3% or 8,641 of them being unemployed. The group with the highest labor force participation rate are those with the educational attainment of bachelor's degree or higher, with 86.2% or 58,313 individuals in the labor force. Within the labor force, individuals with less than high school education have the highest percentage of unemployment, with 8.4% or 1,491 of them being unemployed.
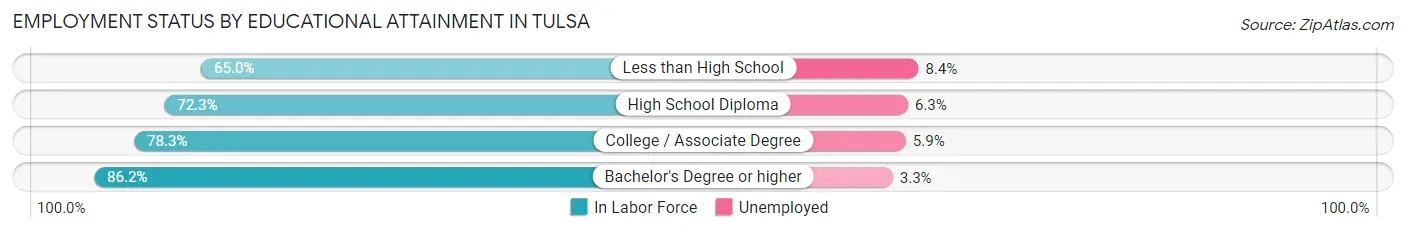
| Educational Attainment | In Labor Force | Unemployed |
| Less than High School | 17,750 (65.0%) | 2,294 (8.4%) |
| High School Diploma | 38,858 (72.3%) | 3,386 (6.3%) |
| College / Associate Degree | 48,072 (78.3%) | 3,622 (5.9%) |
| Bachelor's Degree or higher | 58,313 (86.2%) | 2,232 (3.3%) |
| Total | 163,034 (77.6%) | 11,135 (5.3%) |
Employment Occupations by Sex in Tulsa
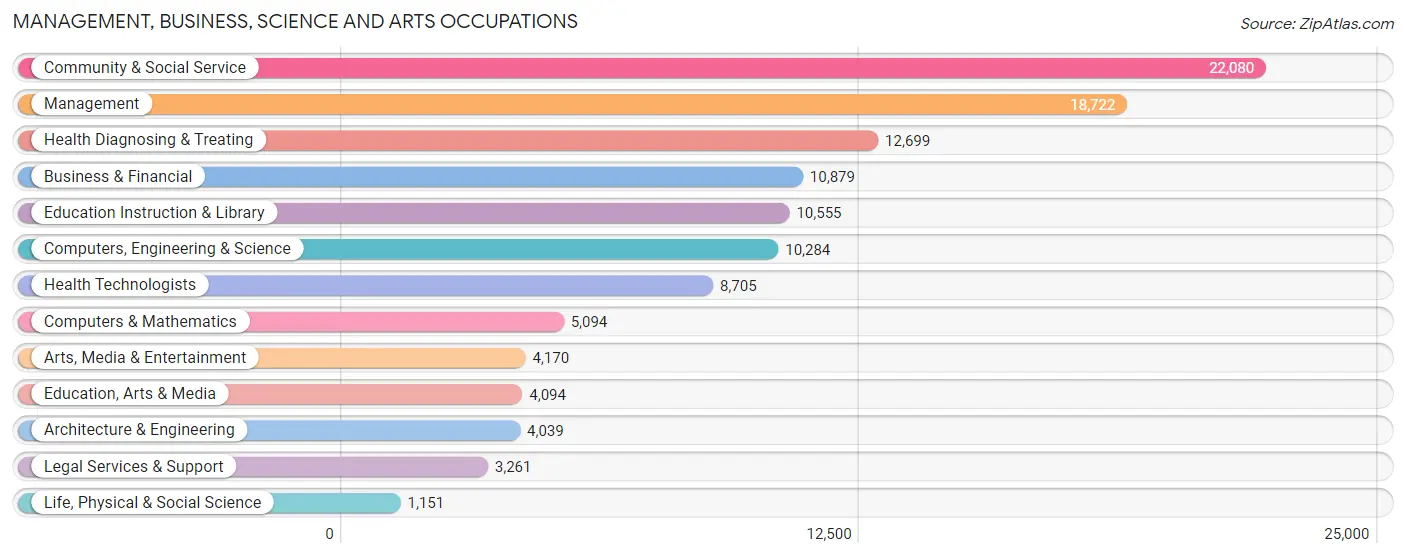
Management, Business, Science and Arts Occupations
The most common Management, Business, Science and Arts occupations in Tulsa are Community & Social Service (22,080 | 11.2%), Management (18,722 | 9.5%), Health Diagnosing & Treating (12,699 | 6.5%), Business & Financial (10,879 | 5.5%), and Education Instruction & Library (10,555 | 5.4%).
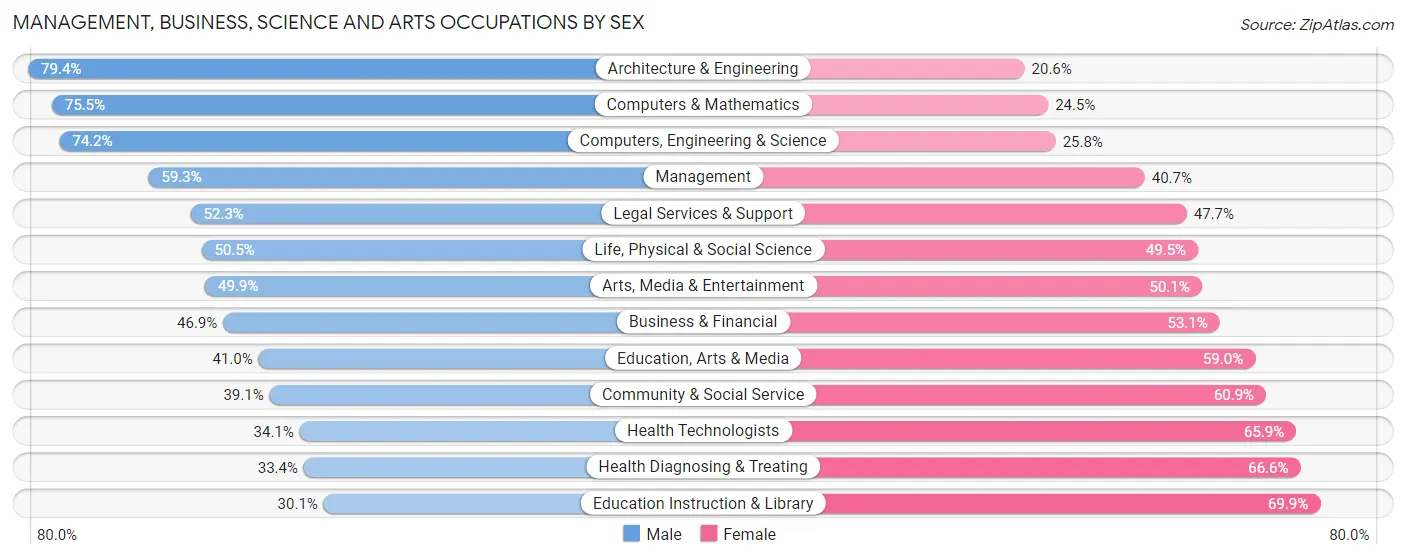
Management, Business, Science and Arts Occupations by Sex
Within the Management, Business, Science and Arts occupations in Tulsa, the most male-oriented occupations are Architecture & Engineering (79.4%), Computers & Mathematics (75.5%), and Computers, Engineering & Science (74.2%), while the most female-oriented occupations are Education Instruction & Library (69.9%), Health Diagnosing & Treating (66.6%), and Health Technologists (65.9%).
| Occupation | Male | Female |
| Management | 11,109 (59.3%) | 7,613 (40.7%) |
| Business & Financial | 5,099 (46.9%) | 5,780 (53.1%) |
| Computers, Engineering & Science | 7,632 (74.2%) | 2,652 (25.8%) |
| Computers & Mathematics | 3,844 (75.5%) | 1,250 (24.5%) |
| Architecture & Engineering | 3,207 (79.4%) | 832 (20.6%) |
| Life, Physical & Social Science | 581 (50.5%) | 570 (49.5%) |
| Community & Social Service | 8,639 (39.1%) | 13,441 (60.9%) |
| Education, Arts & Media | 1,677 (41.0%) | 2,417 (59.0%) |
| Legal Services & Support | 1,706 (52.3%) | 1,555 (47.7%) |
| Education Instruction & Library | 3,176 (30.1%) | 7,379 (69.9%) |
| Arts, Media & Entertainment | 2,080 (49.9%) | 2,090 (50.1%) |
| Health Diagnosing & Treating | 4,242 (33.4%) | 8,457 (66.6%) |
| Health Technologists | 2,969 (34.1%) | 5,736 (65.9%) |
| Total (Category) | 36,721 (49.2%) | 37,943 (50.8%) |
| Total (Overall) | 104,930 (53.3%) | 91,855 (46.7%) |
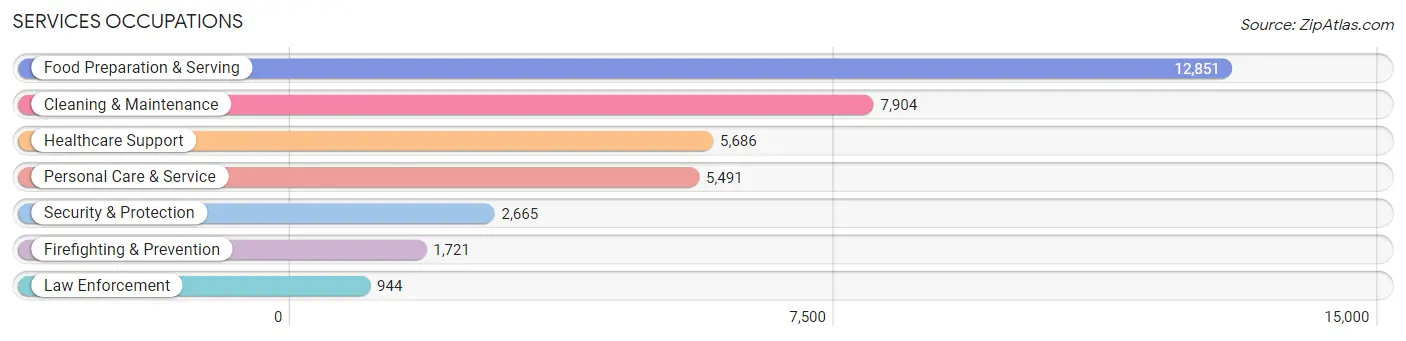
Services Occupations
The most common Services occupations in Tulsa are Food Preparation & Serving (12,851 | 6.5%), Cleaning & Maintenance (7,904 | 4.0%), Healthcare Support (5,686 | 2.9%), Personal Care & Service (5,491 | 2.8%), and Security & Protection (2,665 | 1.3%).
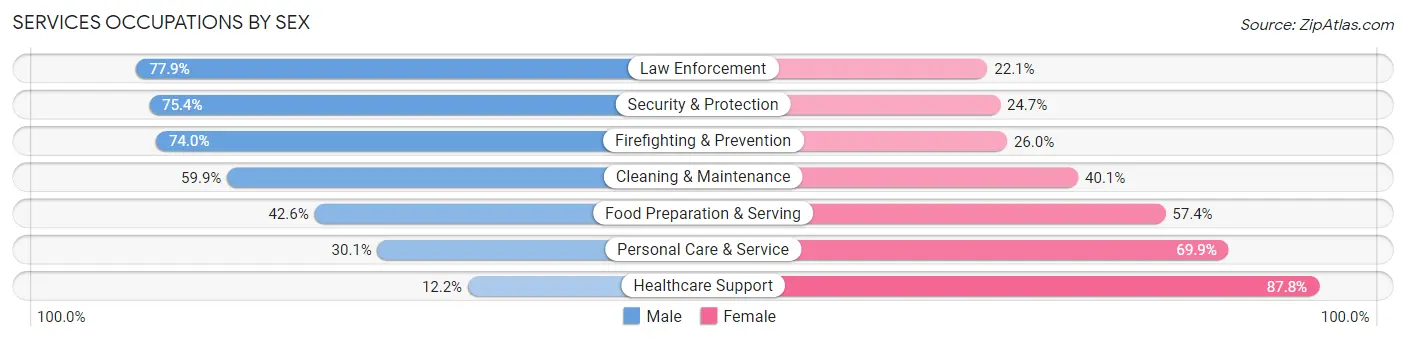
Services Occupations by Sex
Within the Services occupations in Tulsa, the most male-oriented occupations are Law Enforcement (77.9%), Security & Protection (75.3%), and Firefighting & Prevention (74.0%), while the most female-oriented occupations are Healthcare Support (87.8%), Personal Care & Service (69.9%), and Food Preparation & Serving (57.4%).
| Occupation | Male | Female |
| Healthcare Support | 694 (12.2%) | 4,992 (87.8%) |
| Security & Protection | 2,008 (75.3%) | 657 (24.6%) |
| Firefighting & Prevention | 1,273 (74.0%) | 448 (26.0%) |
| Law Enforcement | 735 (77.9%) | 209 (22.1%) |
| Food Preparation & Serving | 5,475 (42.6%) | 7,376 (57.4%) |
| Cleaning & Maintenance | 4,734 (59.9%) | 3,170 (40.1%) |
| Personal Care & Service | 1,652 (30.1%) | 3,839 (69.9%) |
| Total (Category) | 14,563 (42.1%) | 20,034 (57.9%) |
| Total (Overall) | 104,930 (53.3%) | 91,855 (46.7%) |
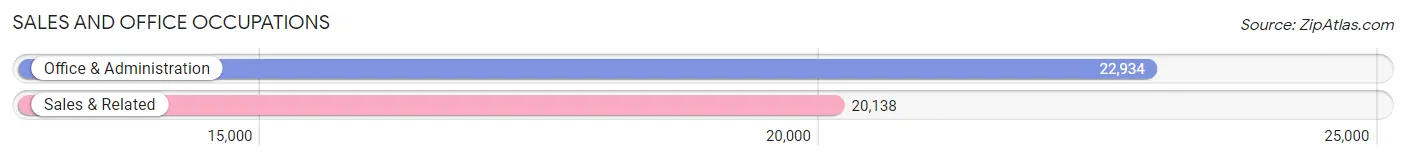
Sales and Office Occupations
The most common Sales and Office occupations in Tulsa are Office & Administration (22,934 | 11.7%), and Sales & Related (20,138 | 10.2%).
Sales and Office Occupations by Sex
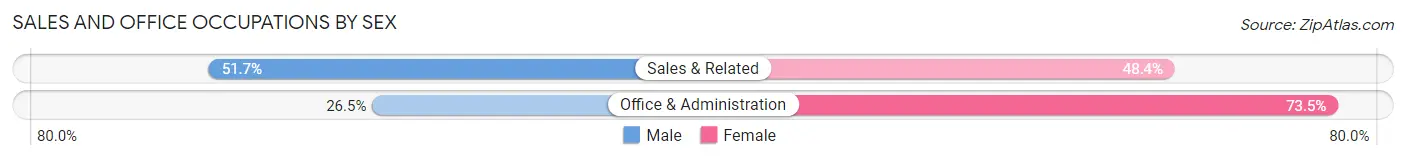
| Occupation | Male | Female |
| Sales & Related | 10,401 (51.6%) | 9,737 (48.3%) |
| Office & Administration | 6,081 (26.5%) | 16,853 (73.5%) |
| Total (Category) | 16,482 (38.3%) | 26,590 (61.7%) |
| Total (Overall) | 104,930 (53.3%) | 91,855 (46.7%) |
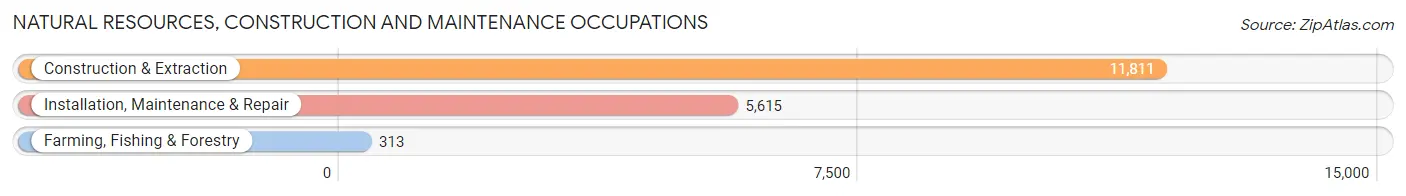
Natural Resources, Construction and Maintenance Occupations
The most common Natural Resources, Construction and Maintenance occupations in Tulsa are Construction & Extraction (11,811 | 6.0%), Installation, Maintenance & Repair (5,615 | 2.9%), and Farming, Fishing & Forestry (313 | 0.2%).
Natural Resources, Construction and Maintenance Occupations by Sex
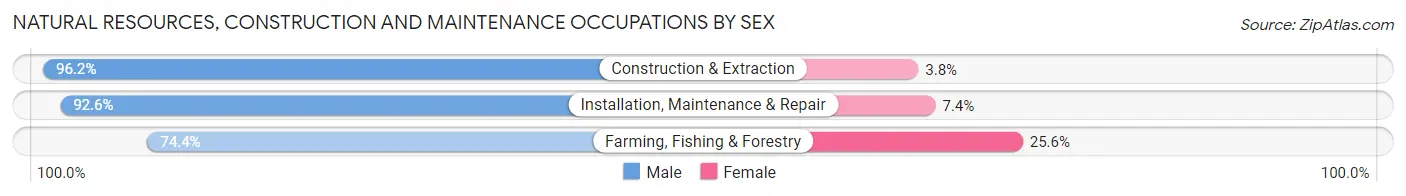
| Occupation | Male | Female |
| Farming, Fishing & Forestry | 233 (74.4%) | 80 (25.6%) |
| Construction & Extraction | 11,357 (96.2%) | 454 (3.8%) |
| Installation, Maintenance & Repair | 5,199 (92.6%) | 416 (7.4%) |
| Total (Category) | 16,789 (94.6%) | 950 (5.4%) |
| Total (Overall) | 104,930 (53.3%) | 91,855 (46.7%) |
Production, Transportation and Moving Occupations
The most common Production, Transportation and Moving occupations in Tulsa are Production (12,828 | 6.5%), Material Moving (8,185 | 4.2%), and Transportation (5,700 | 2.9%).
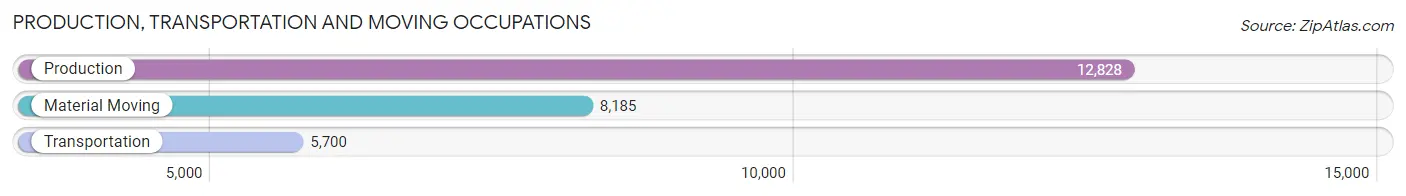
Production, Transportation and Moving Occupations by Sex
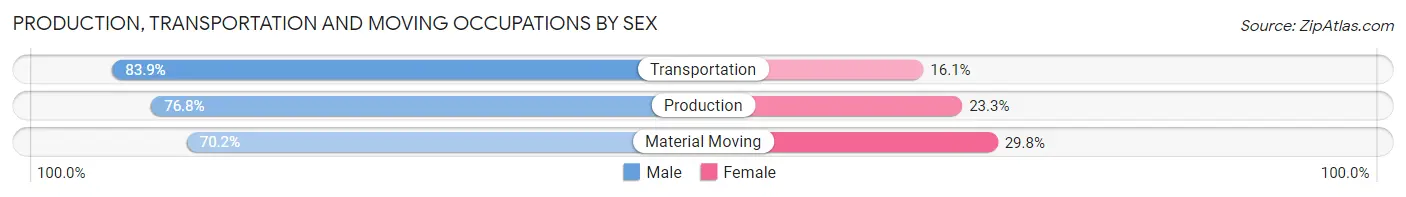
| Occupation | Male | Female |
| Production | 9,845 (76.7%) | 2,983 (23.3%) |
| Transportation | 4,781 (83.9%) | 919 (16.1%) |
| Material Moving | 5,749 (70.2%) | 2,436 (29.8%) |
| Total (Category) | 20,375 (76.3%) | 6,338 (23.7%) |
| Total (Overall) | 104,930 (53.3%) | 91,855 (46.7%) |
Employment Industries by Sex in Tulsa
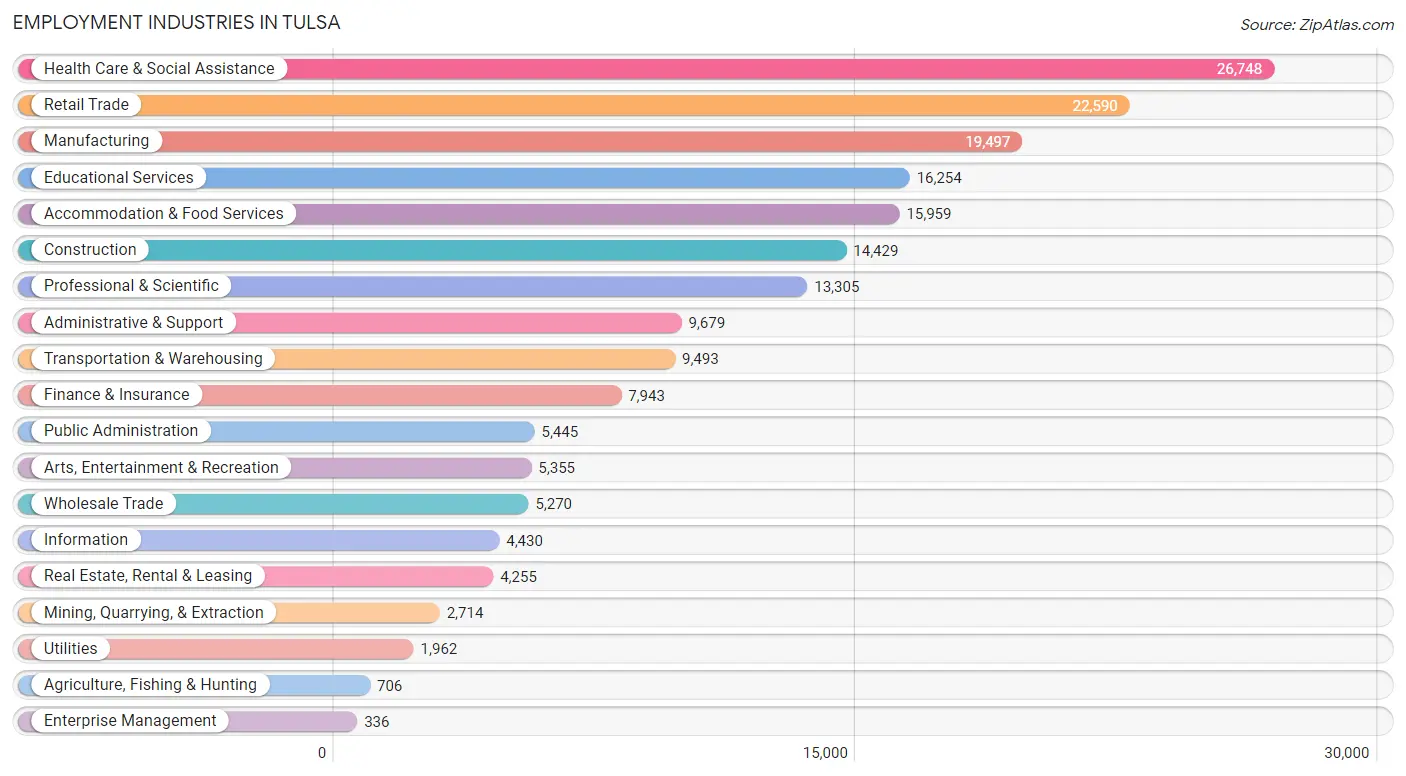
Employment Industries in Tulsa
The major employment industries in Tulsa include Health Care & Social Assistance (26,748 | 13.6%), Retail Trade (22,590 | 11.5%), Manufacturing (19,497 | 9.9%), Educational Services (16,254 | 8.3%), and Accommodation & Food Services (15,959 | 8.1%).
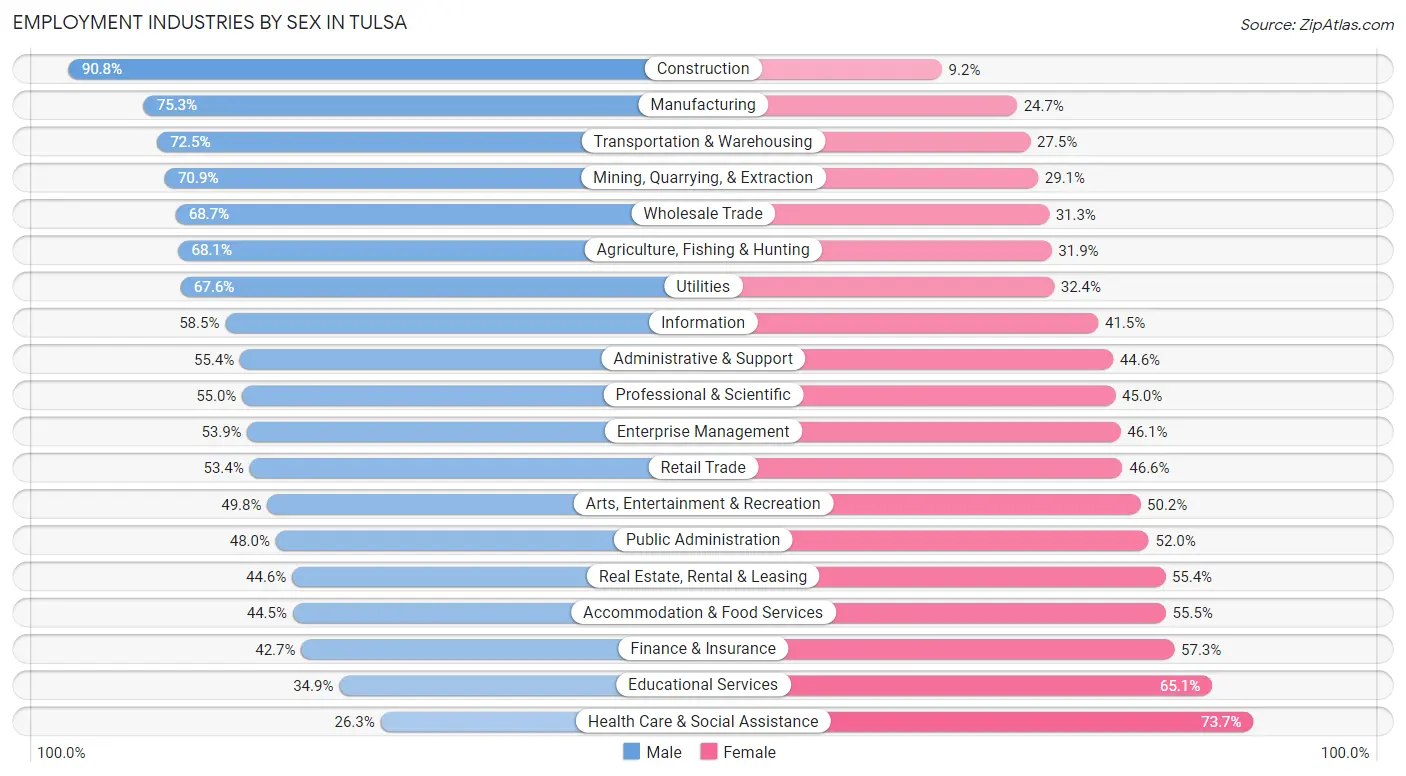
Employment Industries by Sex in Tulsa
The Tulsa industries that see more men than women are Construction (90.8%), Manufacturing (75.3%), and Transportation & Warehousing (72.5%), whereas the industries that tend to have a higher number of women are Health Care & Social Assistance (73.7%), Educational Services (65.1%), and Finance & Insurance (57.3%).
| Industry | Male | Female |
| Agriculture, Fishing & Hunting | 481 (68.1%) | 225 (31.9%) |
| Mining, Quarrying, & Extraction | 1,925 (70.9%) | 789 (29.1%) |
| Construction | 13,108 (90.8%) | 1,321 (9.2%) |
| Manufacturing | 14,683 (75.3%) | 4,814 (24.7%) |
| Wholesale Trade | 3,620 (68.7%) | 1,650 (31.3%) |
| Retail Trade | 12,073 (53.4%) | 10,517 (46.6%) |
| Transportation & Warehousing | 6,886 (72.5%) | 2,607 (27.5%) |
| Utilities | 1,327 (67.6%) | 635 (32.4%) |
| Information | 2,590 (58.5%) | 1,840 (41.5%) |
| Finance & Insurance | 3,394 (42.7%) | 4,549 (57.3%) |
| Real Estate, Rental & Leasing | 1,899 (44.6%) | 2,356 (55.4%) |
| Professional & Scientific | 7,312 (55.0%) | 5,993 (45.0%) |
| Enterprise Management | 181 (53.9%) | 155 (46.1%) |
| Administrative & Support | 5,362 (55.4%) | 4,317 (44.6%) |
| Educational Services | 5,670 (34.9%) | 10,584 (65.1%) |
| Health Care & Social Assistance | 7,042 (26.3%) | 19,706 (73.7%) |
| Arts, Entertainment & Recreation | 2,665 (49.8%) | 2,690 (50.2%) |
| Accommodation & Food Services | 7,098 (44.5%) | 8,861 (55.5%) |
| Public Administration | 2,614 (48.0%) | 2,831 (52.0%) |
| Total | 104,930 (53.3%) | 91,855 (46.7%) |
Education in Tulsa
School Enrollment in Tulsa
The most common levels of schooling among the 101,269 students in Tulsa are elementary school (22,519 | 22.2%), middle school (22,058 | 21.8%), and high school (20,892 | 20.6%).
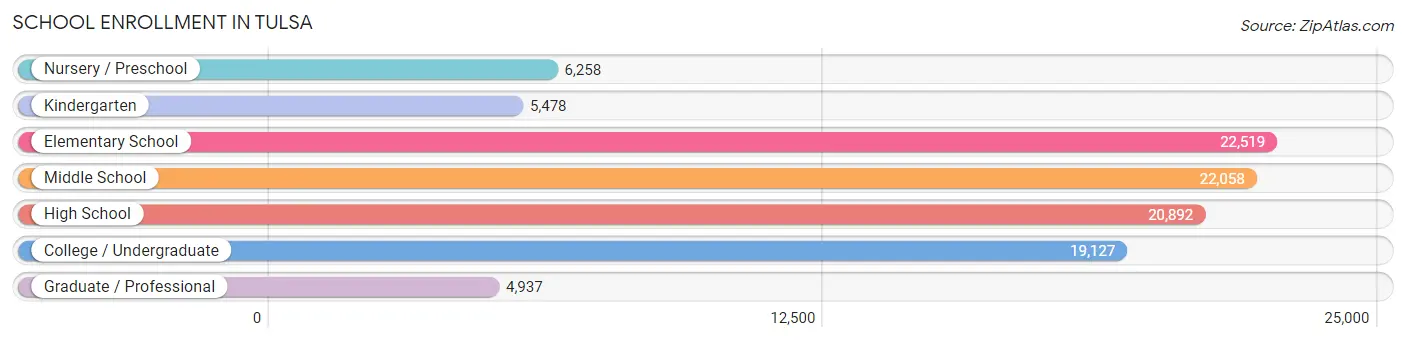
| School Level | # Students | % Students |
| Nursery / Preschool | 6,258 | 6.2% |
| Kindergarten | 5,478 | 5.4% |
| Elementary School | 22,519 | 22.2% |
| Middle School | 22,058 | 21.8% |
| High School | 20,892 | 20.6% |
| College / Undergraduate | 19,127 | 18.9% |
| Graduate / Professional | 4,937 | 4.9% |
| Total | 101,269 | 100.0% |
School Enrollment by Age by Funding Source in Tulsa
Out of a total of 101,269 students who are enrolled in schools in Tulsa, 23,697 (23.4%) attend a private institution, while the remaining 77,572 (76.6%) are enrolled in public schools. The age group of 20 to 24 year olds has the highest likelihood of being enrolled in private schools, with 4,101 (41.4% in the age bracket) enrolled. Conversely, the age group of 10 to 14 year olds has the lowest likelihood of being enrolled in a private school, with 22,668 (82.7% in the age bracket) attending a public institution.
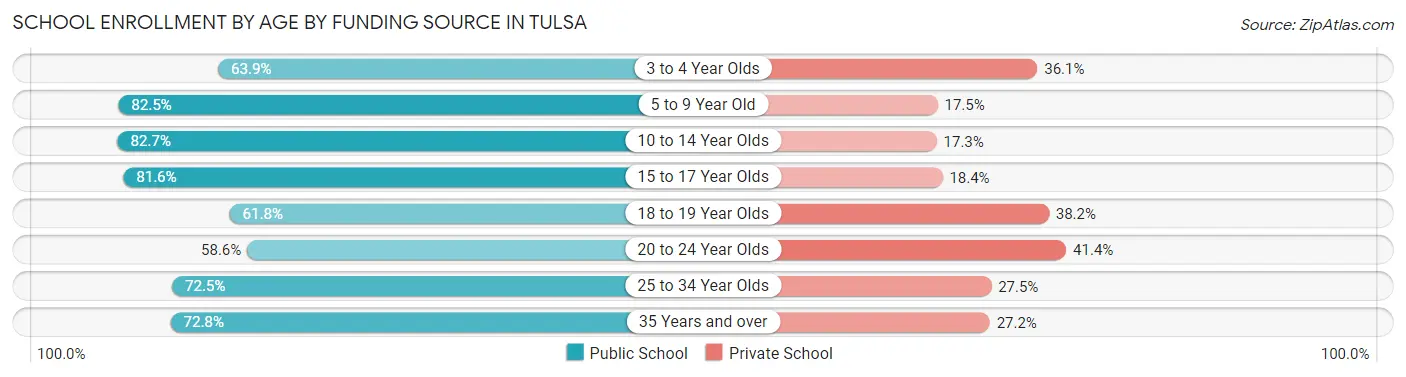
| Age Bracket | Public School | Private School |
| 3 to 4 Year Olds | 3,186 (63.9%) | 1,797 (36.1%) |
| 5 to 9 Year Old | 21,236 (82.5%) | 4,499 (17.5%) |
| 10 to 14 Year Olds | 22,668 (82.7%) | 4,744 (17.3%) |
| 15 to 17 Year Olds | 12,115 (81.6%) | 2,732 (18.4%) |
| 18 to 19 Year Olds | 4,694 (61.8%) | 2,902 (38.2%) |
| 20 to 24 Year Olds | 5,796 (58.6%) | 4,101 (41.4%) |
| 25 to 34 Year Olds | 4,451 (72.5%) | 1,687 (27.5%) |
| 35 Years and over | 3,393 (72.8%) | 1,268 (27.2%) |
| Total | 77,572 (76.6%) | 23,697 (23.4%) |
Educational Attainment by Field of Study in Tulsa
Business (22,308 | 23.1%), education (12,046 | 12.4%), science & technology (8,820 | 9.1%), engineering (6,505 | 6.7%), and bio, nature & agricultural (5,944 | 6.1%) are the most common fields of study among 96,737 individuals in Tulsa who have obtained a bachelor's degree or higher.
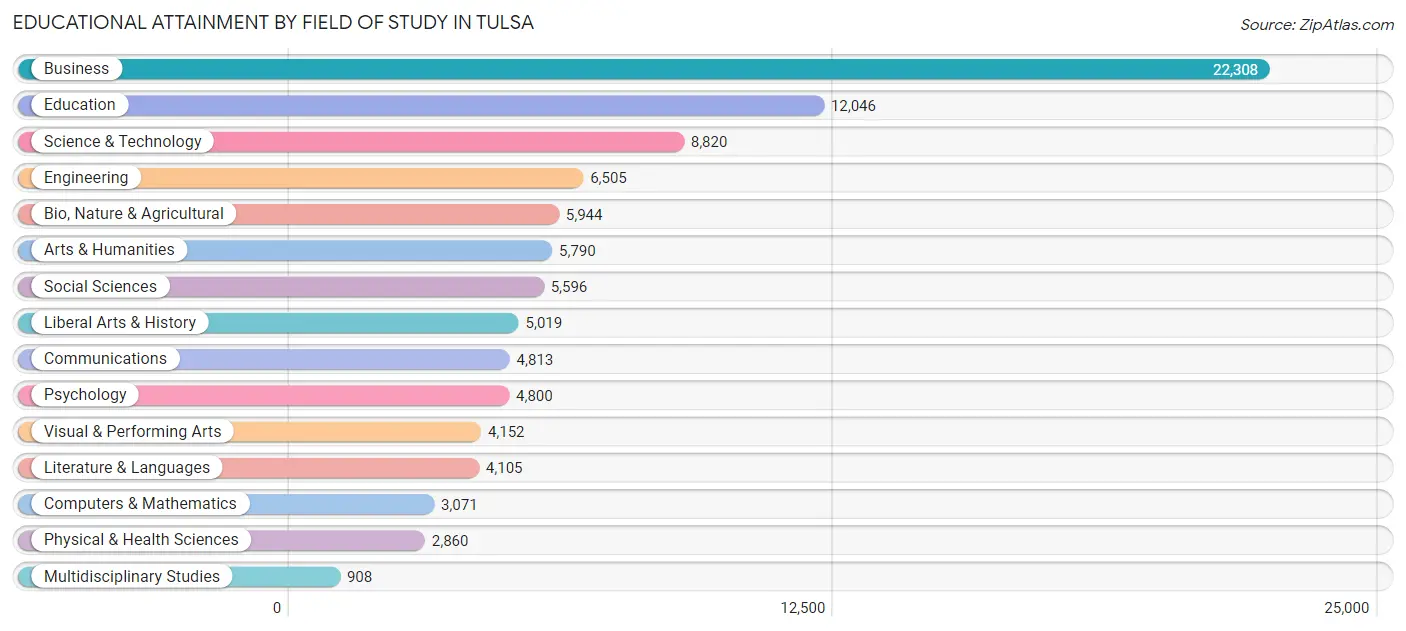
| Field of Study | # Graduates | % Graduates |
| Computers & Mathematics | 3,071 | 3.2% |
| Bio, Nature & Agricultural | 5,944 | 6.1% |
| Physical & Health Sciences | 2,860 | 3.0% |
| Psychology | 4,800 | 5.0% |
| Social Sciences | 5,596 | 5.8% |
| Engineering | 6,505 | 6.7% |
| Multidisciplinary Studies | 908 | 0.9% |
| Science & Technology | 8,820 | 9.1% |
| Business | 22,308 | 23.1% |
| Education | 12,046 | 12.4% |
| Literature & Languages | 4,105 | 4.2% |
| Liberal Arts & History | 5,019 | 5.2% |
| Visual & Performing Arts | 4,152 | 4.3% |
| Communications | 4,813 | 5.0% |
| Arts & Humanities | 5,790 | 6.0% |
| Total | 96,737 | 100.0% |
Transportation & Commute in Tulsa
Vehicle Availability by Sex in Tulsa
The most prevalent vehicle ownership categories in Tulsa are males with 2 vehicles (45,439, accounting for 44.2%) and females with 2 vehicles (36,606, making up 51.3%).
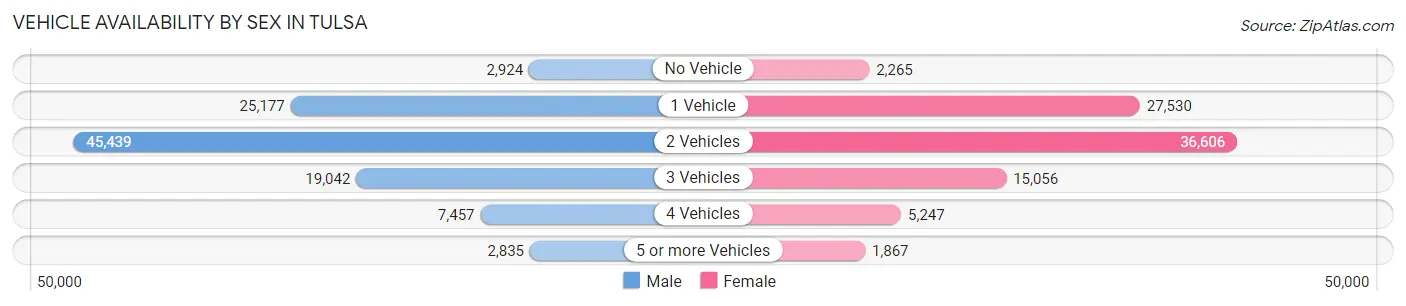
| Vehicles Available | Male | Female |
| No Vehicle | 2,924 (2.8%) | 2,265 (2.6%) |
| 1 Vehicle | 25,177 (24.5%) | 27,530 (31.1%) |
| 2 Vehicles | 45,439 (44.2%) | 36,606 (41.3%) |
| 3 Vehicles | 19,042 (18.5%) | 15,056 (17.0%) |
| 4 Vehicles | 7,457 (7.2%) | 5,247 (5.9%) |
| 5 or more Vehicles | 2,835 (2.8%) | 1,867 (2.1%) |
| Total | 102,874 (100.0%) | 88,571 (100.0%) |
Commute Time in Tulsa
The most frequently occuring commute durations in Tulsa are 15 to 19 minutes (44,997 commuters, 25.4%), 10 to 14 minutes (35,804 commuters, 20.2%), and 20 to 24 minutes (35,507 commuters, 20.1%).
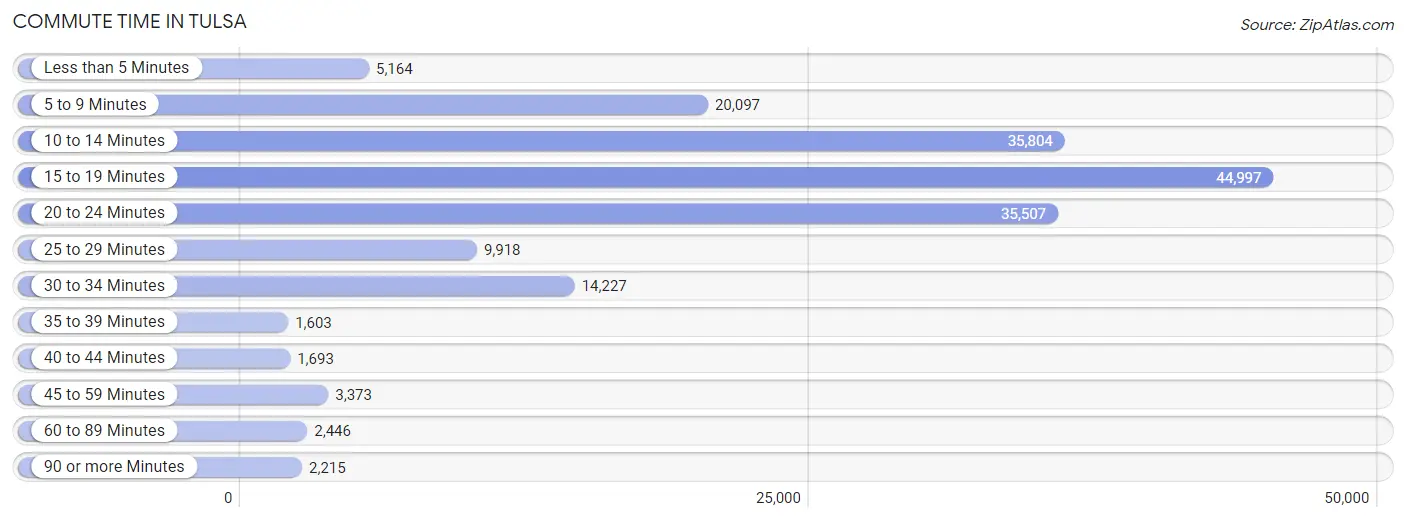
| Commute Time | # Commuters | % Commuters |
| Less than 5 Minutes | 5,164 | 2.9% |
| 5 to 9 Minutes | 20,097 | 11.4% |
| 10 to 14 Minutes | 35,804 | 20.2% |
| 15 to 19 Minutes | 44,997 | 25.4% |
| 20 to 24 Minutes | 35,507 | 20.1% |
| 25 to 29 Minutes | 9,918 | 5.6% |
| 30 to 34 Minutes | 14,227 | 8.0% |
| 35 to 39 Minutes | 1,603 | 0.9% |
| 40 to 44 Minutes | 1,693 | 1.0% |
| 45 to 59 Minutes | 3,373 | 1.9% |
| 60 to 89 Minutes | 2,446 | 1.4% |
| 90 or more Minutes | 2,215 | 1.3% |
Commute Time by Sex in Tulsa
The most common commute times in Tulsa are 15 to 19 minutes (23,989 commuters, 25.1%) for males and 15 to 19 minutes (21,008 commuters, 25.8%) for females.
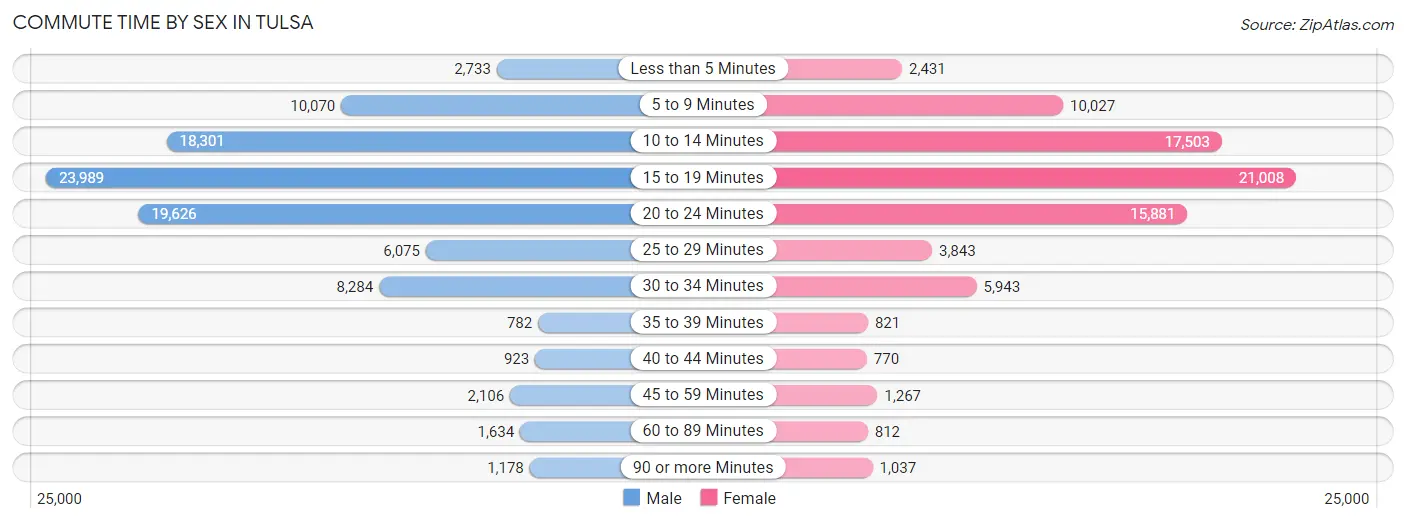
| Commute Time | Male | Female |
| Less than 5 Minutes | 2,733 (2.9%) | 2,431 (3.0%) |
| 5 to 9 Minutes | 10,070 (10.5%) | 10,027 (12.3%) |
| 10 to 14 Minutes | 18,301 (19.1%) | 17,503 (21.5%) |
| 15 to 19 Minutes | 23,989 (25.1%) | 21,008 (25.8%) |
| 20 to 24 Minutes | 19,626 (20.5%) | 15,881 (19.5%) |
| 25 to 29 Minutes | 6,075 (6.4%) | 3,843 (4.7%) |
| 30 to 34 Minutes | 8,284 (8.7%) | 5,943 (7.3%) |
| 35 to 39 Minutes | 782 (0.8%) | 821 (1.0%) |
| 40 to 44 Minutes | 923 (1.0%) | 770 (0.9%) |
| 45 to 59 Minutes | 2,106 (2.2%) | 1,267 (1.6%) |
| 60 to 89 Minutes | 1,634 (1.7%) | 812 (1.0%) |
| 90 or more Minutes | 1,178 (1.2%) | 1,037 (1.3%) |
Time of Departure to Work by Sex in Tulsa
The most frequent times of departure to work in Tulsa are 7:00 AM to 7:29 AM (12,857, 13.4%) for males and 7:30 AM to 7:59 AM (13,511, 16.6%) for females.
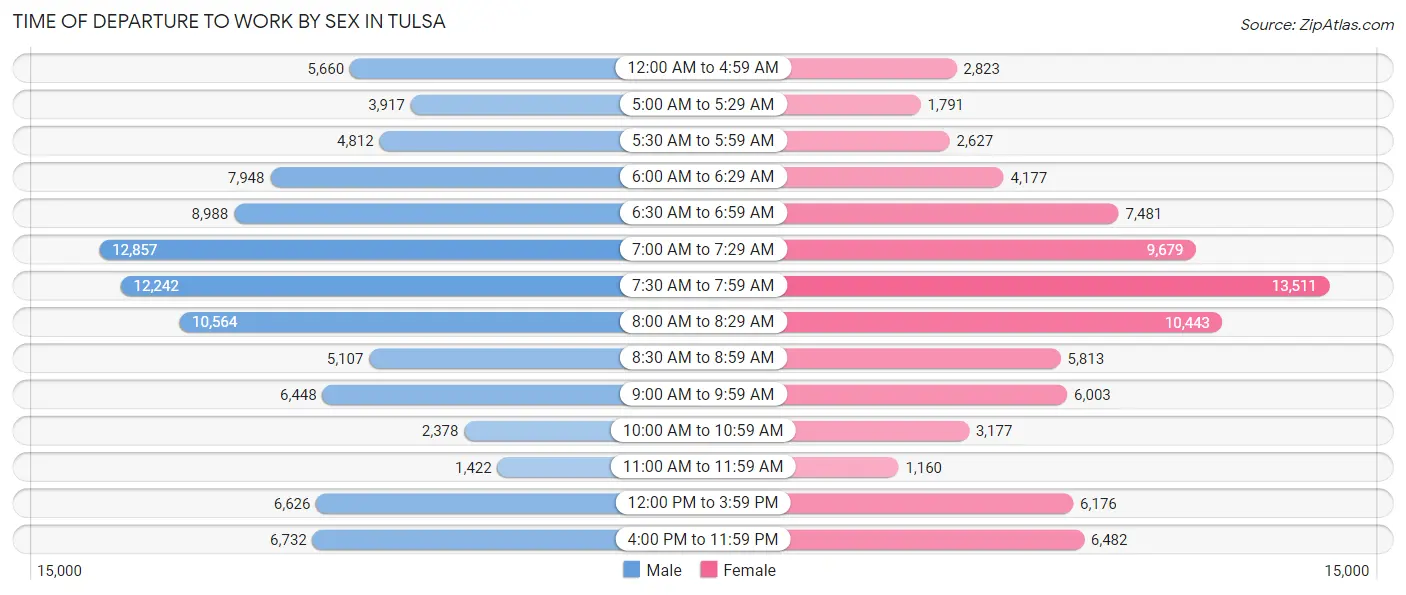
| Time of Departure | Male | Female |
| 12:00 AM to 4:59 AM | 5,660 (5.9%) | 2,823 (3.5%) |
| 5:00 AM to 5:29 AM | 3,917 (4.1%) | 1,791 (2.2%) |
| 5:30 AM to 5:59 AM | 4,812 (5.0%) | 2,627 (3.2%) |
| 6:00 AM to 6:29 AM | 7,948 (8.3%) | 4,177 (5.1%) |
| 6:30 AM to 6:59 AM | 8,988 (9.4%) | 7,481 (9.2%) |
| 7:00 AM to 7:29 AM | 12,857 (13.4%) | 9,679 (11.9%) |
| 7:30 AM to 7:59 AM | 12,242 (12.8%) | 13,511 (16.6%) |
| 8:00 AM to 8:29 AM | 10,564 (11.0%) | 10,443 (12.8%) |
| 8:30 AM to 8:59 AM | 5,107 (5.3%) | 5,813 (7.1%) |
| 9:00 AM to 9:59 AM | 6,448 (6.7%) | 6,003 (7.4%) |
| 10:00 AM to 10:59 AM | 2,378 (2.5%) | 3,177 (3.9%) |
| 11:00 AM to 11:59 AM | 1,422 (1.5%) | 1,160 (1.4%) |
| 12:00 PM to 3:59 PM | 6,626 (6.9%) | 6,176 (7.6%) |
| 4:00 PM to 11:59 PM | 6,732 (7.0%) | 6,482 (8.0%) |
| Total | 95,701 (100.0%) | 81,343 (100.0%) |
Housing Occupancy in Tulsa
Occupancy by Ownership in Tulsa
Of the total 169,783 dwellings in Tulsa, owner-occupied units account for 88,734 (52.3%), while renter-occupied units make up 81,049 (47.7%).
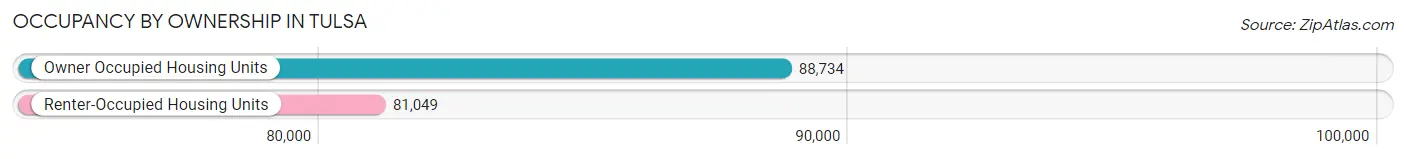
| Occupancy | # Housing Units | % Housing Units |
| Owner Occupied Housing Units | 88,734 | 52.3% |
| Renter-Occupied Housing Units | 81,049 | 47.7% |
| Total Occupied Housing Units | 169,783 | 100.0% |
Occupancy by Household Size in Tulsa
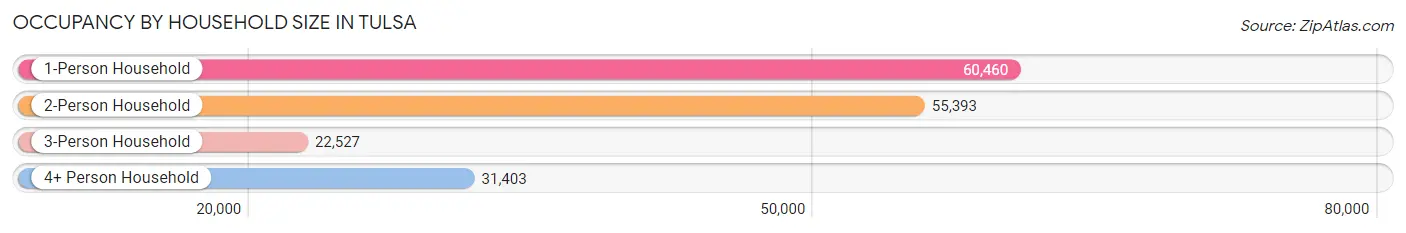
| Household Size | # Housing Units | % Housing Units |
| 1-Person Household | 60,460 | 35.6% |
| 2-Person Household | 55,393 | 32.6% |
| 3-Person Household | 22,527 | 13.3% |
| 4+ Person Household | 31,403 | 18.5% |
| Total Housing Units | 169,783 | 100.0% |
Occupancy by Ownership by Household Size in Tulsa
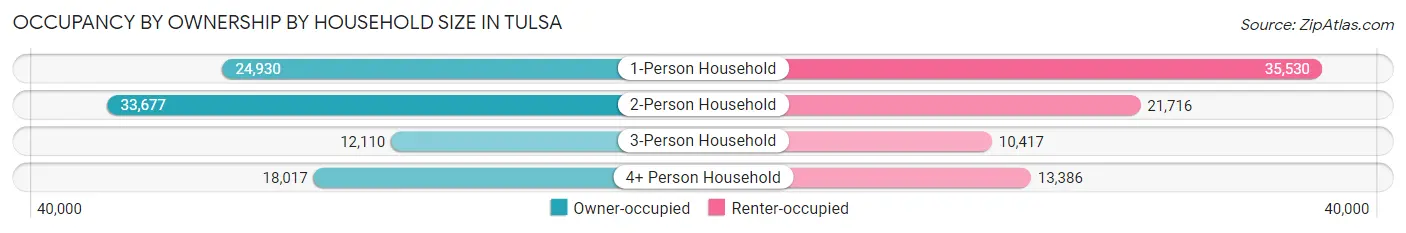
| Household Size | Owner-occupied | Renter-occupied |
| 1-Person Household | 24,930 (41.2%) | 35,530 (58.8%) |
| 2-Person Household | 33,677 (60.8%) | 21,716 (39.2%) |
| 3-Person Household | 12,110 (53.8%) | 10,417 (46.2%) |
| 4+ Person Household | 18,017 (57.4%) | 13,386 (42.6%) |
| Total Housing Units | 88,734 (52.3%) | 81,049 (47.7%) |
Occupancy by Educational Attainment in Tulsa
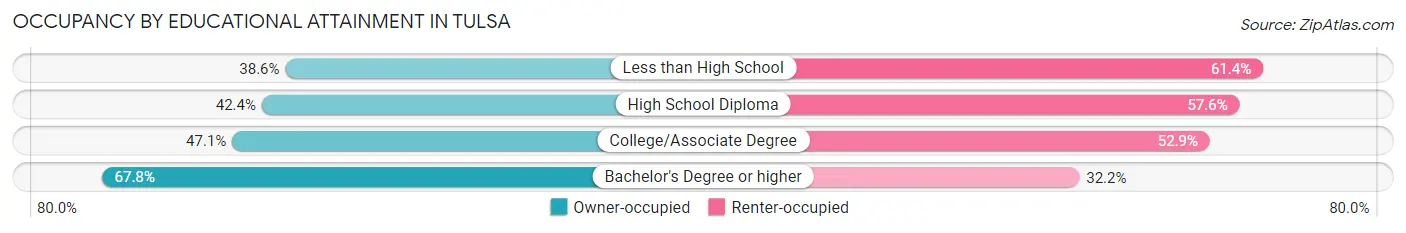
| Household Size | Owner-occupied | Renter-occupied |
| Less than High School | 6,667 (38.6%) | 10,586 (61.4%) |
| High School Diploma | 16,495 (42.4%) | 22,430 (57.6%) |
| College/Associate Degree | 25,994 (47.1%) | 29,215 (52.9%) |
| Bachelor's Degree or higher | 39,578 (67.8%) | 18,818 (32.2%) |
Occupancy by Age of Householder in Tulsa
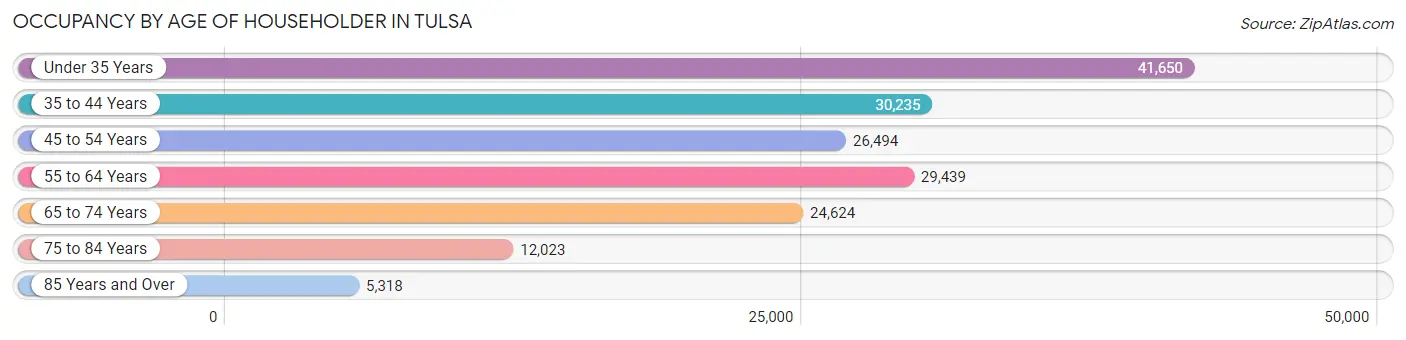
| Age Bracket | # Households | % Households |
| Under 35 Years | 41,650 | 24.5% |
| 35 to 44 Years | 30,235 | 17.8% |
| 45 to 54 Years | 26,494 | 15.6% |
| 55 to 64 Years | 29,439 | 17.3% |
| 65 to 74 Years | 24,624 | 14.5% |
| 75 to 84 Years | 12,023 | 7.1% |
| 85 Years and Over | 5,318 | 3.1% |
| Total | 169,783 | 100.0% |
Housing Finances in Tulsa
Median Income by Occupancy in Tulsa
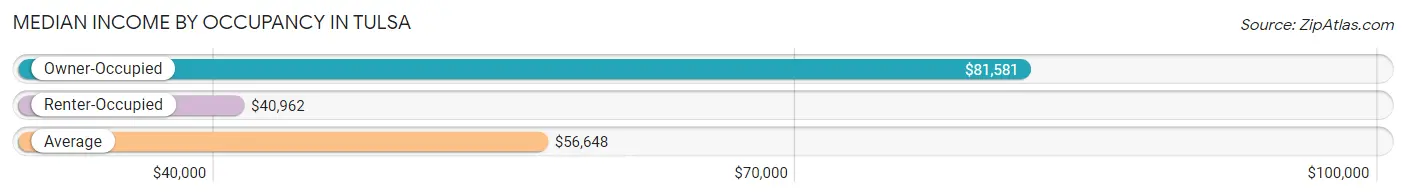
| Occupancy Type | # Households | Median Income |
| Owner-Occupied | 88,734 (52.3%) | $81,581 |
| Renter-Occupied | 81,049 (47.7%) | $40,962 |
| Average | 169,783 (100.0%) | $56,648 |
Occupancy by Householder Income Bracket in Tulsa
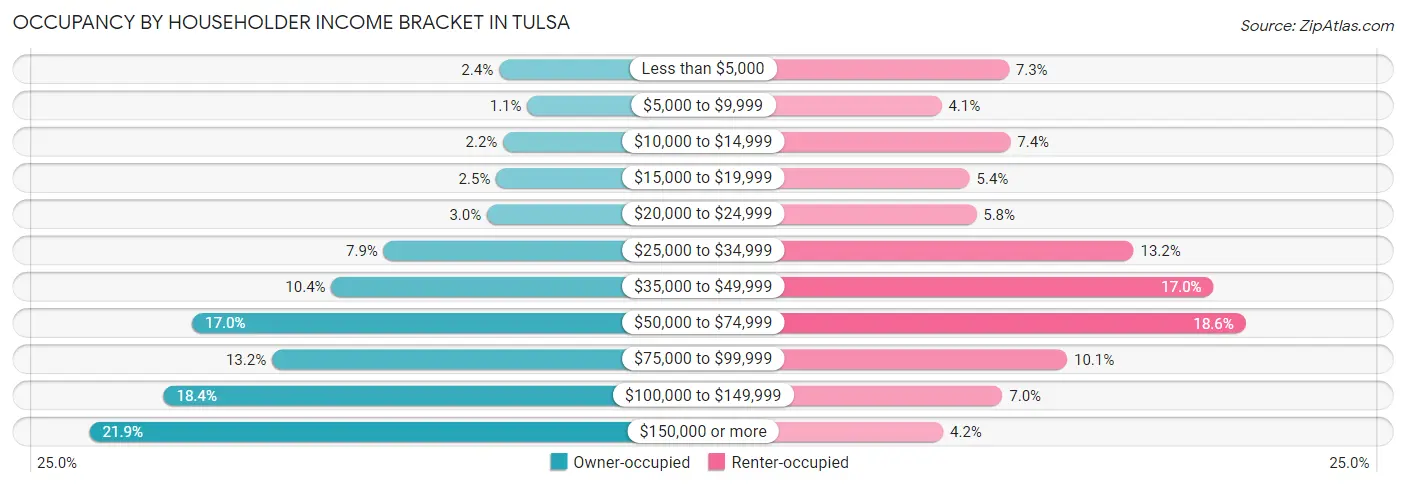
| Income Bracket | Owner-occupied | Renter-occupied |
| Less than $5,000 | 2,139 (2.4%) | 5,913 (7.3%) |
| $5,000 to $9,999 | 940 (1.1%) | 3,312 (4.1%) |
| $10,000 to $14,999 | 1,959 (2.2%) | 5,977 (7.4%) |
| $15,000 to $19,999 | 2,251 (2.5%) | 4,402 (5.4%) |
| $20,000 to $24,999 | 2,640 (3.0%) | 4,658 (5.8%) |
| $25,000 to $34,999 | 7,011 (7.9%) | 10,727 (13.2%) |
| $35,000 to $49,999 | 9,223 (10.4%) | 13,813 (17.0%) |
| $50,000 to $74,999 | 15,105 (17.0%) | 15,048 (18.6%) |
| $75,000 to $99,999 | 11,728 (13.2%) | 8,160 (10.1%) |
| $100,000 to $149,999 | 16,308 (18.4%) | 5,662 (7.0%) |
| $150,000 or more | 19,430 (21.9%) | 3,377 (4.2%) |
| Total | 88,734 (100.0%) | 81,049 (100.0%) |
Monthly Housing Cost Tiers in Tulsa
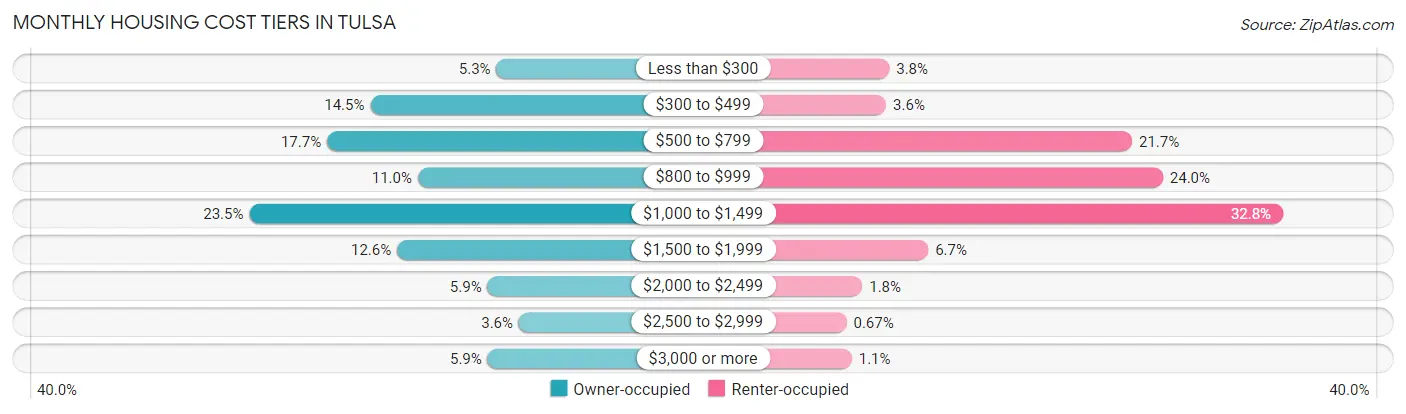
| Monthly Cost | Owner-occupied | Renter-occupied |
| Less than $300 | 4,656 (5.2%) | 3,093 (3.8%) |
| $300 to $499 | 12,904 (14.5%) | 2,912 (3.6%) |
| $500 to $799 | 15,736 (17.7%) | 17,590 (21.7%) |
| $800 to $999 | 9,798 (11.0%) | 19,428 (24.0%) |
| $1,000 to $1,499 | 20,809 (23.4%) | 26,589 (32.8%) |
| $1,500 to $1,999 | 11,153 (12.6%) | 5,425 (6.7%) |
| $2,000 to $2,499 | 5,244 (5.9%) | 1,482 (1.8%) |
| $2,500 to $2,999 | 3,196 (3.6%) | 543 (0.7%) |
| $3,000 or more | 5,238 (5.9%) | 859 (1.1%) |
| Total | 88,734 (100.0%) | 81,049 (100.0%) |
Physical Housing Characteristics in Tulsa
Housing Structures in Tulsa
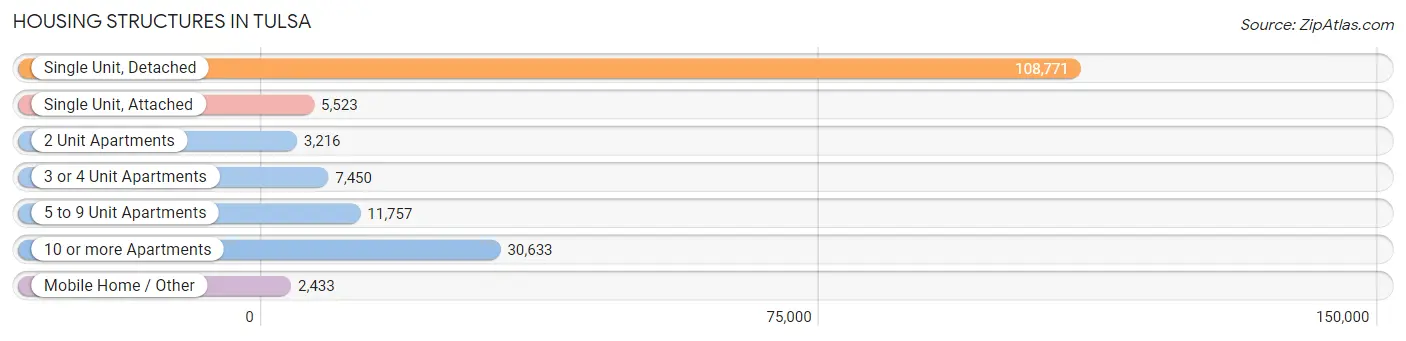
| Structure Type | # Housing Units | % Housing Units |
| Single Unit, Detached | 108,771 | 64.1% |
| Single Unit, Attached | 5,523 | 3.3% |
| 2 Unit Apartments | 3,216 | 1.9% |
| 3 or 4 Unit Apartments | 7,450 | 4.4% |
| 5 to 9 Unit Apartments | 11,757 | 6.9% |
| 10 or more Apartments | 30,633 | 18.0% |
| Mobile Home / Other | 2,433 | 1.4% |
| Total | 169,783 | 100.0% |
Housing Structures by Occupancy in Tulsa
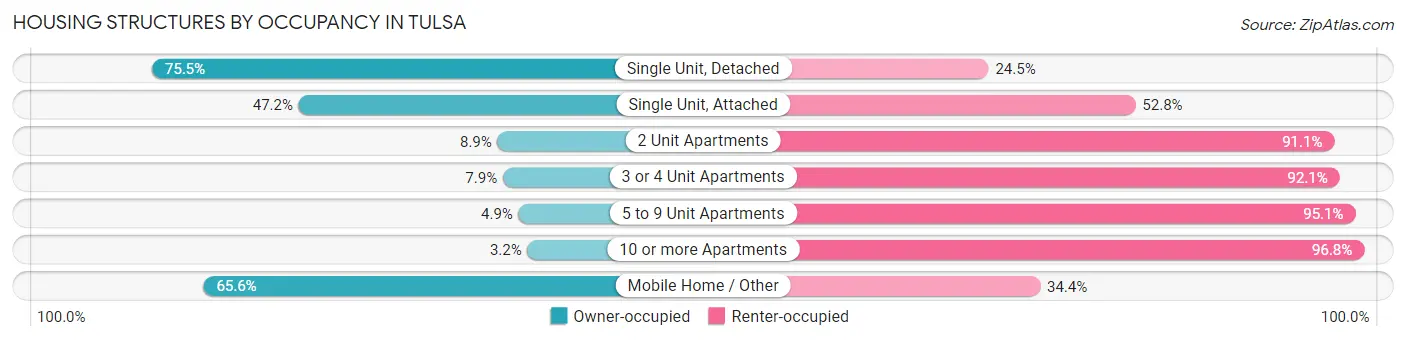
| Structure Type | Owner-occupied | Renter-occupied |
| Single Unit, Detached | 82,114 (75.5%) | 26,657 (24.5%) |
| Single Unit, Attached | 2,607 (47.2%) | 2,916 (52.8%) |
| 2 Unit Apartments | 287 (8.9%) | 2,929 (91.1%) |
| 3 or 4 Unit Apartments | 588 (7.9%) | 6,862 (92.1%) |
| 5 to 9 Unit Apartments | 573 (4.9%) | 11,184 (95.1%) |
| 10 or more Apartments | 970 (3.2%) | 29,663 (96.8%) |
| Mobile Home / Other | 1,595 (65.6%) | 838 (34.4%) |
| Total | 88,734 (52.3%) | 81,049 (47.7%) |
Housing Structures by Number of Rooms in Tulsa
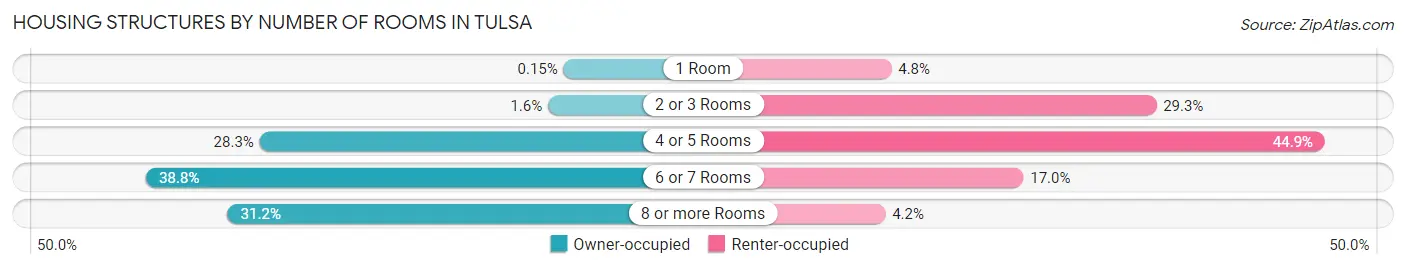
| Number of Rooms | Owner-occupied | Renter-occupied |
| 1 Room | 136 (0.2%) | 3,850 (4.8%) |
| 2 or 3 Rooms | 1,412 (1.6%) | 23,709 (29.2%) |
| 4 or 5 Rooms | 25,077 (28.3%) | 36,349 (44.9%) |
| 6 or 7 Rooms | 34,406 (38.8%) | 13,747 (17.0%) |
| 8 or more Rooms | 27,703 (31.2%) | 3,394 (4.2%) |
| Total | 88,734 (100.0%) | 81,049 (100.0%) |
Housing Structure by Heating Type in Tulsa
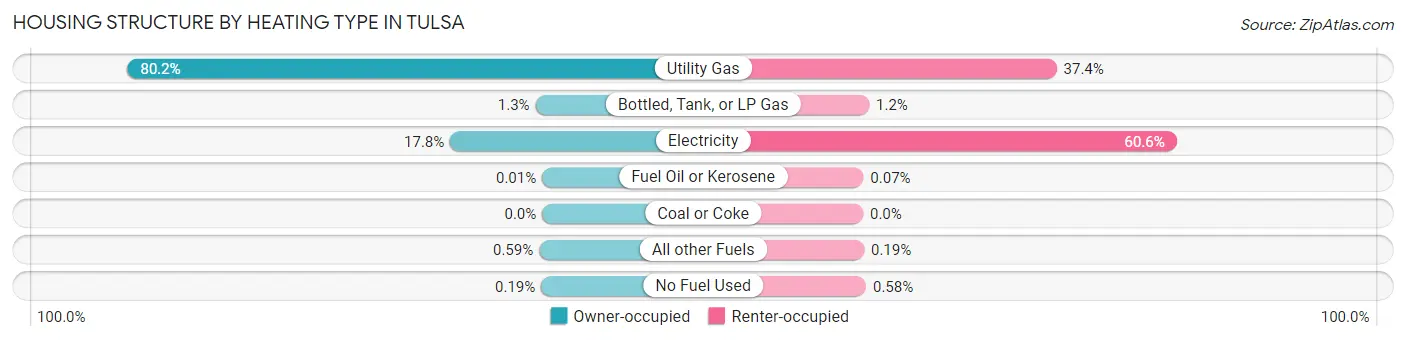
| Heating Type | Owner-occupied | Renter-occupied |
| Utility Gas | 71,120 (80.1%) | 30,312 (37.4%) |
| Bottled, Tank, or LP Gas | 1,141 (1.3%) | 947 (1.2%) |
| Electricity | 15,777 (17.8%) | 49,108 (60.6%) |
| Fuel Oil or Kerosene | 6 (0.0%) | 58 (0.1%) |
| Coal or Coke | 0 (0.0%) | 0 (0.0%) |
| All other Fuels | 521 (0.6%) | 156 (0.2%) |
| No Fuel Used | 169 (0.2%) | 468 (0.6%) |
| Total | 88,734 (100.0%) | 81,049 (100.0%) |
Household Vehicle Usage in Tulsa
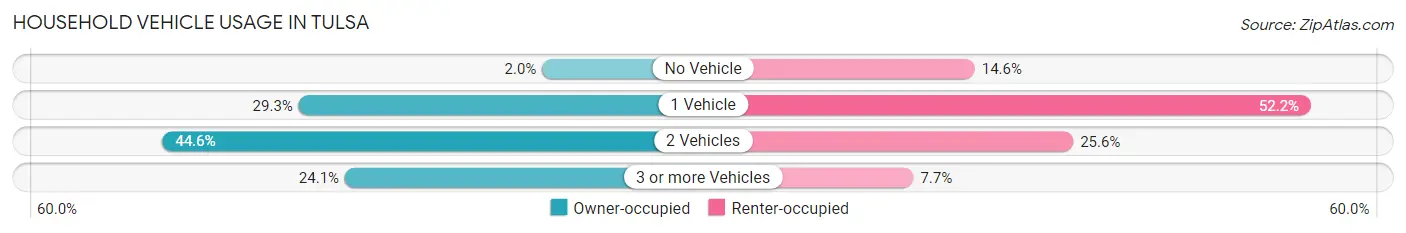
| Vehicles per Household | Owner-occupied | Renter-occupied |
| No Vehicle | 1,790 (2.0%) | 11,794 (14.5%) |
| 1 Vehicle | 25,997 (29.3%) | 42,310 (52.2%) |
| 2 Vehicles | 39,548 (44.6%) | 20,724 (25.6%) |
| 3 or more Vehicles | 21,399 (24.1%) | 6,221 (7.7%) |
| Total | 88,734 (100.0%) | 81,049 (100.0%) |
Real Estate & Mortgages in Tulsa
Real Estate and Mortgage Overview in Tulsa
| Characteristic | Without Mortgage | With Mortgage |
| Housing Units | 38,791 | 49,943 |
| Median Property Value | $156,300 | $188,000 |
| Median Household Income | $62,320 | $13,174 |
| Monthly Housing Costs | $541 | $4,967 |
| Real Estate Taxes | $1,678 | $1,470 |
Property Value by Mortgage Status in Tulsa
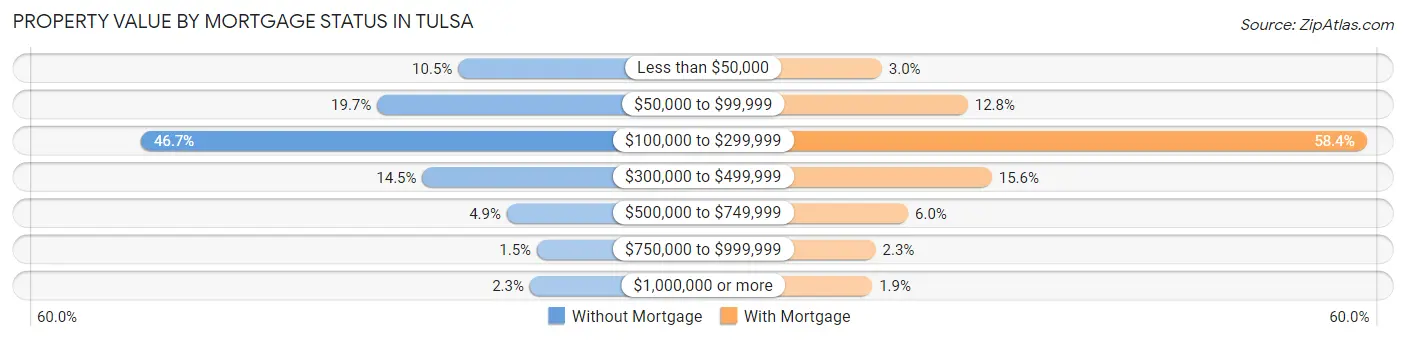
| Property Value | Without Mortgage | With Mortgage |
| Less than $50,000 | 4,052 (10.4%) | 1,501 (3.0%) |
| $50,000 to $99,999 | 7,646 (19.7%) | 6,406 (12.8%) |
| $100,000 to $299,999 | 18,117 (46.7%) | 29,161 (58.4%) |
| $300,000 to $499,999 | 5,639 (14.5%) | 7,776 (15.6%) |
| $500,000 to $749,999 | 1,898 (4.9%) | 3,002 (6.0%) |
| $750,000 to $999,999 | 562 (1.5%) | 1,142 (2.3%) |
| $1,000,000 or more | 877 (2.3%) | 955 (1.9%) |
| Total | 38,791 (100.0%) | 49,943 (100.0%) |
Household Income by Mortgage Status in Tulsa
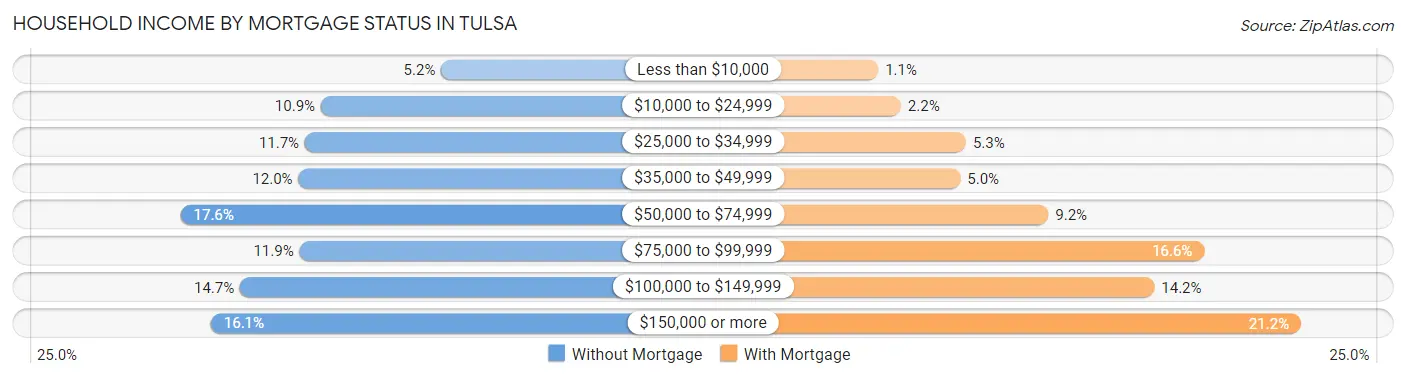
| Household Income | Without Mortgage | With Mortgage |
| Less than $10,000 | 2,002 (5.2%) | 538 (1.1%) |
| $10,000 to $24,999 | 4,225 (10.9%) | 1,077 (2.2%) |
| $25,000 to $34,999 | 4,518 (11.7%) | 2,625 (5.3%) |
| $35,000 to $49,999 | 4,639 (12.0%) | 2,493 (5.0%) |
| $50,000 to $74,999 | 6,815 (17.6%) | 4,584 (9.2%) |
| $75,000 to $99,999 | 4,620 (11.9%) | 8,290 (16.6%) |
| $100,000 to $149,999 | 5,716 (14.7%) | 7,108 (14.2%) |
| $150,000 or more | 6,256 (16.1%) | 10,592 (21.2%) |
| Total | 38,791 (100.0%) | 49,943 (100.0%) |
Property Value to Household Income Ratio in Tulsa
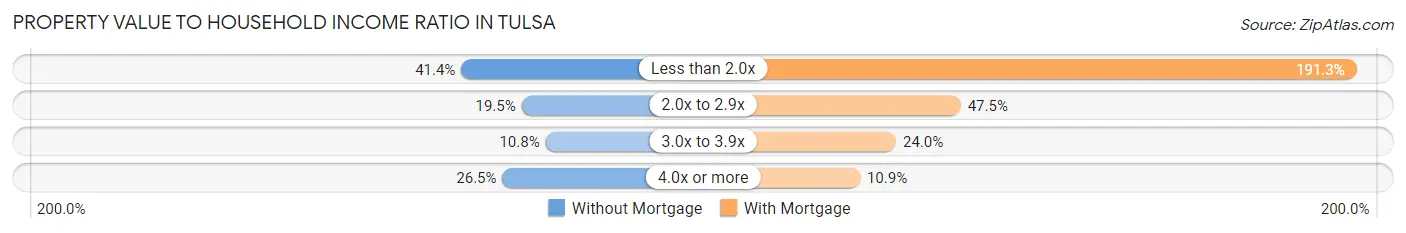
| Value-to-Income Ratio | Without Mortgage | With Mortgage |
| Less than 2.0x | 16,062 (41.4%) | 95,540 (191.3%) |
| 2.0x to 2.9x | 7,566 (19.5%) | 23,729 (47.5%) |
| 3.0x to 3.9x | 4,194 (10.8%) | 11,997 (24.0%) |
| 4.0x or more | 10,267 (26.5%) | 5,455 (10.9%) |
| Total | 38,791 (100.0%) | 49,943 (100.0%) |
Real Estate Taxes by Mortgage Status in Tulsa
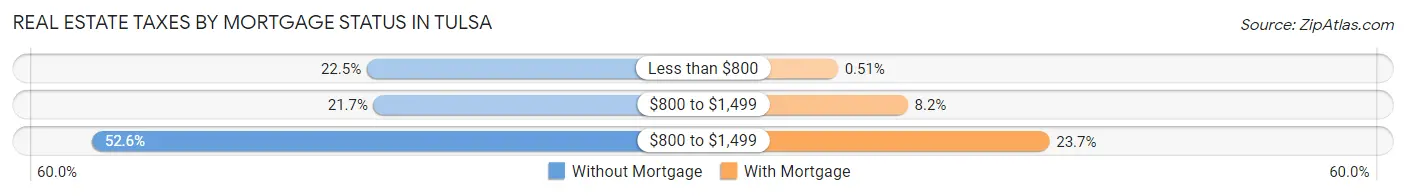
| Property Taxes | Without Mortgage | With Mortgage |
| Less than $800 | 8,720 (22.5%) | 254 (0.5%) |
| $800 to $1,499 | 8,428 (21.7%) | 4,078 (8.2%) |
| $800 to $1,499 | 20,415 (52.6%) | 11,837 (23.7%) |
| Total | 38,791 (100.0%) | 49,943 (100.0%) |
Health & Disability in Tulsa
Health Insurance Coverage by Age in Tulsa
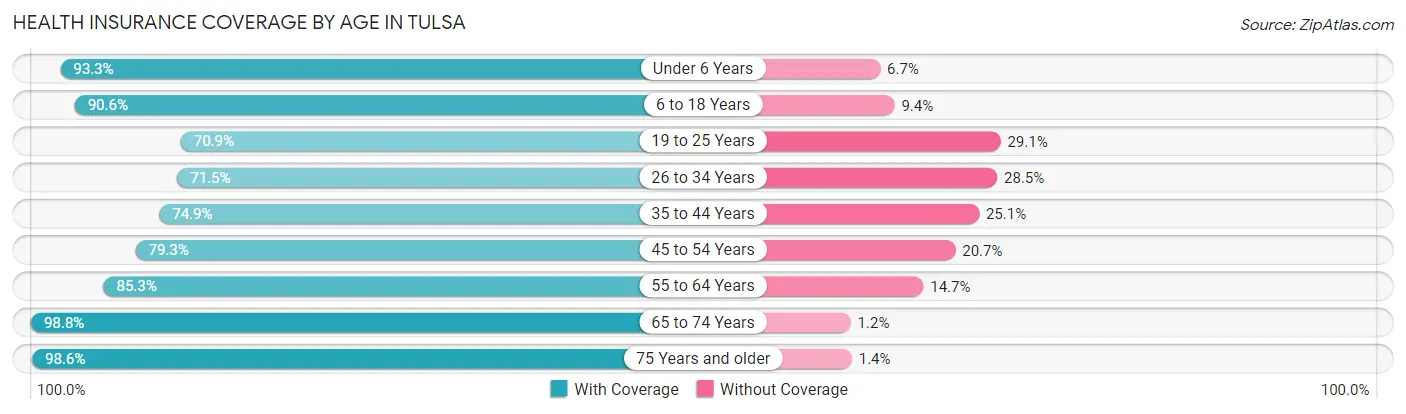
| Age Bracket | With Coverage | Without Coverage |
| Under 6 Years | 30,553 (93.3%) | 2,183 (6.7%) |
| 6 to 18 Years | 65,233 (90.6%) | 6,739 (9.4%) |
| 19 to 25 Years | 29,344 (70.9%) | 12,064 (29.1%) |
| 26 to 34 Years | 39,469 (71.5%) | 15,714 (28.5%) |
| 35 to 44 Years | 40,004 (74.9%) | 13,423 (25.1%) |
| 45 to 54 Years | 36,251 (79.3%) | 9,462 (20.7%) |
| 55 to 64 Years | 40,180 (85.3%) | 6,943 (14.7%) |
| 65 to 74 Years | 36,066 (98.8%) | 435 (1.2%) |
| 75 Years and older | 23,527 (98.6%) | 333 (1.4%) |
| Total | 340,627 (83.5%) | 67,296 (16.5%) |
Health Insurance Coverage by Citizenship Status in Tulsa
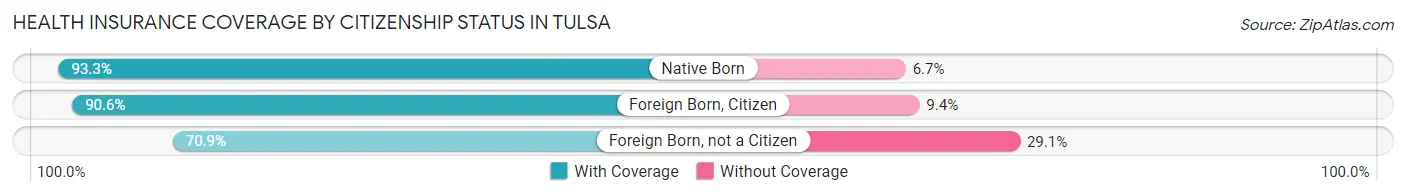
| Citizenship Status | With Coverage | Without Coverage |
| Native Born | 30,553 (93.3%) | 2,183 (6.7%) |
| Foreign Born, Citizen | 65,233 (90.6%) | 6,739 (9.4%) |
| Foreign Born, not a Citizen | 29,344 (70.9%) | 12,064 (29.1%) |
Health Insurance Coverage by Household Income in Tulsa
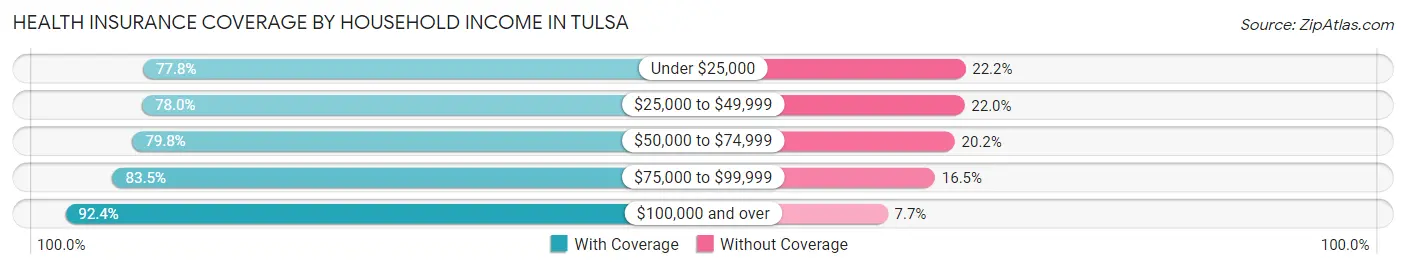
| Household Income | With Coverage | Without Coverage |
| Under $25,000 | 48,800 (77.8%) | 13,922 (22.2%) |
| $25,000 to $49,999 | 68,214 (78.0%) | 19,273 (22.0%) |
| $50,000 to $74,999 | 57,670 (79.8%) | 14,600 (20.2%) |
| $75,000 to $99,999 | 44,635 (83.5%) | 8,820 (16.5%) |
| $100,000 and over | 117,736 (92.3%) | 9,755 (7.6%) |
Public vs Private Health Insurance Coverage by Age in Tulsa
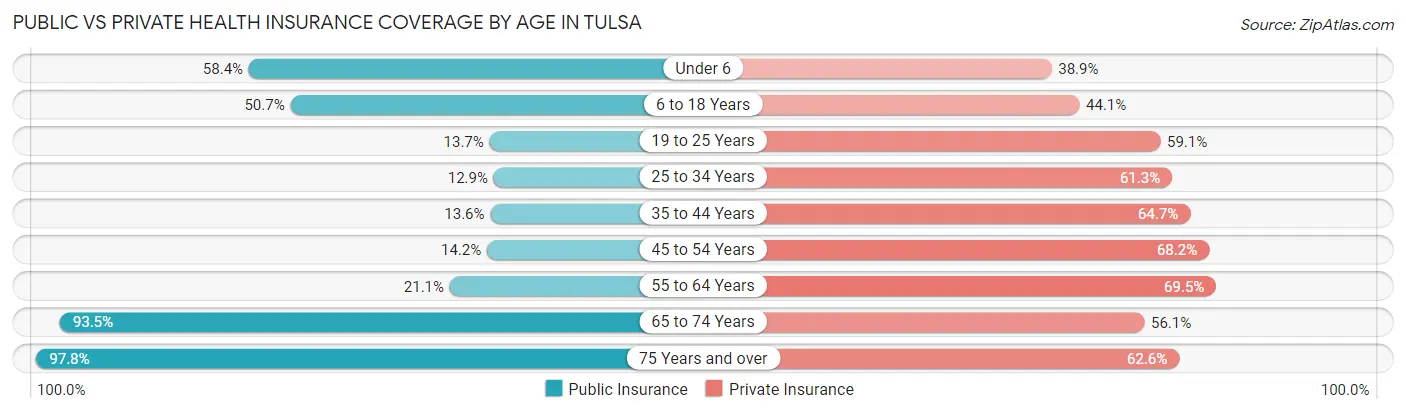
| Age Bracket | Public Insurance | Private Insurance |
| Under 6 | 19,104 (58.4%) | 12,732 (38.9%) |
| 6 to 18 Years | 36,452 (50.6%) | 31,704 (44.1%) |
| 19 to 25 Years | 5,670 (13.7%) | 24,459 (59.1%) |
| 25 to 34 Years | 7,123 (12.9%) | 33,824 (61.3%) |
| 35 to 44 Years | 7,240 (13.6%) | 34,540 (64.6%) |
| 45 to 54 Years | 6,473 (14.2%) | 31,154 (68.1%) |
| 55 to 64 Years | 9,930 (21.1%) | 32,739 (69.5%) |
| 65 to 74 Years | 34,111 (93.4%) | 20,477 (56.1%) |
| 75 Years and over | 23,337 (97.8%) | 14,937 (62.6%) |
| Total | 149,440 (36.6%) | 236,566 (58.0%) |
Disability Status by Sex by Age in Tulsa
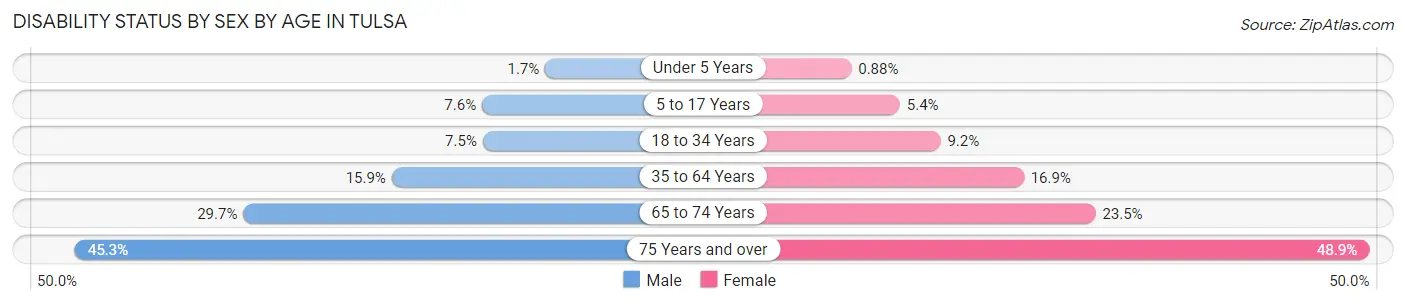
| Age Bracket | Male | Female |
| Under 5 Years | 240 (1.7%) | 119 (0.9%) |
| 5 to 17 Years | 2,730 (7.5%) | 1,888 (5.4%) |
| 18 to 34 Years | 3,787 (7.5%) | 4,742 (9.2%) |
| 35 to 64 Years | 11,506 (15.9%) | 12,500 (16.9%) |
| 65 to 74 Years | 4,958 (29.7%) | 4,664 (23.5%) |
| 75 Years and over | 4,289 (45.3%) | 7,048 (48.9%) |
Disability Class by Sex by Age in Tulsa
Disability Class: Hearing Difficulty
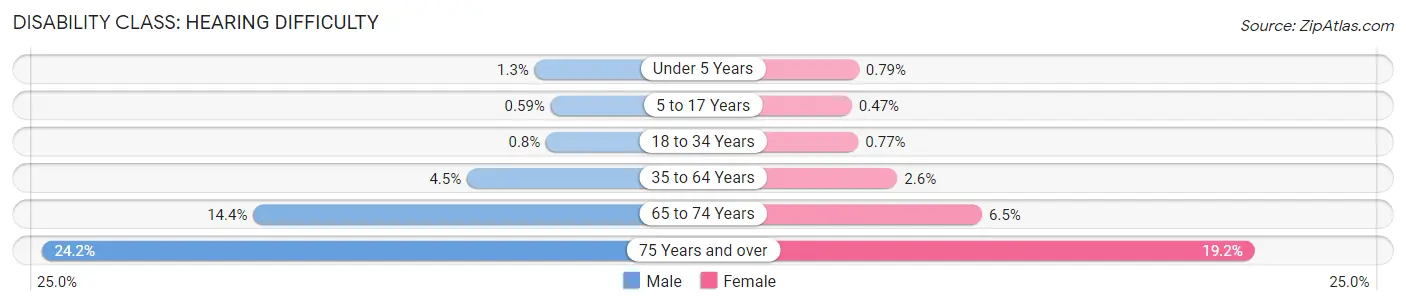
| Age Bracket | Male | Female |
| Under 5 Years | 189 (1.3%) | 108 (0.8%) |
| 5 to 17 Years | 215 (0.6%) | 166 (0.5%) |
| 18 to 34 Years | 405 (0.8%) | 400 (0.8%) |
| 35 to 64 Years | 3,225 (4.5%) | 1,907 (2.6%) |
| 65 to 74 Years | 2,402 (14.4%) | 1,290 (6.5%) |
| 75 Years and over | 2,290 (24.2%) | 2,758 (19.2%) |
Disability Class: Vision Difficulty
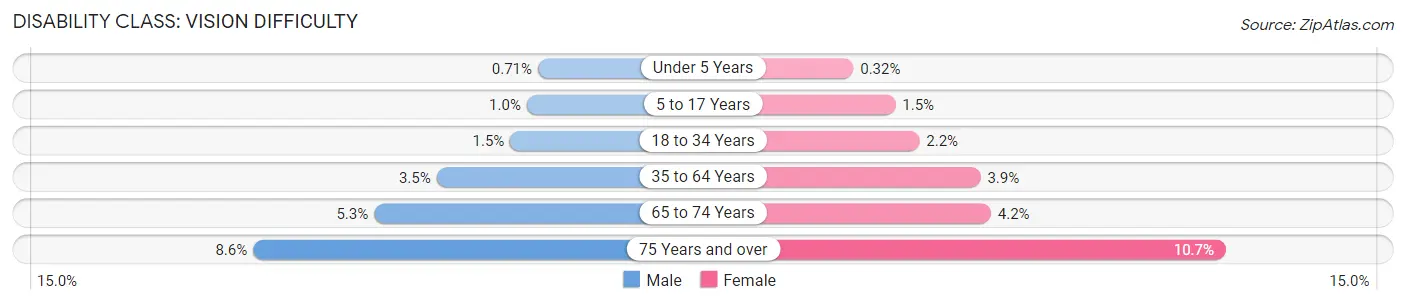
| Age Bracket | Male | Female |
| Under 5 Years | 100 (0.7%) | 43 (0.3%) |
| 5 to 17 Years | 369 (1.0%) | 523 (1.5%) |
| 18 to 34 Years | 748 (1.5%) | 1,117 (2.2%) |
| 35 to 64 Years | 2,547 (3.5%) | 2,861 (3.9%) |
| 65 to 74 Years | 879 (5.3%) | 823 (4.2%) |
| 75 Years and over | 817 (8.6%) | 1,539 (10.7%) |
Disability Class: Cognitive Difficulty
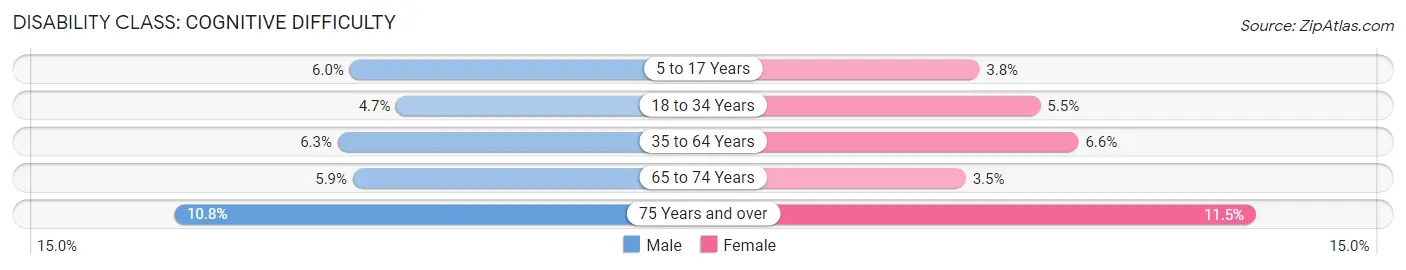
| Age Bracket | Male | Female |
| 5 to 17 Years | 2,150 (5.9%) | 1,343 (3.8%) |
| 18 to 34 Years | 2,351 (4.6%) | 2,861 (5.5%) |
| 35 to 64 Years | 4,538 (6.3%) | 4,878 (6.6%) |
| 65 to 74 Years | 978 (5.9%) | 684 (3.5%) |
| 75 Years and over | 1,025 (10.8%) | 1,661 (11.5%) |
Disability Class: Ambulatory Difficulty
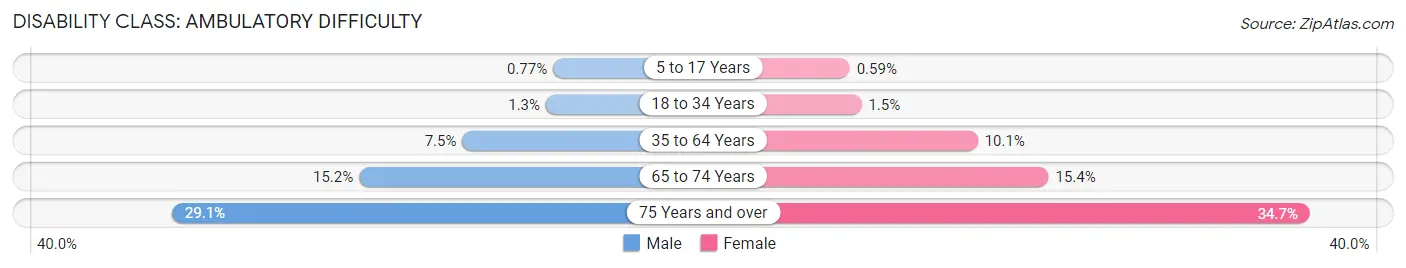
| Age Bracket | Male | Female |
| 5 to 17 Years | 277 (0.8%) | 206 (0.6%) |
| 18 to 34 Years | 657 (1.3%) | 755 (1.5%) |
| 35 to 64 Years | 5,417 (7.5%) | 7,473 (10.1%) |
| 65 to 74 Years | 2,532 (15.2%) | 3,042 (15.3%) |
| 75 Years and over | 2,749 (29.1%) | 5,003 (34.7%) |
Disability Class: Self-Care Difficulty
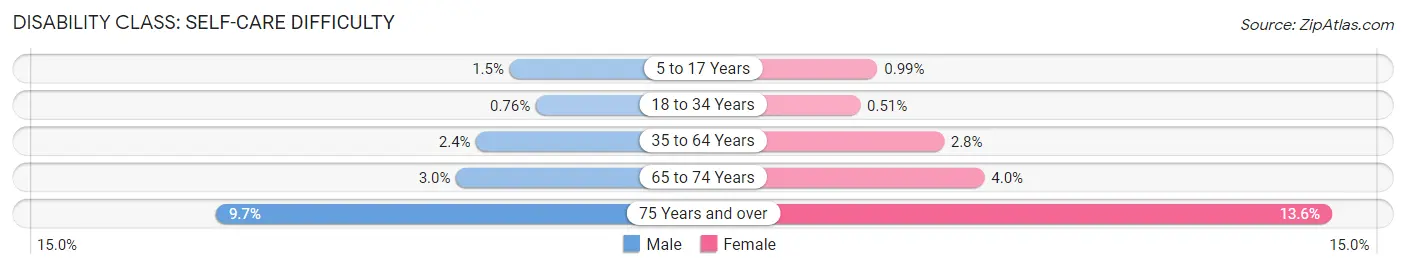
| Age Bracket | Male | Female |
| 5 to 17 Years | 539 (1.5%) | 348 (1.0%) |
| 18 to 34 Years | 386 (0.8%) | 266 (0.5%) |
| 35 to 64 Years | 1,745 (2.4%) | 2,105 (2.8%) |
| 65 to 74 Years | 498 (3.0%) | 786 (4.0%) |
| 75 Years and over | 915 (9.7%) | 1,964 (13.6%) |
Technology Access in Tulsa
Computing Device Access in Tulsa
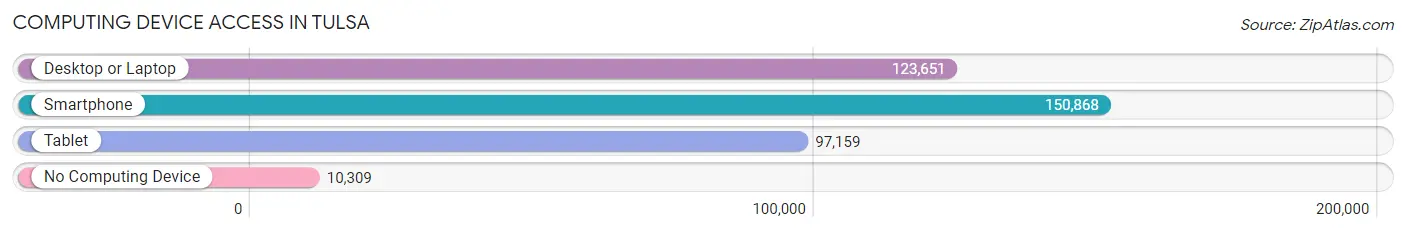
| Device Type | # Households | % Households |
| Desktop or Laptop | 123,651 | 72.8% |
| Smartphone | 150,868 | 88.9% |
| Tablet | 97,159 | 57.2% |
| No Computing Device | 10,309 | 6.1% |
| Total | 169,783 | 100.0% |
Internet Access in Tulsa
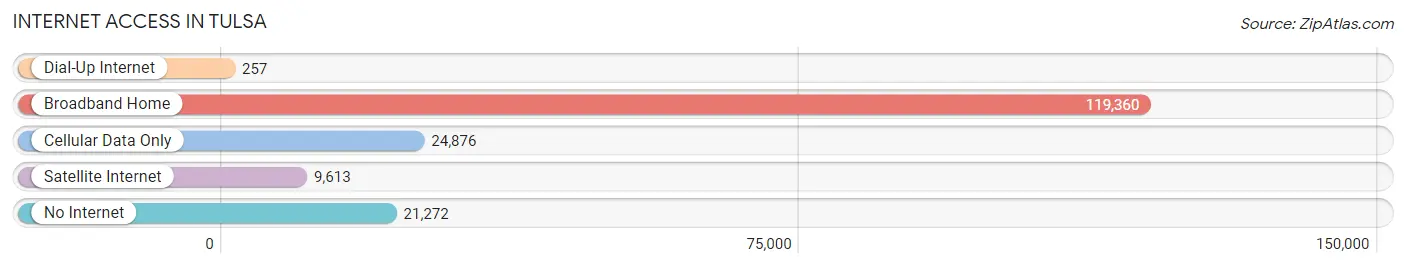
| Internet Type | # Households | % Households |
| Dial-Up Internet | 257 | 0.2% |
| Broadband Home | 119,360 | 70.3% |
| Cellular Data Only | 24,876 | 14.6% |
| Satellite Internet | 9,613 | 5.7% |
| No Internet | 21,272 | 12.5% |
| Total | 169,783 | 100.0% |
Tulsa Summary
Tulsa, Oklahoma is a city located in the northeastern part of the state, in the foothills of the Ozark Mountains. It is the second-largest city in the state, with a population of 393,049 as of the 2010 census. The city is the county seat of Tulsa County, and is the principal municipality of the Tulsa Metropolitan Area, a region with 991,005 residents in the MSA and 1,251,172 in the CSA.
Tulsa was first settled in 1836 by the Lochapoka Band of Creek Native American tribe. The city was initially named "Tulsey Town" after the Creek pronunciation of the name "Tulsa". It was officially incorporated as Tulsa in 1898. The city grew rapidly following the discovery of oil in 1901, becoming a center for the oil and gas industry.
Geography
Tulsa is located in the northeastern part of Oklahoma, in the foothills of the Ozark Mountains. It is situated on the Arkansas River, near the confluence of the Verdigris and Arkansas rivers. The city has a total area of 196.9 square miles, of which 195.2 square miles is land and 1.7 square miles is water.
Climate
Tulsa has a humid subtropical climate, with hot, humid summers and mild winters. The average annual temperature is 61.2°F, with an average high of 79.2°F in July and an average low of 43.2°F in January. The average annual precipitation is 40.2 inches, with an average of 4.2 inches of snowfall per year.
Demographics
As of the 2010 census, there were 393,049 people, 151,919 households, and 97,945 families residing in the city. The population density was 2,019.2 people per square mile. The racial makeup of the city was 63.2% White, 16.3% African American, 7.2% Native American, 2.3% Asian, 0.1% Pacific Islander, 8.2% from other races, and 2.7% from two or more races. Hispanic or Latino of any race were 15.8% of the population.
The median income for a household in the city was $37,817, and the median income for a family was $45,839. The per capita income for the city was $21,867. About 15.2% of families and 19.2% of the population were below the poverty line, including 28.5% of those under age 18 and 10.2% of those age 65 or over.
Economy
Tulsa's economy is largely based on the energy industry, with oil and natural gas production being the primary sources of income. The city is also home to a number of manufacturing and service industries, including aerospace, automotive, electronics, food processing, and telecommunications.
The city is home to several major corporations, including American Airlines, BOK Financial Corporation, Williams Companies, and QuikTrip. The city is also home to the University of Tulsa, Oral Roberts University, and Tulsa Community College.
Tulsa is served by the Tulsa International Airport, which is the largest airport in the state. The city is also served by two major interstate highways, I-44 and I-244.
Conclusion
Tulsa, Oklahoma is a city with a rich history and a vibrant economy. It is home to a diverse population and a variety of industries, from energy production to manufacturing and services. The city is served by a major airport and two major interstate highways, making it an important hub for transportation and commerce. With its strong economy and diverse population, Tulsa is an important part of the state of Oklahoma.
Common Questions
What is the Total Population of Tulsa?
Total Population of Tulsa is 411,938.
What is the Total Male Population of Tulsa?
Total Male Population of Tulsa is 201,571.
What is the Total Female Population of Tulsa?
Total Female Population of Tulsa is 210,367.
What is the Ratio of Males per 100 Females in Tulsa?
There are 95.82 Males per 100 Females in Tulsa.
What is the Ratio of Females per 100 Males in Tulsa?
There are 104.36 Females per 100 Males in Tulsa.
What is the Median Population Age in Tulsa?
Median Population Age in Tulsa is 35.6 Years.
What is the Average Family Size in Tulsa
Average Family Size in Tulsa is 3.2 People.
What is the Average Household Size in Tulsa
Average Household Size in Tulsa is 2.4 People.
What is Per Capita Income in Tulsa?
Per Capita income in Tulsa is $36,490.
What is the Median Family Income in Tulsa?
Median Family Income in Tulsa is $74,430.
What is the Median Household income in Tulsa?
Median Household Income in Tulsa is $56,648.
What is Income or Wage Gap in Tulsa?
Income or Wage Gap in Tulsa is 25.2%.
Women in Tulsa earn 74.8 cents for every dollar earned by a man.
What is Family Income Deficit in Tulsa?
Family Income Deficit in Tulsa is $12,243.
Families that are below poverty line in Tulsa earn $12,243 less on average than the poverty threshold level.
What is Inequality or Gini Index in Tulsa?
Inequality or Gini Index in Tulsa is 0.51.
How Large is the Labor Force in Tulsa?
There are 209,252 People in the Labor Forcein in Tulsa.
What is the Percentage of People in the Labor Force in Tulsa?
64.7% of People are in the Labor Force in Tulsa.
What is the Unemployment Rate in Tulsa?
Unemployment Rate in Tulsa is 5.8%.