Sand Hill, OK
Sand Hill Map
Sand Hill Overview
321
TOTAL POPULATION
163
MALE POPULATION
158
FEMALE POPULATION
103.16
MALES / 100 FEMALES
96.93
FEMALES / 100 MALES
54.2
MEDIAN AGE
3.0
AVG FAMILY SIZE
2.3
AVG HOUSEHOLD SIZE
$24,350
PER CAPITA INCOME
$68,977
AVG FAMILY INCOME
$44,583
AVG HOUSEHOLD INCOME
70.2%
WAGE / INCOME GAP [ % ]
29.8¢/ $1
WAGE / INCOME GAP [ $ ]
0.43
INEQUALITY / GINI INDEX
122
LABOR FORCE [ PEOPLE ]
43.9%
PERCENT IN LABOR FORCE
2.5%
UNEMPLOYMENT RATE
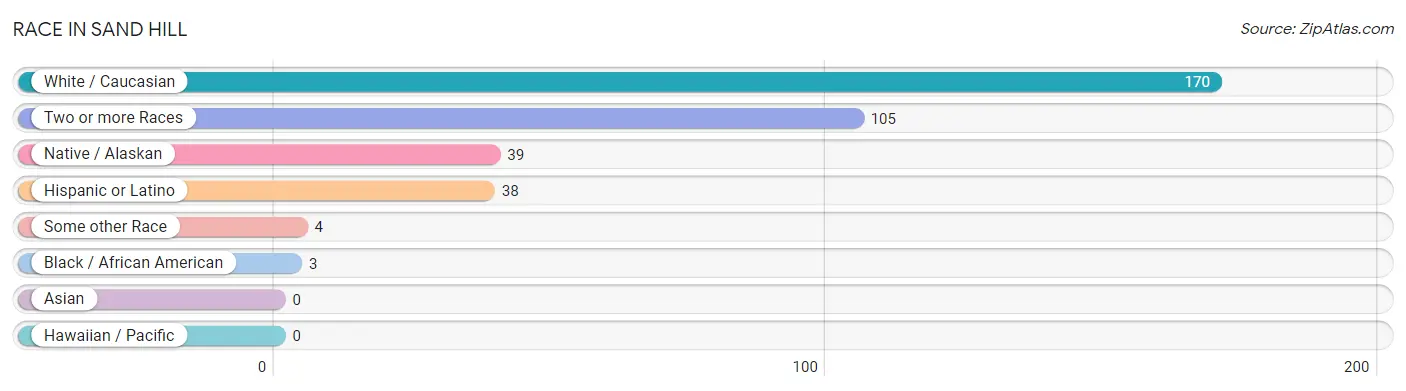
Race in Sand Hill
The most populous races in Sand Hill are White / Caucasian (170 | 53.0%), Two or more Races (105 | 32.7%), and Native / Alaskan (39 | 12.1%).
| Race | # Population | % Population |
| Asian | 0 | 0.0% |
| Black / African American | 3 | 0.9% |
| Hawaiian / Pacific | 0 | 0.0% |
| Hispanic or Latino | 38 | 11.8% |
| Native / Alaskan | 39 | 12.1% |
| White / Caucasian | 170 | 53.0% |
| Two or more Races | 105 | 32.7% |
| Some other Race | 4 | 1.3% |
| Total | 321 | 100.0% |
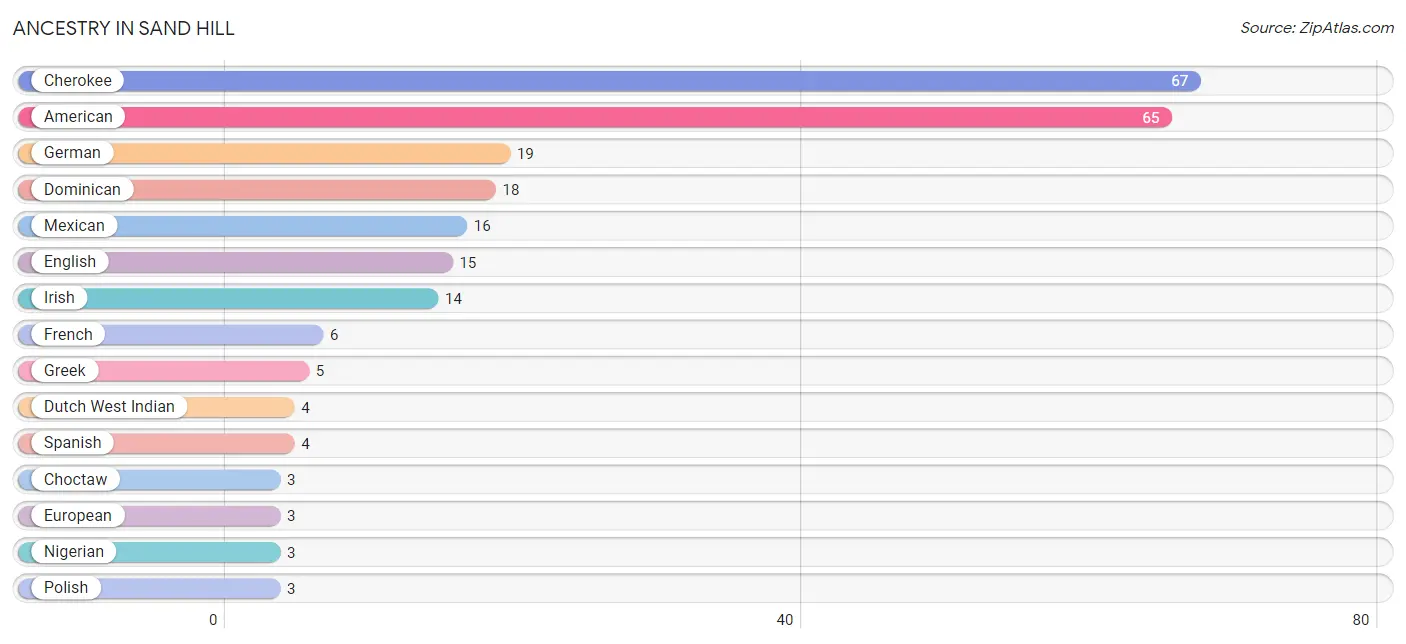
Ancestry in Sand Hill
The most populous ancestries reported in Sand Hill are Cherokee (67 | 20.9%), American (65 | 20.3%), German (19 | 5.9%), Dominican (18 | 5.6%), and Mexican (16 | 5.0%), together accounting for 57.6% of all Sand Hill residents.
| Ancestry | # Population | % Population |
| American | 65 | 20.3% |
| Cherokee | 67 | 20.9% |
| Choctaw | 3 | 0.9% |
| Dominican | 18 | 5.6% |
| Dutch West Indian | 4 | 1.3% |
| English | 15 | 4.7% |
| European | 3 | 0.9% |
| French | 6 | 1.9% |
| German | 19 | 5.9% |
| Greek | 5 | 1.6% |
| Irish | 14 | 4.4% |
| Mexican | 16 | 5.0% |
| Nigerian | 3 | 0.9% |
| Polish | 3 | 0.9% |
| Scotch-Irish | 3 | 0.9% |
| Spanish | 4 | 1.3% |
| Subsaharan African | 3 | 0.9% |
| Swedish | 2 | 0.6% | View All 18 Rows |
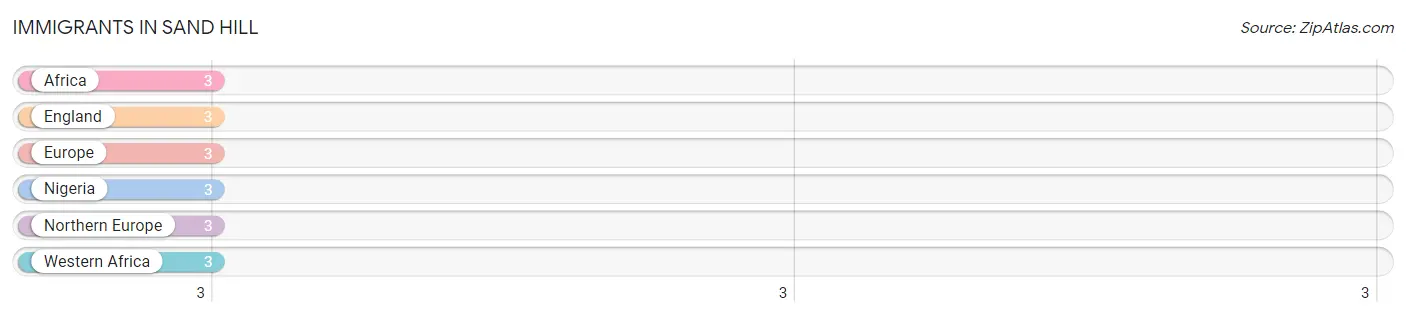
Immigrants in Sand Hill
The most numerous immigrant groups reported in Sand Hill came from Africa (3 | 0.9%), England (3 | 0.9%), Europe (3 | 0.9%), Nigeria (3 | 0.9%), and Northern Europe (3 | 0.9%), together accounting for 4.6% of all Sand Hill residents.
| Immigration Origin | # Population | % Population |
| Africa | 3 | 0.9% |
| England | 3 | 0.9% |
| Europe | 3 | 0.9% |
| Nigeria | 3 | 0.9% |
| Northern Europe | 3 | 0.9% |
| Western Africa | 3 | 0.9% | View All 6 Rows |
Sex and Age in Sand Hill
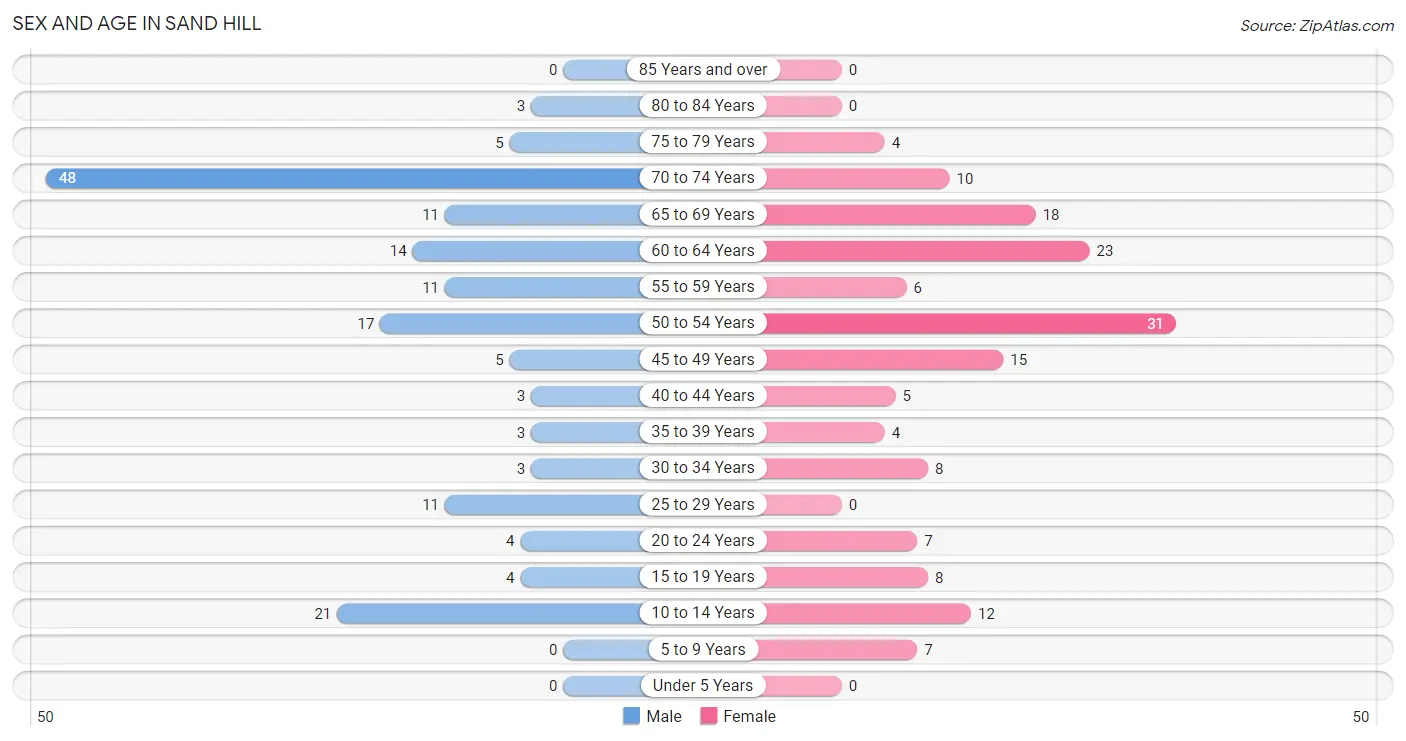
Sex and Age in Sand Hill
The most populous age groups in Sand Hill are 70 to 74 Years (48 | 29.4%) for men and 50 to 54 Years (31 | 19.6%) for women.
| Age Bracket | Male | Female |
| Under 5 Years | 0 (0.0%) | 0 (0.0%) |
| 5 to 9 Years | 0 (0.0%) | 7 (4.4%) |
| 10 to 14 Years | 21 (12.9%) | 12 (7.6%) |
| 15 to 19 Years | 4 (2.5%) | 8 (5.1%) |
| 20 to 24 Years | 4 (2.5%) | 7 (4.4%) |
| 25 to 29 Years | 11 (6.8%) | 0 (0.0%) |
| 30 to 34 Years | 3 (1.8%) | 8 (5.1%) |
| 35 to 39 Years | 3 (1.8%) | 4 (2.5%) |
| 40 to 44 Years | 3 (1.8%) | 5 (3.2%) |
| 45 to 49 Years | 5 (3.1%) | 15 (9.5%) |
| 50 to 54 Years | 17 (10.4%) | 31 (19.6%) |
| 55 to 59 Years | 11 (6.8%) | 6 (3.8%) |
| 60 to 64 Years | 14 (8.6%) | 23 (14.6%) |
| 65 to 69 Years | 11 (6.8%) | 18 (11.4%) |
| 70 to 74 Years | 48 (29.4%) | 10 (6.3%) |
| 75 to 79 Years | 5 (3.1%) | 4 (2.5%) |
| 80 to 84 Years | 3 (1.8%) | 0 (0.0%) |
| 85 Years and over | 0 (0.0%) | 0 (0.0%) |
| Total | 163 (100.0%) | 158 (100.0%) |
Families and Households in Sand Hill
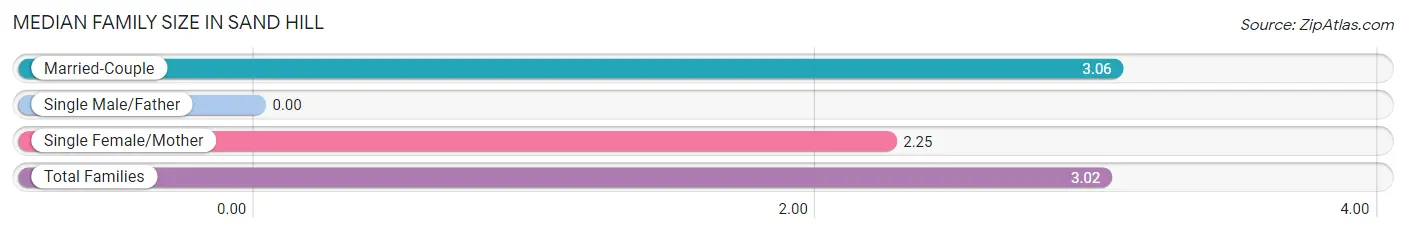
Median Family Size in Sand Hill
| Family Type | # Families | Family Size |
| Married-Couple | 81 (95.3%) | 3.06 |
| Single Male/Father | 0 (0.0%) | - |
| Single Female/Mother | 4 (4.7%) | 2.25 |
| Total Families | 85 (100.0%) | 3.02 |
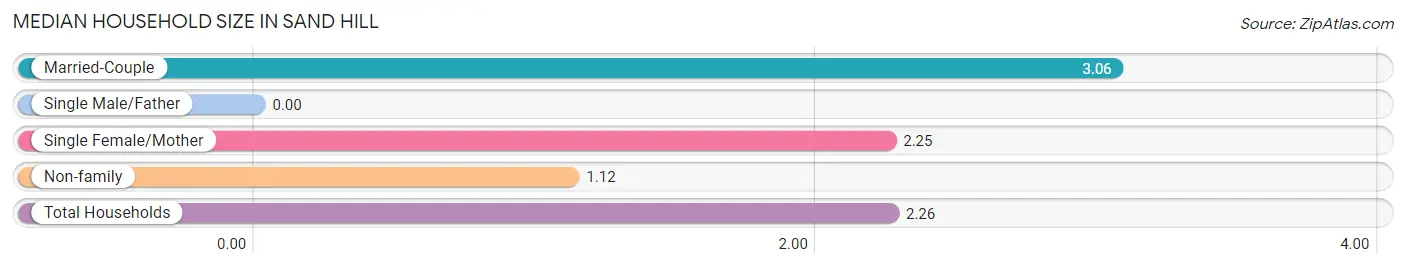
Median Household Size in Sand Hill
| Household Type | # Households | Household Size |
| Married-Couple | 81 (57.0%) | 3.06 |
| Single Male/Father | 0 (0.0%) | - |
| Single Female/Mother | 4 (2.8%) | 2.25 |
| Non-family | 57 (40.1%) | 1.12 |
| Total Households | 142 (100.0%) | 2.26 |
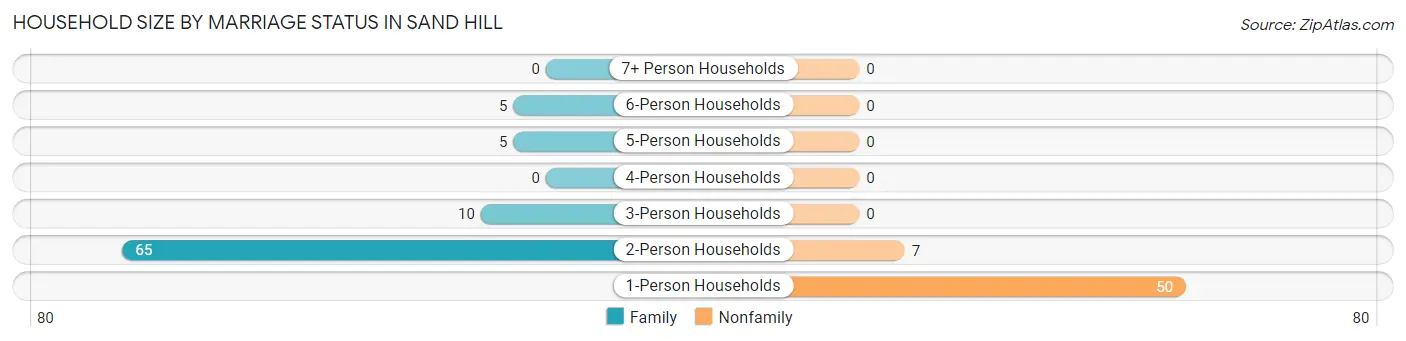
Household Size by Marriage Status in Sand Hill
Out of a total of 142 households in Sand Hill, 85 (59.9%) are family households, while 57 (40.1%) are nonfamily households. The most numerous type of family households are 2-person households, comprising 65, and the most common type of nonfamily households are 1-person households, comprising 50.
| Household Size | Family Households | Nonfamily Households |
| 1-Person Households | - | 50 (35.2%) |
| 2-Person Households | 65 (45.8%) | 7 (4.9%) |
| 3-Person Households | 10 (7.0%) | 0 (0.0%) |
| 4-Person Households | 0 (0.0%) | 0 (0.0%) |
| 5-Person Households | 5 (3.5%) | 0 (0.0%) |
| 6-Person Households | 5 (3.5%) | 0 (0.0%) |
| 7+ Person Households | 0 (0.0%) | 0 (0.0%) |
| Total | 85 (59.9%) | 57 (40.1%) |
Female Fertility in Sand Hill
Fertility by Age in Sand Hill
| Age Bracket | Women with Births | Births / 1,000 Women |
| 15 to 19 years | 0 (0.0%) | 0.0 |
| 20 to 34 years | 0 (0.0%) | 0.0 |
| 35 to 50 years | 0 (0.0%) | 0.0 |
| Total | 0 (0.0%) | 0.0 |
Fertility by Age by Marriage Status in Sand Hill
| Age Bracket | Married | Unmarried |
| 15 to 19 years | 0 (0.0%) | 0 (0.0%) |
| 20 to 34 years | 0 (0.0%) | 0 (0.0%) |
| 35 to 50 years | 0 (0.0%) | 0 (0.0%) |
| Total | 0 (0.0%) | 0 (0.0%) |
Fertility by Education in Sand Hill
| Educational Attainment | Women with Births | Births / 1,000 Women |
| Less than High School | 0 (0.0%) | 0.0 |
| High School Diploma | 0 (0.0%) | 0.0 |
| College or Associate's Degree | 0 (0.0%) | 0.0 |
| Bachelor's Degree | 0 (0.0%) | 0.0 |
| Graduate Degree | 0 (0.0%) | 0.0 |
| Total | 0 (0.0%) | 0.0 |
Fertility by Education by Marriage Status in Sand Hill
| Educational Attainment | Married | Unmarried |
| Less than High School | 0 (0.0%) | 0 (0.0%) |
| High School Diploma | 0 (0.0%) | 0 (0.0%) |
| College or Associate's Degree | 0 (0.0%) | 0 (0.0%) |
| Bachelor's Degree | 0 (0.0%) | 0 (0.0%) |
| Graduate Degree | 0 (0.0%) | 0 (0.0%) |
| Total | 0 (0.0%) | 0 (0.0%) |
Income in Sand Hill
Income Overview in Sand Hill
Per Capita Income in Sand Hill is $24,350, while median incomes of families and households are $68,977 and $44,583 respectively.
| Characteristic | Number | Measure |
| Per Capita Income | 321 | $24,350 |
| Median Family Income | 85 | $68,977 |
| Mean Family Income | 85 | $72,013 |
| Median Household Income | 142 | $44,583 |
| Mean Household Income | 142 | $50,732 |
| Income Deficit | 85 | $0 |
| Wage / Income Gap (%) | 321 | 70.20% |
| Wage / Income Gap ($) | 321 | 29.80¢ per $1 |
| Gini / Inequality Index | 321 | 0.43 |
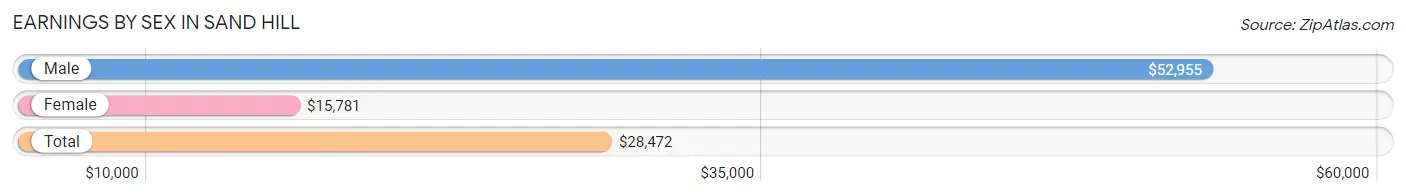
Earnings by Sex in Sand Hill
Average Earnings in Sand Hill are $28,472, $52,955 for men and $15,781 for women, a difference of 70.2%.
| Sex | Number | Average Earnings |
| Male | 56 (45.5%) | $52,955 |
| Female | 67 (54.5%) | $15,781 |
| Total | 123 (100.0%) | $28,472 |
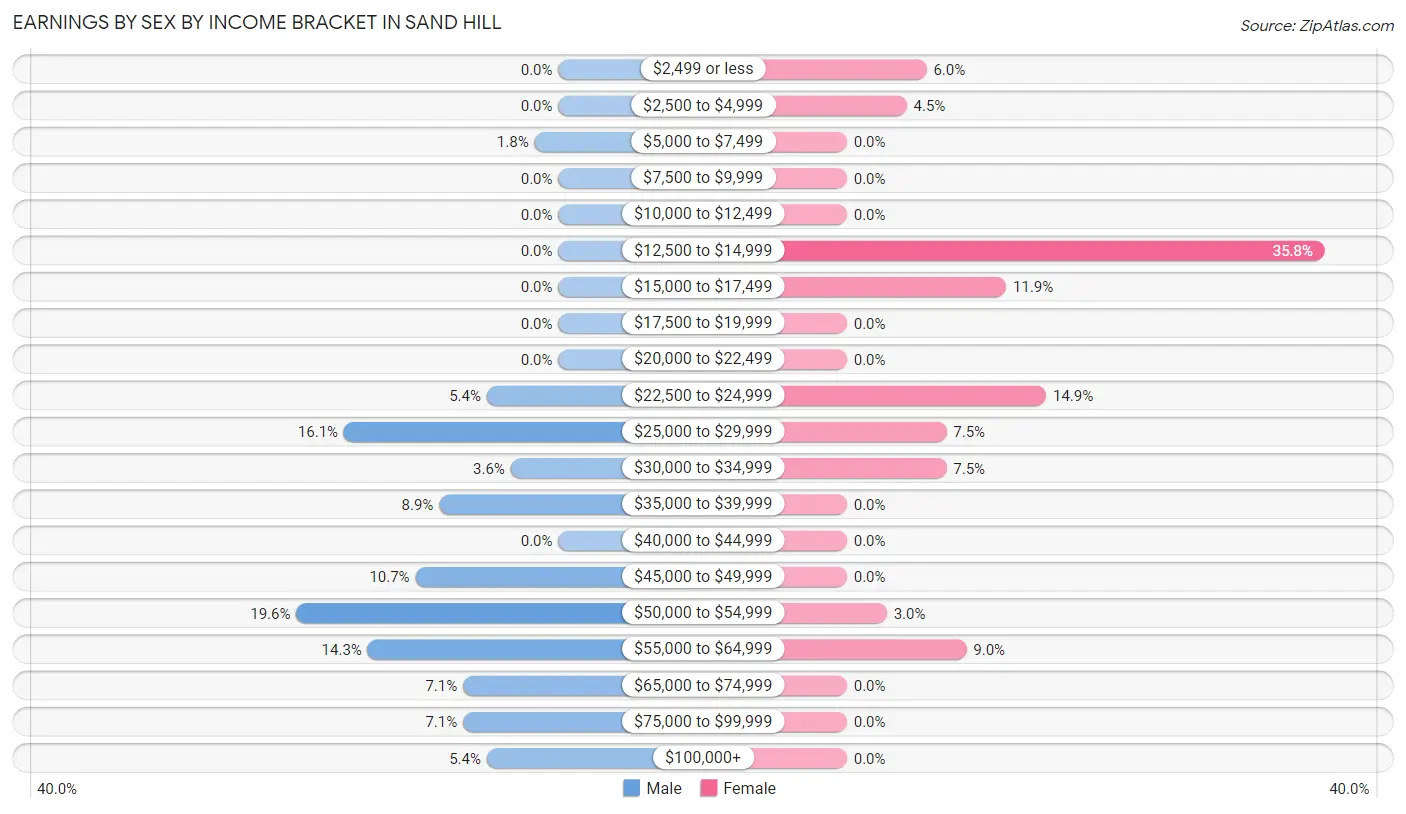
Earnings by Sex by Income Bracket in Sand Hill
The most common earnings brackets in Sand Hill are $50,000 to $54,999 for men (11 | 19.6%) and $12,500 to $14,999 for women (24 | 35.8%).
| Income | Male | Female |
| $2,499 or less | 0 (0.0%) | 4 (6.0%) |
| $2,500 to $4,999 | 0 (0.0%) | 3 (4.5%) |
| $5,000 to $7,499 | 1 (1.8%) | 0 (0.0%) |
| $7,500 to $9,999 | 0 (0.0%) | 0 (0.0%) |
| $10,000 to $12,499 | 0 (0.0%) | 0 (0.0%) |
| $12,500 to $14,999 | 0 (0.0%) | 24 (35.8%) |
| $15,000 to $17,499 | 0 (0.0%) | 8 (11.9%) |
| $17,500 to $19,999 | 0 (0.0%) | 0 (0.0%) |
| $20,000 to $22,499 | 0 (0.0%) | 0 (0.0%) |
| $22,500 to $24,999 | 3 (5.4%) | 10 (14.9%) |
| $25,000 to $29,999 | 9 (16.1%) | 5 (7.5%) |
| $30,000 to $34,999 | 2 (3.6%) | 5 (7.5%) |
| $35,000 to $39,999 | 5 (8.9%) | 0 (0.0%) |
| $40,000 to $44,999 | 0 (0.0%) | 0 (0.0%) |
| $45,000 to $49,999 | 6 (10.7%) | 0 (0.0%) |
| $50,000 to $54,999 | 11 (19.6%) | 2 (3.0%) |
| $55,000 to $64,999 | 8 (14.3%) | 6 (9.0%) |
| $65,000 to $74,999 | 4 (7.1%) | 0 (0.0%) |
| $75,000 to $99,999 | 4 (7.1%) | 0 (0.0%) |
| $100,000+ | 3 (5.4%) | 0 (0.0%) |
| Total | 56 (100.0%) | 67 (100.0%) |
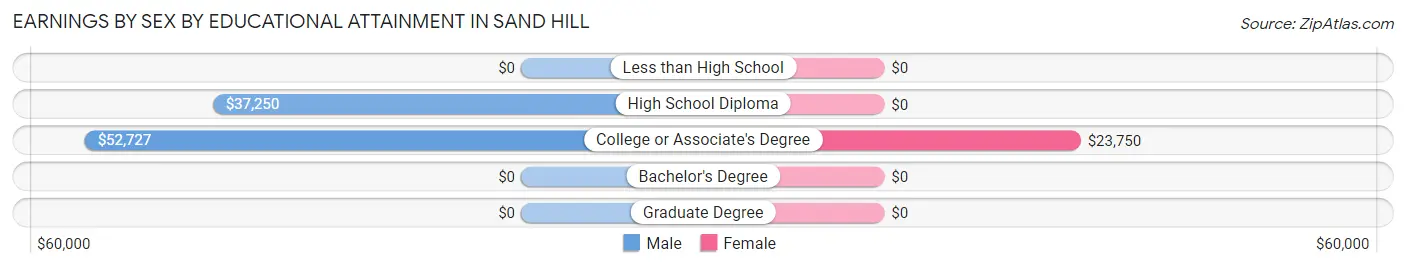
Earnings by Sex by Educational Attainment in Sand Hill
| Educational Attainment | Male Income | Female Income |
| Less than High School | - | - |
| High School Diploma | $37,250 | $0 |
| College or Associate's Degree | $52,727 | $23,750 |
| Bachelor's Degree | - | - |
| Graduate Degree | - | - |
| Total | $53,068 | $0 |
Family Income in Sand Hill
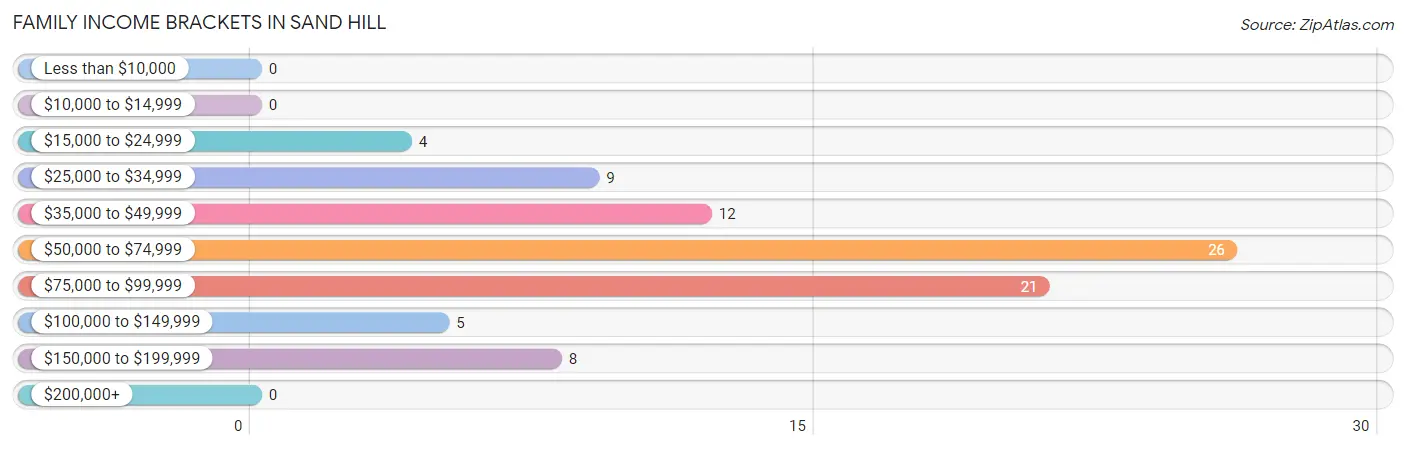
Family Income Brackets in Sand Hill
According to the Sand Hill family income data, there are 26 families falling into the $50,000 to $74,999 income range, which is the most common income bracket and makes up 30.6% of all families.
| Income Bracket | # Families | % Families |
| Less than $10,000 | 0 | 0.0% |
| $10,000 to $14,999 | 0 | 0.0% |
| $15,000 to $24,999 | 4 | 4.7% |
| $25,000 to $34,999 | 9 | 10.6% |
| $35,000 to $49,999 | 12 | 14.1% |
| $50,000 to $74,999 | 26 | 30.6% |
| $75,000 to $99,999 | 21 | 24.7% |
| $100,000 to $149,999 | 5 | 5.9% |
| $150,000 to $199,999 | 8 | 9.4% |
| $200,000+ | 0 | 0.0% |
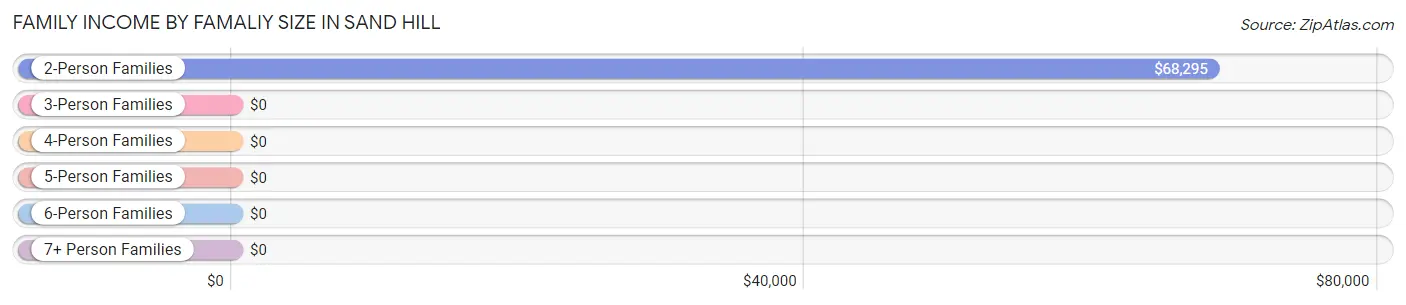
Family Income by Famaliy Size in Sand Hill
2-person families (65 | 76.5%) account for the highest median family income in Sand Hill with $68,295 per family, while 2-person families (65 | 76.5%) have the highest median income of $34,148 per family member.
| Income Bracket | # Families | Median Income |
| 2-Person Families | 65 (76.5%) | $68,295 |
| 3-Person Families | 10 (11.8%) | $0 |
| 4-Person Families | 0 (0.0%) | $0 |
| 5-Person Families | 5 (5.9%) | $0 |
| 6-Person Families | 5 (5.9%) | $0 |
| 7+ Person Families | 0 (0.0%) | $0 |
| Total | 85 (100.0%) | $68,977 |
Family Income by Number of Earners in Sand Hill

| Number of Earners | # Families | Median Income |
| No Earners | 25 (29.4%) | $67,813 |
| 1 Earner | 18 (21.2%) | $0 |
| 2 Earners | 37 (43.5%) | $81,875 |
| 3+ Earners | 5 (5.9%) | $0 |
| Total | 85 (100.0%) | $68,977 |
Household Income in Sand Hill
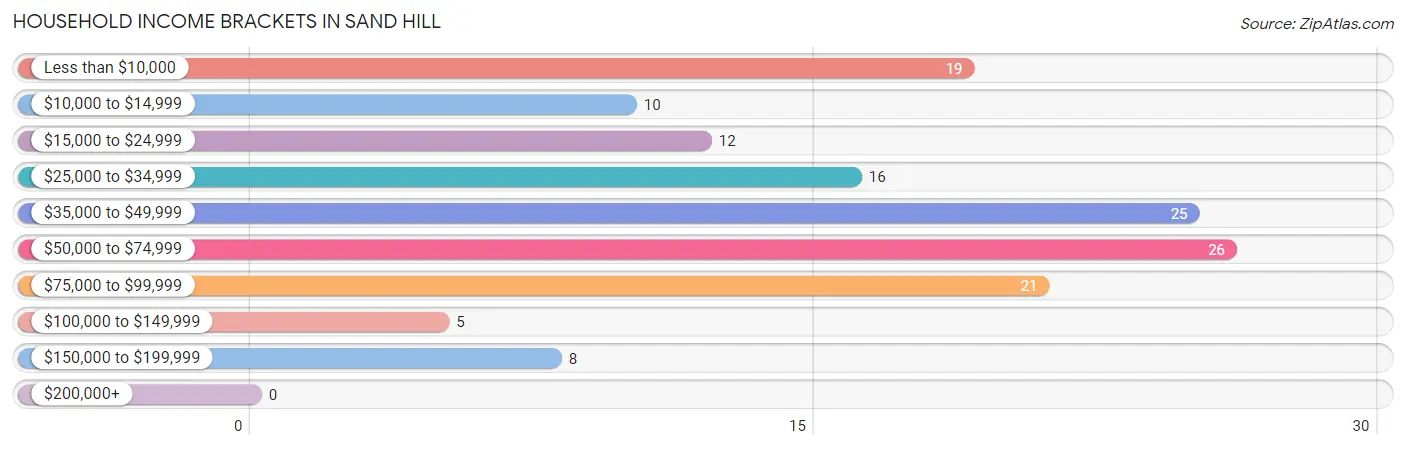
Household Income Brackets in Sand Hill
With 26 households falling in the category, the $50,000 to $74,999 income range is the most frequent in Sand Hill, accounting for 18.3% of all households.
| Income Bracket | # Households | % Households |
| Less than $10,000 | 19 | 13.4% |
| $10,000 to $14,999 | 10 | 7.0% |
| $15,000 to $24,999 | 12 | 8.5% |
| $25,000 to $34,999 | 16 | 11.3% |
| $35,000 to $49,999 | 25 | 17.6% |
| $50,000 to $74,999 | 26 | 18.3% |
| $75,000 to $99,999 | 21 | 14.8% |
| $100,000 to $149,999 | 5 | 3.5% |
| $150,000 to $199,999 | 8 | 5.6% |
| $200,000+ | 0 | 0.0% |
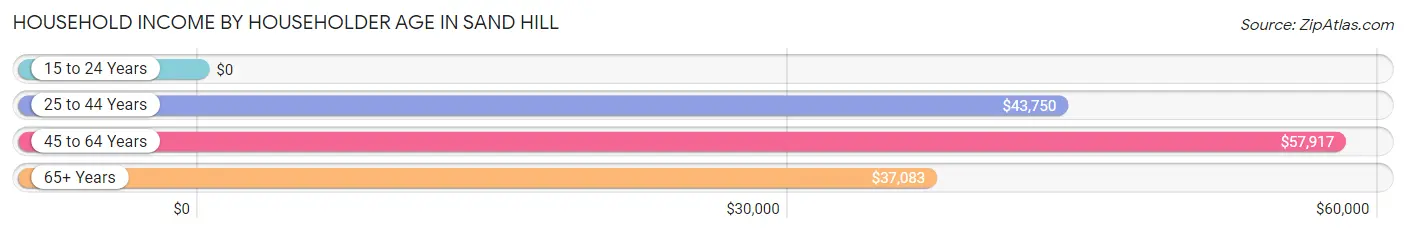
Household Income by Householder Age in Sand Hill
The median household income in Sand Hill is $44,583, with the highest median household income of $57,917 found in the 45 to 64 years age bracket for the primary householder. A total of 69 households (48.6%) fall into this category. Meanwhile, the 15 to 24 years age bracket for the primary householder has the lowest median household income of $0, with 7 households (4.9%) in this group.
| Income Bracket | # Households | Median Income |
| 15 to 24 Years | 7 (4.9%) | $0 |
| 25 to 44 Years | 11 (7.7%) | $43,750 |
| 45 to 64 Years | 69 (48.6%) | $57,917 |
| 65+ Years | 55 (38.7%) | $37,083 |
| Total | 142 (100.0%) | $44,583 |
Poverty in Sand Hill
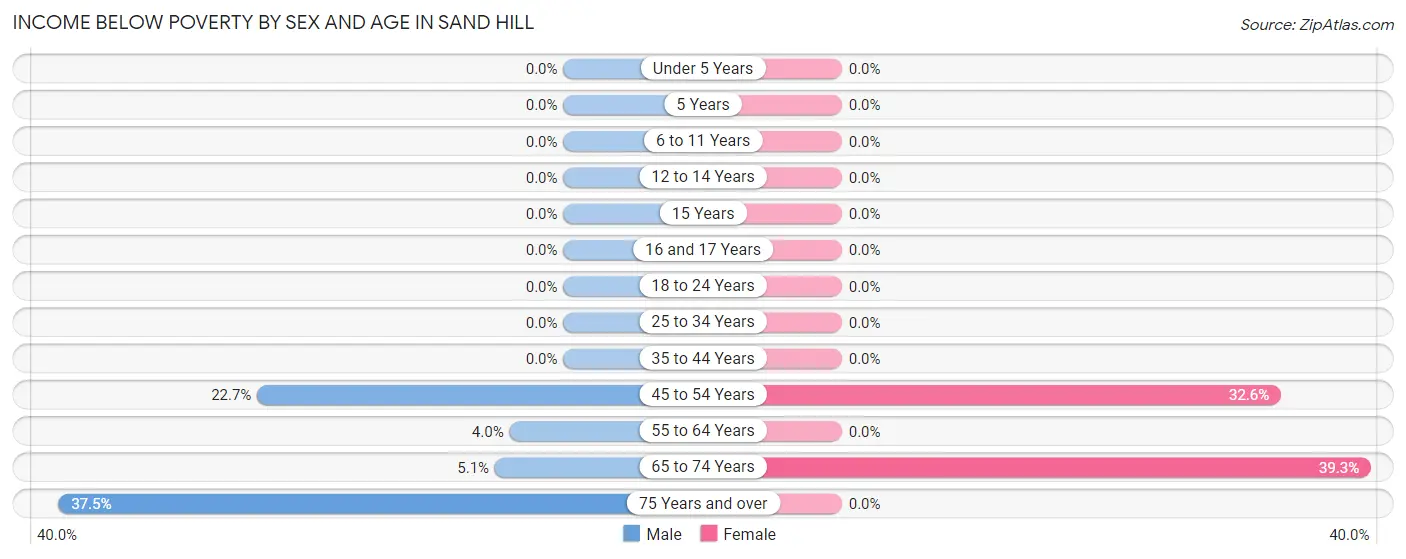
Income Below Poverty by Sex and Age in Sand Hill
With 7.4% poverty level for males and 16.5% for females among the residents of Sand Hill, 75 year old and over males and 65 to 74 year old females are the most vulnerable to poverty, with 3 males (37.5%) and 11 females (39.3%) in their respective age groups living below the poverty level.
| Age Bracket | Male | Female |
| Under 5 Years | 0 (0.0%) | 0 (0.0%) |
| 5 Years | 0 (0.0%) | 0 (0.0%) |
| 6 to 11 Years | 0 (0.0%) | 0 (0.0%) |
| 12 to 14 Years | 0 (0.0%) | 0 (0.0%) |
| 15 Years | 0 (0.0%) | 0 (0.0%) |
| 16 and 17 Years | 0 (0.0%) | 0 (0.0%) |
| 18 to 24 Years | 0 (0.0%) | 0 (0.0%) |
| 25 to 34 Years | 0 (0.0%) | 0 (0.0%) |
| 35 to 44 Years | 0 (0.0%) | 0 (0.0%) |
| 45 to 54 Years | 5 (22.7%) | 15 (32.6%) |
| 55 to 64 Years | 1 (4.0%) | 0 (0.0%) |
| 65 to 74 Years | 3 (5.1%) | 11 (39.3%) |
| 75 Years and over | 3 (37.5%) | 0 (0.0%) |
| Total | 12 (7.4%) | 26 (16.5%) |
Income Above Poverty by Sex and Age in Sand Hill
According to the poverty statistics in Sand Hill, males aged 6 to 11 years and females aged 6 to 11 years are the age groups that are most secure financially, with 100.0% of males and 100.0% of females in these age groups living above the poverty line.
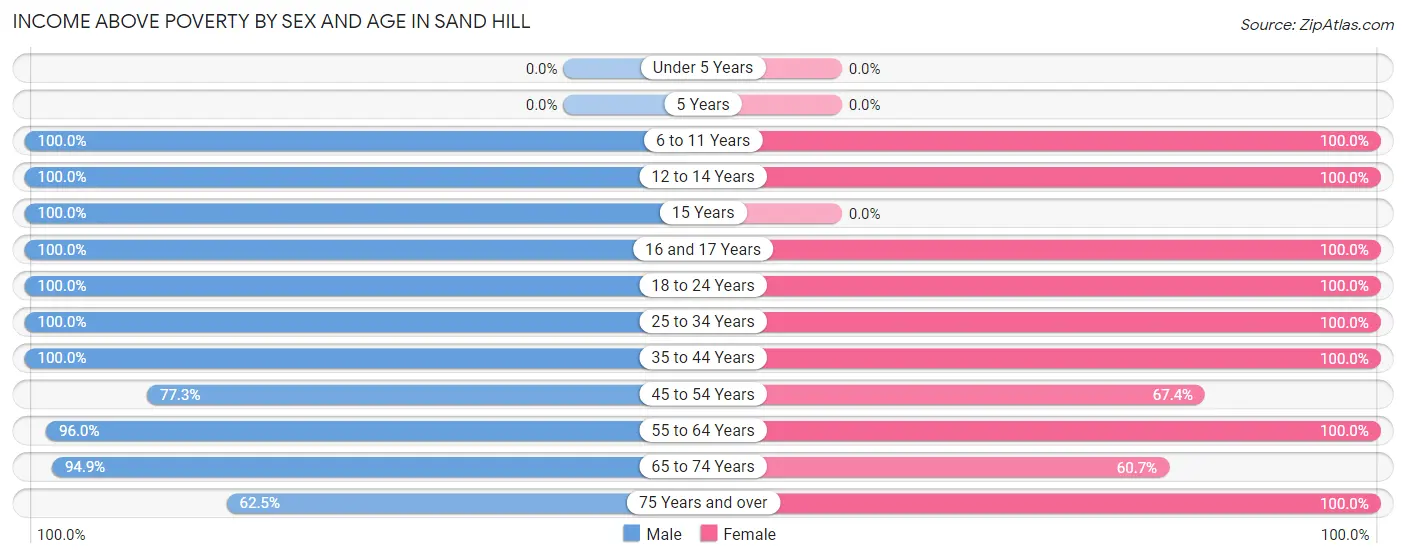
| Age Bracket | Male | Female |
| Under 5 Years | 0 (0.0%) | 0 (0.0%) |
| 5 Years | 0 (0.0%) | 0 (0.0%) |
| 6 to 11 Years | 10 (100.0%) | 13 (100.0%) |
| 12 to 14 Years | 11 (100.0%) | 6 (100.0%) |
| 15 Years | 3 (100.0%) | 0 (0.0%) |
| 16 and 17 Years | 1 (100.0%) | 8 (100.0%) |
| 18 to 24 Years | 4 (100.0%) | 7 (100.0%) |
| 25 to 34 Years | 14 (100.0%) | 8 (100.0%) |
| 35 to 44 Years | 6 (100.0%) | 9 (100.0%) |
| 45 to 54 Years | 17 (77.3%) | 31 (67.4%) |
| 55 to 64 Years | 24 (96.0%) | 29 (100.0%) |
| 65 to 74 Years | 56 (94.9%) | 17 (60.7%) |
| 75 Years and over | 5 (62.5%) | 4 (100.0%) |
| Total | 151 (92.6%) | 132 (83.5%) |
Income Below Poverty Among Married-Couple Families in Sand Hill
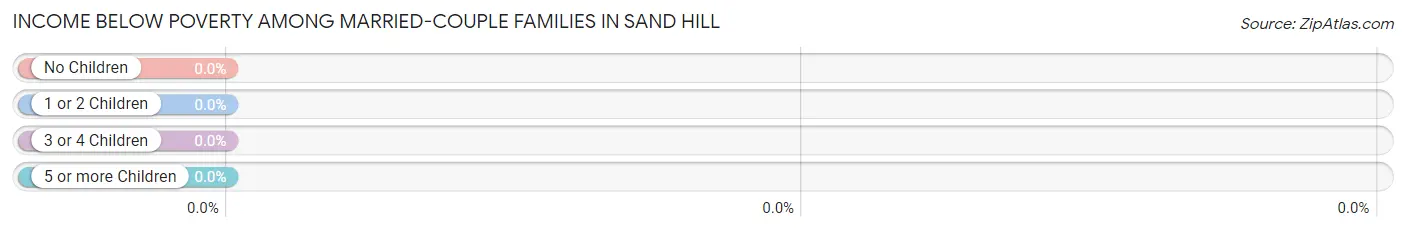
| Children | Above Poverty | Below Poverty |
| No Children | 67 (100.0%) | 0 (0.0%) |
| 1 or 2 Children | 4 (100.0%) | 0 (0.0%) |
| 3 or 4 Children | 10 (100.0%) | 0 (0.0%) |
| 5 or more Children | 0 (0.0%) | 0 (0.0%) |
| Total | 81 (100.0%) | 0 (0.0%) |
Income Below Poverty Among Single-Parent Households in Sand Hill
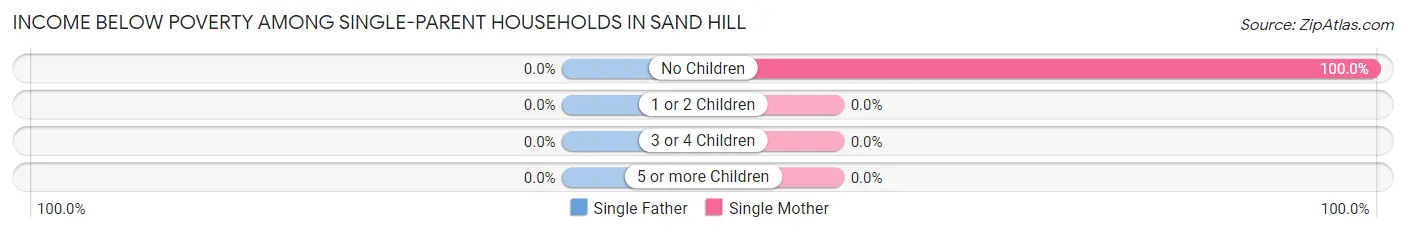
| Children | Single Father | Single Mother |
| No Children | 0 (0.0%) | 4 (100.0%) |
| 1 or 2 Children | 0 (0.0%) | 0 (0.0%) |
| 3 or 4 Children | 0 (0.0%) | 0 (0.0%) |
| 5 or more Children | 0 (0.0%) | 0 (0.0%) |
| Total | 0 (0.0%) | 4 (100.0%) |
Income Below Poverty Among Married-Couple vs Single-Parent Households in Sand Hill
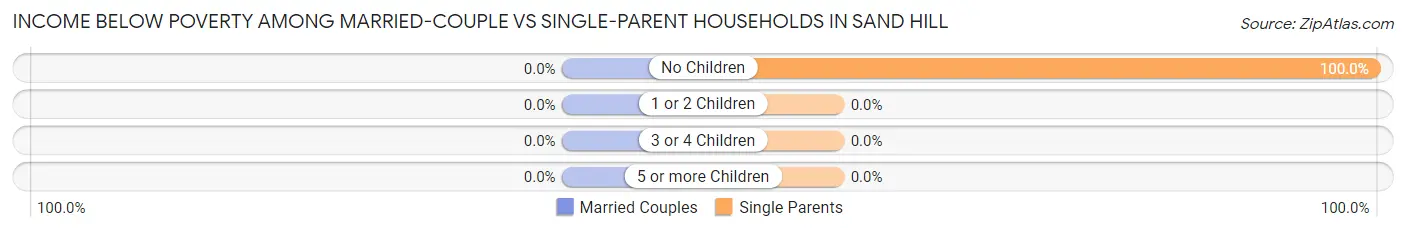
| Children | Married-Couple Families | Single-Parent Households |
| No Children | 0 (0.0%) | 4 (100.0%) |
| 1 or 2 Children | 0 (0.0%) | 0 (0.0%) |
| 3 or 4 Children | 0 (0.0%) | 0 (0.0%) |
| 5 or more Children | 0 (0.0%) | 0 (0.0%) |
| Total | 0 (0.0%) | 4 (100.0%) |
Employment Characteristics in Sand Hill
Employment by Class of Employer in Sand Hill
Among the 119 employed individuals in Sand Hill, private company employees (64 | 53.8%), self-employed (not incorporated) (22 | 18.5%), and federal government employees (13 | 10.9%) make up the most common classes of employment.
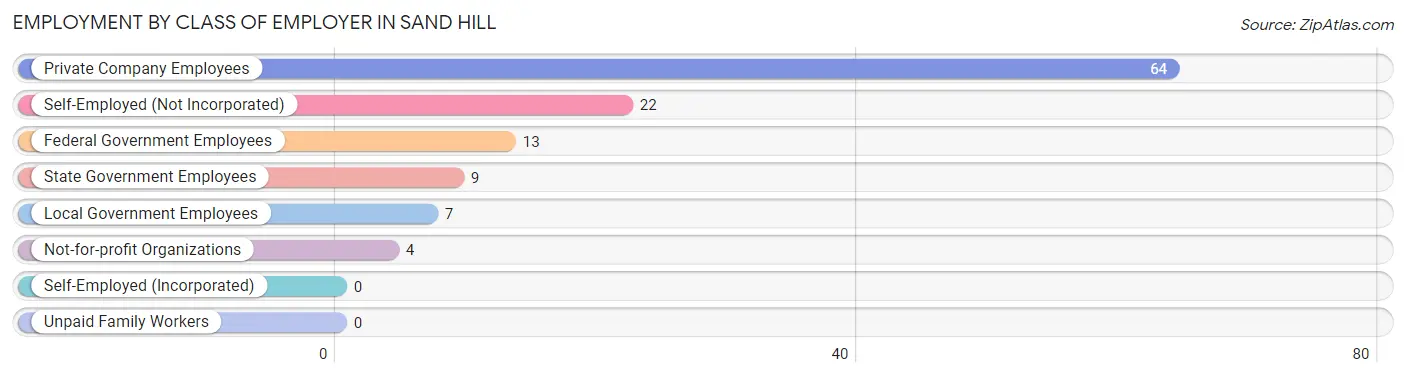
| Employer Class | # Employees | % Employees |
| Private Company Employees | 64 | 53.8% |
| Self-Employed (Incorporated) | 0 | 0.0% |
| Self-Employed (Not Incorporated) | 22 | 18.5% |
| Not-for-profit Organizations | 4 | 3.4% |
| Local Government Employees | 7 | 5.9% |
| State Government Employees | 9 | 7.6% |
| Federal Government Employees | 13 | 10.9% |
| Unpaid Family Workers | 0 | 0.0% |
| Total | 119 | 100.0% |
Employment Status by Age in Sand Hill
According to the labor force statistics for Sand Hill, out of the total population over 16 years of age (278), 43.9% or 122 individuals are in the labor force, with 2.5% or 3 of them unemployed. The age group with the highest labor force participation rate is 25 to 29 years, with 100.0% or 11 individuals in the labor force. Within the labor force, the 60 to 64 years age range has the highest percentage of unemployed individuals, with 15.8% or 3 of them being unemployed.
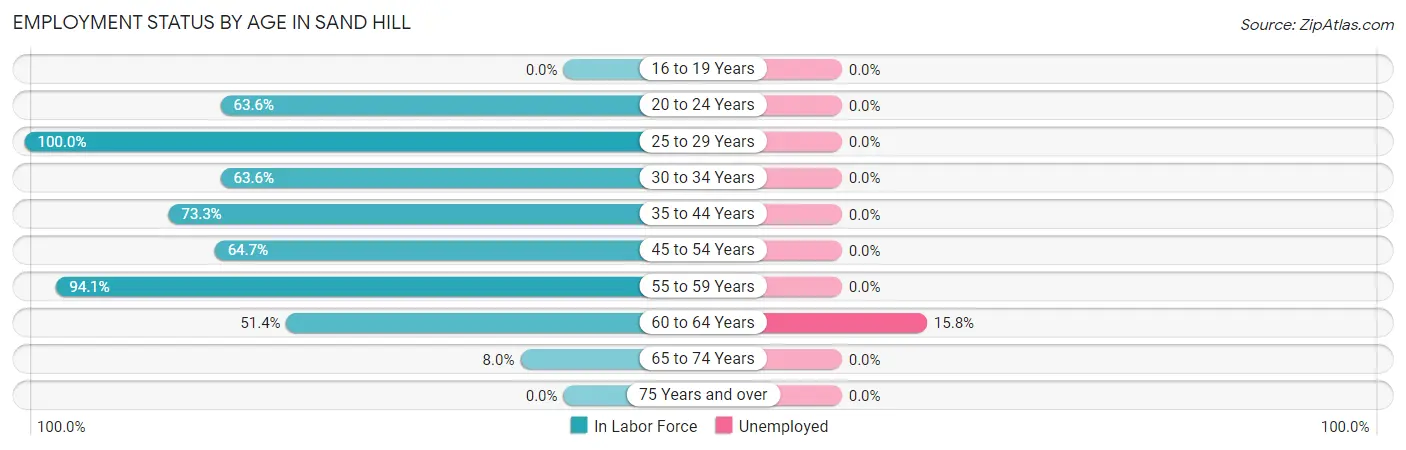
| Age Bracket | In Labor Force | Unemployed |
| 16 to 19 Years | 0 (0.0%) | 0 (0.0%) |
| 20 to 24 Years | 7 (63.6%) | 0 (0.0%) |
| 25 to 29 Years | 11 (100.0%) | 0 (0.0%) |
| 30 to 34 Years | 7 (63.6%) | 0 (0.0%) |
| 35 to 44 Years | 11 (73.3%) | 0 (0.0%) |
| 45 to 54 Years | 44 (64.7%) | 0 (0.0%) |
| 55 to 59 Years | 16 (94.1%) | 0 (0.0%) |
| 60 to 64 Years | 19 (51.4%) | 3 (15.8%) |
| 65 to 74 Years | 7 (8.0%) | 0 (0.0%) |
| 75 Years and over | 0 (0.0%) | 0 (0.0%) |
| Total | 122 (43.9%) | 3 (2.5%) |
Employment Status by Educational Attainment in Sand Hill
According to labor force statistics for Sand Hill, 67.9% of individuals (108) out of the total population between 25 and 64 years of age (159) are in the labor force, with 2.8% or 3 of them being unemployed. The group with the highest labor force participation rate are those with the educational attainment of bachelor's degree or higher, with 100.0% or 13 individuals in the labor force. Within the labor force, individuals with high school diploma education have the highest percentage of unemployment, with 9.1% or 3 of them being unemployed.
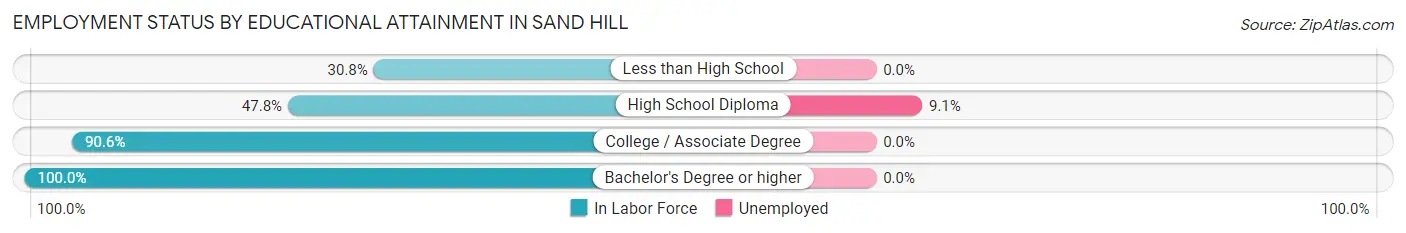
| Educational Attainment | In Labor Force | Unemployed |
| Less than High School | 4 (30.8%) | 0 (0.0%) |
| High School Diploma | 33 (47.8%) | 6 (9.1%) |
| College / Associate Degree | 58 (90.6%) | 0 (0.0%) |
| Bachelor's Degree or higher | 13 (100.0%) | 0 (0.0%) |
| Total | 108 (67.9%) | 4 (2.8%) |
Employment Occupations by Sex in Sand Hill
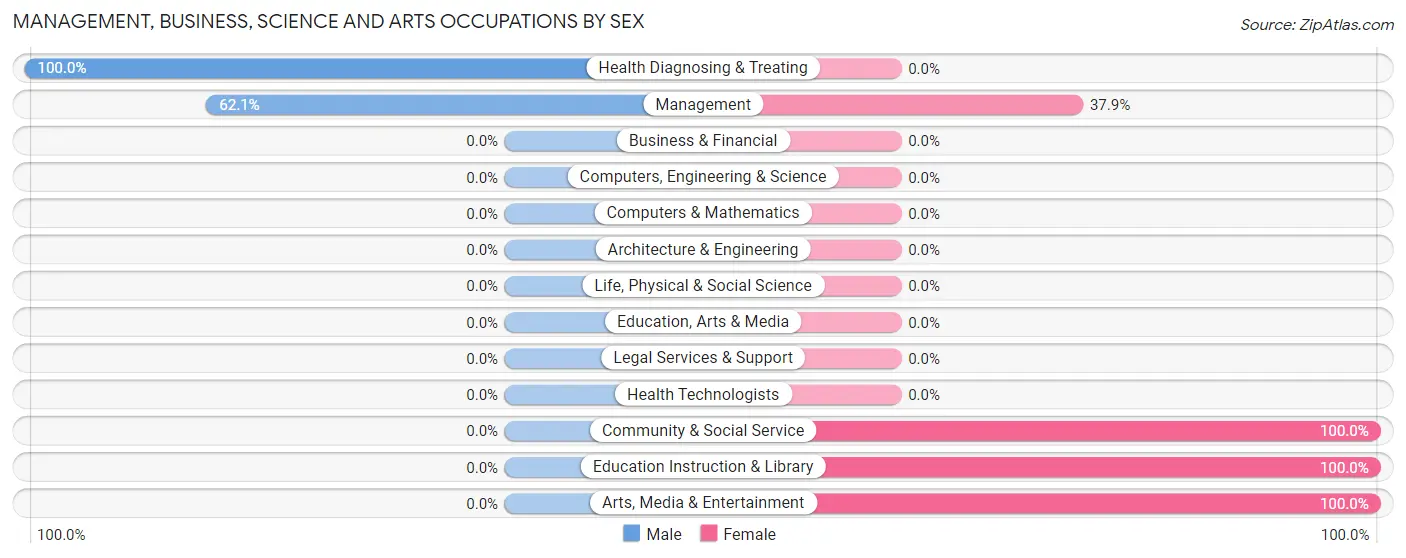
Management, Business, Science and Arts Occupations
The most common Management, Business, Science and Arts occupations in Sand Hill are Management (29 | 24.4%), Community & Social Service (16 | 13.5%), Education Instruction & Library (11 | 9.2%), Arts, Media & Entertainment (5 | 4.2%), and Health Diagnosing & Treating (5 | 4.2%).
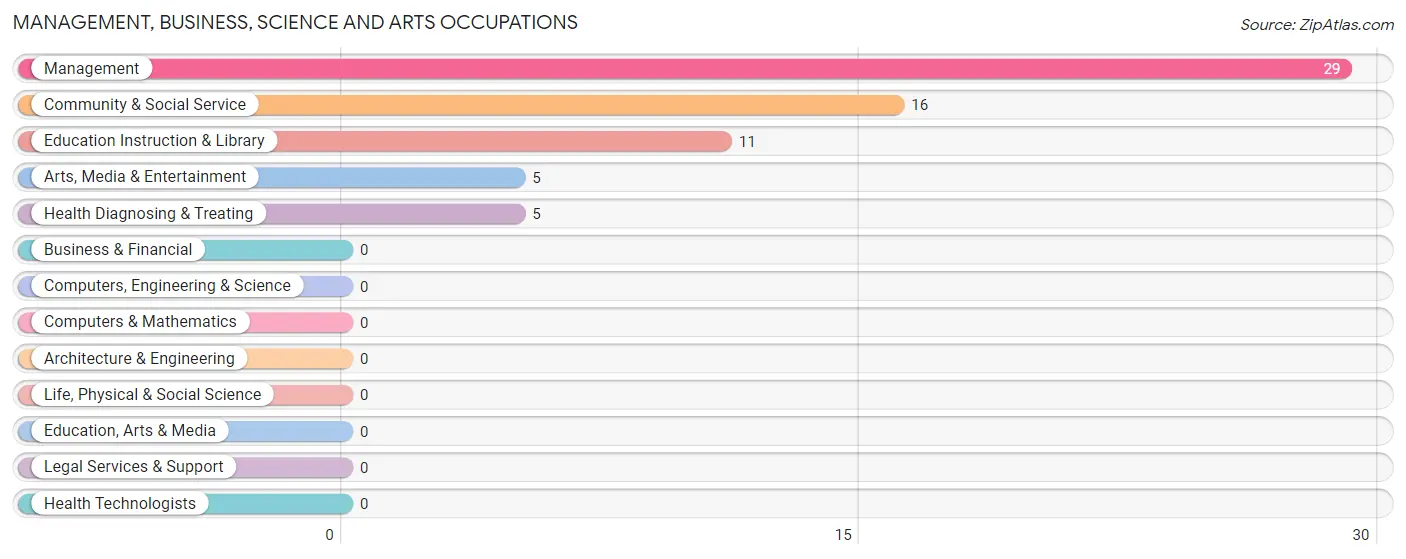
Management, Business, Science and Arts Occupations by Sex
Within the Management, Business, Science and Arts occupations in Sand Hill, the most male-oriented occupations are Health Diagnosing & Treating (100.0%), and Management (62.1%), while the most female-oriented occupations are Community & Social Service (100.0%), Education Instruction & Library (100.0%), and Arts, Media & Entertainment (100.0%).
| Occupation | Male | Female |
| Management | 18 (62.1%) | 11 (37.9%) |
| Business & Financial | 0 (0.0%) | 0 (0.0%) |
| Computers, Engineering & Science | 0 (0.0%) | 0 (0.0%) |
| Computers & Mathematics | 0 (0.0%) | 0 (0.0%) |
| Architecture & Engineering | 0 (0.0%) | 0 (0.0%) |
| Life, Physical & Social Science | 0 (0.0%) | 0 (0.0%) |
| Community & Social Service | 0 (0.0%) | 16 (100.0%) |
| Education, Arts & Media | 0 (0.0%) | 0 (0.0%) |
| Legal Services & Support | 0 (0.0%) | 0 (0.0%) |
| Education Instruction & Library | 0 (0.0%) | 11 (100.0%) |
| Arts, Media & Entertainment | 0 (0.0%) | 5 (100.0%) |
| Health Diagnosing & Treating | 5 (100.0%) | 0 (0.0%) |
| Health Technologists | 0 (0.0%) | 0 (0.0%) |
| Total (Category) | 23 (46.0%) | 27 (54.0%) |
| Total (Overall) | 52 (43.7%) | 67 (56.3%) |
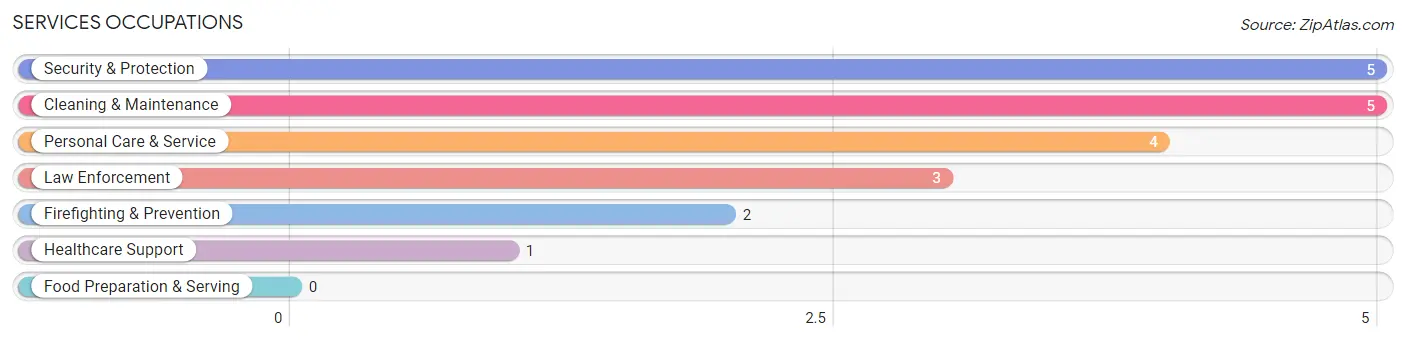
Services Occupations
The most common Services occupations in Sand Hill are Security & Protection (5 | 4.2%), Cleaning & Maintenance (5 | 4.2%), Personal Care & Service (4 | 3.4%), Law Enforcement (3 | 2.5%), and Firefighting & Prevention (2 | 1.7%).
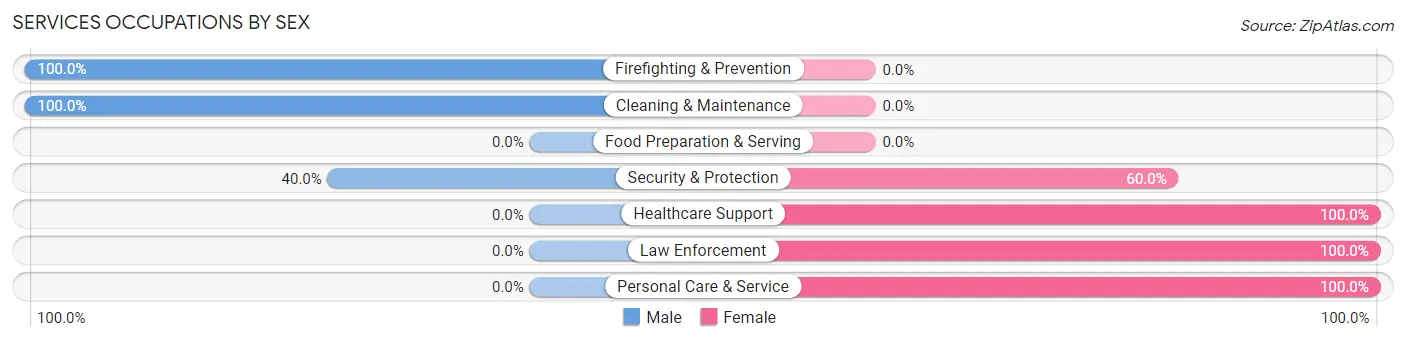
Services Occupations by Sex
Within the Services occupations in Sand Hill, the most male-oriented occupations are Firefighting & Prevention (100.0%), Cleaning & Maintenance (100.0%), and Security & Protection (40.0%), while the most female-oriented occupations are Healthcare Support (100.0%), Law Enforcement (100.0%), and Personal Care & Service (100.0%).
| Occupation | Male | Female |
| Healthcare Support | 0 (0.0%) | 1 (100.0%) |
| Security & Protection | 2 (40.0%) | 3 (60.0%) |
| Firefighting & Prevention | 2 (100.0%) | 0 (0.0%) |
| Law Enforcement | 0 (0.0%) | 3 (100.0%) |
| Food Preparation & Serving | 0 (0.0%) | 0 (0.0%) |
| Cleaning & Maintenance | 5 (100.0%) | 0 (0.0%) |
| Personal Care & Service | 0 (0.0%) | 4 (100.0%) |
| Total (Category) | 7 (46.7%) | 8 (53.3%) |
| Total (Overall) | 52 (43.7%) | 67 (56.3%) |
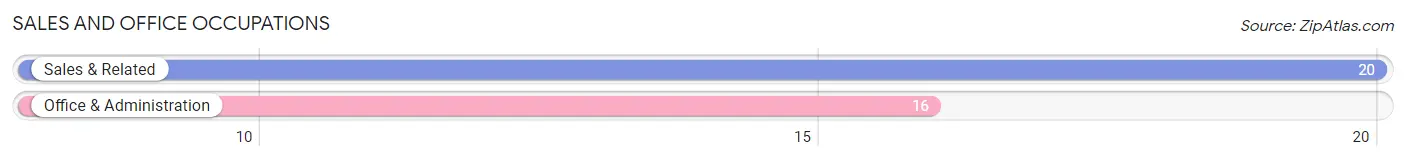
Sales and Office Occupations
The most common Sales and Office occupations in Sand Hill are Sales & Related (20 | 16.8%), and Office & Administration (16 | 13.5%).
Sales and Office Occupations by Sex
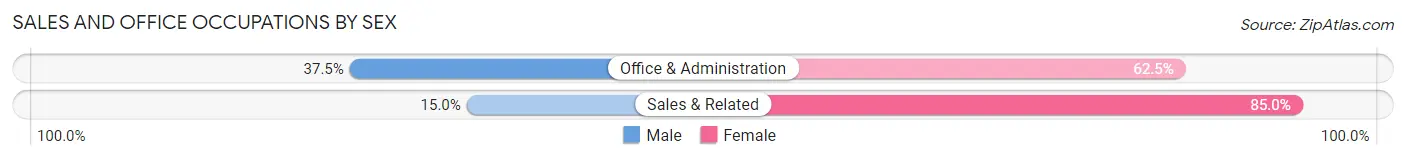
| Occupation | Male | Female |
| Sales & Related | 3 (15.0%) | 17 (85.0%) |
| Office & Administration | 6 (37.5%) | 10 (62.5%) |
| Total (Category) | 9 (25.0%) | 27 (75.0%) |
| Total (Overall) | 52 (43.7%) | 67 (56.3%) |
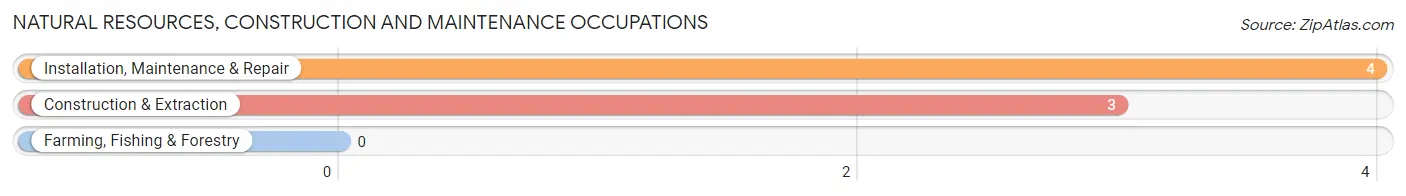
Natural Resources, Construction and Maintenance Occupations
The most common Natural Resources, Construction and Maintenance occupations in Sand Hill are Installation, Maintenance & Repair (4 | 3.4%), and Construction & Extraction (3 | 2.5%).
Natural Resources, Construction and Maintenance Occupations by Sex
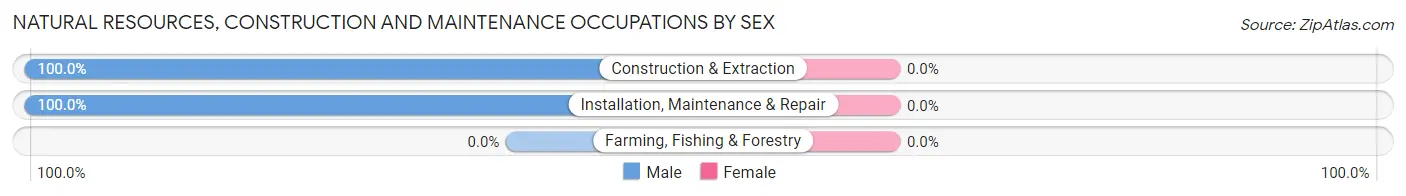
| Occupation | Male | Female |
| Farming, Fishing & Forestry | 0 (0.0%) | 0 (0.0%) |
| Construction & Extraction | 3 (100.0%) | 0 (0.0%) |
| Installation, Maintenance & Repair | 4 (100.0%) | 0 (0.0%) |
| Total (Category) | 7 (100.0%) | 0 (0.0%) |
| Total (Overall) | 52 (43.7%) | 67 (56.3%) |
Production, Transportation and Moving Occupations
The most common Production, Transportation and Moving occupations in Sand Hill are Production (8 | 6.7%), and Material Moving (3 | 2.5%).
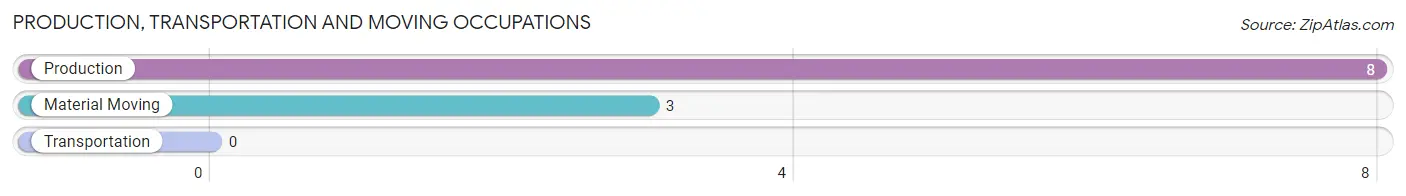
Production, Transportation and Moving Occupations by Sex
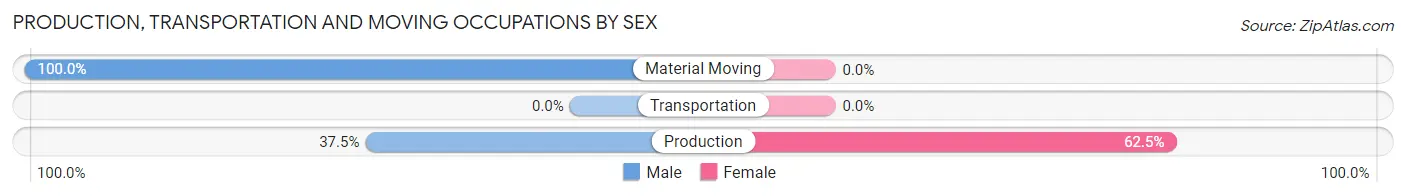
| Occupation | Male | Female |
| Production | 3 (37.5%) | 5 (62.5%) |
| Transportation | 0 (0.0%) | 0 (0.0%) |
| Material Moving | 3 (100.0%) | 0 (0.0%) |
| Total (Category) | 6 (54.5%) | 5 (45.5%) |
| Total (Overall) | 52 (43.7%) | 67 (56.3%) |
Employment Industries by Sex in Sand Hill
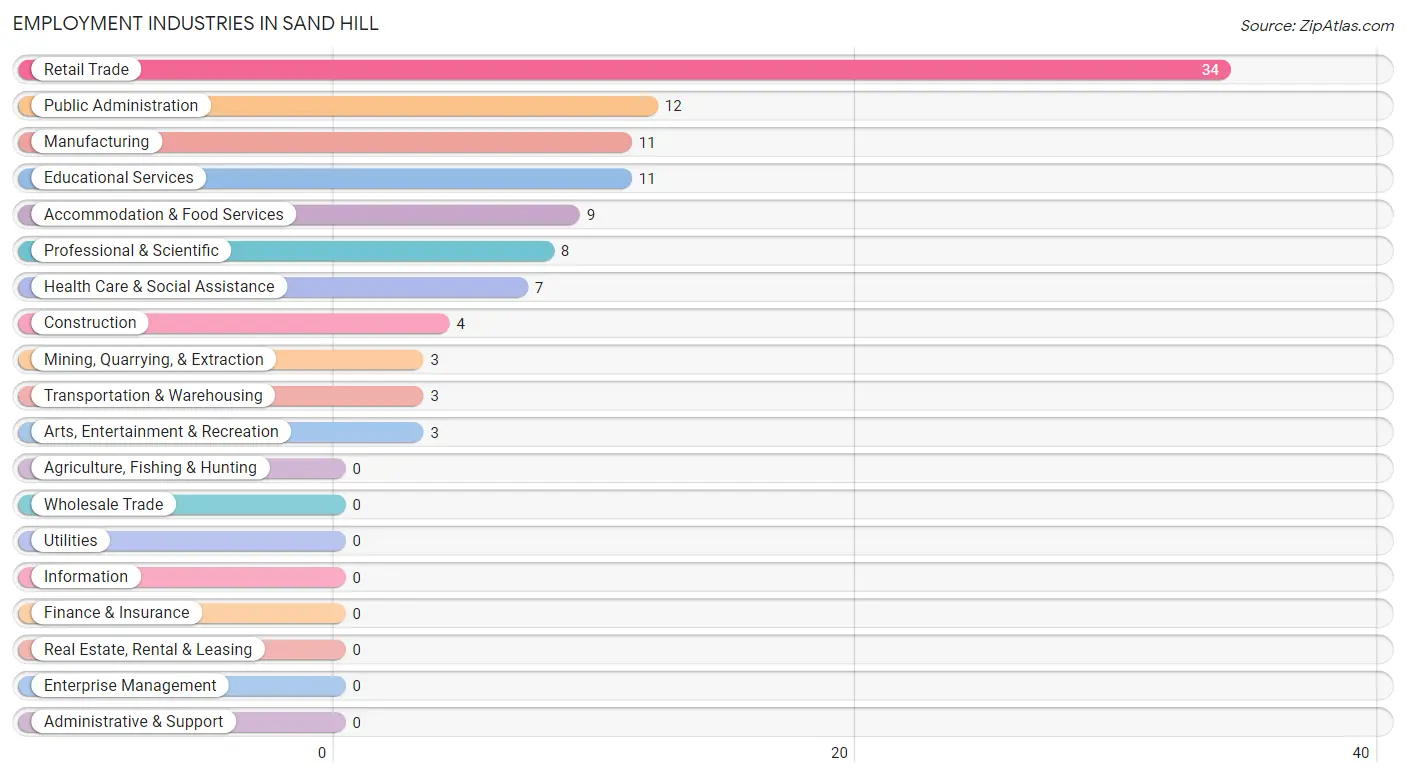
Employment Industries in Sand Hill
The major employment industries in Sand Hill include Retail Trade (34 | 28.6%), Public Administration (12 | 10.1%), Manufacturing (11 | 9.2%), Educational Services (11 | 9.2%), and Accommodation & Food Services (9 | 7.6%).
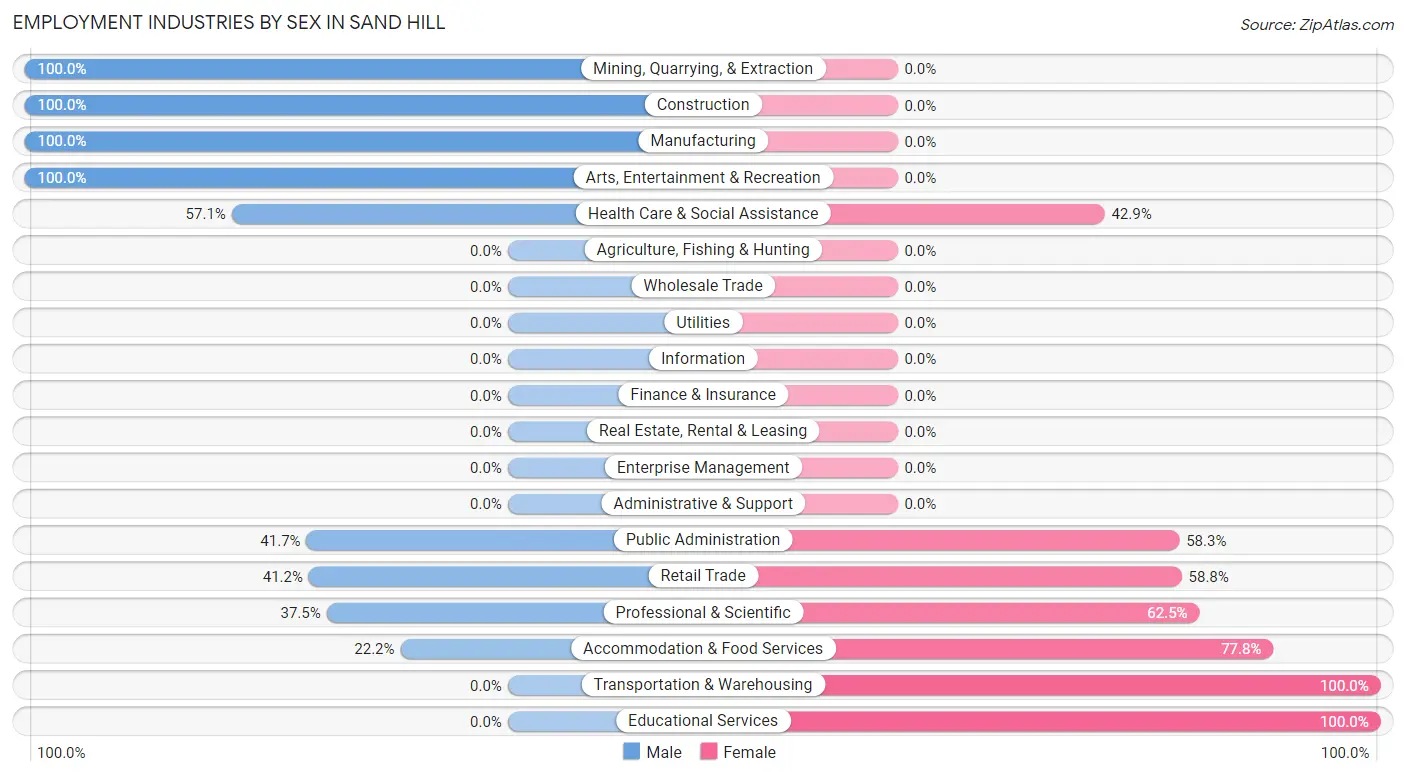
Employment Industries by Sex in Sand Hill
The Sand Hill industries that see more men than women are Mining, Quarrying, & Extraction (100.0%), Construction (100.0%), and Manufacturing (100.0%), whereas the industries that tend to have a higher number of women are Transportation & Warehousing (100.0%), Educational Services (100.0%), and Accommodation & Food Services (77.8%).
| Industry | Male | Female |
| Agriculture, Fishing & Hunting | 0 (0.0%) | 0 (0.0%) |
| Mining, Quarrying, & Extraction | 3 (100.0%) | 0 (0.0%) |
| Construction | 4 (100.0%) | 0 (0.0%) |
| Manufacturing | 11 (100.0%) | 0 (0.0%) |
| Wholesale Trade | 0 (0.0%) | 0 (0.0%) |
| Retail Trade | 14 (41.2%) | 20 (58.8%) |
| Transportation & Warehousing | 0 (0.0%) | 3 (100.0%) |
| Utilities | 0 (0.0%) | 0 (0.0%) |
| Information | 0 (0.0%) | 0 (0.0%) |
| Finance & Insurance | 0 (0.0%) | 0 (0.0%) |
| Real Estate, Rental & Leasing | 0 (0.0%) | 0 (0.0%) |
| Professional & Scientific | 3 (37.5%) | 5 (62.5%) |
| Enterprise Management | 0 (0.0%) | 0 (0.0%) |
| Administrative & Support | 0 (0.0%) | 0 (0.0%) |
| Educational Services | 0 (0.0%) | 11 (100.0%) |
| Health Care & Social Assistance | 4 (57.1%) | 3 (42.9%) |
| Arts, Entertainment & Recreation | 3 (100.0%) | 0 (0.0%) |
| Accommodation & Food Services | 2 (22.2%) | 7 (77.8%) |
| Public Administration | 5 (41.7%) | 7 (58.3%) |
| Total | 52 (43.7%) | 67 (56.3%) |
Education in Sand Hill
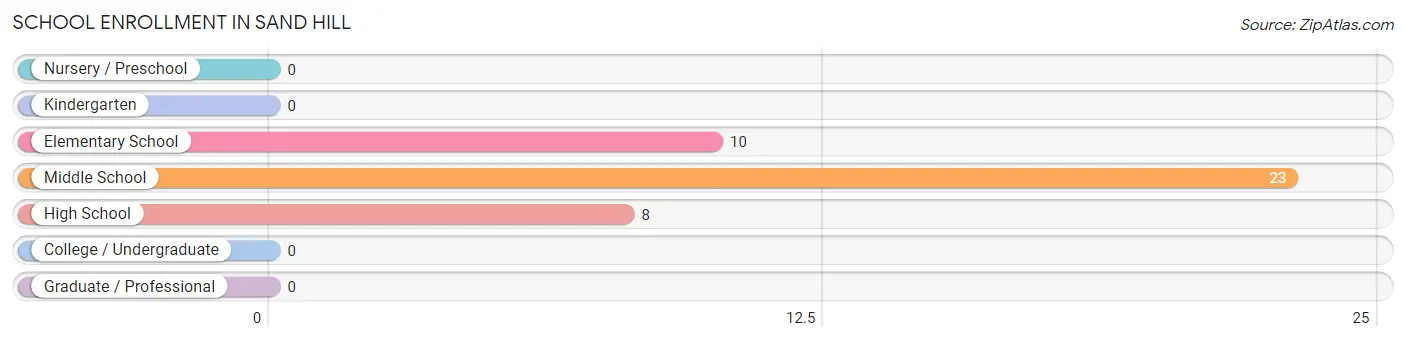
School Enrollment in Sand Hill
The most common levels of schooling among the 41 students in Sand Hill are middle school (23 | 56.1%), elementary school (10 | 24.4%), and high school (8 | 19.5%).
| School Level | # Students | % Students |
| Nursery / Preschool | 0 | 0.0% |
| Kindergarten | 0 | 0.0% |
| Elementary School | 10 | 24.4% |
| Middle School | 23 | 56.1% |
| High School | 8 | 19.5% |
| College / Undergraduate | 0 | 0.0% |
| Graduate / Professional | 0 | 0.0% |
| Total | 41 | 100.0% |
School Enrollment by Age by Funding Source in Sand Hill
Out of a total of 41 students who are enrolled in schools in Sand Hill, 7 (17.1%) attend a private institution, while the remaining 34 (82.9%) are enrolled in public schools. The age group of 15 to 17 year olds has the highest likelihood of being enrolled in private schools, with 7 (87.5% in the age bracket) enrolled. Conversely, the age group of 10 to 14 year olds has the lowest likelihood of being enrolled in a private school, with 33 (100.0% in the age bracket) attending a public institution.
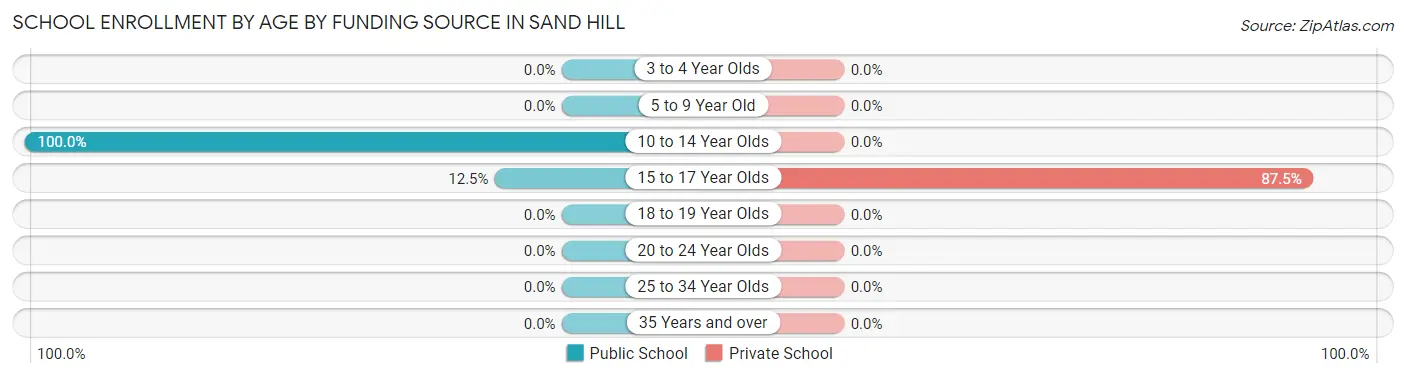
| Age Bracket | Public School | Private School |
| 3 to 4 Year Olds | 0 (0.0%) | 0 (0.0%) |
| 5 to 9 Year Old | 0 (0.0%) | 0 (0.0%) |
| 10 to 14 Year Olds | 33 (100.0%) | 0 (0.0%) |
| 15 to 17 Year Olds | 1 (12.5%) | 7 (87.5%) |
| 18 to 19 Year Olds | 0 (0.0%) | 0 (0.0%) |
| 20 to 24 Year Olds | 0 (0.0%) | 0 (0.0%) |
| 25 to 34 Year Olds | 0 (0.0%) | 0 (0.0%) |
| 35 Years and over | 0 (0.0%) | 0 (0.0%) |
| Total | 34 (82.9%) | 7 (17.1%) |
Educational Attainment by Field of Study in Sand Hill
Education (7 | 33.3%), psychology (3 | 14.3%), science & technology (3 | 14.3%), visual & performing arts (3 | 14.3%), and communications (3 | 14.3%) are the most common fields of study among 21 individuals in Sand Hill who have obtained a bachelor's degree or higher.
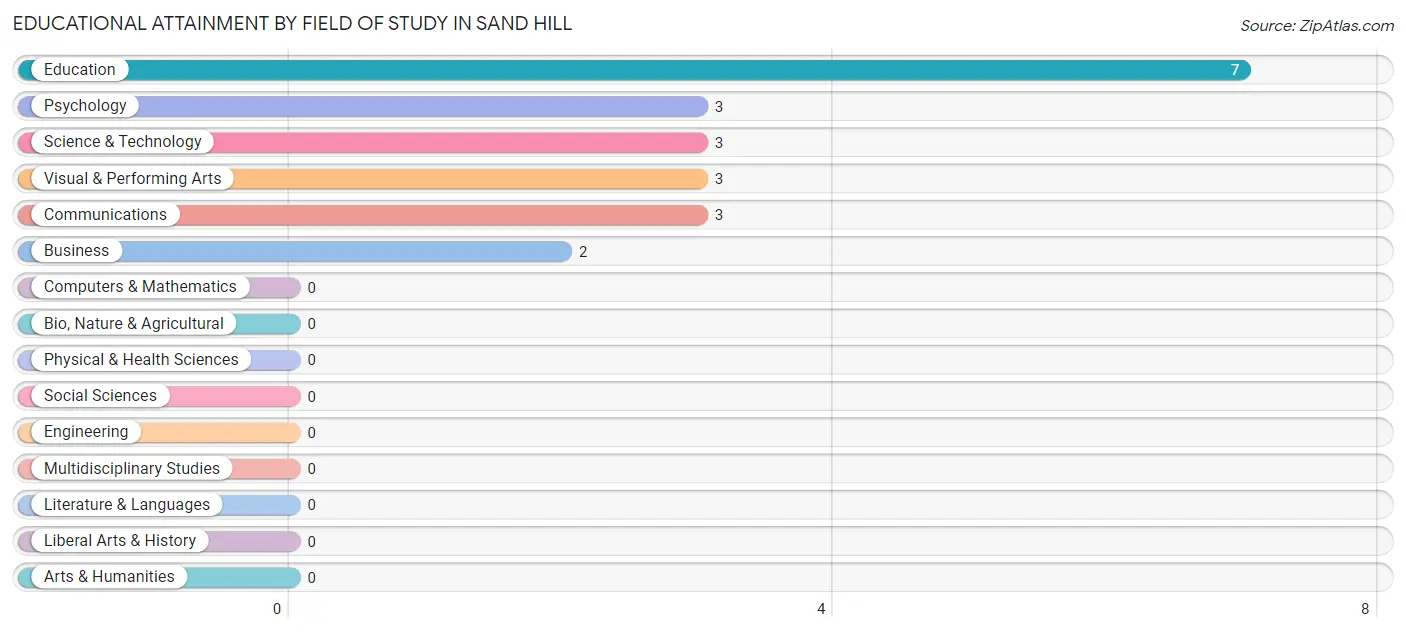
| Field of Study | # Graduates | % Graduates |
| Computers & Mathematics | 0 | 0.0% |
| Bio, Nature & Agricultural | 0 | 0.0% |
| Physical & Health Sciences | 0 | 0.0% |
| Psychology | 3 | 14.3% |
| Social Sciences | 0 | 0.0% |
| Engineering | 0 | 0.0% |
| Multidisciplinary Studies | 0 | 0.0% |
| Science & Technology | 3 | 14.3% |
| Business | 2 | 9.5% |
| Education | 7 | 33.3% |
| Literature & Languages | 0 | 0.0% |
| Liberal Arts & History | 0 | 0.0% |
| Visual & Performing Arts | 3 | 14.3% |
| Communications | 3 | 14.3% |
| Arts & Humanities | 0 | 0.0% |
| Total | 21 | 100.0% |
Transportation & Commute in Sand Hill
Vehicle Availability by Sex in Sand Hill
The most prevalent vehicle ownership categories in Sand Hill are males with 2 vehicles (34, accounting for 65.4%) and females with 2 vehicles (31, making up 50.7%).
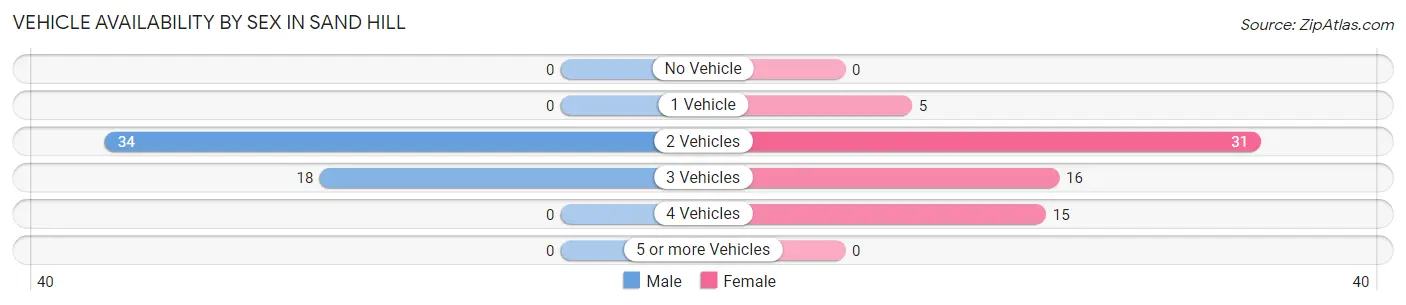
| Vehicles Available | Male | Female |
| No Vehicle | 0 (0.0%) | 0 (0.0%) |
| 1 Vehicle | 0 (0.0%) | 5 (7.5%) |
| 2 Vehicles | 34 (65.4%) | 31 (46.3%) |
| 3 Vehicles | 18 (34.6%) | 16 (23.9%) |
| 4 Vehicles | 0 (0.0%) | 15 (22.4%) |
| 5 or more Vehicles | 0 (0.0%) | 0 (0.0%) |
| Total | 52 (100.0%) | 67 (100.0%) |
Commute Time in Sand Hill
The most frequently occuring commute durations in Sand Hill are 25 to 29 minutes (24 commuters, 23.3%), 10 to 14 minutes (15 commuters, 14.6%), and less than 5 minutes (14 commuters, 13.6%).
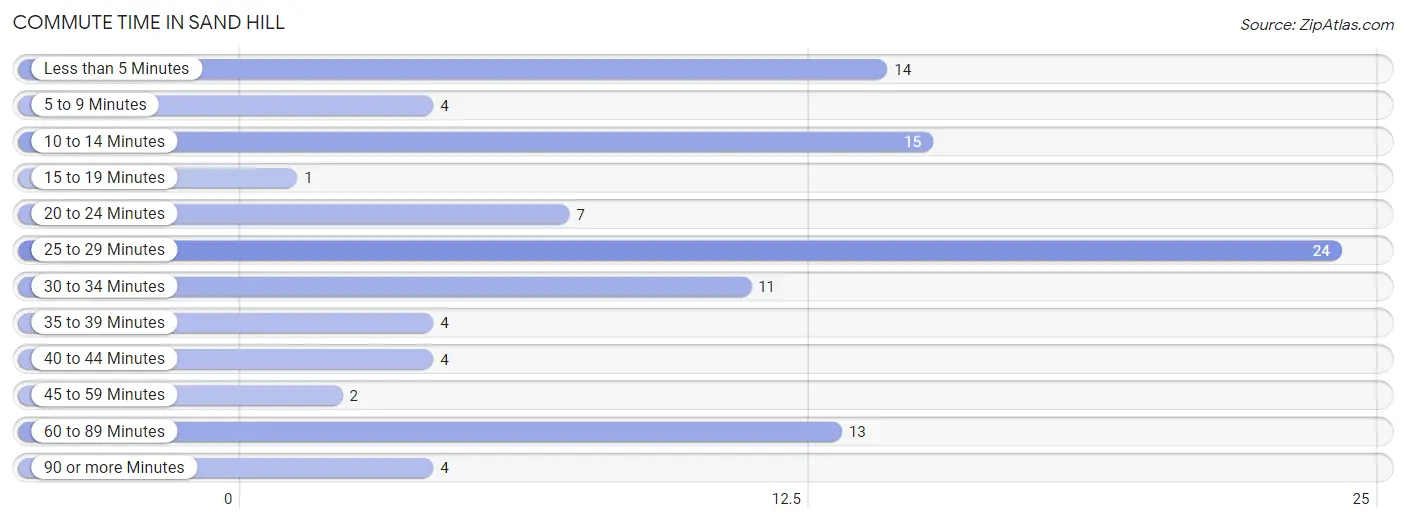
| Commute Time | # Commuters | % Commuters |
| Less than 5 Minutes | 14 | 13.6% |
| 5 to 9 Minutes | 4 | 3.9% |
| 10 to 14 Minutes | 15 | 14.6% |
| 15 to 19 Minutes | 1 | 1.0% |
| 20 to 24 Minutes | 7 | 6.8% |
| 25 to 29 Minutes | 24 | 23.3% |
| 30 to 34 Minutes | 11 | 10.7% |
| 35 to 39 Minutes | 4 | 3.9% |
| 40 to 44 Minutes | 4 | 3.9% |
| 45 to 59 Minutes | 2 | 1.9% |
| 60 to 89 Minutes | 13 | 12.6% |
| 90 or more Minutes | 4 | 3.9% |
Commute Time by Sex in Sand Hill
The most common commute times in Sand Hill are 25 to 29 minutes (14 commuters, 31.8%) for males and less than 5 minutes (12 commuters, 20.3%) for females.
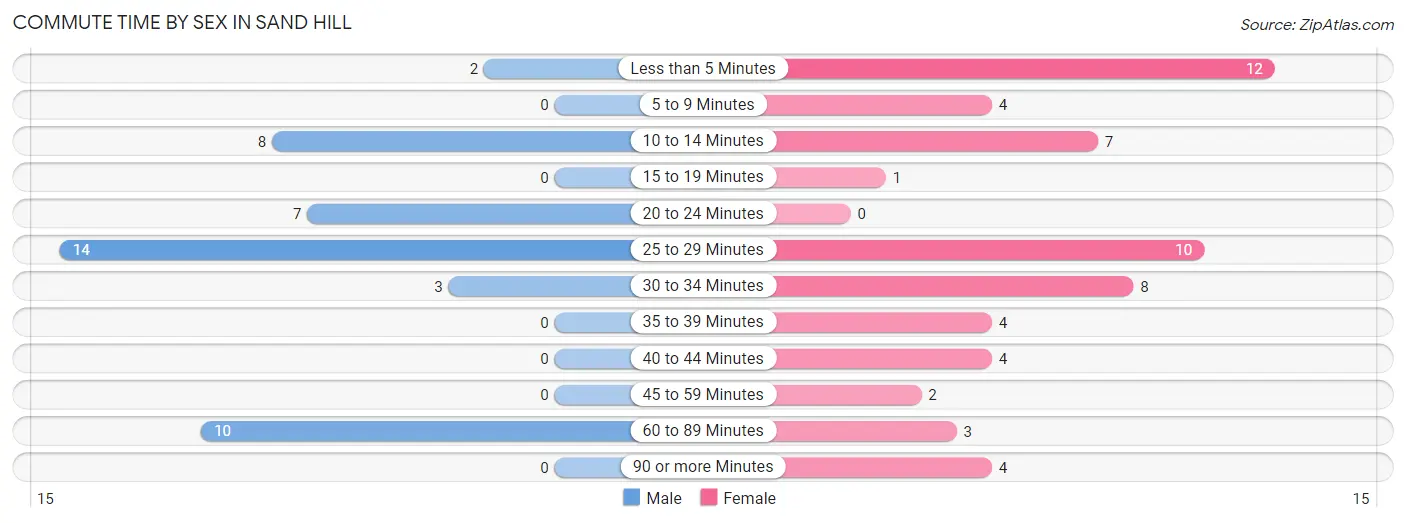
| Commute Time | Male | Female |
| Less than 5 Minutes | 2 (4.5%) | 12 (20.3%) |
| 5 to 9 Minutes | 0 (0.0%) | 4 (6.8%) |
| 10 to 14 Minutes | 8 (18.2%) | 7 (11.9%) |
| 15 to 19 Minutes | 0 (0.0%) | 1 (1.7%) |
| 20 to 24 Minutes | 7 (15.9%) | 0 (0.0%) |
| 25 to 29 Minutes | 14 (31.8%) | 10 (17.0%) |
| 30 to 34 Minutes | 3 (6.8%) | 8 (13.6%) |
| 35 to 39 Minutes | 0 (0.0%) | 4 (6.8%) |
| 40 to 44 Minutes | 0 (0.0%) | 4 (6.8%) |
| 45 to 59 Minutes | 0 (0.0%) | 2 (3.4%) |
| 60 to 89 Minutes | 10 (22.7%) | 3 (5.1%) |
| 90 or more Minutes | 0 (0.0%) | 4 (6.8%) |
Time of Departure to Work by Sex in Sand Hill
The most frequent times of departure to work in Sand Hill are 7:00 AM to 7:29 AM (14, 31.8%) for males and 8:30 AM to 8:59 AM (19, 32.2%) for females.
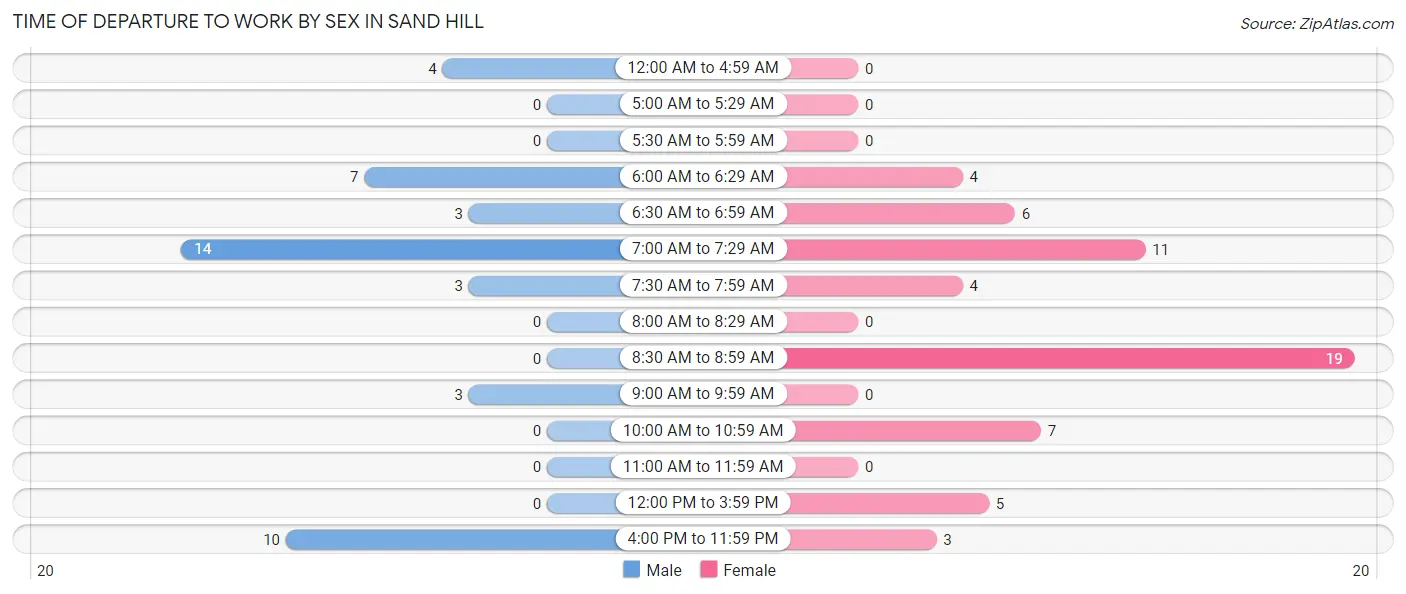
| Time of Departure | Male | Female |
| 12:00 AM to 4:59 AM | 4 (9.1%) | 0 (0.0%) |
| 5:00 AM to 5:29 AM | 0 (0.0%) | 0 (0.0%) |
| 5:30 AM to 5:59 AM | 0 (0.0%) | 0 (0.0%) |
| 6:00 AM to 6:29 AM | 7 (15.9%) | 4 (6.8%) |
| 6:30 AM to 6:59 AM | 3 (6.8%) | 6 (10.2%) |
| 7:00 AM to 7:29 AM | 14 (31.8%) | 11 (18.6%) |
| 7:30 AM to 7:59 AM | 3 (6.8%) | 4 (6.8%) |
| 8:00 AM to 8:29 AM | 0 (0.0%) | 0 (0.0%) |
| 8:30 AM to 8:59 AM | 0 (0.0%) | 19 (32.2%) |
| 9:00 AM to 9:59 AM | 3 (6.8%) | 0 (0.0%) |
| 10:00 AM to 10:59 AM | 0 (0.0%) | 7 (11.9%) |
| 11:00 AM to 11:59 AM | 0 (0.0%) | 0 (0.0%) |
| 12:00 PM to 3:59 PM | 0 (0.0%) | 5 (8.5%) |
| 4:00 PM to 11:59 PM | 10 (22.7%) | 3 (5.1%) |
| Total | 44 (100.0%) | 59 (100.0%) |
Housing Occupancy in Sand Hill
Occupancy by Ownership in Sand Hill
Of the total 142 dwellings in Sand Hill, owner-occupied units account for 114 (80.3%), while renter-occupied units make up 28 (19.7%).
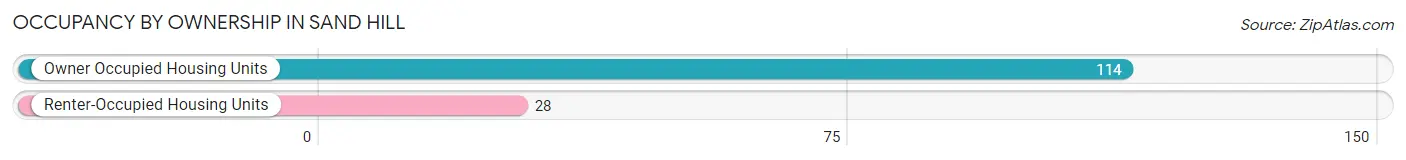
| Occupancy | # Housing Units | % Housing Units |
| Owner Occupied Housing Units | 114 | 80.3% |
| Renter-Occupied Housing Units | 28 | 19.7% |
| Total Occupied Housing Units | 142 | 100.0% |
Occupancy by Household Size in Sand Hill
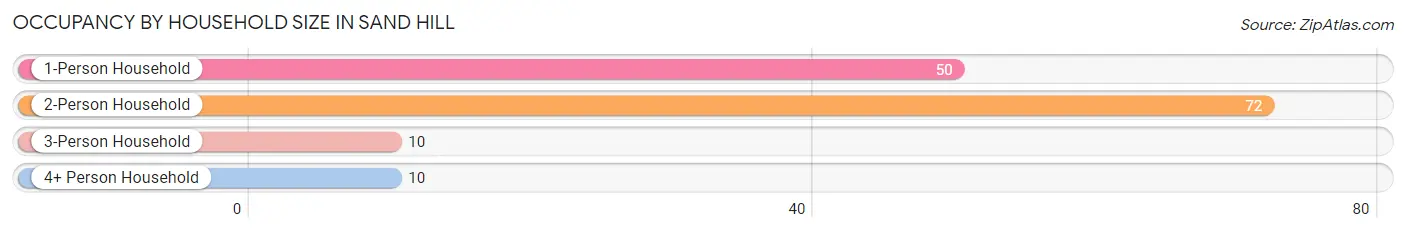
| Household Size | # Housing Units | % Housing Units |
| 1-Person Household | 50 | 35.2% |
| 2-Person Household | 72 | 50.7% |
| 3-Person Household | 10 | 7.0% |
| 4+ Person Household | 10 | 7.0% |
| Total Housing Units | 142 | 100.0% |
Occupancy by Ownership by Household Size in Sand Hill
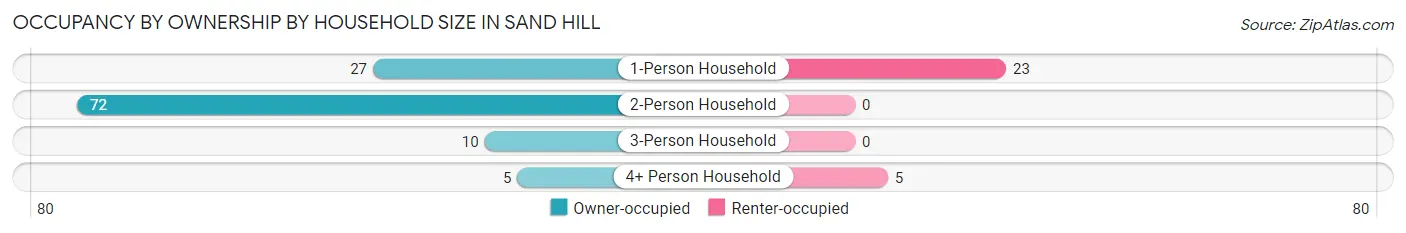
| Household Size | Owner-occupied | Renter-occupied |
| 1-Person Household | 27 (54.0%) | 23 (46.0%) |
| 2-Person Household | 72 (100.0%) | 0 (0.0%) |
| 3-Person Household | 10 (100.0%) | 0 (0.0%) |
| 4+ Person Household | 5 (50.0%) | 5 (50.0%) |
| Total Housing Units | 114 (80.3%) | 28 (19.7%) |
Occupancy by Educational Attainment in Sand Hill
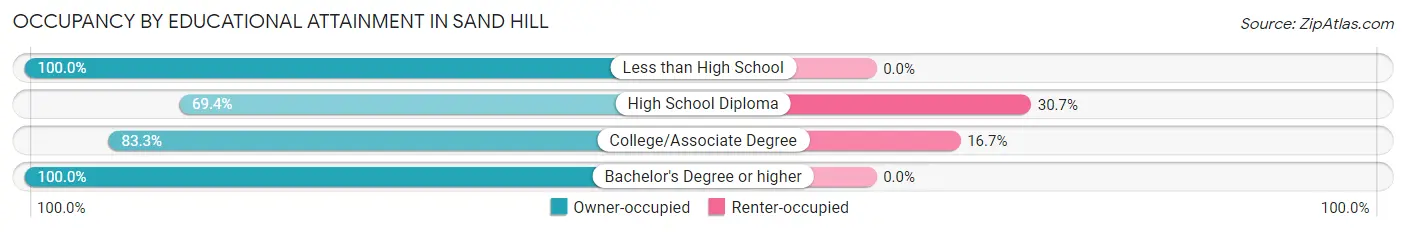
| Household Size | Owner-occupied | Renter-occupied |
| Less than High School | 14 (100.0%) | 0 (0.0%) |
| High School Diploma | 43 (69.4%) | 19 (30.6%) |
| College/Associate Degree | 45 (83.3%) | 9 (16.7%) |
| Bachelor's Degree or higher | 12 (100.0%) | 0 (0.0%) |
Occupancy by Age of Householder in Sand Hill
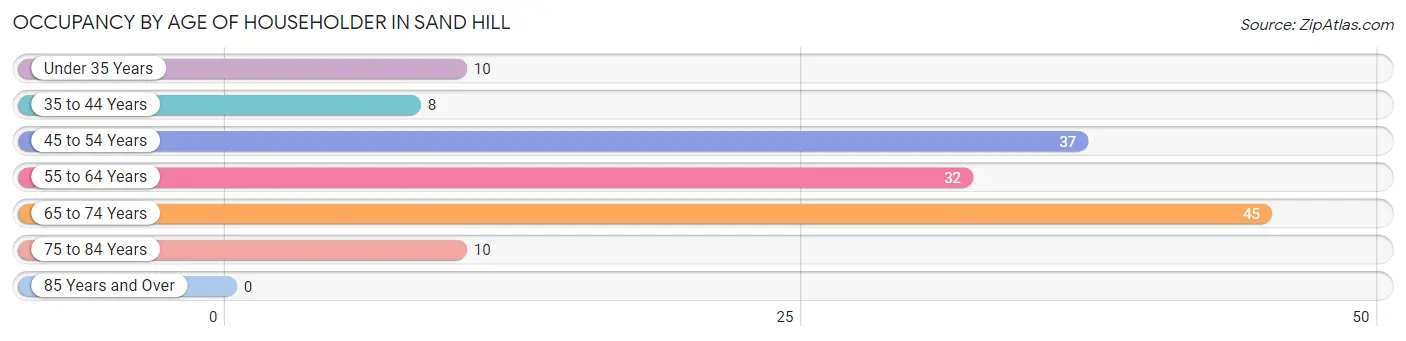
| Age Bracket | # Households | % Households |
| Under 35 Years | 10 | 7.0% |
| 35 to 44 Years | 8 | 5.6% |
| 45 to 54 Years | 37 | 26.1% |
| 55 to 64 Years | 32 | 22.5% |
| 65 to 74 Years | 45 | 31.7% |
| 75 to 84 Years | 10 | 7.0% |
| 85 Years and Over | 0 | 0.0% |
| Total | 142 | 100.0% |
Housing Finances in Sand Hill
Median Income by Occupancy in Sand Hill
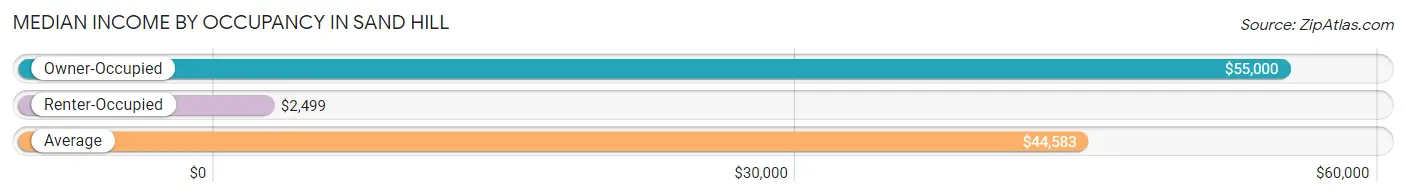
| Occupancy Type | # Households | Median Income |
| Owner-Occupied | 114 (80.3%) | $55,000 |
| Renter-Occupied | 28 (19.7%) | $2,499 |
| Average | 142 (100.0%) | $44,583 |
Occupancy by Householder Income Bracket in Sand Hill
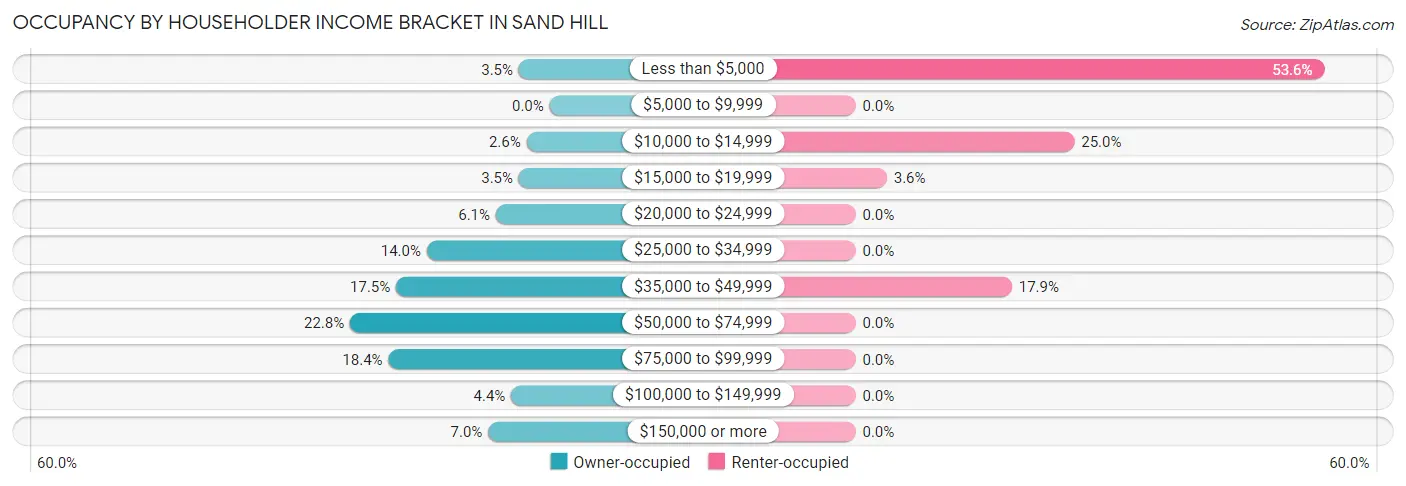
| Income Bracket | Owner-occupied | Renter-occupied |
| Less than $5,000 | 4 (3.5%) | 15 (53.6%) |
| $5,000 to $9,999 | 0 (0.0%) | 0 (0.0%) |
| $10,000 to $14,999 | 3 (2.6%) | 7 (25.0%) |
| $15,000 to $19,999 | 4 (3.5%) | 1 (3.6%) |
| $20,000 to $24,999 | 7 (6.1%) | 0 (0.0%) |
| $25,000 to $34,999 | 16 (14.0%) | 0 (0.0%) |
| $35,000 to $49,999 | 20 (17.5%) | 5 (17.9%) |
| $50,000 to $74,999 | 26 (22.8%) | 0 (0.0%) |
| $75,000 to $99,999 | 21 (18.4%) | 0 (0.0%) |
| $100,000 to $149,999 | 5 (4.4%) | 0 (0.0%) |
| $150,000 or more | 8 (7.0%) | 0 (0.0%) |
| Total | 114 (100.0%) | 28 (100.0%) |
Monthly Housing Cost Tiers in Sand Hill
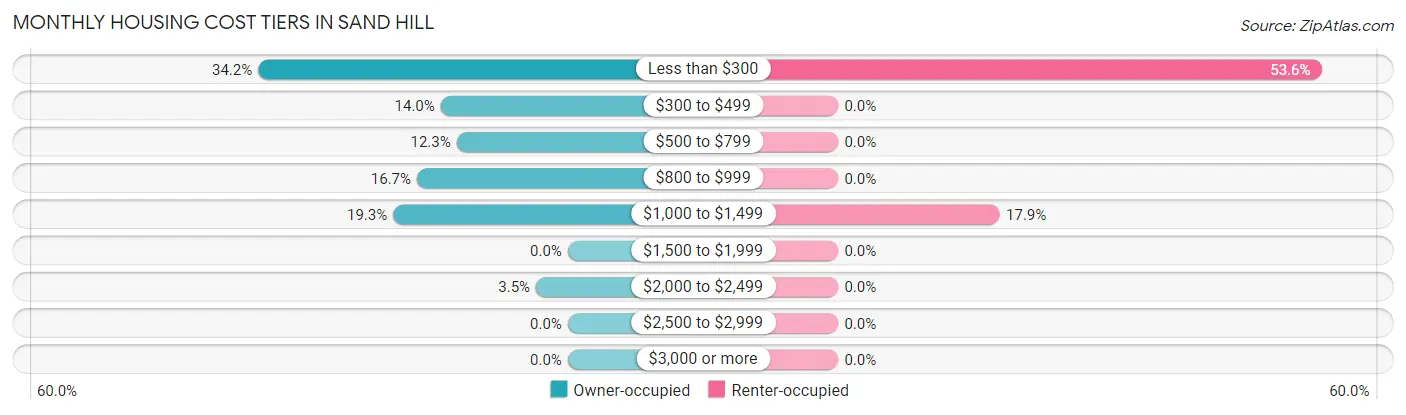
| Monthly Cost | Owner-occupied | Renter-occupied |
| Less than $300 | 39 (34.2%) | 15 (53.6%) |
| $300 to $499 | 16 (14.0%) | 0 (0.0%) |
| $500 to $799 | 14 (12.3%) | 0 (0.0%) |
| $800 to $999 | 19 (16.7%) | 0 (0.0%) |
| $1,000 to $1,499 | 22 (19.3%) | 5 (17.9%) |
| $1,500 to $1,999 | 0 (0.0%) | 0 (0.0%) |
| $2,000 to $2,499 | 4 (3.5%) | 0 (0.0%) |
| $2,500 to $2,999 | 0 (0.0%) | 0 (0.0%) |
| $3,000 or more | 0 (0.0%) | 0 (0.0%) |
| Total | 114 (100.0%) | 28 (100.0%) |
Physical Housing Characteristics in Sand Hill
Housing Structures in Sand Hill
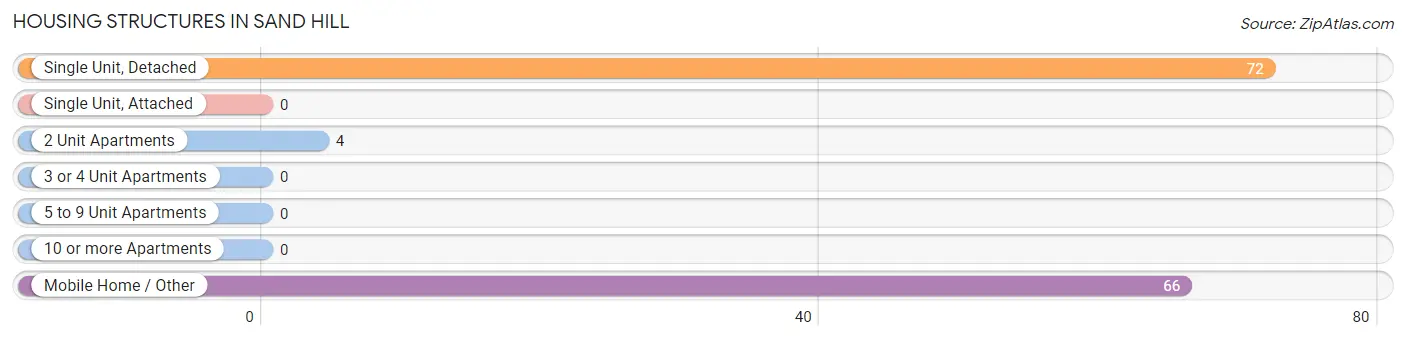
| Structure Type | # Housing Units | % Housing Units |
| Single Unit, Detached | 72 | 50.7% |
| Single Unit, Attached | 0 | 0.0% |
| 2 Unit Apartments | 4 | 2.8% |
| 3 or 4 Unit Apartments | 0 | 0.0% |
| 5 to 9 Unit Apartments | 0 | 0.0% |
| 10 or more Apartments | 0 | 0.0% |
| Mobile Home / Other | 66 | 46.5% |
| Total | 142 | 100.0% |
Housing Structures by Occupancy in Sand Hill
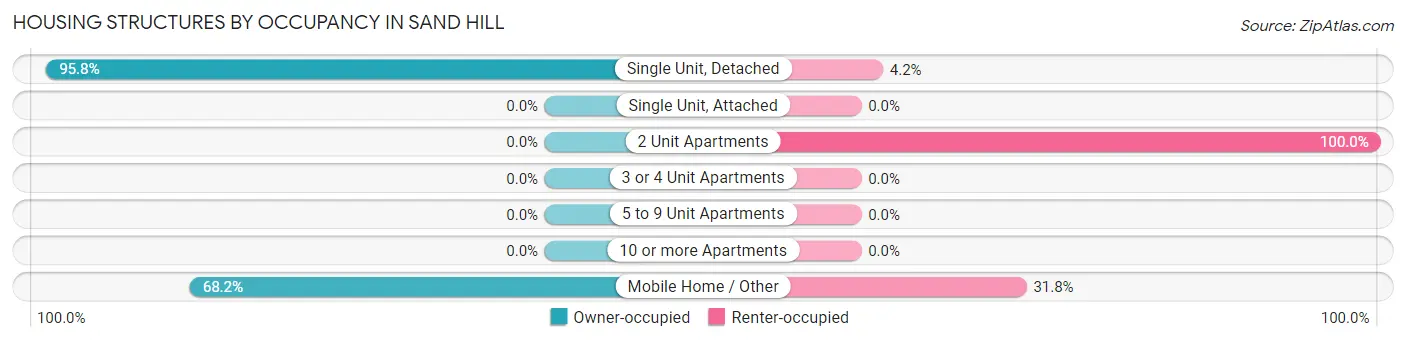
| Structure Type | Owner-occupied | Renter-occupied |
| Single Unit, Detached | 69 (95.8%) | 3 (4.2%) |
| Single Unit, Attached | 0 (0.0%) | 0 (0.0%) |
| 2 Unit Apartments | 0 (0.0%) | 4 (100.0%) |
| 3 or 4 Unit Apartments | 0 (0.0%) | 0 (0.0%) |
| 5 to 9 Unit Apartments | 0 (0.0%) | 0 (0.0%) |
| 10 or more Apartments | 0 (0.0%) | 0 (0.0%) |
| Mobile Home / Other | 45 (68.2%) | 21 (31.8%) |
| Total | 114 (80.3%) | 28 (19.7%) |
Housing Structures by Number of Rooms in Sand Hill
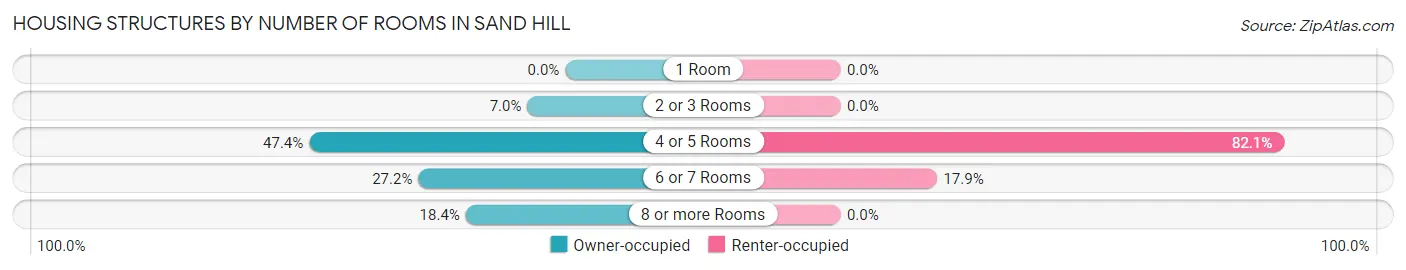
| Number of Rooms | Owner-occupied | Renter-occupied |
| 1 Room | 0 (0.0%) | 0 (0.0%) |
| 2 or 3 Rooms | 8 (7.0%) | 0 (0.0%) |
| 4 or 5 Rooms | 54 (47.4%) | 23 (82.1%) |
| 6 or 7 Rooms | 31 (27.2%) | 5 (17.9%) |
| 8 or more Rooms | 21 (18.4%) | 0 (0.0%) |
| Total | 114 (100.0%) | 28 (100.0%) |
Housing Structure by Heating Type in Sand Hill
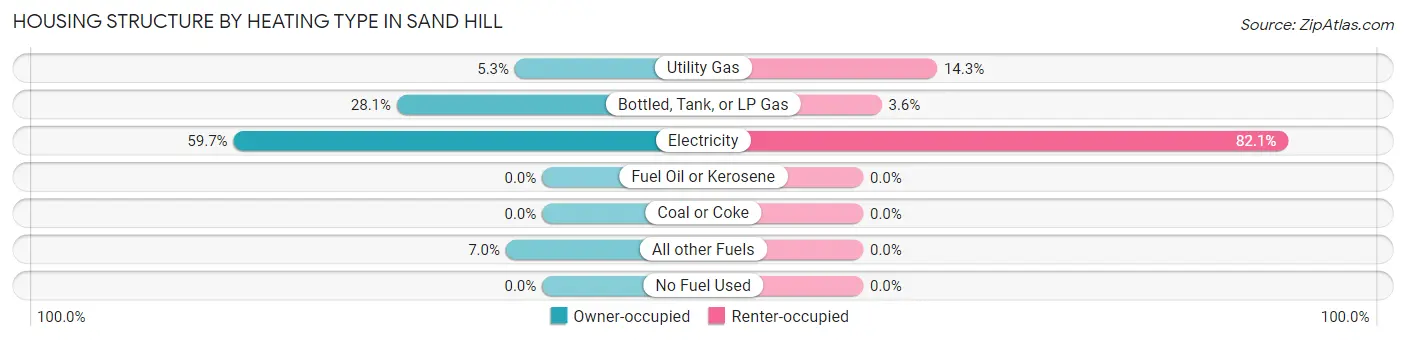
| Heating Type | Owner-occupied | Renter-occupied |
| Utility Gas | 6 (5.3%) | 4 (14.3%) |
| Bottled, Tank, or LP Gas | 32 (28.1%) | 1 (3.6%) |
| Electricity | 68 (59.7%) | 23 (82.1%) |
| Fuel Oil or Kerosene | 0 (0.0%) | 0 (0.0%) |
| Coal or Coke | 0 (0.0%) | 0 (0.0%) |
| All other Fuels | 8 (7.0%) | 0 (0.0%) |
| No Fuel Used | 0 (0.0%) | 0 (0.0%) |
| Total | 114 (100.0%) | 28 (100.0%) |
Household Vehicle Usage in Sand Hill
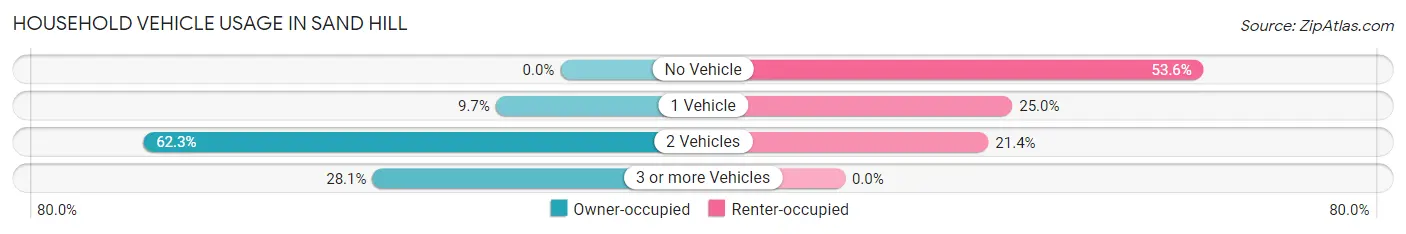
| Vehicles per Household | Owner-occupied | Renter-occupied |
| No Vehicle | 0 (0.0%) | 15 (53.6%) |
| 1 Vehicle | 11 (9.7%) | 7 (25.0%) |
| 2 Vehicles | 71 (62.3%) | 6 (21.4%) |
| 3 or more Vehicles | 32 (28.1%) | 0 (0.0%) |
| Total | 114 (100.0%) | 28 (100.0%) |
Real Estate & Mortgages in Sand Hill
Real Estate and Mortgage Overview in Sand Hill
| Characteristic | Without Mortgage | With Mortgage |
| Housing Units | 54 | 60 |
| Median Property Value | $83,800 | $106,300 |
| Median Household Income | $44,643 | $8 |
| Monthly Housing Costs | $250 | $0 |
| Real Estate Taxes | - | - |
Property Value by Mortgage Status in Sand Hill
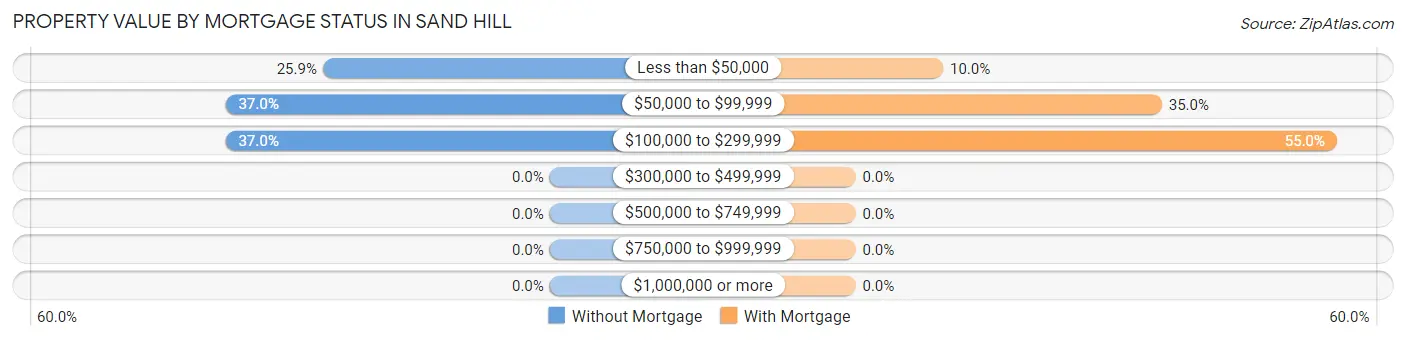
| Property Value | Without Mortgage | With Mortgage |
| Less than $50,000 | 14 (25.9%) | 6 (10.0%) |
| $50,000 to $99,999 | 20 (37.0%) | 21 (35.0%) |
| $100,000 to $299,999 | 20 (37.0%) | 33 (55.0%) |
| $300,000 to $499,999 | 0 (0.0%) | 0 (0.0%) |
| $500,000 to $749,999 | 0 (0.0%) | 0 (0.0%) |
| $750,000 to $999,999 | 0 (0.0%) | 0 (0.0%) |
| $1,000,000 or more | 0 (0.0%) | 0 (0.0%) |
| Total | 54 (100.0%) | 60 (100.0%) |
Household Income by Mortgage Status in Sand Hill
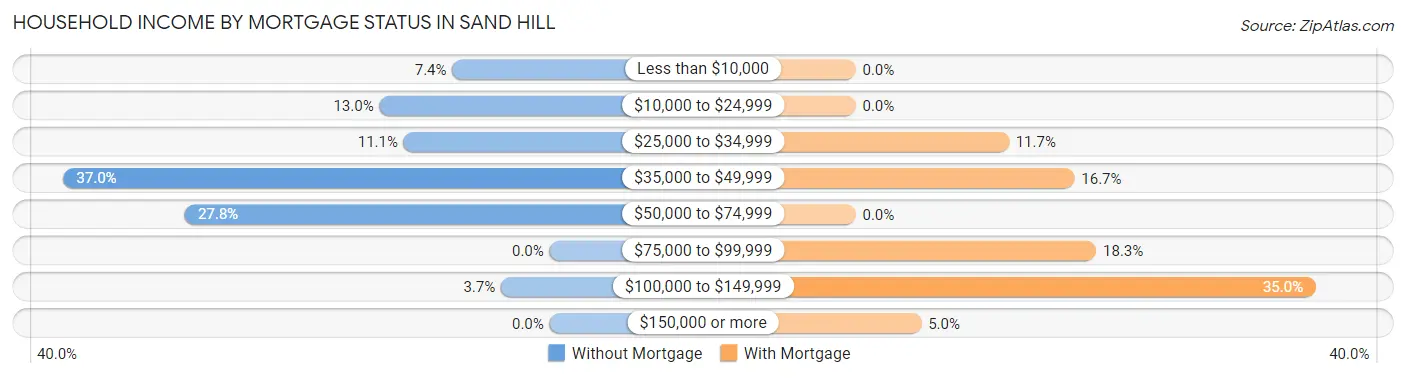
| Household Income | Without Mortgage | With Mortgage |
| Less than $10,000 | 4 (7.4%) | 0 (0.0%) |
| $10,000 to $24,999 | 7 (13.0%) | 0 (0.0%) |
| $25,000 to $34,999 | 6 (11.1%) | 7 (11.7%) |
| $35,000 to $49,999 | 20 (37.0%) | 10 (16.7%) |
| $50,000 to $74,999 | 15 (27.8%) | 0 (0.0%) |
| $75,000 to $99,999 | 0 (0.0%) | 11 (18.3%) |
| $100,000 to $149,999 | 2 (3.7%) | 21 (35.0%) |
| $150,000 or more | 0 (0.0%) | 3 (5.0%) |
| Total | 54 (100.0%) | 60 (100.0%) |
Property Value to Household Income Ratio in Sand Hill
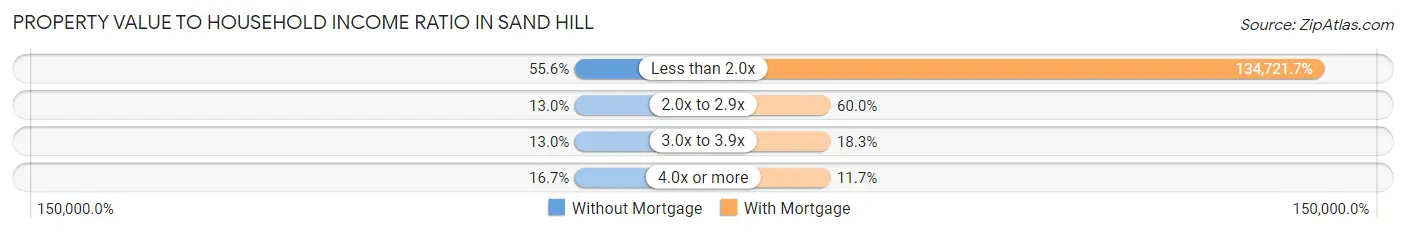
| Value-to-Income Ratio | Without Mortgage | With Mortgage |
| Less than 2.0x | 30 (55.6%) | 80,833 (134,721.7%) |
| 2.0x to 2.9x | 7 (13.0%) | 36 (60.0%) |
| 3.0x to 3.9x | 7 (13.0%) | 11 (18.3%) |
| 4.0x or more | 9 (16.7%) | 7 (11.7%) |
| Total | 54 (100.0%) | 60 (100.0%) |
Real Estate Taxes by Mortgage Status in Sand Hill
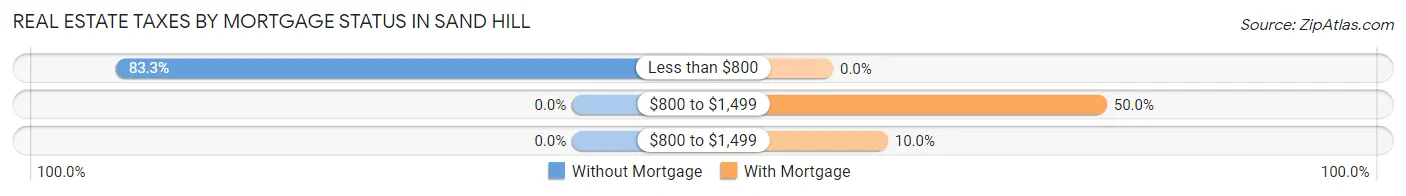
| Property Taxes | Without Mortgage | With Mortgage |
| Less than $800 | 45 (83.3%) | 0 (0.0%) |
| $800 to $1,499 | 0 (0.0%) | 30 (50.0%) |
| $800 to $1,499 | 0 (0.0%) | 6 (10.0%) |
| Total | 54 (100.0%) | 60 (100.0%) |
Health & Disability in Sand Hill
Health Insurance Coverage by Age in Sand Hill
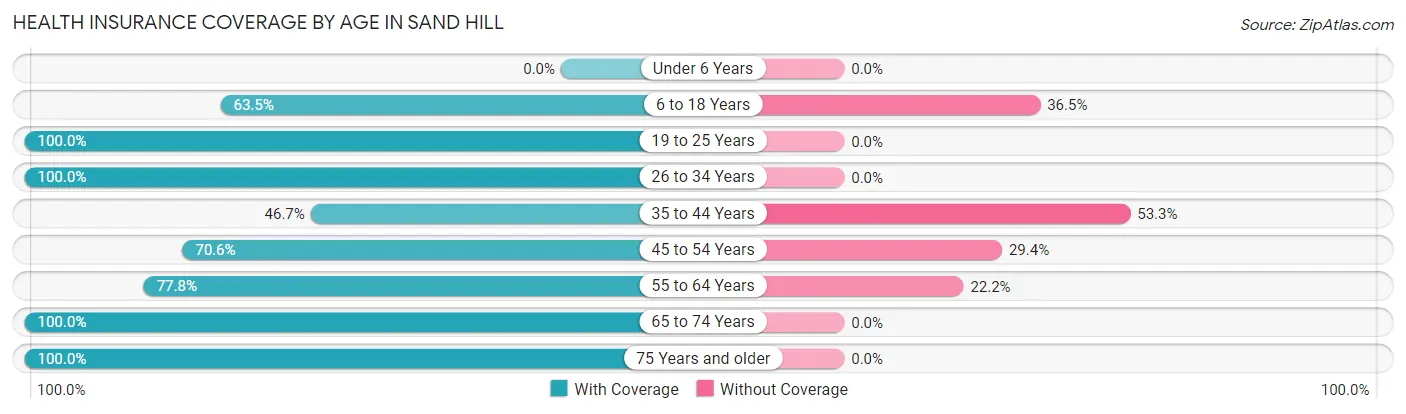
| Age Bracket | With Coverage | Without Coverage |
| Under 6 Years | 0 (0.0%) | 0 (0.0%) |
| 6 to 18 Years | 33 (63.5%) | 19 (36.5%) |
| 19 to 25 Years | 11 (100.0%) | 0 (0.0%) |
| 26 to 34 Years | 22 (100.0%) | 0 (0.0%) |
| 35 to 44 Years | 7 (46.7%) | 8 (53.3%) |
| 45 to 54 Years | 48 (70.6%) | 20 (29.4%) |
| 55 to 64 Years | 42 (77.8%) | 12 (22.2%) |
| 65 to 74 Years | 87 (100.0%) | 0 (0.0%) |
| 75 Years and older | 12 (100.0%) | 0 (0.0%) |
| Total | 262 (81.6%) | 59 (18.4%) |
Health Insurance Coverage by Citizenship Status in Sand Hill
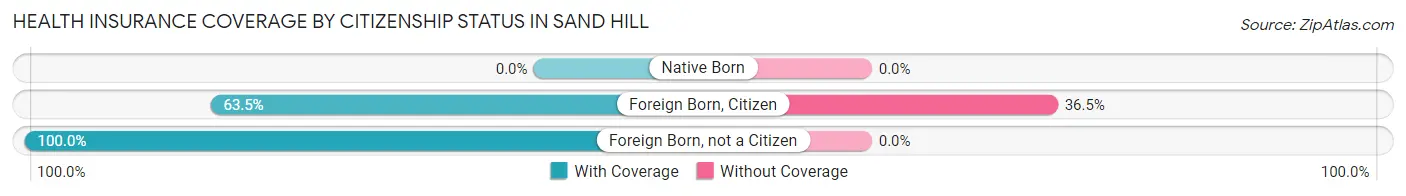
| Citizenship Status | With Coverage | Without Coverage |
| Native Born | 0 (0.0%) | 0 (0.0%) |
| Foreign Born, Citizen | 33 (63.5%) | 19 (36.5%) |
| Foreign Born, not a Citizen | 11 (100.0%) | 0 (0.0%) |
Health Insurance Coverage by Household Income in Sand Hill
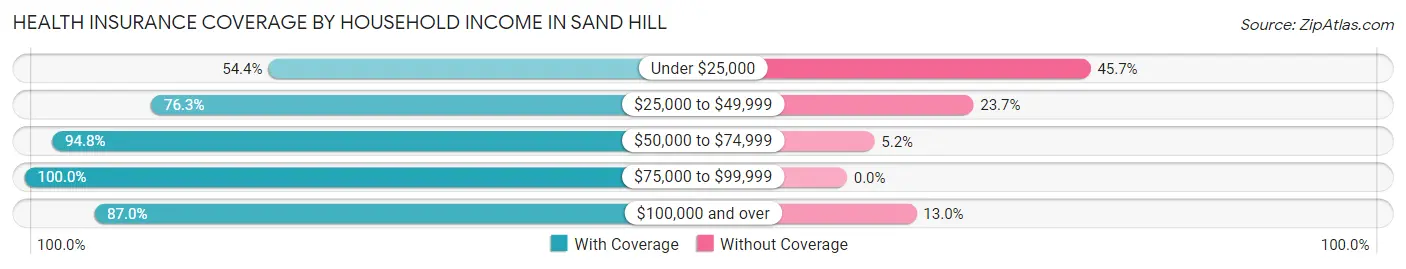
| Household Income | With Coverage | Without Coverage |
| Under $25,000 | 25 (54.3%) | 21 (45.7%) |
| $25,000 to $49,999 | 103 (76.3%) | 32 (23.7%) |
| $50,000 to $74,999 | 55 (94.8%) | 3 (5.2%) |
| $75,000 to $99,999 | 59 (100.0%) | 0 (0.0%) |
| $100,000 and over | 20 (87.0%) | 3 (13.0%) |
Public vs Private Health Insurance Coverage by Age in Sand Hill
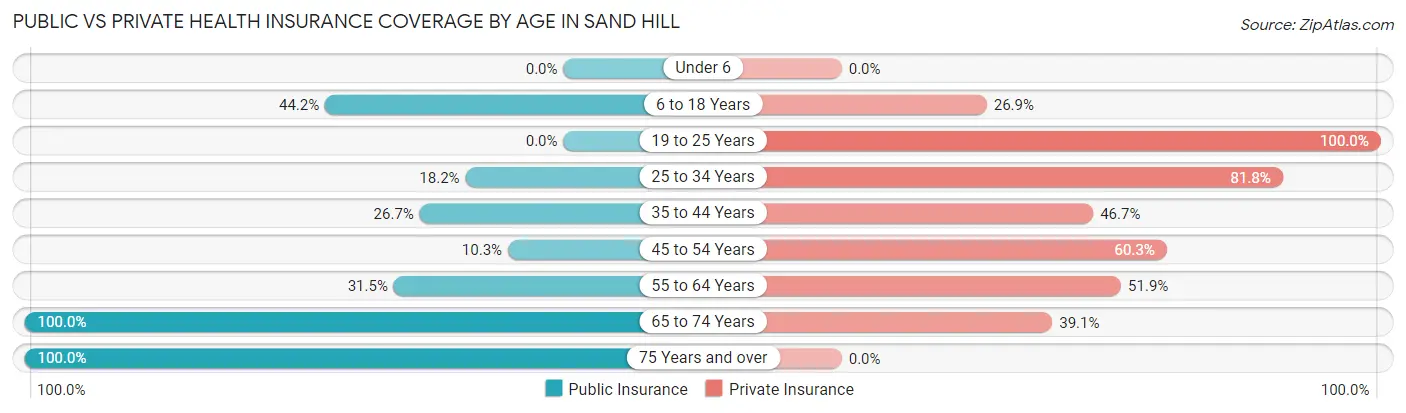
| Age Bracket | Public Insurance | Private Insurance |
| Under 6 | 0 (0.0%) | 0 (0.0%) |
| 6 to 18 Years | 23 (44.2%) | 14 (26.9%) |
| 19 to 25 Years | 0 (0.0%) | 11 (100.0%) |
| 25 to 34 Years | 4 (18.2%) | 18 (81.8%) |
| 35 to 44 Years | 4 (26.7%) | 7 (46.7%) |
| 45 to 54 Years | 7 (10.3%) | 41 (60.3%) |
| 55 to 64 Years | 17 (31.5%) | 28 (51.8%) |
| 65 to 74 Years | 87 (100.0%) | 34 (39.1%) |
| 75 Years and over | 12 (100.0%) | 0 (0.0%) |
| Total | 154 (48.0%) | 153 (47.7%) |
Disability Status by Sex by Age in Sand Hill
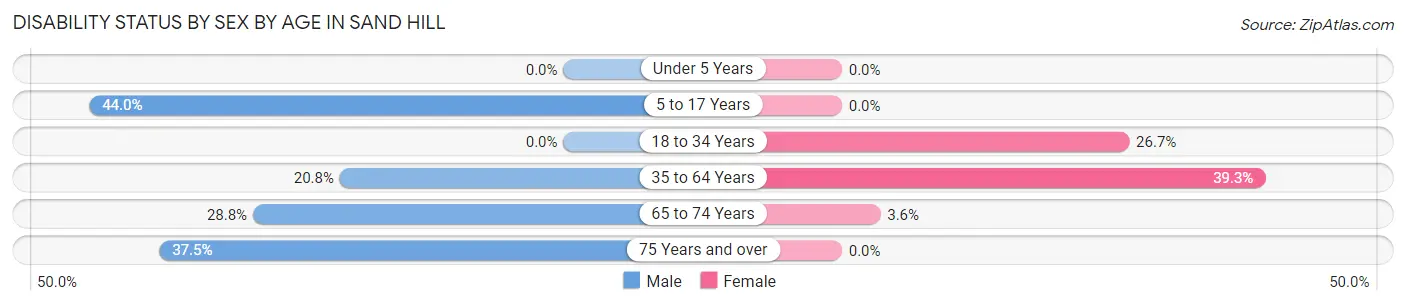
| Age Bracket | Male | Female |
| Under 5 Years | 0 (0.0%) | 0 (0.0%) |
| 5 to 17 Years | 11 (44.0%) | 0 (0.0%) |
| 18 to 34 Years | 0 (0.0%) | 4 (26.7%) |
| 35 to 64 Years | 11 (20.7%) | 33 (39.3%) |
| 65 to 74 Years | 17 (28.8%) | 1 (3.6%) |
| 75 Years and over | 3 (37.5%) | 0 (0.0%) |
Disability Class by Sex by Age in Sand Hill
Disability Class: Hearing Difficulty
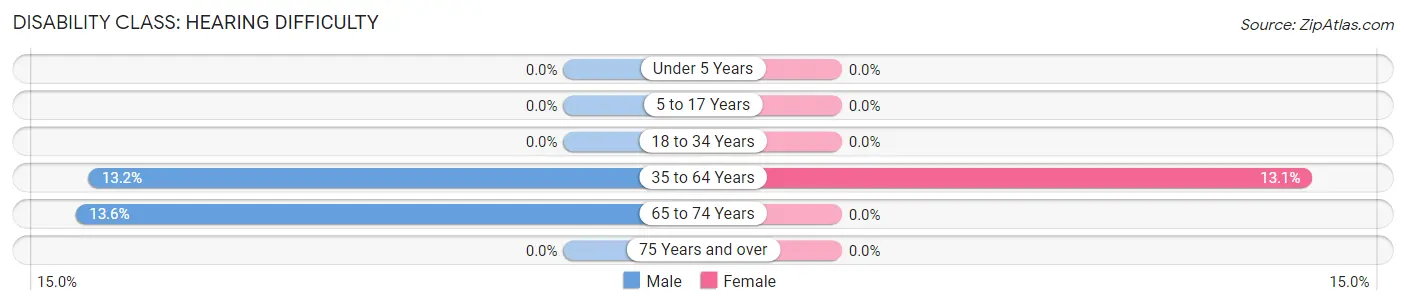
| Age Bracket | Male | Female |
| Under 5 Years | 0 (0.0%) | 0 (0.0%) |
| 5 to 17 Years | 0 (0.0%) | 0 (0.0%) |
| 18 to 34 Years | 0 (0.0%) | 0 (0.0%) |
| 35 to 64 Years | 7 (13.2%) | 11 (13.1%) |
| 65 to 74 Years | 8 (13.6%) | 0 (0.0%) |
| 75 Years and over | 0 (0.0%) | 0 (0.0%) |
Disability Class: Vision Difficulty
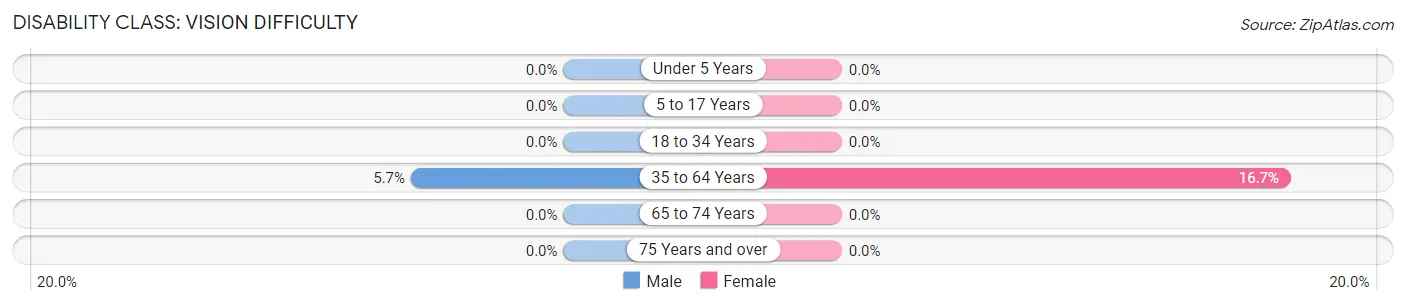
| Age Bracket | Male | Female |
| Under 5 Years | 0 (0.0%) | 0 (0.0%) |
| 5 to 17 Years | 0 (0.0%) | 0 (0.0%) |
| 18 to 34 Years | 0 (0.0%) | 0 (0.0%) |
| 35 to 64 Years | 3 (5.7%) | 14 (16.7%) |
| 65 to 74 Years | 0 (0.0%) | 0 (0.0%) |
| 75 Years and over | 0 (0.0%) | 0 (0.0%) |
Disability Class: Cognitive Difficulty
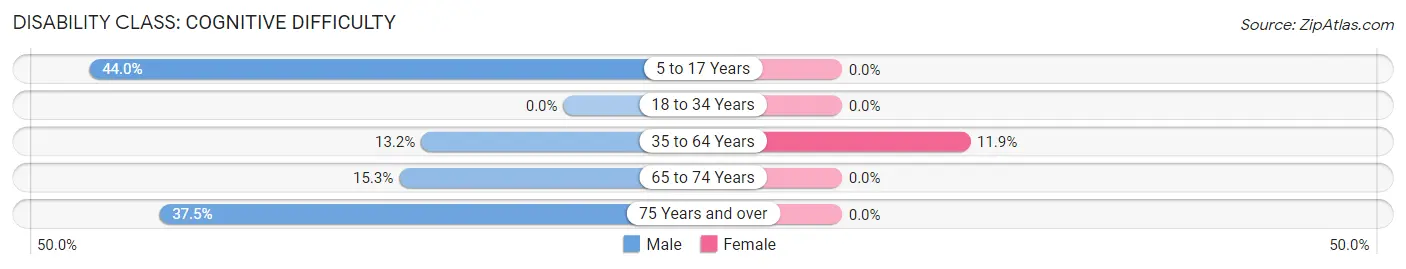
| Age Bracket | Male | Female |
| 5 to 17 Years | 11 (44.0%) | 0 (0.0%) |
| 18 to 34 Years | 0 (0.0%) | 0 (0.0%) |
| 35 to 64 Years | 7 (13.2%) | 10 (11.9%) |
| 65 to 74 Years | 9 (15.2%) | 0 (0.0%) |
| 75 Years and over | 3 (37.5%) | 0 (0.0%) |
Disability Class: Ambulatory Difficulty
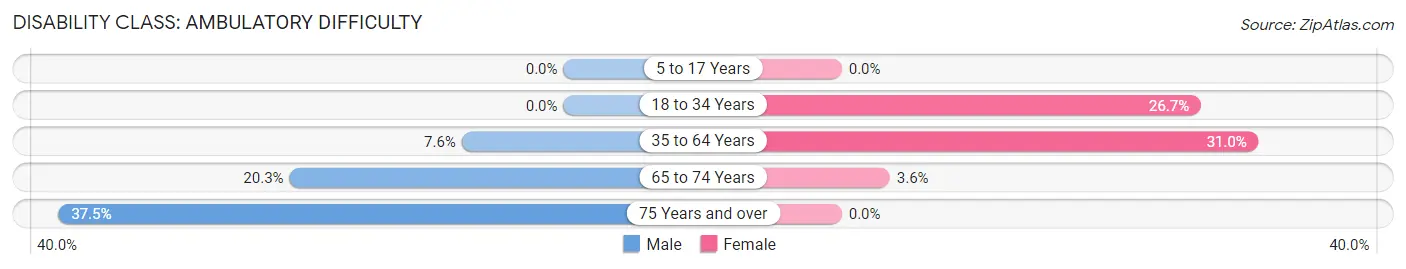
| Age Bracket | Male | Female |
| 5 to 17 Years | 0 (0.0%) | 0 (0.0%) |
| 18 to 34 Years | 0 (0.0%) | 4 (26.7%) |
| 35 to 64 Years | 4 (7.5%) | 26 (30.9%) |
| 65 to 74 Years | 12 (20.3%) | 1 (3.6%) |
| 75 Years and over | 3 (37.5%) | 0 (0.0%) |
Disability Class: Self-Care Difficulty
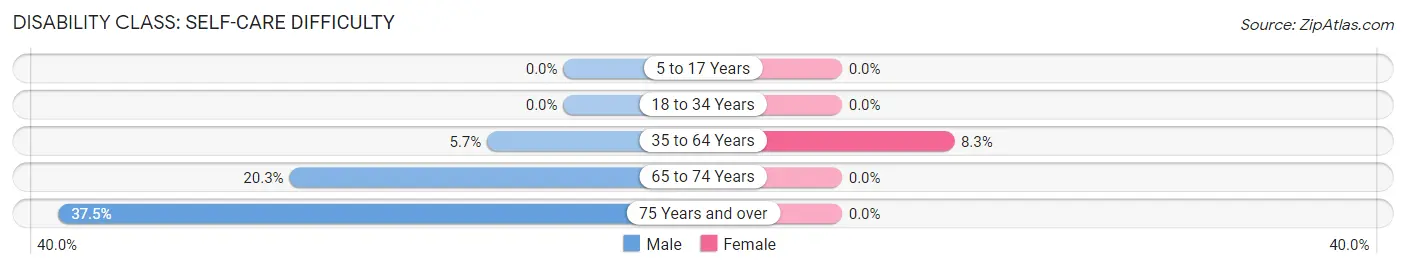
| Age Bracket | Male | Female |
| 5 to 17 Years | 0 (0.0%) | 0 (0.0%) |
| 18 to 34 Years | 0 (0.0%) | 0 (0.0%) |
| 35 to 64 Years | 3 (5.7%) | 7 (8.3%) |
| 65 to 74 Years | 12 (20.3%) | 0 (0.0%) |
| 75 Years and over | 3 (37.5%) | 0 (0.0%) |
Technology Access in Sand Hill
Computing Device Access in Sand Hill
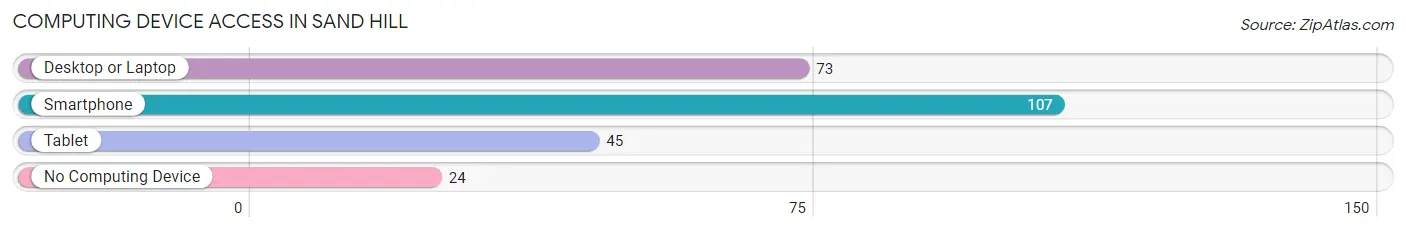
| Device Type | # Households | % Households |
| Desktop or Laptop | 73 | 51.4% |
| Smartphone | 107 | 75.3% |
| Tablet | 45 | 31.7% |
| No Computing Device | 24 | 16.9% |
| Total | 142 | 100.0% |
Internet Access in Sand Hill
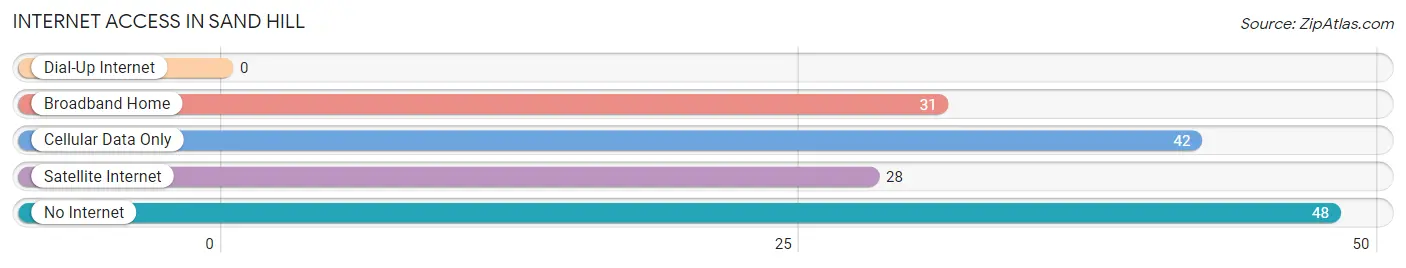
| Internet Type | # Households | % Households |
| Dial-Up Internet | 0 | 0.0% |
| Broadband Home | 31 | 21.8% |
| Cellular Data Only | 42 | 29.6% |
| Satellite Internet | 28 | 19.7% |
| No Internet | 48 | 33.8% |
| Total | 142 | 100.0% |
Sand Hill Summary
Sand Hill is a small unincorporated community located in the southeastern corner of Oklahoma, in the United States. It is situated in the foothills of the Ouachita Mountains, in the foothills of the Kiamichi Mountains, and is part of the Choctaw Nation. The community is located in Pushmataha County, and is approximately 10 miles south of the county seat of Antlers.
History
The area that is now Sand Hill was originally inhabited by the Choctaw Indians. The Choctaw were a Native American tribe that had been living in the area for centuries before the arrival of European settlers. The Choctaw were forcibly removed from the area in the 1830s, as part of the Indian Removal Act.
The first European settlers to the area arrived in the late 1800s. The settlement was originally known as “Sand Hill”, due to the sandy soil in the area. The settlement was officially established in 1902, when the post office was established.
Geography
Sand Hill is located in the southeastern corner of Oklahoma, in the foothills of the Ouachita Mountains and the Kiamichi Mountains. The community is situated in Pushmataha County, and is approximately 10 miles south of the county seat of Antlers.
The area is characterized by rolling hills, with an elevation of approximately 1,000 feet. The climate is generally mild, with hot summers and cold winters. The average annual temperature is around 65 degrees Fahrenheit.
Economy
The economy of Sand Hill is largely based on agriculture. The area is known for its production of cotton, corn, soybeans, and hay. The area is also home to several small businesses, including a general store, a gas station, and a few restaurants.
Demographics
As of the 2010 census, the population of Sand Hill was approximately 1,000 people. The population is predominantly white, with a small minority of African Americans and Native Americans. The median household income is around $30,000, and the median home value is around $80,000.
Conclusion
Sand Hill is a small unincorporated community located in the southeastern corner of Oklahoma. It is situated in the foothills of the Ouachita Mountains and the Kiamichi Mountains, and is part of the Choctaw Nation. The economy of Sand Hill is largely based on agriculture, and the population is predominantly white. The area is known for its mild climate and rolling hills, and is home to several small businesses.
Common Questions
What is the Total Population of Sand Hill?
Total Population of Sand Hill is 321.
What is the Total Male Population of Sand Hill?
Total Male Population of Sand Hill is 163.
What is the Total Female Population of Sand Hill?
Total Female Population of Sand Hill is 158.
What is the Ratio of Males per 100 Females in Sand Hill?
There are 103.16 Males per 100 Females in Sand Hill.
What is the Ratio of Females per 100 Males in Sand Hill?
There are 96.93 Females per 100 Males in Sand Hill.
What is the Median Population Age in Sand Hill?
Median Population Age in Sand Hill is 54.2 Years.
What is the Average Family Size in Sand Hill
Average Family Size in Sand Hill is 3.0 People.
What is the Average Household Size in Sand Hill
Average Household Size in Sand Hill is 2.3 People.
What is Per Capita Income in Sand Hill?
Per Capita income in Sand Hill is $24,350.
What is the Median Family Income in Sand Hill?
Median Family Income in Sand Hill is $68,977.
What is the Median Household income in Sand Hill?
Median Household Income in Sand Hill is $44,583.
What is Income or Wage Gap in Sand Hill?
Income or Wage Gap in Sand Hill is 70.2%.
Women in Sand Hill earn 29.8 cents for every dollar earned by a man.
What is Inequality or Gini Index in Sand Hill?
Inequality or Gini Index in Sand Hill is 0.43.
How Large is the Labor Force in Sand Hill?
There are 122 People in the Labor Forcein in Sand Hill.
What is the Percentage of People in the Labor Force in Sand Hill?
43.9% of People are in the Labor Force in Sand Hill.
What is the Unemployment Rate in Sand Hill?
Unemployment Rate in Sand Hill is 2.5%.