Cities with the Lowest Poverty Level Among Seniors Over the Age of 65 in Oklahoma
RELATED REPORTS & OPTIONS
Lowest Poverty | Seniors 65+
Oklahoma
Compare Cities
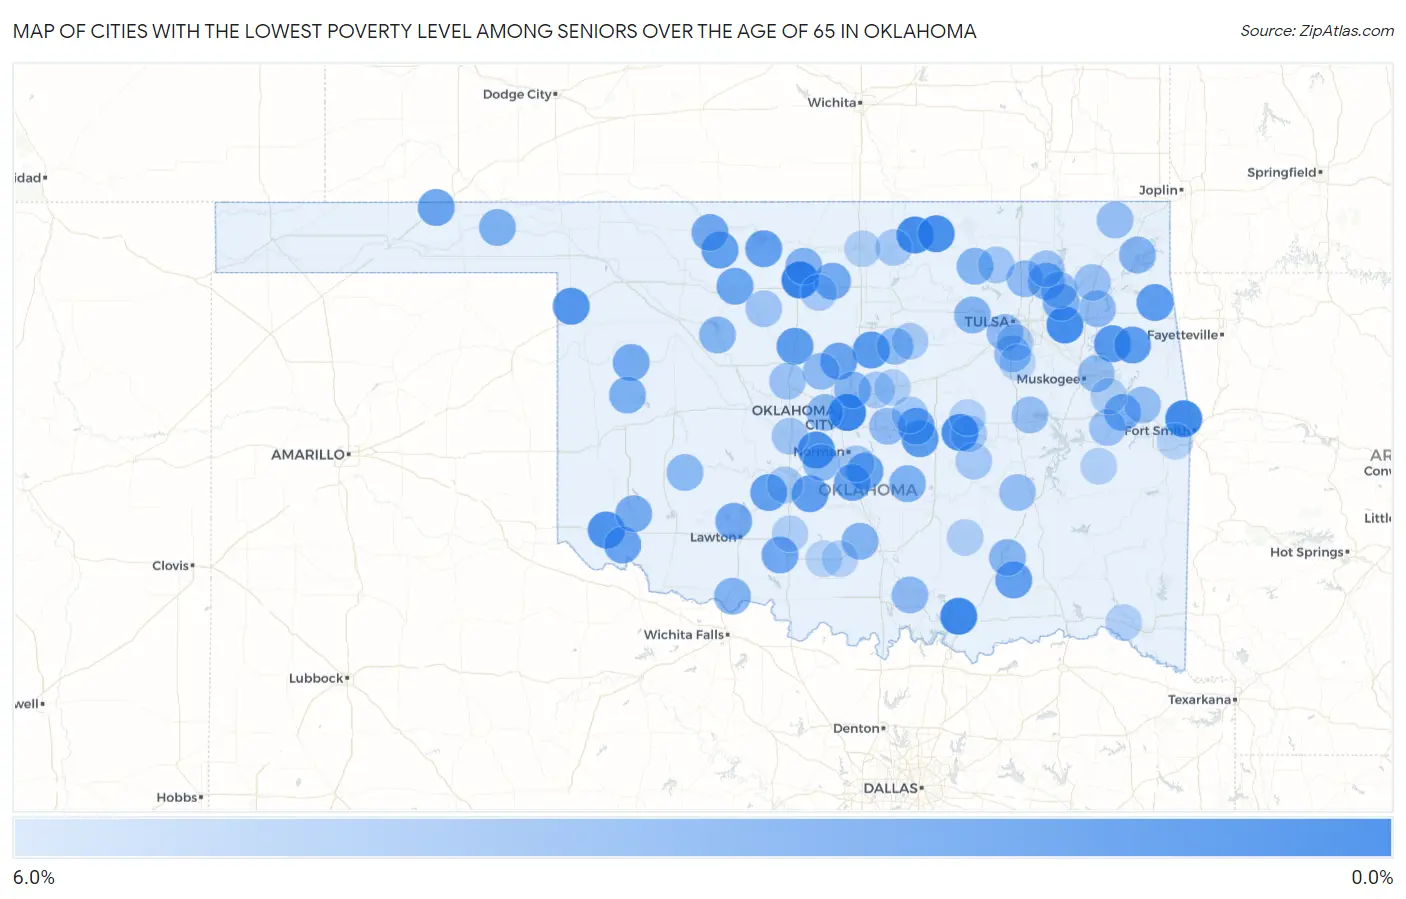
Map of Cities with the Lowest Poverty Level Among Seniors Over the Age of 65 in Oklahoma
6.0%
0.0%
Cities with the Lowest Poverty Level Among Seniors Over the Age of 65 in Oklahoma
| City | Senior Poverty | vs State | vs National | |
| 1. | North Enid | 0.60% | 9.5%(-8.93)#1 | 10.0%(-9.35)#105 |
| 2. | Forest Park | 0.72% | 9.5%(-8.80)#2 | 10.0%(-9.23)#151 |
| 3. | Silo | 0.82% | 9.5%(-8.70)#3 | 10.0%(-9.13)#186 |
| 4. | Remy | 1.0% | 9.5%(-8.50)#4 | 10.0%(-8.93)#293 |
| 5. | Inola | 1.0% | 9.5%(-8.47)#5 | 10.0%(-8.90)#313 |
| 6. | Kaw City | 1.1% | 9.5%(-8.46)#6 | 10.0%(-8.89)#317 |
| 7. | Cromwell | 1.2% | 9.5%(-8.29)#7 | 10.0%(-8.72)#440 |
| 8. | Shidler | 1.3% | 9.5%(-8.21)#8 | 10.0%(-8.64)#509 |
| 9. | Bridge Creek | 1.4% | 9.5%(-8.11)#9 | 10.0%(-8.54)#585 |
| 10. | East Duke | 1.4% | 9.5%(-8.11)#10 | 10.0%(-8.54)#586 |
| 11. | Shattuck | 1.7% | 9.5%(-7.78)#11 | 10.0%(-8.21)#858 |
| 12. | Lost City | 1.8% | 9.5%(-7.70)#12 | 10.0%(-8.13)#914 |
| 13. | Coyle | 1.9% | 9.5%(-7.63)#13 | 10.0%(-8.06)#986 |
| 14. | Earlsboro | 1.9% | 9.5%(-7.60)#14 | 10.0%(-8.03)#1,008 |
| 15. | Cloud Creek | 1.9% | 9.5%(-7.60)#15 | 10.0%(-8.03)#1,016 |
| 16. | Steely Hollow | 2.0% | 9.5%(-7.54)#16 | 10.0%(-7.97)#1,080 |
| 17. | Dover | 2.0% | 9.5%(-7.52)#17 | 10.0%(-7.95)#1,097 |
| 18. | Alex | 2.1% | 9.5%(-7.44)#18 | 10.0%(-7.87)#1,172 |
| 19. | Cement | 2.2% | 9.5%(-7.35)#19 | 10.0%(-7.78)#1,242 |
| 20. | Dacoma | 2.2% | 9.5%(-7.30)#20 | 10.0%(-7.73)#1,301 |
| 21. | Johnson | 2.3% | 9.5%(-7.27)#21 | 10.0%(-7.70)#1,336 |
| 22. | Lane | 2.3% | 9.5%(-7.22)#22 | 10.0%(-7.65)#1,378 |
| 23. | Jet | 2.3% | 9.5%(-7.22)#23 | 10.0%(-7.65)#1,379 |
| 24. | Slaughterville | 2.4% | 9.5%(-7.12)#24 | 10.0%(-7.55)#1,496 |
| 25. | Purcell | 2.4% | 9.5%(-7.09)#25 | 10.0%(-7.52)#1,522 |
| 26. | Cedar Valley | 2.5% | 9.5%(-7.07)#26 | 10.0%(-7.50)#1,547 |
| 27. | Olustee | 2.5% | 9.5%(-7.05)#27 | 10.0%(-7.48)#1,565 |
| 28. | Tyrone | 2.5% | 9.5%(-7.01)#28 | 10.0%(-7.44)#1,609 |
| 29. | Cleo Springs | 2.6% | 9.5%(-6.89)#29 | 10.0%(-7.32)#1,743 |
| 30. | Toppers | 2.7% | 9.5%(-6.82)#30 | 10.0%(-7.25)#1,825 |
| 31. | Alva | 2.7% | 9.5%(-6.79)#31 | 10.0%(-7.22)#1,858 |
| 32. | Empire City | 2.8% | 9.5%(-6.77)#32 | 10.0%(-7.20)#1,878 |
| 33. | Medicine Park | 2.8% | 9.5%(-6.74)#33 | 10.0%(-7.17)#1,912 |
| 34. | Cookson | 2.8% | 9.5%(-6.73)#34 | 10.0%(-7.16)#1,926 |
| 35. | Garber | 2.9% | 9.5%(-6.67)#35 | 10.0%(-7.09)#1,994 |
| 36. | Leedey | 2.9% | 9.5%(-6.58)#36 | 10.0%(-7.01)#2,102 |
| 37. | Blair | 3.0% | 9.5%(-6.52)#37 | 10.0%(-6.95)#2,178 |
| 38. | Taylor Ferry | 3.0% | 9.5%(-6.50)#38 | 10.0%(-6.93)#2,197 |
| 39. | Carlisle | 3.1% | 9.5%(-6.47)#39 | 10.0%(-6.89)#2,248 |
| 40. | Oologah | 3.1% | 9.5%(-6.41)#40 | 10.0%(-6.84)#2,319 |
| 41. | Beaver | 3.2% | 9.5%(-6.30)#41 | 10.0%(-6.73)#2,462 |
| 42. | Hammon | 3.2% | 9.5%(-6.30)#42 | 10.0%(-6.73)#2,469 |
| 43. | Justice | 3.2% | 9.5%(-6.28)#43 | 10.0%(-6.71)#2,495 |
| 44. | Asher | 3.4% | 9.5%(-6.17)#44 | 10.0%(-6.60)#2,668 |
| 45. | Kremlin | 3.4% | 9.5%(-6.13)#45 | 10.0%(-6.56)#2,707 |
| 46. | Katie | 3.4% | 9.5%(-6.07)#46 | 10.0%(-6.50)#2,787 |
| 47. | Bernice | 3.5% | 9.5%(-6.04)#47 | 10.0%(-6.47)#2,823 |
| 48. | Edmond | 3.5% | 9.5%(-6.02)#48 | 10.0%(-6.45)#2,855 |
| 49. | Randlett | 3.5% | 9.5%(-6.01)#49 | 10.0%(-6.44)#2,865 |
| 50. | Canton | 3.5% | 9.5%(-5.99)#50 | 10.0%(-6.42)#2,889 |
| 51. | Westport | 3.5% | 9.5%(-5.99)#51 | 10.0%(-6.42)#2,890 |
| 52. | Wynona | 3.6% | 9.5%(-5.95)#52 | 10.0%(-6.38)#2,952 |
| 53. | Stringtown | 3.7% | 9.5%(-5.86)#53 | 10.0%(-6.29)#3,079 |
| 54. | Woodlawn Park | 3.8% | 9.5%(-5.75)#54 | 10.0%(-6.18)#3,235 |
| 55. | Blanchard | 3.8% | 9.5%(-5.74)#55 | 10.0%(-6.17)#3,238 |
| 56. | Gotebo | 3.8% | 9.5%(-5.72)#56 | 10.0%(-6.15)#3,254 |
| 57. | Perkins | 3.8% | 9.5%(-5.71)#57 | 10.0%(-6.14)#3,266 |
| 58. | Sequoyah | 3.8% | 9.5%(-5.68)#58 | 10.0%(-6.11)#3,324 |
| 59. | Sportsmen Acres | 3.8% | 9.5%(-5.68)#59 | 10.0%(-6.11)#3,330 |
| 60. | Mannsville | 3.9% | 9.5%(-5.63)#60 | 10.0%(-6.06)#3,394 |
| 61. | Cashion | 3.9% | 9.5%(-5.62)#61 | 10.0%(-6.05)#3,406 |
| 62. | Glenpool | 4.0% | 9.5%(-5.55)#62 | 10.0%(-5.98)#3,496 |
| 63. | Mcloud | 4.0% | 9.5%(-5.54)#63 | 10.0%(-5.97)#3,511 |
| 64. | Oakhurst | 4.0% | 9.5%(-5.52)#64 | 10.0%(-5.95)#3,533 |
| 65. | Vera | 4.0% | 9.5%(-5.52)#65 | 10.0%(-5.95)#3,541 |
| 66. | Fort Gibson | 4.0% | 9.5%(-5.48)#66 | 10.0%(-5.91)#3,604 |
| 67. | Arpelar | 4.2% | 9.5%(-5.36)#67 | 10.0%(-5.79)#3,787 |
| 68. | Hoffman | 4.2% | 9.5%(-5.36)#68 | 10.0%(-5.79)#3,799 |
| 69. | Dwight Mission | 4.2% | 9.5%(-5.36)#69 | 10.0%(-5.79)#3,804 |
| 70. | Welch | 4.2% | 9.5%(-5.30)#70 | 10.0%(-5.73)#3,862 |
| 71. | Adair | 4.3% | 9.5%(-5.21)#71 | 10.0%(-5.64)#3,975 |
| 72. | Okarche | 4.3% | 9.5%(-5.17)#72 | 10.0%(-5.60)#4,028 |
| 73. | Simms | 4.3% | 9.5%(-5.17)#73 | 10.0%(-5.60)#4,039 |
| 74. | Talala | 4.3% | 9.5%(-5.17)#74 | 10.0%(-5.60)#4,048 |
| 75. | Minco | 4.5% | 9.5%(-4.99)#75 | 10.0%(-5.42)#4,320 |
| 76. | Ames | 4.5% | 9.5%(-4.98)#76 | 10.0%(-5.41)#4,356 |
| 77. | Barnsdall | 4.6% | 9.5%(-4.92)#77 | 10.0%(-5.35)#4,434 |
| 78. | Noble | 4.7% | 9.5%(-4.86)#78 | 10.0%(-5.29)#4,533 |
| 79. | Meeker | 4.8% | 9.5%(-4.76)#79 | 10.0%(-5.19)#4,631 |
| 80. | Yeager | 4.8% | 9.5%(-4.76)#80 | 10.0%(-5.19)#4,661 |
| 81. | Fairmont | 4.8% | 9.5%(-4.76)#82 | 10.0%(-5.19)#4,664 |
| 82. | Bearden | 4.8% | 9.5%(-4.76)#83 | 10.0%(-5.19)#4,665 |
| 83. | Jenks | 4.8% | 9.5%(-4.75)#84 | 10.0%(-5.18)#4,681 |
| 84. | Mccord | 4.8% | 9.5%(-4.75)#85 | 10.0%(-5.18)#4,686 |
| 85. | Ripley | 4.8% | 9.5%(-4.70)#86 | 10.0%(-5.13)#4,750 |
| 86. | Norge | 4.8% | 9.5%(-4.68)#87 | 10.0%(-5.11)#4,778 |
| 87. | Luther | 4.9% | 9.5%(-4.67)#88 | 10.0%(-5.10)#4,790 |
| 88. | Tupelo | 5.1% | 9.5%(-4.44)#89 | 10.0%(-4.87)#5,120 |
| 89. | Tonkawa | 5.1% | 9.5%(-4.43)#90 | 10.0%(-4.86)#5,132 |
| 90. | Marlow | 5.1% | 9.5%(-4.39)#91 | 10.0%(-4.82)#5,192 |
| 91. | Wellston | 5.1% | 9.5%(-4.38)#92 | 10.0%(-4.81)#5,200 |
| 92. | Kinta | 5.2% | 9.5%(-4.35)#93 | 10.0%(-4.78)#5,245 |
| 93. | Sour John | 5.2% | 9.5%(-4.35)#94 | 10.0%(-4.78)#5,248 |
| 94. | Cumberland | 5.2% | 9.5%(-4.34)#95 | 10.0%(-4.77)#5,254 |
| 95. | Millerton | 5.3% | 9.5%(-4.26)#96 | 10.0%(-4.69)#5,402 |
| 96. | Castle | 5.3% | 9.5%(-4.26)#97 | 10.0%(-4.69)#5,405 |
| 97. | Velma | 5.3% | 9.5%(-4.20)#98 | 10.0%(-4.63)#5,484 |
| 98. | Fort Coffee | 5.3% | 9.5%(-4.20)#99 | 10.0%(-4.63)#5,486 |
| 99. | Liberty | 5.4% | 9.5%(-4.17)#100 | 10.0%(-4.59)#5,546 |
| 100. | Ratliff City | 5.4% | 9.5%(-4.12)#101 | 10.0%(-4.55)#5,629 |
Common Questions
What are the Top 10 Cities with the Lowest Poverty Level Among Seniors Over the Age of 65 in Oklahoma?
Top 10 Cities with the Lowest Poverty Level Among Seniors Over the Age of 65 in Oklahoma are:
#1
0.60%
#2
0.72%
#3
0.82%
#4
1.0%
#5
1.0%
#6
1.1%
#7
1.2%
#8
1.3%
#9
1.4%
#10
1.4%
What city has the Lowest Poverty Level Among Seniors Over the Age of 65 in Oklahoma?
North Enid has the Lowest Poverty Level Among Seniors Over the Age of 65 in Oklahoma with 0.60%.
What is the Poverty Level Among Seniors Over the Age of 65 in the State of Oklahoma?
Poverty Level Among Seniors Over the Age of 65 in Oklahoma is 9.5%.
What is the Poverty Level Among Seniors Over the Age of 65 in the United States?
Poverty Level Among Seniors Over the Age of 65 in the United States is 10.0%.