The Village, OK
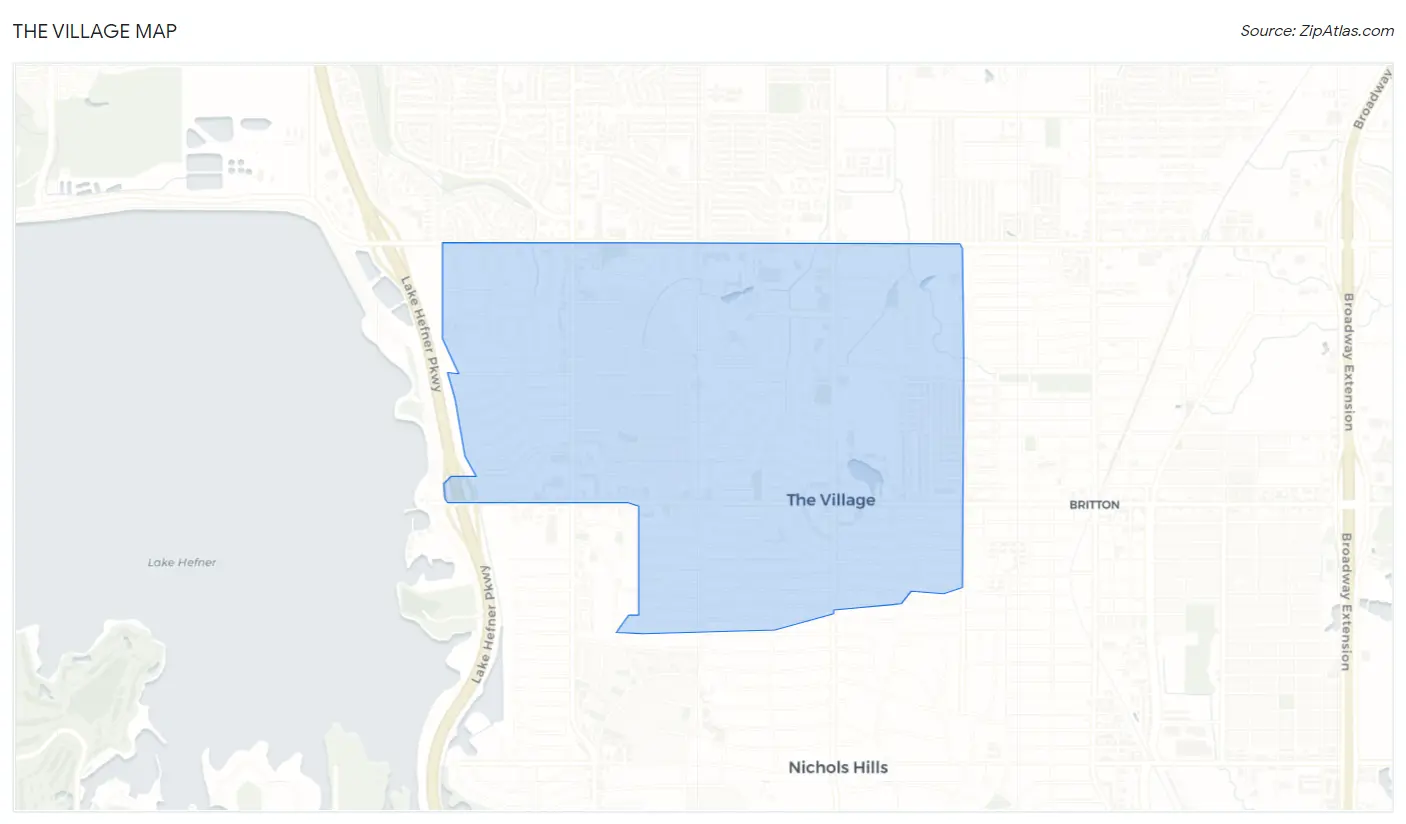
The Village Map
The Village Overview
9,479
TOTAL POPULATION
4,281
MALE POPULATION
5,198
FEMALE POPULATION
82.36
MALES / 100 FEMALES
121.42
FEMALES / 100 MALES
32.5
MEDIAN AGE
2.6
AVG FAMILY SIZE
2.0
AVG HOUSEHOLD SIZE
$42,597
PER CAPITA INCOME
$87,240
AVG FAMILY INCOME
$67,524
AVG HOUSEHOLD INCOME
6.8%
WAGE / INCOME GAP [ % ]
93.2¢/ $1
WAGE / INCOME GAP [ $ ]
$7,751
FAMILY INCOME DEFICIT
0.42
INEQUALITY / GINI INDEX
6,024
LABOR FORCE [ PEOPLE ]
72.4%
PERCENT IN LABOR FORCE
2.1%
UNEMPLOYMENT RATE
The Village Area Codes
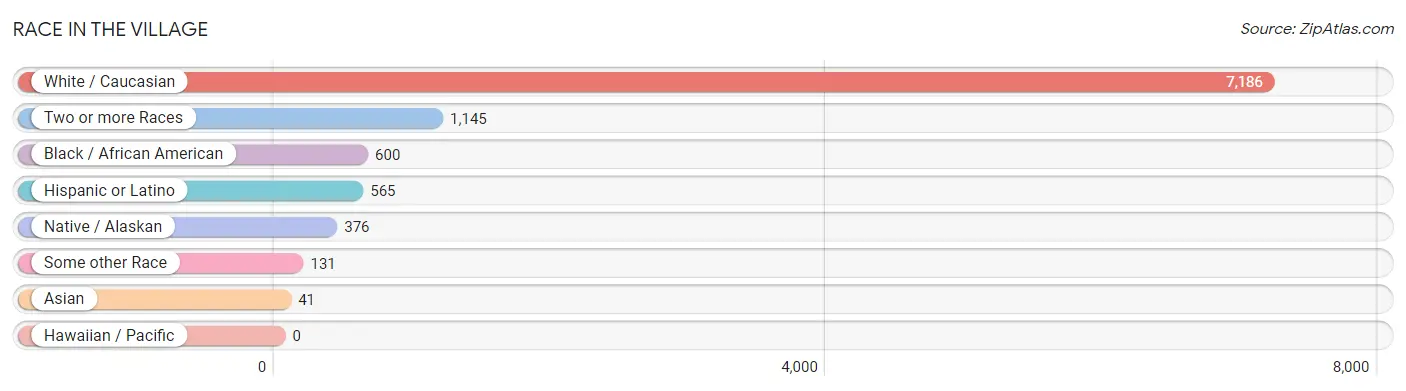
Race in The Village
The most populous races in The Village are White / Caucasian (7,186 | 75.8%), Two or more Races (1,145 | 12.1%), and Black / African American (600 | 6.3%).
| Race | # Population | % Population |
| Asian | 41 | 0.4% |
| Black / African American | 600 | 6.3% |
| Hawaiian / Pacific | 0 | 0.0% |
| Hispanic or Latino | 565 | 6.0% |
| Native / Alaskan | 376 | 4.0% |
| White / Caucasian | 7,186 | 75.8% |
| Two or more Races | 1,145 | 12.1% |
| Some other Race | 131 | 1.4% |
| Total | 9,479 | 100.0% |
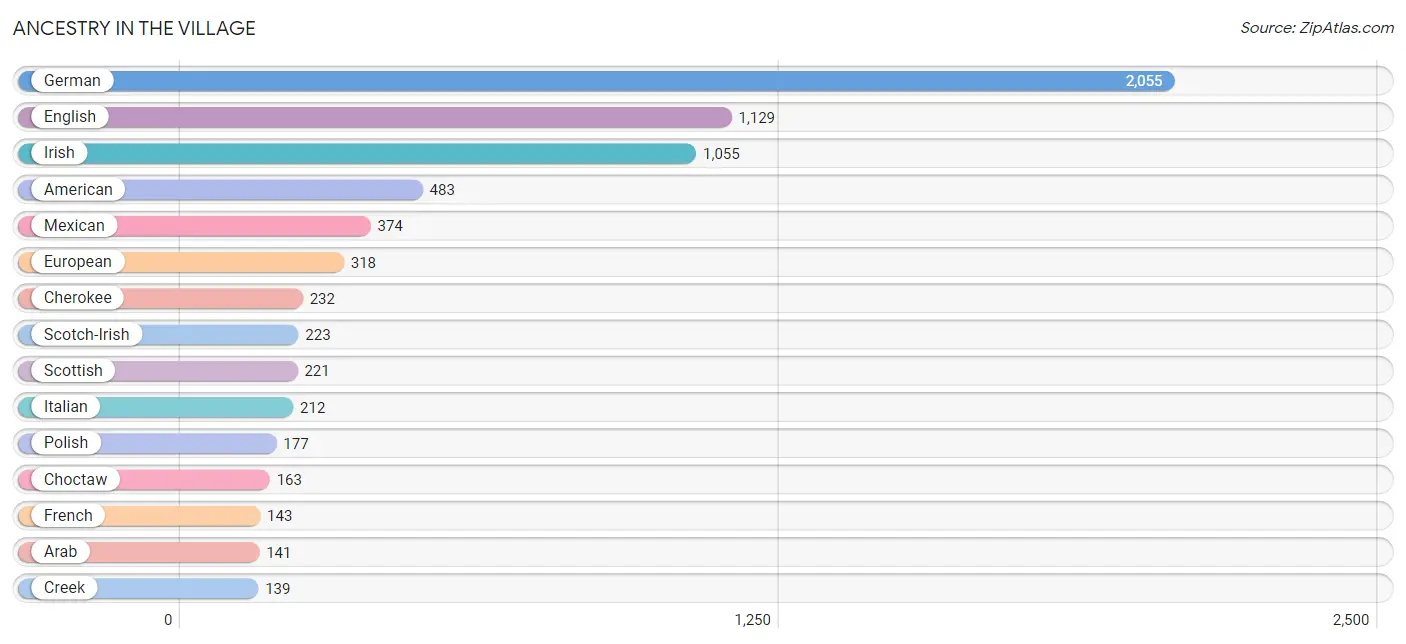
Ancestry in The Village
The most populous ancestries reported in The Village are German (2,055 | 21.7%), English (1,129 | 11.9%), Irish (1,055 | 11.1%), American (483 | 5.1%), and Mexican (374 | 4.0%), together accounting for 53.8% of all The Village residents.
| Ancestry | # Population | % Population |
| African | 72 | 0.8% |
| American | 483 | 5.1% |
| Arab | 141 | 1.5% |
| Argentinean | 16 | 0.2% |
| Austrian | 6 | 0.1% |
| Bhutanese | 59 | 0.6% |
| British | 88 | 0.9% |
| Central American | 77 | 0.8% |
| Cherokee | 232 | 2.5% |
| Cheyenne | 5 | 0.1% |
| Chickasaw | 136 | 1.4% |
| Choctaw | 163 | 1.7% |
| Comanche | 22 | 0.2% |
| Creek | 139 | 1.5% |
| Croatian | 21 | 0.2% |
| Cuban | 23 | 0.2% |
| Czech | 127 | 1.3% |
| Czechoslovakian | 13 | 0.1% |
| Danish | 25 | 0.3% |
| Dutch | 118 | 1.2% |
| Eastern European | 8 | 0.1% |
| English | 1,129 | 11.9% |
| Ethiopian | 28 | 0.3% |
| European | 318 | 3.4% |
| Finnish | 17 | 0.2% |
| French | 143 | 1.5% |
| French Canadian | 35 | 0.4% |
| German | 2,055 | 21.7% |
| Greek | 6 | 0.1% |
| Hungarian | 9 | 0.1% |
| Icelander | 2 | 0.0% |
| Irish | 1,055 | 11.1% |
| Italian | 212 | 2.2% |
| Korean | 53 | 0.6% |
| Laotian | 19 | 0.2% |
| Lebanese | 125 | 1.3% |
| Lithuanian | 6 | 0.1% |
| Mexican | 374 | 4.0% |
| Northern European | 21 | 0.2% |
| Norwegian | 51 | 0.5% |
| Osage | 23 | 0.2% |
| Pakistani | 22 | 0.2% |
| Polish | 177 | 1.9% |
| Portuguese | 18 | 0.2% |
| Potawatomi | 44 | 0.5% |
| Russian | 45 | 0.5% |
| Salvadoran | 77 | 0.8% |
| Scandinavian | 47 | 0.5% |
| Scotch-Irish | 223 | 2.4% |
| Scottish | 221 | 2.3% |
| Sioux | 12 | 0.1% |
| Slavic | 8 | 0.1% |
| South American | 16 | 0.2% |
| Spaniard | 75 | 0.8% |
| Sri Lankan | 9 | 0.1% |
| Subsaharan African | 100 | 1.1% |
| Swedish | 52 | 0.5% |
| Swiss | 128 | 1.3% |
| Syrian | 16 | 0.2% |
| Ukrainian | 25 | 0.3% |
| Welsh | 103 | 1.1% | View All 61 Rows |
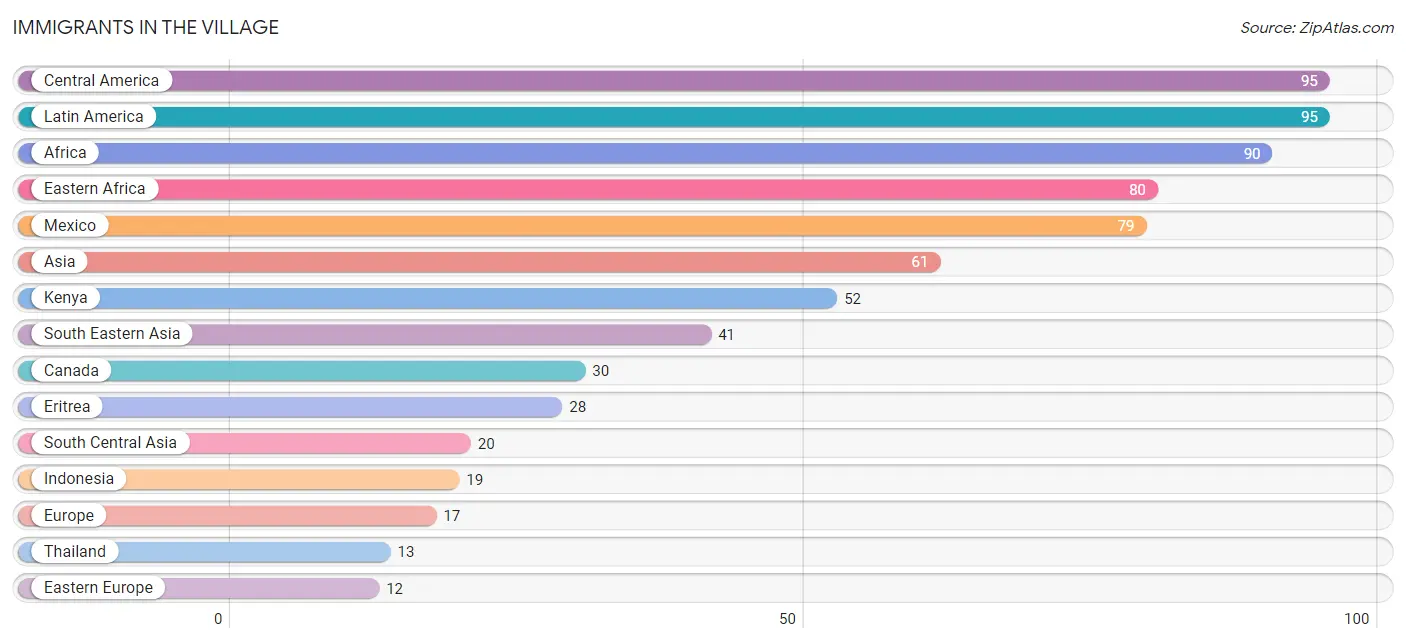
Immigrants in The Village
The most numerous immigrant groups reported in The Village came from Central America (95 | 1.0%), Latin America (95 | 1.0%), Africa (90 | 0.9%), Eastern Africa (80 | 0.8%), and Mexico (79 | 0.8%), together accounting for 4.6% of all The Village residents.
| Immigration Origin | # Population | % Population |
| Africa | 90 | 0.9% |
| Asia | 61 | 0.6% |
| Canada | 30 | 0.3% |
| Central America | 95 | 1.0% |
| Eastern Africa | 80 | 0.8% |
| Eastern Europe | 12 | 0.1% |
| El Salvador | 10 | 0.1% |
| Eritrea | 28 | 0.3% |
| Europe | 17 | 0.2% |
| Guatemala | 6 | 0.1% |
| Indonesia | 19 | 0.2% |
| Iran | 9 | 0.1% |
| Ireland | 5 | 0.1% |
| Kazakhstan | 11 | 0.1% |
| Kenya | 52 | 0.5% |
| Latin America | 95 | 1.0% |
| Mexico | 79 | 0.8% |
| Nigeria | 10 | 0.1% |
| Northern Europe | 5 | 0.1% |
| Poland | 12 | 0.1% |
| South Central Asia | 20 | 0.2% |
| South Eastern Asia | 41 | 0.4% |
| Thailand | 13 | 0.1% |
| Vietnam | 9 | 0.1% |
| Western Africa | 10 | 0.1% | View All 25 Rows |
Sex and Age in The Village
Sex and Age in The Village
The most populous age groups in The Village are 25 to 29 Years (774 | 18.1%) for men and 25 to 29 Years (897 | 17.3%) for women.
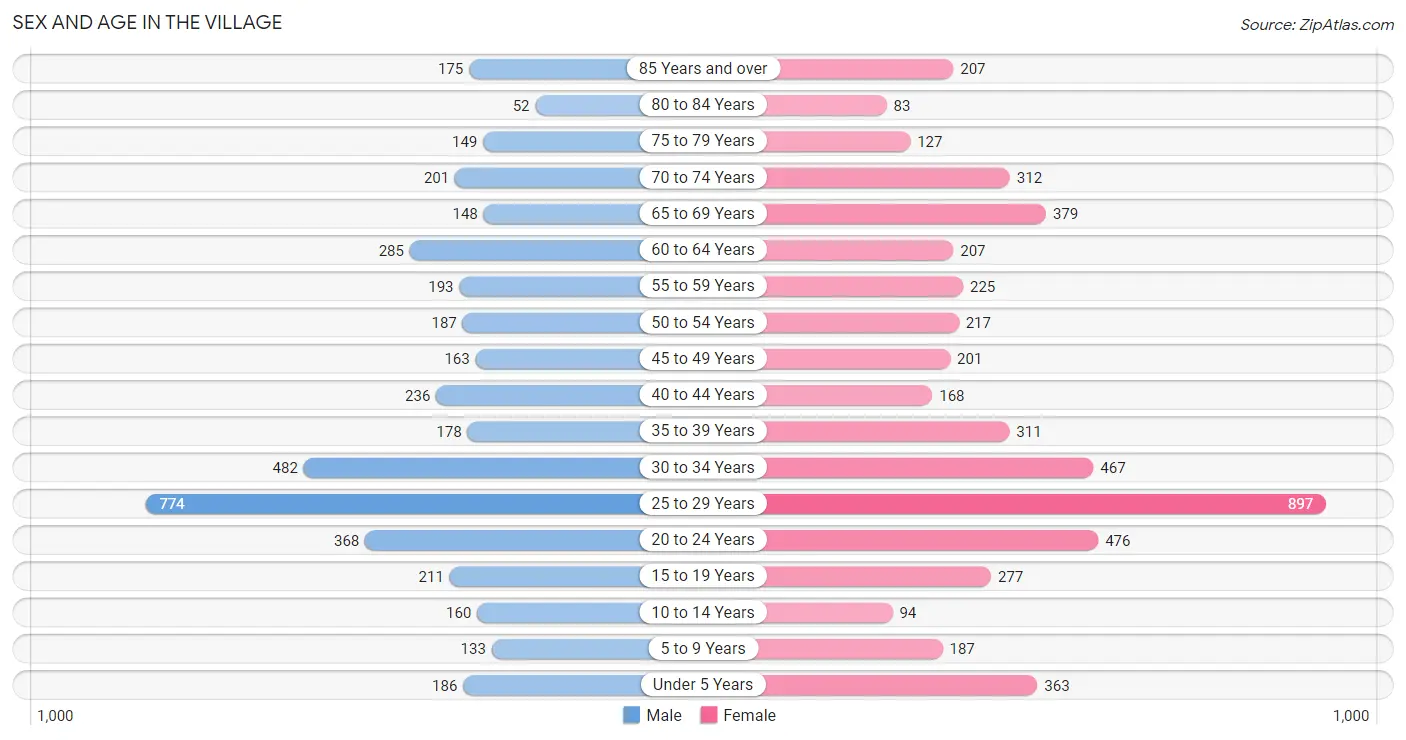
| Age Bracket | Male | Female |
| Under 5 Years | 186 (4.3%) | 363 (7.0%) |
| 5 to 9 Years | 133 (3.1%) | 187 (3.6%) |
| 10 to 14 Years | 160 (3.7%) | 94 (1.8%) |
| 15 to 19 Years | 211 (4.9%) | 277 (5.3%) |
| 20 to 24 Years | 368 (8.6%) | 476 (9.2%) |
| 25 to 29 Years | 774 (18.1%) | 897 (17.3%) |
| 30 to 34 Years | 482 (11.3%) | 467 (9.0%) |
| 35 to 39 Years | 178 (4.2%) | 311 (6.0%) |
| 40 to 44 Years | 236 (5.5%) | 168 (3.2%) |
| 45 to 49 Years | 163 (3.8%) | 201 (3.9%) |
| 50 to 54 Years | 187 (4.4%) | 217 (4.2%) |
| 55 to 59 Years | 193 (4.5%) | 225 (4.3%) |
| 60 to 64 Years | 285 (6.7%) | 207 (4.0%) |
| 65 to 69 Years | 148 (3.5%) | 379 (7.3%) |
| 70 to 74 Years | 201 (4.7%) | 312 (6.0%) |
| 75 to 79 Years | 149 (3.5%) | 127 (2.4%) |
| 80 to 84 Years | 52 (1.2%) | 83 (1.6%) |
| 85 Years and over | 175 (4.1%) | 207 (4.0%) |
| Total | 4,281 (100.0%) | 5,198 (100.0%) |
Families and Households in The Village
Median Family Size in The Village
The median family size in The Village is 2.60 persons per family, with married-couple families (1,410 | 63.3%) accounting for the largest median family size of 2.73 persons per family. On the other hand, single male/father families (182 | 8.2%) represent the smallest median family size with 2.00 persons per family.
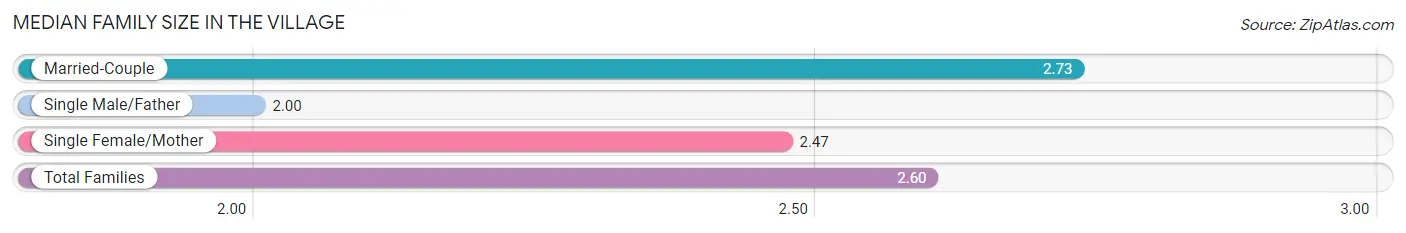
| Family Type | # Families | Family Size |
| Married-Couple | 1,410 (63.3%) | 2.73 |
| Single Male/Father | 182 (8.2%) | 2.00 |
| Single Female/Mother | 635 (28.5%) | 2.47 |
| Total Families | 2,227 (100.0%) | 2.60 |
Median Household Size in The Village
The median household size in The Village is 1.98 persons per household, with married-couple households (1,410 | 29.7%) accounting for the largest median household size of 2.76 persons per household. non-family households (2,522 | 53.1%) represent the smallest median household size with 1.33 persons per household.
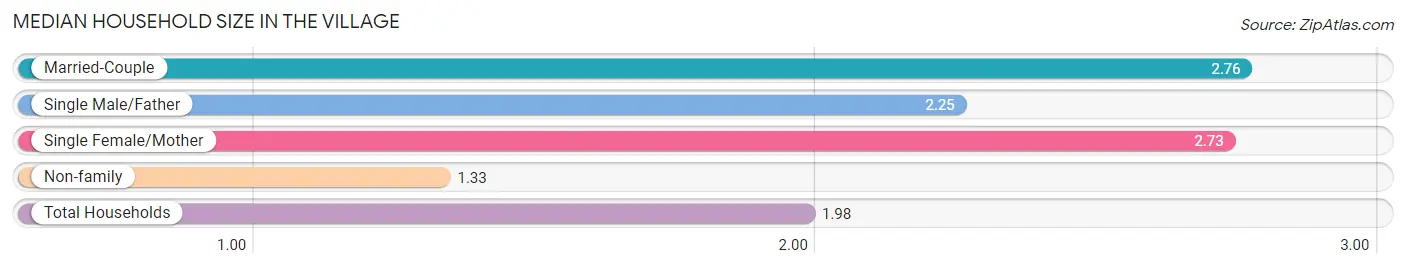
| Household Type | # Households | Household Size |
| Married-Couple | 1,410 (29.7%) | 2.76 |
| Single Male/Father | 182 (3.8%) | 2.25 |
| Single Female/Mother | 635 (13.4%) | 2.73 |
| Non-family | 2,522 (53.1%) | 1.33 |
| Total Households | 4,749 (100.0%) | 1.98 |
Household Size by Marriage Status in The Village
Out of a total of 4,749 households in The Village, 2,227 (46.9%) are family households, while 2,522 (53.1%) are nonfamily households. The most numerous type of family households are 2-person households, comprising 1,244, and the most common type of nonfamily households are 1-person households, comprising 1,897.
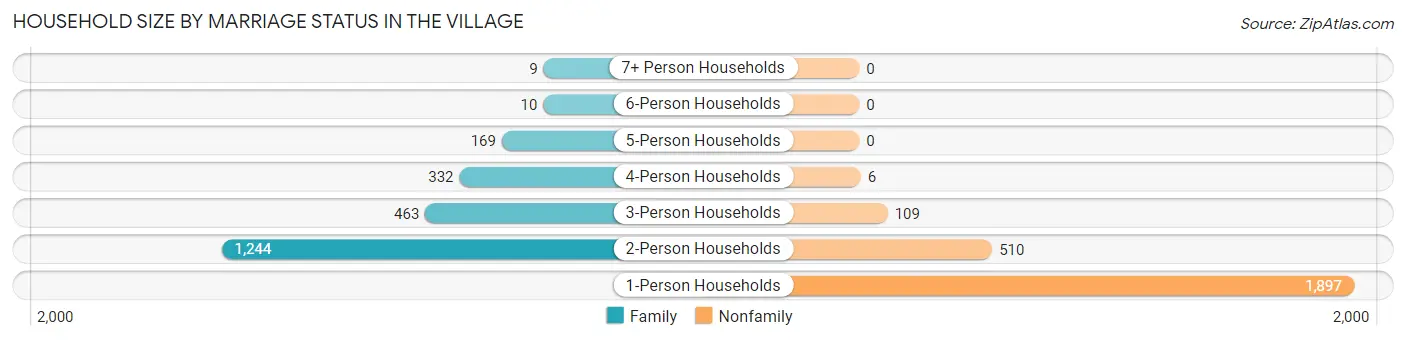
| Household Size | Family Households | Nonfamily Households |
| 1-Person Households | - | 1,897 (40.0%) |
| 2-Person Households | 1,244 (26.2%) | 510 (10.7%) |
| 3-Person Households | 463 (9.8%) | 109 (2.3%) |
| 4-Person Households | 332 (7.0%) | 6 (0.1%) |
| 5-Person Households | 169 (3.6%) | 0 (0.0%) |
| 6-Person Households | 10 (0.2%) | 0 (0.0%) |
| 7+ Person Households | 9 (0.2%) | 0 (0.0%) |
| Total | 2,227 (46.9%) | 2,522 (53.1%) |
Female Fertility in The Village
Fertility by Age in The Village
Average fertility rate in The Village is 43.0 births per 1,000 women. Women in the age bracket of 20 to 34 years have the highest fertility rate with 65.0 births per 1,000 women. Women in the age bracket of 20 to 34 years acount for 100.0% of all women with births.
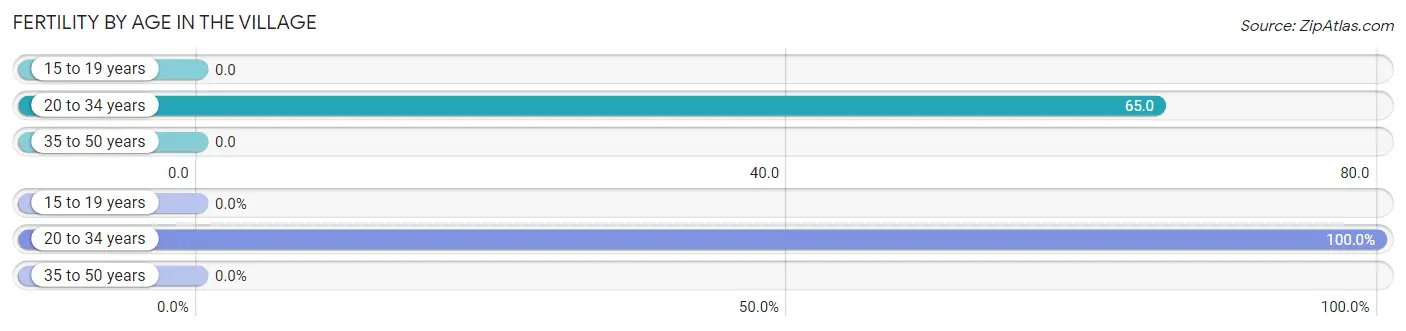
| Age Bracket | Women with Births | Births / 1,000 Women |
| 15 to 19 years | 0 (0.0%) | 0.0 |
| 20 to 34 years | 120 (100.0%) | 65.0 |
| 35 to 50 years | 0 (0.0%) | 0.0 |
| Total | 120 (100.0%) | 43.0 |
Fertility by Age by Marriage Status in The Village
80.8% of women with births (120) in The Village are married. The highest percentage of unmarried women with births falls into 20 to 34 years age bracket with 19.2% of them unmarried at the time of birth, while the lowest percentage of unmarried women with births belong to 20 to 34 years age bracket with 19.2% of them unmarried.
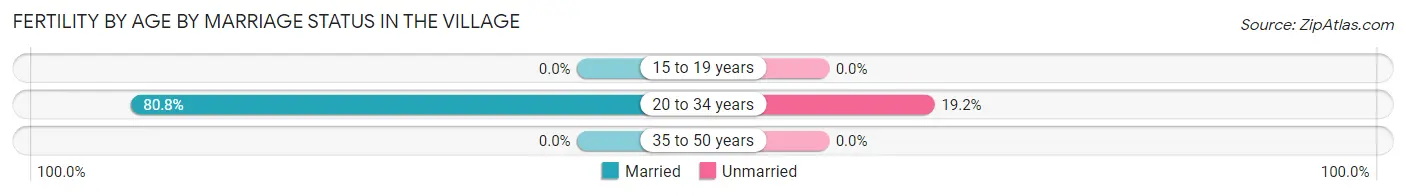
| Age Bracket | Married | Unmarried |
| 15 to 19 years | 0 (0.0%) | 0 (0.0%) |
| 20 to 34 years | 97 (80.8%) | 23 (19.2%) |
| 35 to 50 years | 0 (0.0%) | 0 (0.0%) |
| Total | 97 (80.8%) | 23 (19.2%) |
Fertility by Education in The Village
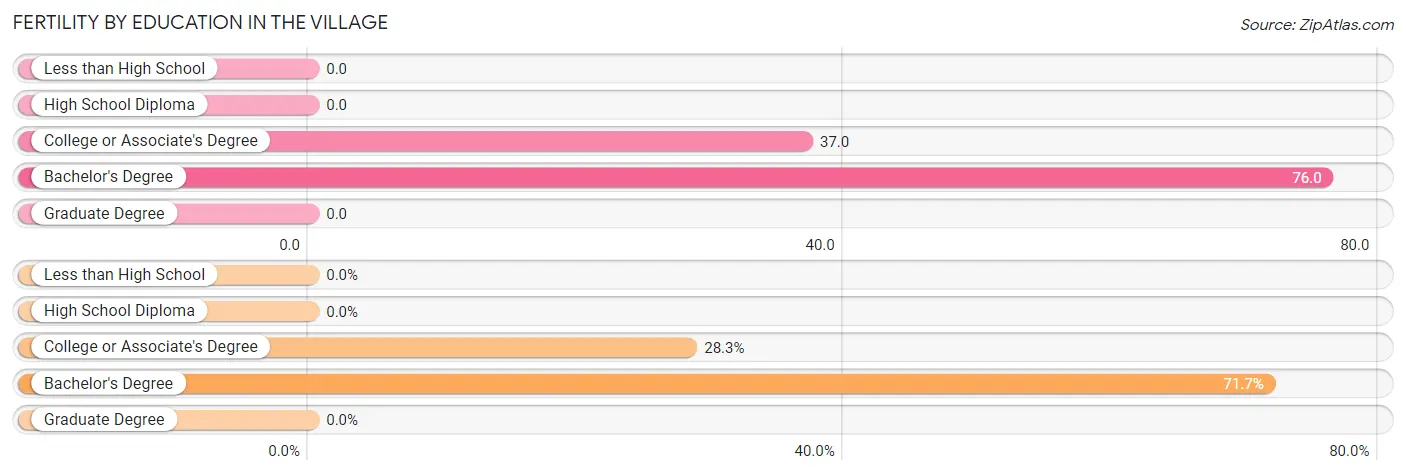
| Educational Attainment | Women with Births | Births / 1,000 Women |
| Less than High School | 0 (0.0%) | 0.0 |
| High School Diploma | 0 (0.0%) | 0.0 |
| College or Associate's Degree | 34 (28.3%) | 37.0 |
| Bachelor's Degree | 86 (71.7%) | 76.0 |
| Graduate Degree | 0 (0.0%) | 0.0 |
| Total | 120 (100.0%) | 43.0 |
Fertility by Education by Marriage Status in The Village
19.2% of women with births in The Village are unmarried. Women with the educational attainment of bachelor's degree are most likely to be married with 100.0% of them married at childbirth, while women with the educational attainment of college or associate's degree are least likely to be married with 67.6% of them unmarried at childbirth.
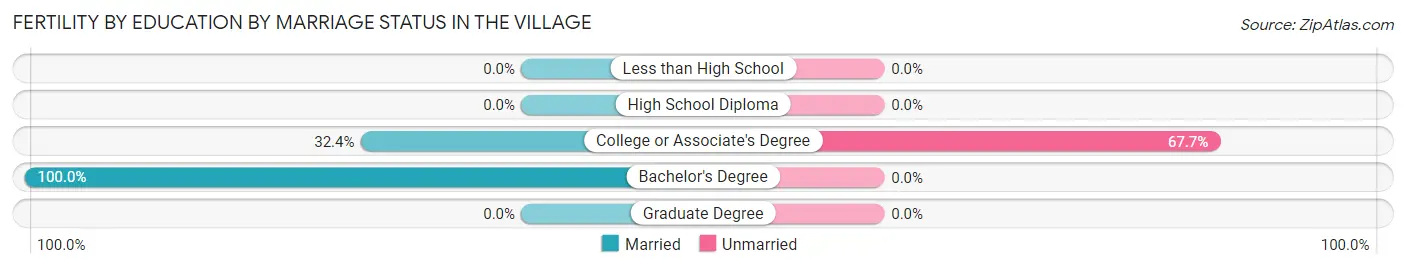
| Educational Attainment | Married | Unmarried |
| Less than High School | 0 (0.0%) | 0 (0.0%) |
| High School Diploma | 0 (0.0%) | 0 (0.0%) |
| College or Associate's Degree | 11 (32.4%) | 23 (67.6%) |
| Bachelor's Degree | 86 (100.0%) | 0 (0.0%) |
| Graduate Degree | 0 (0.0%) | 0 (0.0%) |
| Total | 97 (80.8%) | 23 (19.2%) |
Income in The Village
Income Overview in The Village
Per Capita Income in The Village is $42,597, while median incomes of families and households are $87,240 and $67,524 respectively.
| Characteristic | Number | Measure |
| Per Capita Income | 9,479 | $42,597 |
| Median Family Income | 2,227 | $87,240 |
| Mean Family Income | 2,227 | $103,929 |
| Median Household Income | 4,749 | $67,524 |
| Mean Household Income | 4,749 | $84,912 |
| Income Deficit | 2,227 | $7,751 |
| Wage / Income Gap (%) | 9,479 | 6.81% |
| Wage / Income Gap ($) | 9,479 | 93.19¢ per $1 |
| Gini / Inequality Index | 9,479 | 0.42 |
Earnings by Sex in The Village
Average Earnings in The Village are $42,997, $44,767 for men and $41,717 for women, a difference of 6.8%.
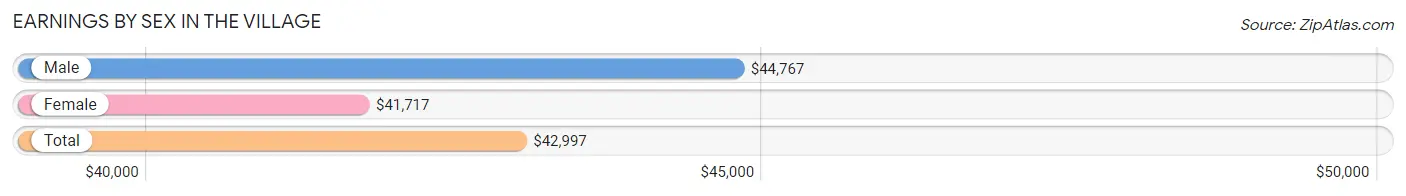
| Sex | Number | Average Earnings |
| Male | 2,930 (47.5%) | $44,767 |
| Female | 3,240 (52.5%) | $41,717 |
| Total | 6,170 (100.0%) | $42,997 |
Earnings by Sex by Income Bracket in The Village
The most common earnings brackets in The Village are $75,000 to $99,999 for men (408 | 13.9%) and $55,000 to $64,999 for women (409 | 12.6%).
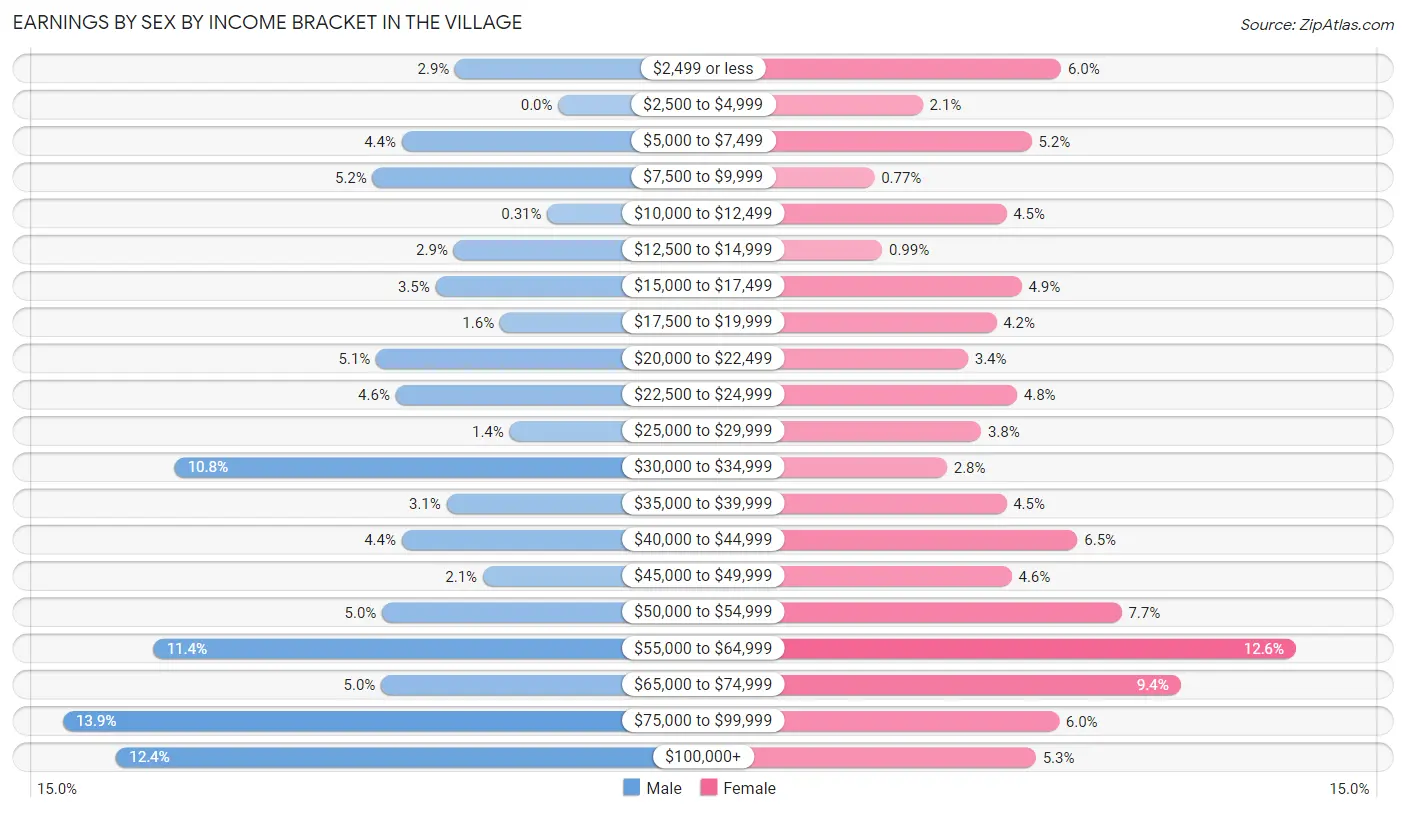
| Income | Male | Female |
| $2,499 or less | 85 (2.9%) | 195 (6.0%) |
| $2,500 to $4,999 | 0 (0.0%) | 69 (2.1%) |
| $5,000 to $7,499 | 129 (4.4%) | 168 (5.2%) |
| $7,500 to $9,999 | 153 (5.2%) | 25 (0.8%) |
| $10,000 to $12,499 | 9 (0.3%) | 145 (4.5%) |
| $12,500 to $14,999 | 86 (2.9%) | 32 (1.0%) |
| $15,000 to $17,499 | 101 (3.5%) | 159 (4.9%) |
| $17,500 to $19,999 | 48 (1.6%) | 136 (4.2%) |
| $20,000 to $22,499 | 150 (5.1%) | 110 (3.4%) |
| $22,500 to $24,999 | 134 (4.6%) | 155 (4.8%) |
| $25,000 to $29,999 | 40 (1.4%) | 122 (3.8%) |
| $30,000 to $34,999 | 316 (10.8%) | 91 (2.8%) |
| $35,000 to $39,999 | 92 (3.1%) | 145 (4.5%) |
| $40,000 to $44,999 | 129 (4.4%) | 210 (6.5%) |
| $45,000 to $49,999 | 62 (2.1%) | 150 (4.6%) |
| $50,000 to $54,999 | 145 (5.0%) | 250 (7.7%) |
| $55,000 to $64,999 | 333 (11.4%) | 409 (12.6%) |
| $65,000 to $74,999 | 146 (5.0%) | 304 (9.4%) |
| $75,000 to $99,999 | 408 (13.9%) | 193 (6.0%) |
| $100,000+ | 364 (12.4%) | 172 (5.3%) |
| Total | 2,930 (100.0%) | 3,240 (100.0%) |
Earnings by Sex by Educational Attainment in The Village
Average earnings in The Village are $54,425 for men and $47,361 for women, a difference of 13.0%. Men with an educational attainment of graduate degree enjoy the highest average annual earnings of $84,375, while those with high school diploma education earn the least with $35,714. Women with an educational attainment of graduate degree earn the most with the average annual earnings of $68,426, while those with high school diploma education have the smallest earnings of $34,667.
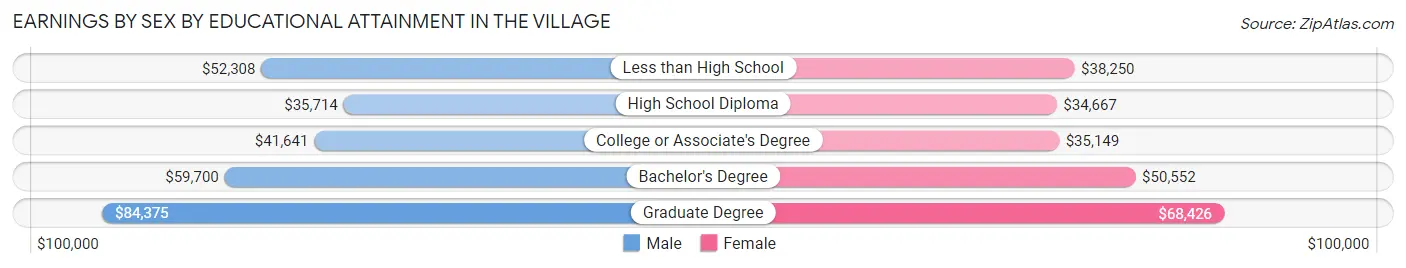
| Educational Attainment | Male Income | Female Income |
| Less than High School | $52,308 | $38,250 |
| High School Diploma | $35,714 | $34,667 |
| College or Associate's Degree | $41,641 | $35,149 |
| Bachelor's Degree | $59,700 | $50,552 |
| Graduate Degree | $84,375 | $68,426 |
| Total | $54,425 | $47,361 |
Family Income in The Village
Family Income Brackets in The Village
According to the The Village family income data, there are 572 families falling into the $100,000 to $149,999 income range, which is the most common income bracket and makes up 25.7% of all families. Conversely, the $10,000 to $14,999 income bracket is the least frequent group with only 38 families (1.7%) belonging to this category.
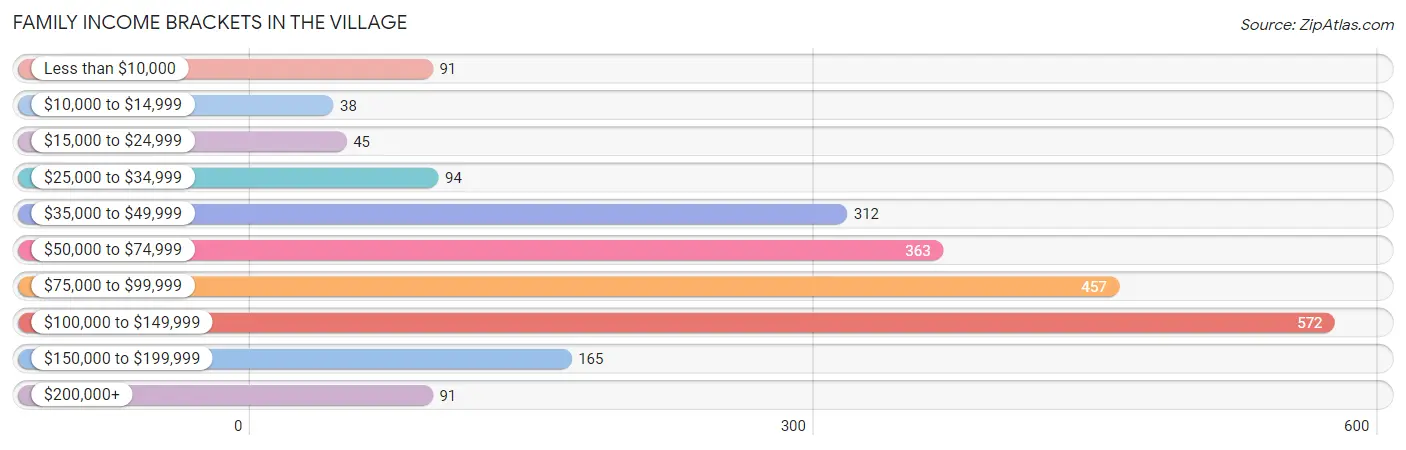
| Income Bracket | # Families | % Families |
| Less than $10,000 | 91 | 4.1% |
| $10,000 to $14,999 | 38 | 1.7% |
| $15,000 to $24,999 | 45 | 2.0% |
| $25,000 to $34,999 | 94 | 4.2% |
| $35,000 to $49,999 | 312 | 14.0% |
| $50,000 to $74,999 | 363 | 16.3% |
| $75,000 to $99,999 | 457 | 20.5% |
| $100,000 to $149,999 | 572 | 25.7% |
| $150,000 to $199,999 | 165 | 7.4% |
| $200,000+ | 91 | 4.1% |
Family Income by Famaliy Size in The Village
3-person families (338 | 15.2%) account for the highest median family income in The Village with $107,500 per family, while 2-person families (1,440 | 64.7%) have the highest median income of $37,875 per family member.
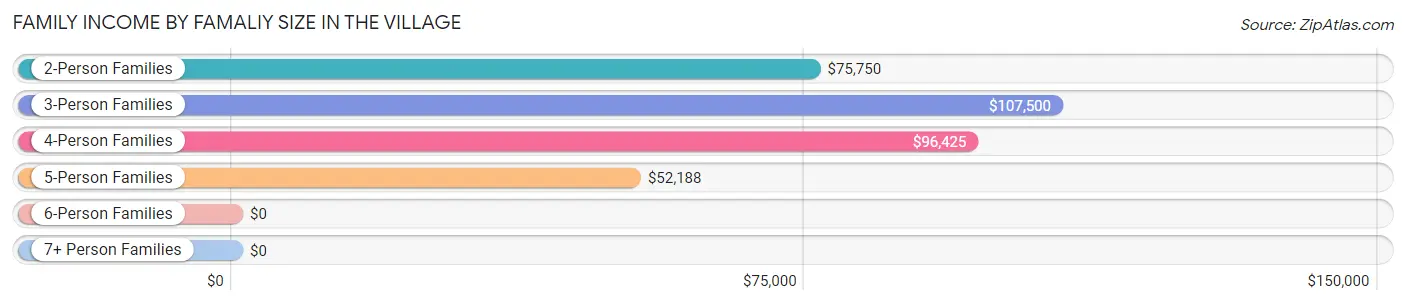
| Income Bracket | # Families | Median Income |
| 2-Person Families | 1,440 (64.7%) | $75,750 |
| 3-Person Families | 338 (15.2%) | $107,500 |
| 4-Person Families | 261 (11.7%) | $96,425 |
| 5-Person Families | 169 (7.6%) | $52,188 |
| 6-Person Families | 10 (0.4%) | $0 |
| 7+ Person Families | 9 (0.4%) | $0 |
| Total | 2,227 (100.0%) | $87,240 |
Family Income by Number of Earners in The Village
The median family income in The Village is $87,240, with families comprising 2 earners (1,088) having the highest median family income of $108,558, while families with no earners (290) have the lowest median family income of $48,750, accounting for 48.8% and 13.0% of families, respectively.
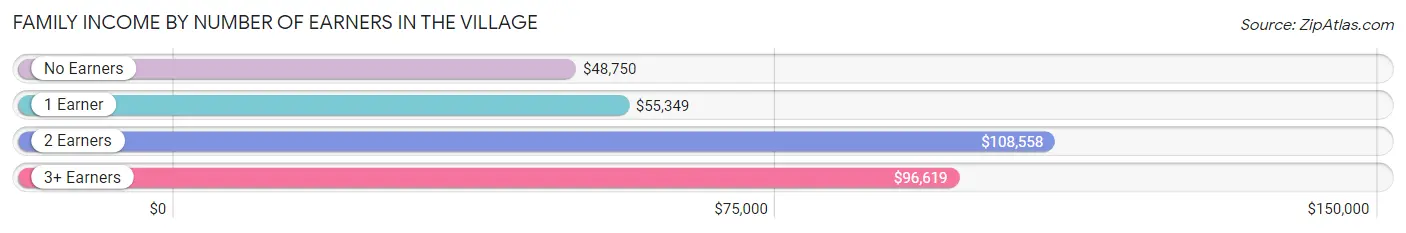
| Number of Earners | # Families | Median Income |
| No Earners | 290 (13.0%) | $48,750 |
| 1 Earner | 667 (29.9%) | $55,349 |
| 2 Earners | 1,088 (48.8%) | $108,558 |
| 3+ Earners | 182 (8.2%) | $96,619 |
| Total | 2,227 (100.0%) | $87,240 |
Household Income in The Village
Household Income Brackets in The Village
With 912 households falling in the category, the $100,000 to $149,999 income range is the most frequent in The Village, accounting for 19.2% of all households. In contrast, only 138 households (2.9%) fall into the $10,000 to $14,999 income bracket, making it the least populous group.
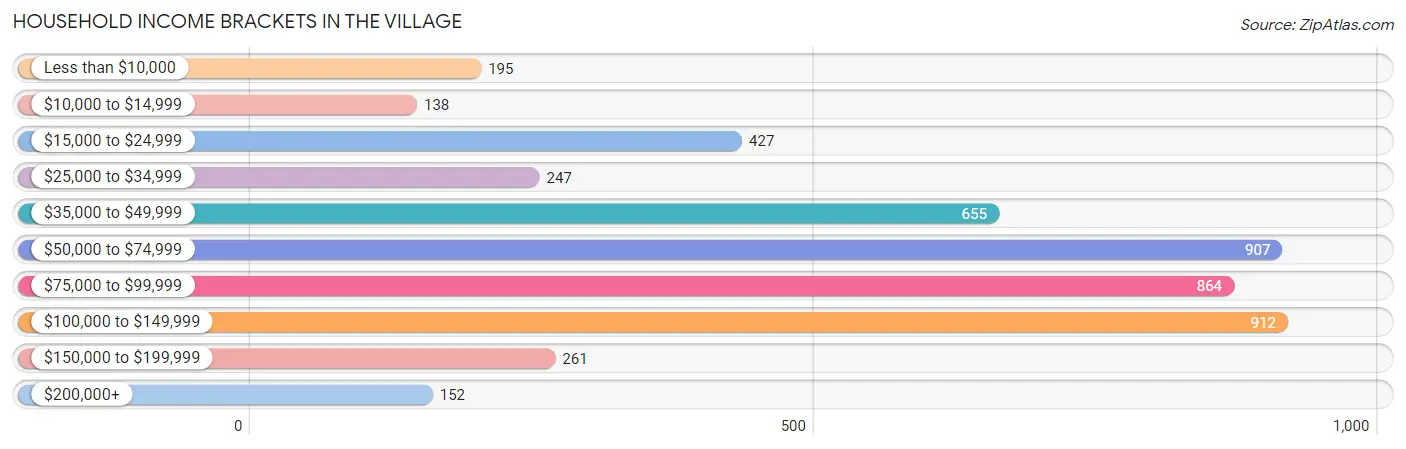
| Income Bracket | # Households | % Households |
| Less than $10,000 | 195 | 4.1% |
| $10,000 to $14,999 | 138 | 2.9% |
| $15,000 to $24,999 | 427 | 9.0% |
| $25,000 to $34,999 | 247 | 5.2% |
| $35,000 to $49,999 | 655 | 13.8% |
| $50,000 to $74,999 | 907 | 19.1% |
| $75,000 to $99,999 | 864 | 18.2% |
| $100,000 to $149,999 | 912 | 19.2% |
| $150,000 to $199,999 | 261 | 5.5% |
| $200,000+ | 152 | 3.2% |
Household Income by Householder Age in The Village
The median household income in The Village is $67,524, with the highest median household income of $86,786 found in the 25 to 44 years age bracket for the primary householder. A total of 1,958 households (41.2%) fall into this category. Meanwhile, the 15 to 24 years age bracket for the primary householder has the lowest median household income of $0, with 465 households (9.8%) in this group.
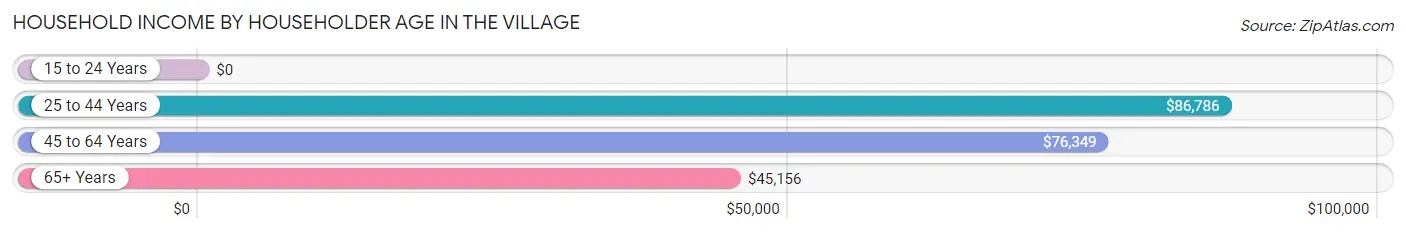
| Income Bracket | # Households | Median Income |
| 15 to 24 Years | 465 (9.8%) | $0 |
| 25 to 44 Years | 1,958 (41.2%) | $86,786 |
| 45 to 64 Years | 1,051 (22.1%) | $76,349 |
| 65+ Years | 1,275 (26.9%) | $45,156 |
| Total | 4,749 (100.0%) | $67,524 |
Poverty in The Village
Income Below Poverty by Sex and Age in The Village
With 14.6% poverty level for males and 11.1% for females among the residents of The Village, 12 to 14 year old males and 6 to 11 year old females are the most vulnerable to poverty, with 52 males (69.3%) and 61 females (43.0%) in their respective age groups living below the poverty level.
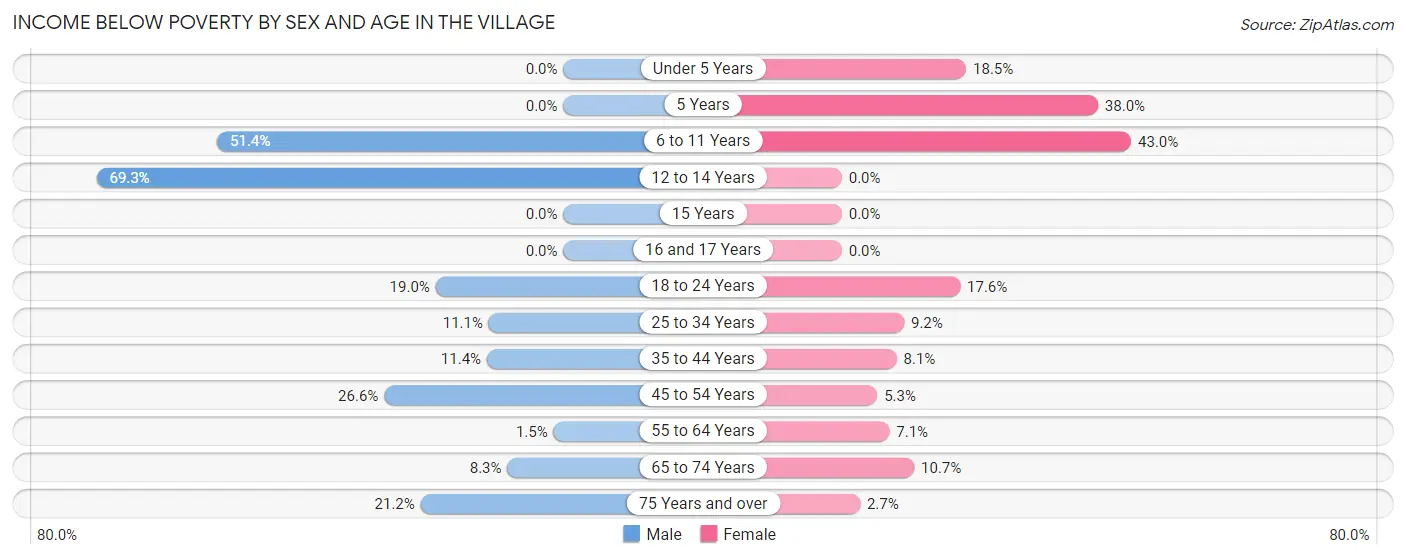
| Age Bracket | Male | Female |
| Under 5 Years | 0 (0.0%) | 67 (18.5%) |
| 5 Years | 0 (0.0%) | 27 (38.0%) |
| 6 to 11 Years | 91 (51.4%) | 61 (43.0%) |
| 12 to 14 Years | 52 (69.3%) | 0 (0.0%) |
| 15 Years | 0 (0.0%) | 0 (0.0%) |
| 16 and 17 Years | 0 (0.0%) | 0 (0.0%) |
| 18 to 24 Years | 91 (19.0%) | 114 (17.6%) |
| 25 to 34 Years | 139 (11.1%) | 126 (9.2%) |
| 35 to 44 Years | 47 (11.4%) | 39 (8.1%) |
| 45 to 54 Years | 91 (26.6%) | 22 (5.3%) |
| 55 to 64 Years | 7 (1.5%) | 29 (7.1%) |
| 65 to 74 Years | 29 (8.3%) | 73 (10.7%) |
| 75 Years and over | 78 (21.2%) | 10 (2.7%) |
| Total | 625 (14.6%) | 568 (11.1%) |
Income Above Poverty by Sex and Age in The Village
According to the poverty statistics in The Village, males aged under 5 years and females aged 12 to 14 years are the age groups that are most secure financially, with 100.0% of males and 100.0% of females in these age groups living above the poverty line.
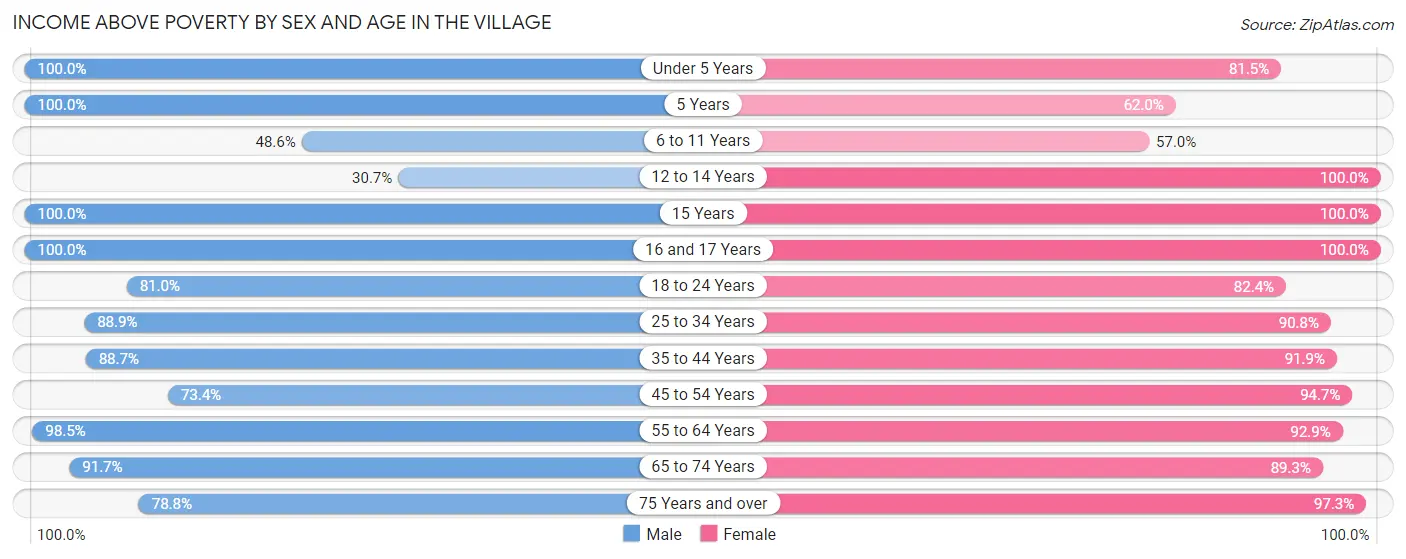
| Age Bracket | Male | Female |
| Under 5 Years | 186 (100.0%) | 296 (81.5%) |
| 5 Years | 41 (100.0%) | 44 (62.0%) |
| 6 to 11 Years | 86 (48.6%) | 81 (57.0%) |
| 12 to 14 Years | 23 (30.7%) | 58 (100.0%) |
| 15 Years | 6 (100.0%) | 30 (100.0%) |
| 16 and 17 Years | 93 (100.0%) | 74 (100.0%) |
| 18 to 24 Years | 389 (81.0%) | 535 (82.4%) |
| 25 to 34 Years | 1,117 (88.9%) | 1,238 (90.8%) |
| 35 to 44 Years | 367 (88.6%) | 440 (91.9%) |
| 45 to 54 Years | 251 (73.4%) | 396 (94.7%) |
| 55 to 64 Years | 471 (98.5%) | 382 (92.9%) |
| 65 to 74 Years | 320 (91.7%) | 607 (89.3%) |
| 75 Years and over | 290 (78.8%) | 361 (97.3%) |
| Total | 3,640 (85.4%) | 4,542 (88.9%) |
Income Below Poverty Among Married-Couple Families in The Village
The poverty statistics for married-couple families in The Village show that 2.9% or 41 of the total 1,410 families live below the poverty line. Families with 3 or 4 children have the highest poverty rate of 34.7%, comprising of 33 families. On the other hand, families with 5 or more children have the lowest poverty rate of 0.0%, which includes 0 families.
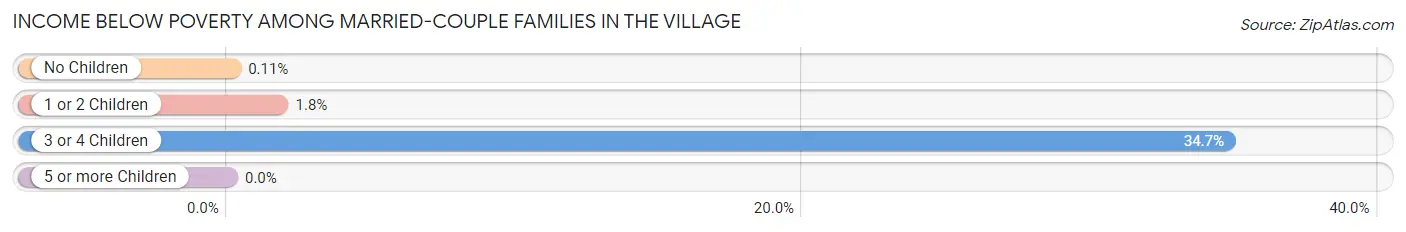
| Children | Above Poverty | Below Poverty |
| No Children | 908 (99.9%) | 1 (0.1%) |
| 1 or 2 Children | 390 (98.2%) | 7 (1.8%) |
| 3 or 4 Children | 62 (65.3%) | 33 (34.7%) |
| 5 or more Children | 9 (100.0%) | 0 (0.0%) |
| Total | 1,369 (97.1%) | 41 (2.9%) |
Income Below Poverty Among Single-Parent Households in The Village
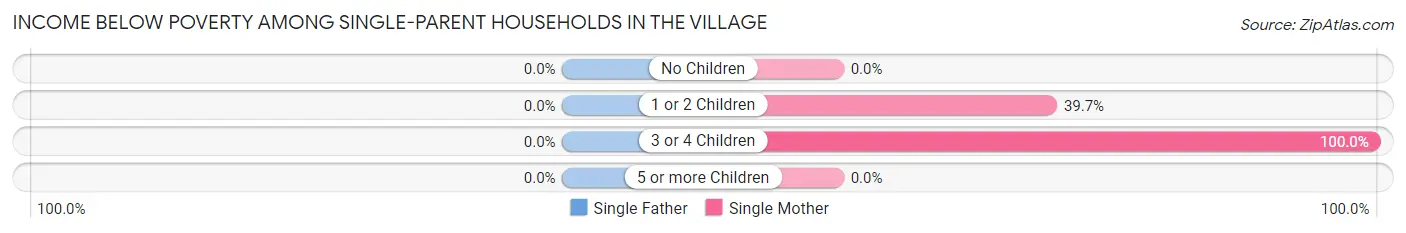
| Children | Single Father | Single Mother |
| No Children | 0 (0.0%) | 0 (0.0%) |
| 1 or 2 Children | 0 (0.0%) | 149 (39.7%) |
| 3 or 4 Children | 0 (0.0%) | 18 (100.0%) |
| 5 or more Children | 0 (0.0%) | 0 (0.0%) |
| Total | 0 (0.0%) | 167 (26.3%) |
Income Below Poverty Among Married-Couple vs Single-Parent Households in The Village
The poverty data for The Village shows that 41 of the married-couple family households (2.9%) and 167 of the single-parent households (20.4%) are living below the poverty level. Within the married-couple family households, those with 3 or 4 children have the highest poverty rate, with 33 households (34.7%) falling below the poverty line. Among the single-parent households, those with 3 or 4 children have the highest poverty rate, with 18 household (100.0%) living below poverty.
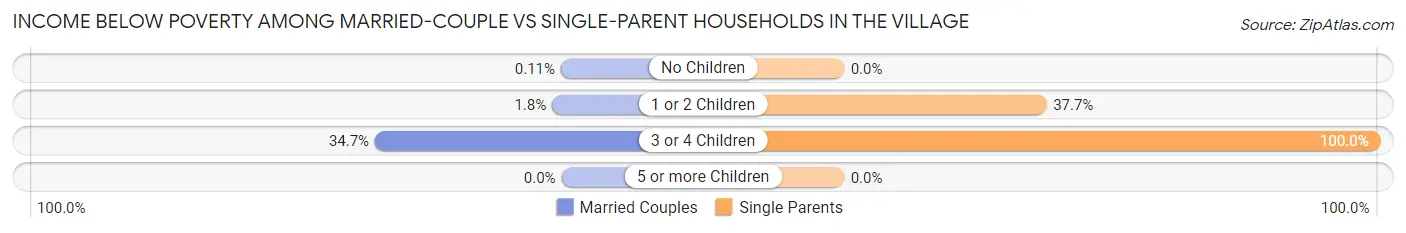
| Children | Married-Couple Families | Single-Parent Households |
| No Children | 1 (0.1%) | 0 (0.0%) |
| 1 or 2 Children | 7 (1.8%) | 149 (37.7%) |
| 3 or 4 Children | 33 (34.7%) | 18 (100.0%) |
| 5 or more Children | 0 (0.0%) | 0 (0.0%) |
| Total | 41 (2.9%) | 167 (20.4%) |
Employment Characteristics in The Village
Employment by Class of Employer in The Village
Among the 5,786 employed individuals in The Village, private company employees (3,617 | 62.5%), not-for-profit organizations (648 | 11.2%), and state government employees (569 | 9.8%) make up the most common classes of employment.
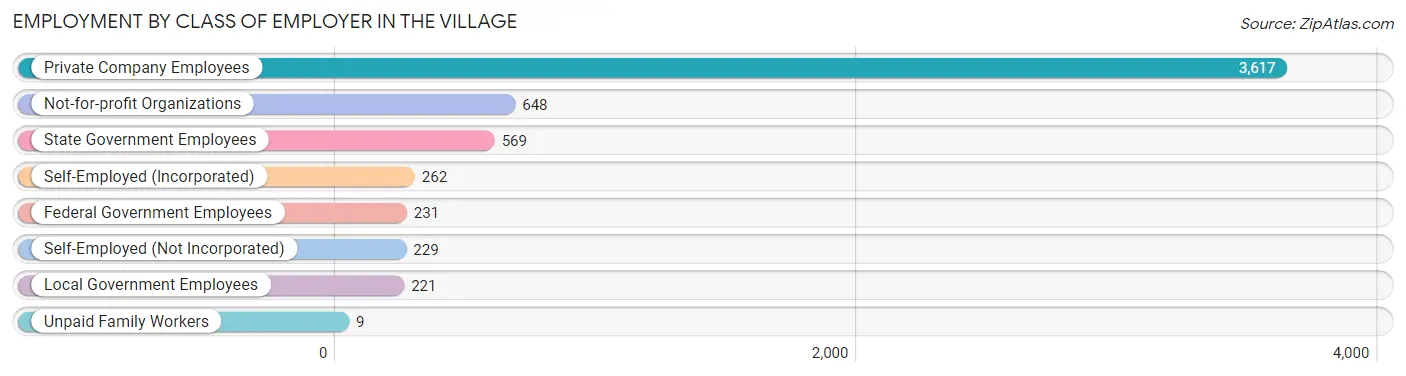
| Employer Class | # Employees | % Employees |
| Private Company Employees | 3,617 | 62.5% |
| Self-Employed (Incorporated) | 262 | 4.5% |
| Self-Employed (Not Incorporated) | 229 | 4.0% |
| Not-for-profit Organizations | 648 | 11.2% |
| Local Government Employees | 221 | 3.8% |
| State Government Employees | 569 | 9.8% |
| Federal Government Employees | 231 | 4.0% |
| Unpaid Family Workers | 9 | 0.2% |
| Total | 5,786 | 100.0% |
Employment Status by Age in The Village
According to the labor force statistics for The Village, out of the total population over 16 years of age (8,320), 72.4% or 6,024 individuals are in the labor force, with 2.1% or 127 of them unemployed. The age group with the highest labor force participation rate is 25 to 29 years, with 92.8% or 1,551 individuals in the labor force. Within the labor force, the 65 to 74 years age range has the highest percentage of unemployed individuals, with 9.0% or 35 of them being unemployed.
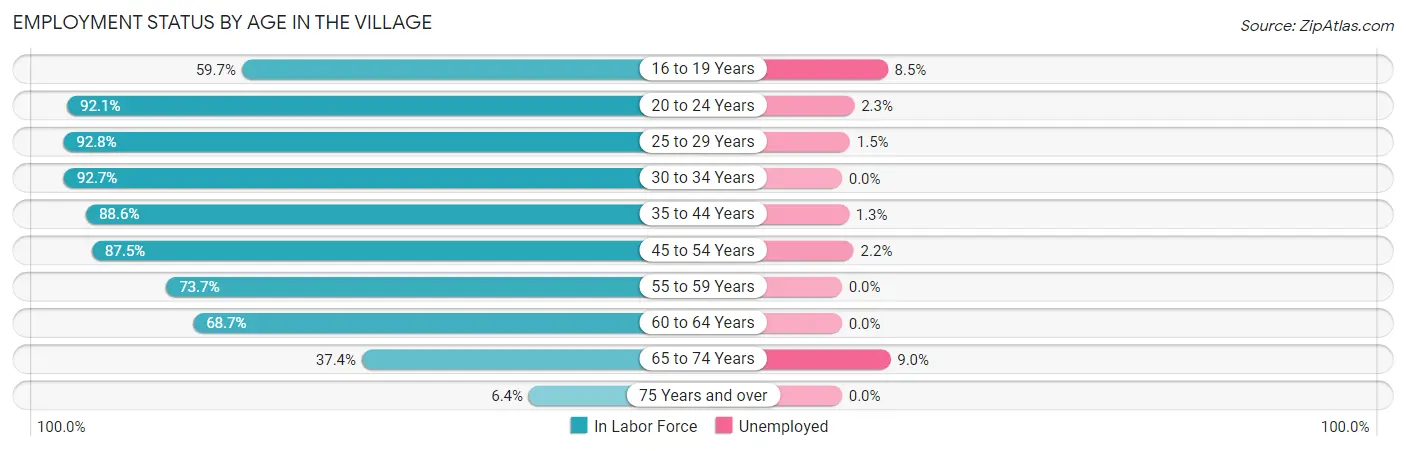
| Age Bracket | In Labor Force | Unemployed |
| 16 to 19 Years | 270 (59.7%) | 23 (8.5%) |
| 20 to 24 Years | 777 (92.1%) | 18 (2.3%) |
| 25 to 29 Years | 1,551 (92.8%) | 23 (1.5%) |
| 30 to 34 Years | 880 (92.7%) | 0 (0.0%) |
| 35 to 44 Years | 791 (88.6%) | 10 (1.3%) |
| 45 to 54 Years | 672 (87.5%) | 15 (2.2%) |
| 55 to 59 Years | 308 (73.7%) | 0 (0.0%) |
| 60 to 64 Years | 338 (68.7%) | 0 (0.0%) |
| 65 to 74 Years | 389 (37.4%) | 35 (9.0%) |
| 75 Years and over | 51 (6.4%) | 0 (0.0%) |
| Total | 6,024 (72.4%) | 127 (2.1%) |
Employment Status by Educational Attainment in The Village
According to labor force statistics for The Village, 87.4% of individuals (4,537) out of the total population between 25 and 64 years of age (5,191) are in the labor force, with 1.1% or 50 of them being unemployed. The group with the highest labor force participation rate are those with the educational attainment of bachelor's degree or higher, with 93.3% or 2,483 individuals in the labor force. Within the labor force, individuals with high school diploma education have the highest percentage of unemployment, with 6.0% or 35 of them being unemployed.
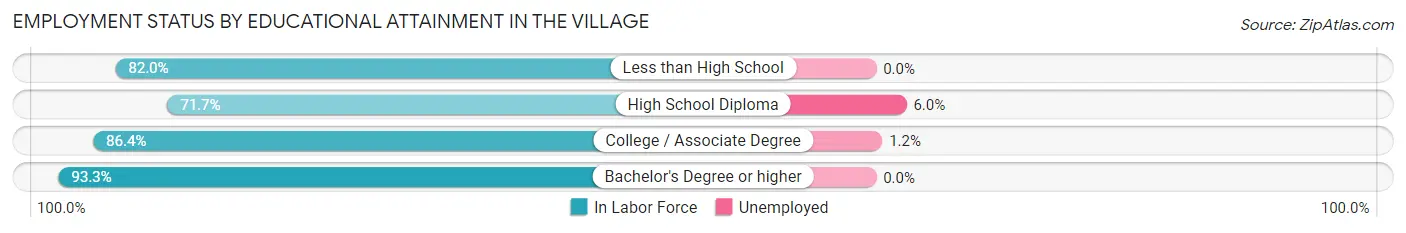
| Educational Attainment | In Labor Force | Unemployed |
| Less than High School | 182 (82.0%) | 0 (0.0%) |
| High School Diploma | 587 (71.7%) | 49 (6.0%) |
| College / Associate Degree | 1,286 (86.4%) | 18 (1.2%) |
| Bachelor's Degree or higher | 2,483 (93.3%) | 0 (0.0%) |
| Total | 4,537 (87.4%) | 57 (1.1%) |
Employment Occupations by Sex in The Village
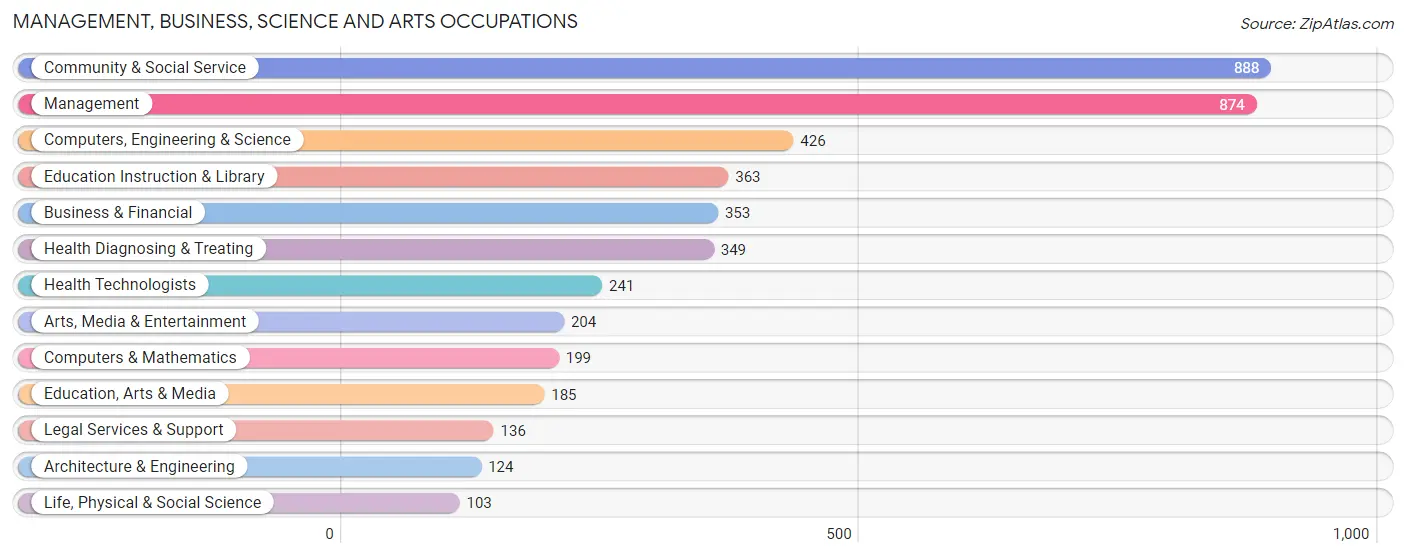
Management, Business, Science and Arts Occupations
The most common Management, Business, Science and Arts occupations in The Village are Community & Social Service (888 | 15.2%), Management (874 | 15.0%), Computers, Engineering & Science (426 | 7.3%), Education Instruction & Library (363 | 6.2%), and Business & Financial (353 | 6.0%).
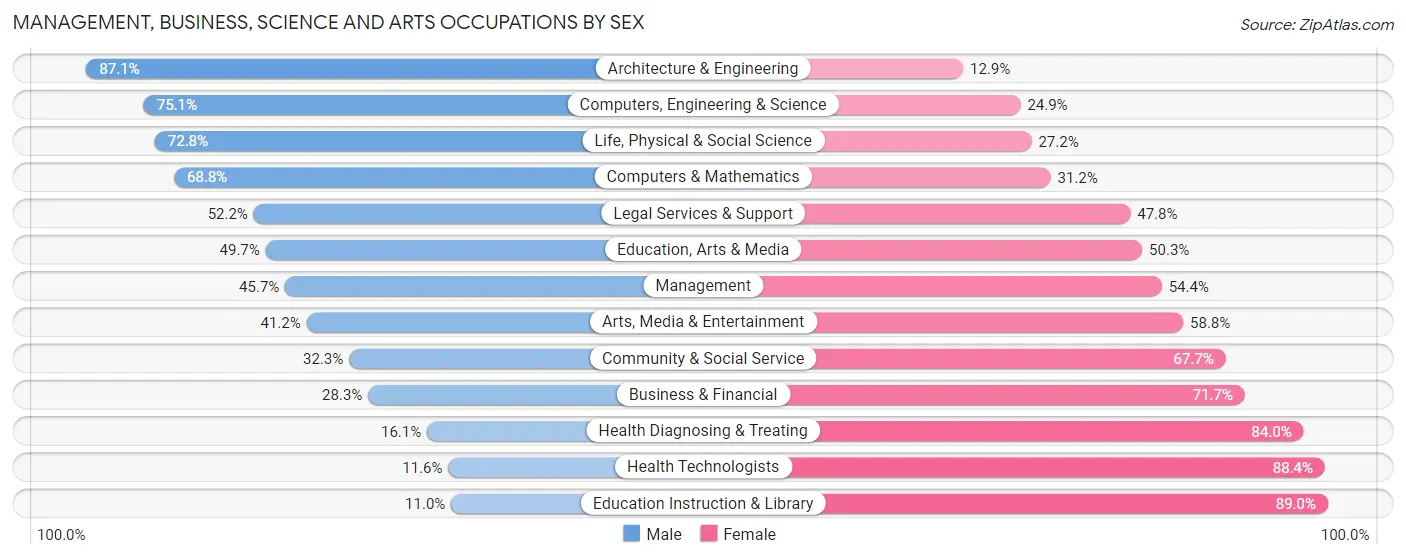
Management, Business, Science and Arts Occupations by Sex
Within the Management, Business, Science and Arts occupations in The Village, the most male-oriented occupations are Architecture & Engineering (87.1%), Computers, Engineering & Science (75.1%), and Life, Physical & Social Science (72.8%), while the most female-oriented occupations are Education Instruction & Library (89.0%), Health Technologists (88.4%), and Health Diagnosing & Treating (84.0%).
| Occupation | Male | Female |
| Management | 399 (45.7%) | 475 (54.3%) |
| Business & Financial | 100 (28.3%) | 253 (71.7%) |
| Computers, Engineering & Science | 320 (75.1%) | 106 (24.9%) |
| Computers & Mathematics | 137 (68.8%) | 62 (31.2%) |
| Architecture & Engineering | 108 (87.1%) | 16 (12.9%) |
| Life, Physical & Social Science | 75 (72.8%) | 28 (27.2%) |
| Community & Social Service | 287 (32.3%) | 601 (67.7%) |
| Education, Arts & Media | 92 (49.7%) | 93 (50.3%) |
| Legal Services & Support | 71 (52.2%) | 65 (47.8%) |
| Education Instruction & Library | 40 (11.0%) | 323 (89.0%) |
| Arts, Media & Entertainment | 84 (41.2%) | 120 (58.8%) |
| Health Diagnosing & Treating | 56 (16.1%) | 293 (84.0%) |
| Health Technologists | 28 (11.6%) | 213 (88.4%) |
| Total (Category) | 1,162 (40.2%) | 1,728 (59.8%) |
| Total (Overall) | 2,744 (47.0%) | 3,091 (53.0%) |
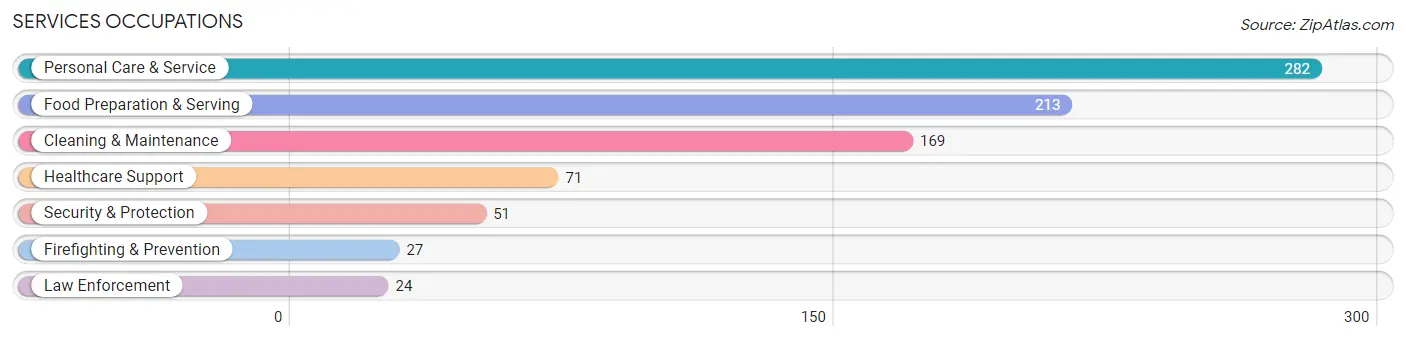
Services Occupations
The most common Services occupations in The Village are Personal Care & Service (282 | 4.8%), Food Preparation & Serving (213 | 3.6%), Cleaning & Maintenance (169 | 2.9%), Healthcare Support (71 | 1.2%), and Security & Protection (51 | 0.9%).
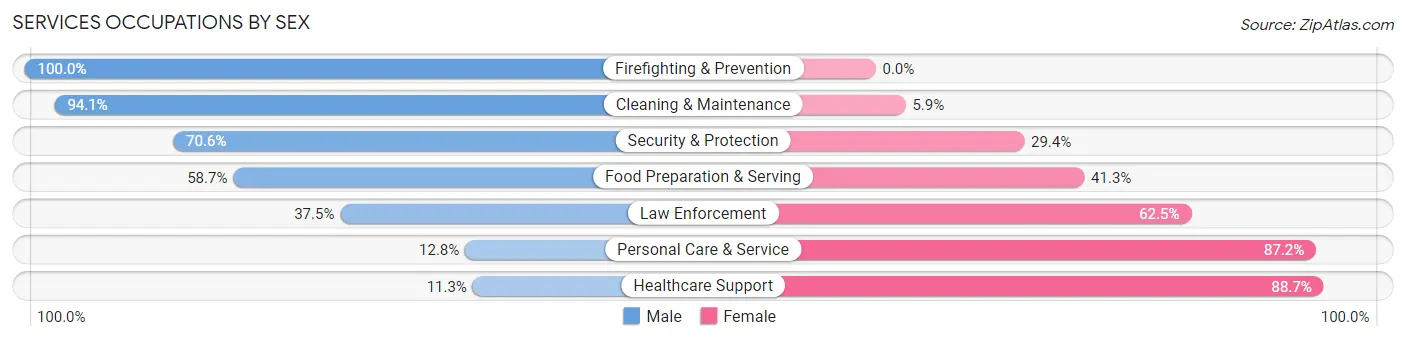
Services Occupations by Sex
Within the Services occupations in The Village, the most male-oriented occupations are Firefighting & Prevention (100.0%), Cleaning & Maintenance (94.1%), and Security & Protection (70.6%), while the most female-oriented occupations are Healthcare Support (88.7%), Personal Care & Service (87.2%), and Law Enforcement (62.5%).
| Occupation | Male | Female |
| Healthcare Support | 8 (11.3%) | 63 (88.7%) |
| Security & Protection | 36 (70.6%) | 15 (29.4%) |
| Firefighting & Prevention | 27 (100.0%) | 0 (0.0%) |
| Law Enforcement | 9 (37.5%) | 15 (62.5%) |
| Food Preparation & Serving | 125 (58.7%) | 88 (41.3%) |
| Cleaning & Maintenance | 159 (94.1%) | 10 (5.9%) |
| Personal Care & Service | 36 (12.8%) | 246 (87.2%) |
| Total (Category) | 364 (46.3%) | 422 (53.7%) |
| Total (Overall) | 2,744 (47.0%) | 3,091 (53.0%) |
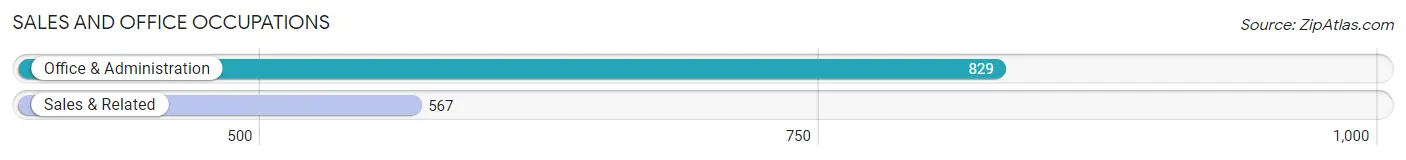
Sales and Office Occupations
The most common Sales and Office occupations in The Village are Office & Administration (829 | 14.2%), and Sales & Related (567 | 9.7%).
Sales and Office Occupations by Sex
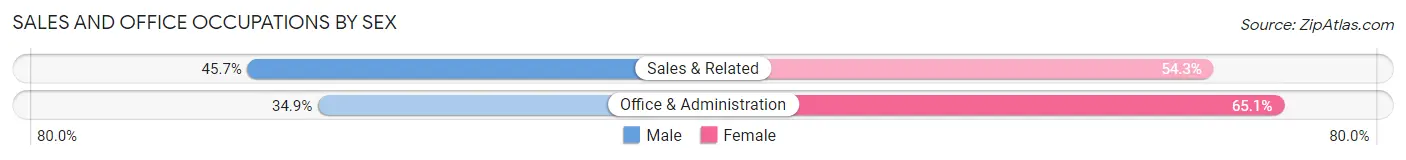
| Occupation | Male | Female |
| Sales & Related | 259 (45.7%) | 308 (54.3%) |
| Office & Administration | 289 (34.9%) | 540 (65.1%) |
| Total (Category) | 548 (39.3%) | 848 (60.7%) |
| Total (Overall) | 2,744 (47.0%) | 3,091 (53.0%) |
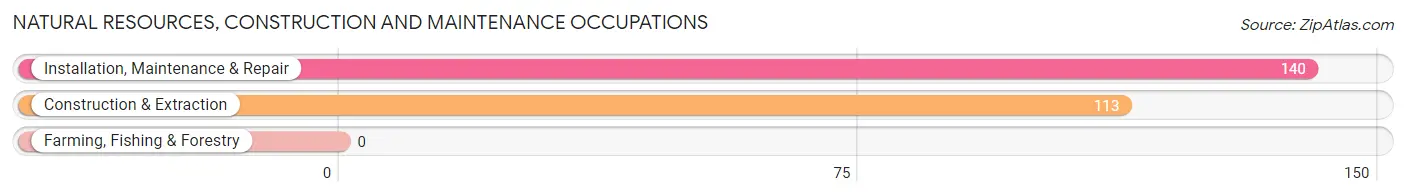
Natural Resources, Construction and Maintenance Occupations
The most common Natural Resources, Construction and Maintenance occupations in The Village are Installation, Maintenance & Repair (140 | 2.4%), and Construction & Extraction (113 | 1.9%).
Natural Resources, Construction and Maintenance Occupations by Sex
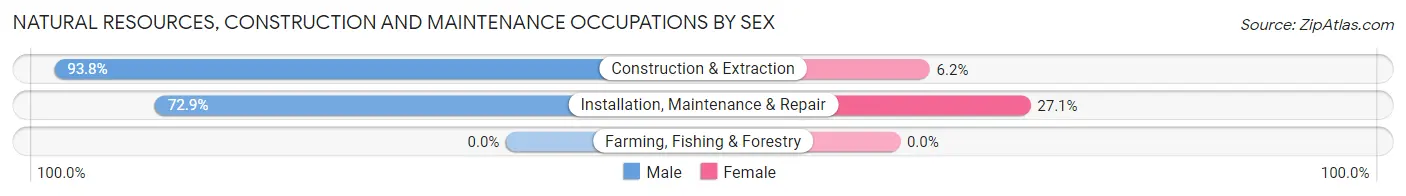
| Occupation | Male | Female |
| Farming, Fishing & Forestry | 0 (0.0%) | 0 (0.0%) |
| Construction & Extraction | 106 (93.8%) | 7 (6.2%) |
| Installation, Maintenance & Repair | 102 (72.9%) | 38 (27.1%) |
| Total (Category) | 208 (82.2%) | 45 (17.8%) |
| Total (Overall) | 2,744 (47.0%) | 3,091 (53.0%) |
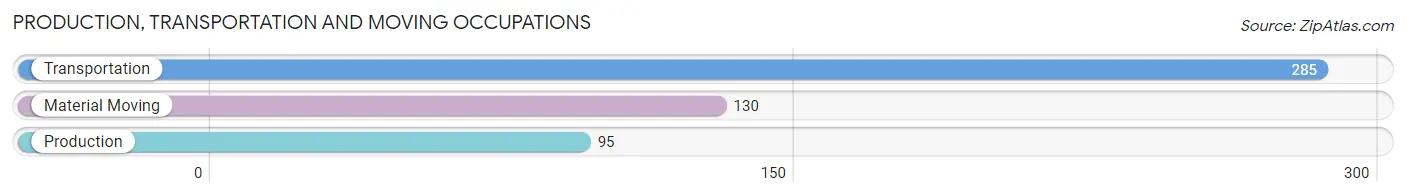
Production, Transportation and Moving Occupations
The most common Production, Transportation and Moving occupations in The Village are Transportation (285 | 4.9%), Material Moving (130 | 2.2%), and Production (95 | 1.6%).
Production, Transportation and Moving Occupations by Sex
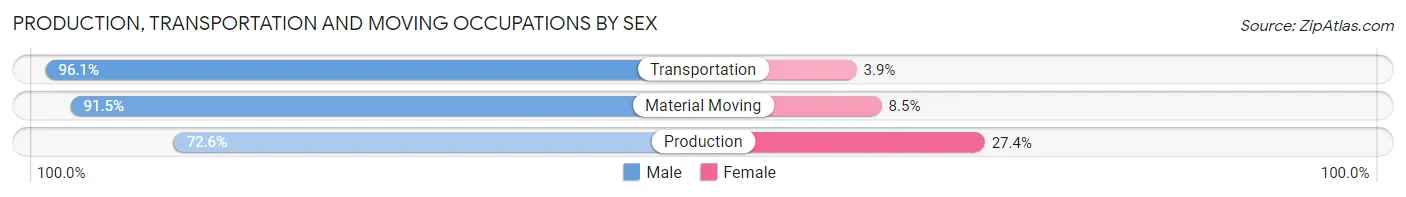
| Occupation | Male | Female |
| Production | 69 (72.6%) | 26 (27.4%) |
| Transportation | 274 (96.1%) | 11 (3.9%) |
| Material Moving | 119 (91.5%) | 11 (8.5%) |
| Total (Category) | 462 (90.6%) | 48 (9.4%) |
| Total (Overall) | 2,744 (47.0%) | 3,091 (53.0%) |
Employment Industries by Sex in The Village
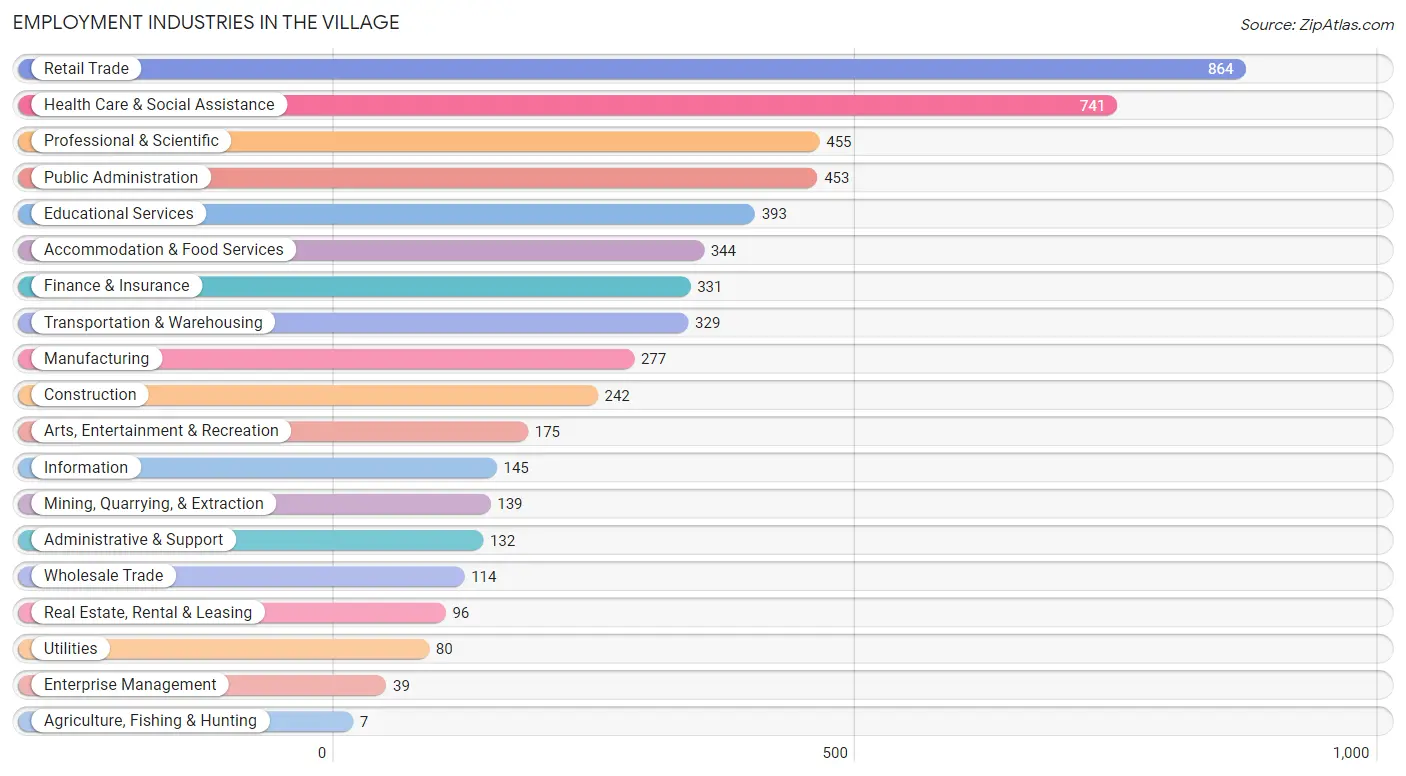
Employment Industries in The Village
The major employment industries in The Village include Retail Trade (864 | 14.8%), Health Care & Social Assistance (741 | 12.7%), Professional & Scientific (455 | 7.8%), Public Administration (453 | 7.8%), and Educational Services (393 | 6.7%).
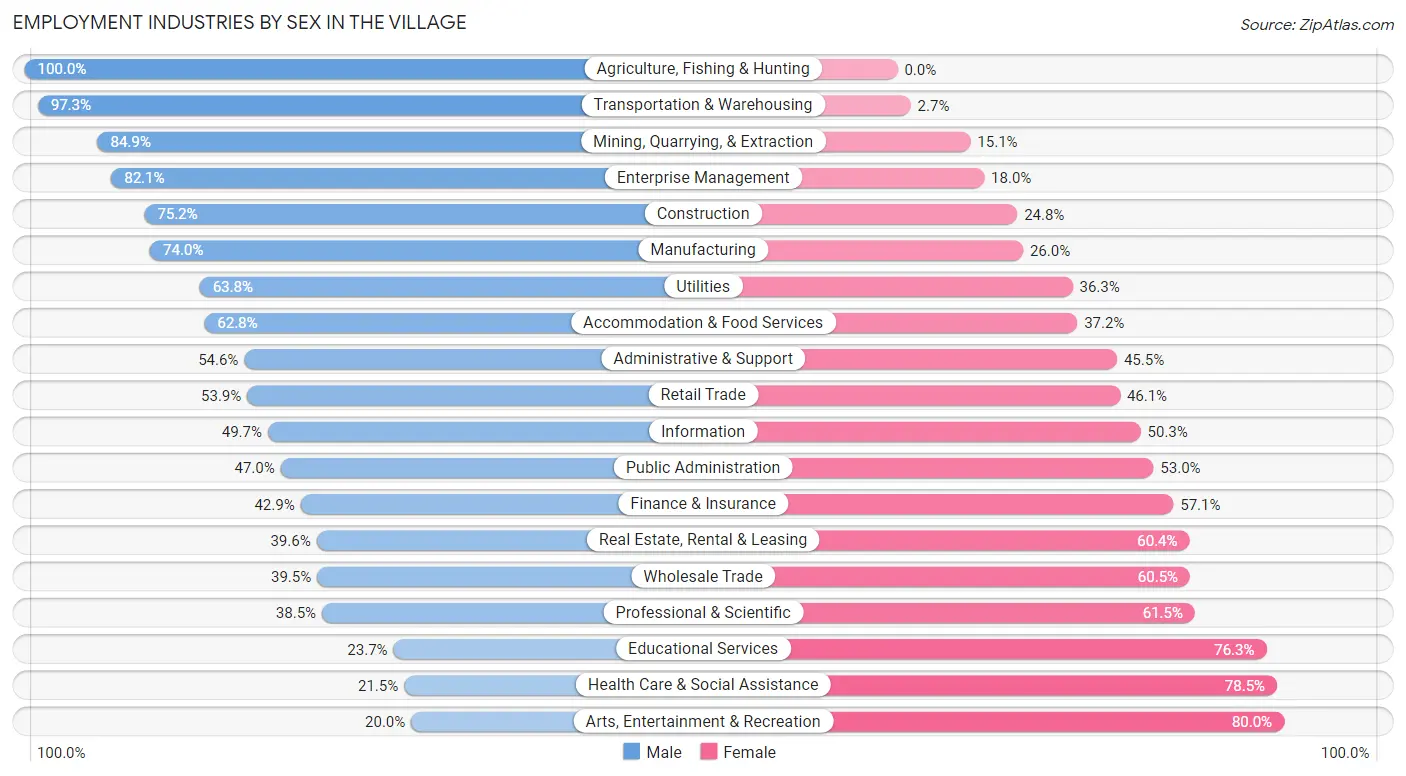
Employment Industries by Sex in The Village
The The Village industries that see more men than women are Agriculture, Fishing & Hunting (100.0%), Transportation & Warehousing (97.3%), and Mining, Quarrying, & Extraction (84.9%), whereas the industries that tend to have a higher number of women are Arts, Entertainment & Recreation (80.0%), Health Care & Social Assistance (78.5%), and Educational Services (76.3%).
| Industry | Male | Female |
| Agriculture, Fishing & Hunting | 7 (100.0%) | 0 (0.0%) |
| Mining, Quarrying, & Extraction | 118 (84.9%) | 21 (15.1%) |
| Construction | 182 (75.2%) | 60 (24.8%) |
| Manufacturing | 205 (74.0%) | 72 (26.0%) |
| Wholesale Trade | 45 (39.5%) | 69 (60.5%) |
| Retail Trade | 466 (53.9%) | 398 (46.1%) |
| Transportation & Warehousing | 320 (97.3%) | 9 (2.7%) |
| Utilities | 51 (63.7%) | 29 (36.2%) |
| Information | 72 (49.7%) | 73 (50.3%) |
| Finance & Insurance | 142 (42.9%) | 189 (57.1%) |
| Real Estate, Rental & Leasing | 38 (39.6%) | 58 (60.4%) |
| Professional & Scientific | 175 (38.5%) | 280 (61.5%) |
| Enterprise Management | 32 (82.1%) | 7 (17.9%) |
| Administrative & Support | 72 (54.5%) | 60 (45.5%) |
| Educational Services | 93 (23.7%) | 300 (76.3%) |
| Health Care & Social Assistance | 159 (21.5%) | 582 (78.5%) |
| Arts, Entertainment & Recreation | 35 (20.0%) | 140 (80.0%) |
| Accommodation & Food Services | 216 (62.8%) | 128 (37.2%) |
| Public Administration | 213 (47.0%) | 240 (53.0%) |
| Total | 2,744 (47.0%) | 3,091 (53.0%) |
Education in The Village
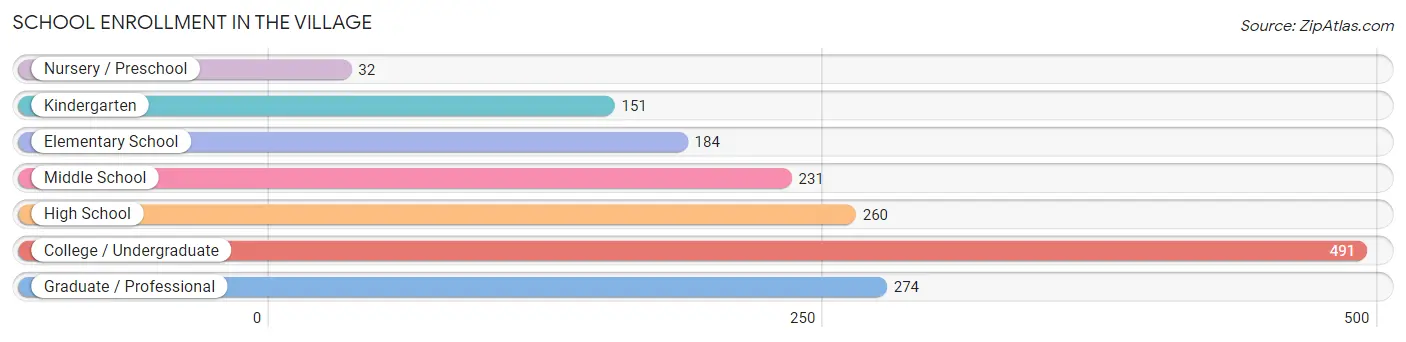
School Enrollment in The Village
The most common levels of schooling among the 1,623 students in The Village are college / undergraduate (491 | 30.2%), graduate / professional (274 | 16.9%), and high school (260 | 16.0%).
| School Level | # Students | % Students |
| Nursery / Preschool | 32 | 2.0% |
| Kindergarten | 151 | 9.3% |
| Elementary School | 184 | 11.3% |
| Middle School | 231 | 14.2% |
| High School | 260 | 16.0% |
| College / Undergraduate | 491 | 30.2% |
| Graduate / Professional | 274 | 16.9% |
| Total | 1,623 | 100.0% |
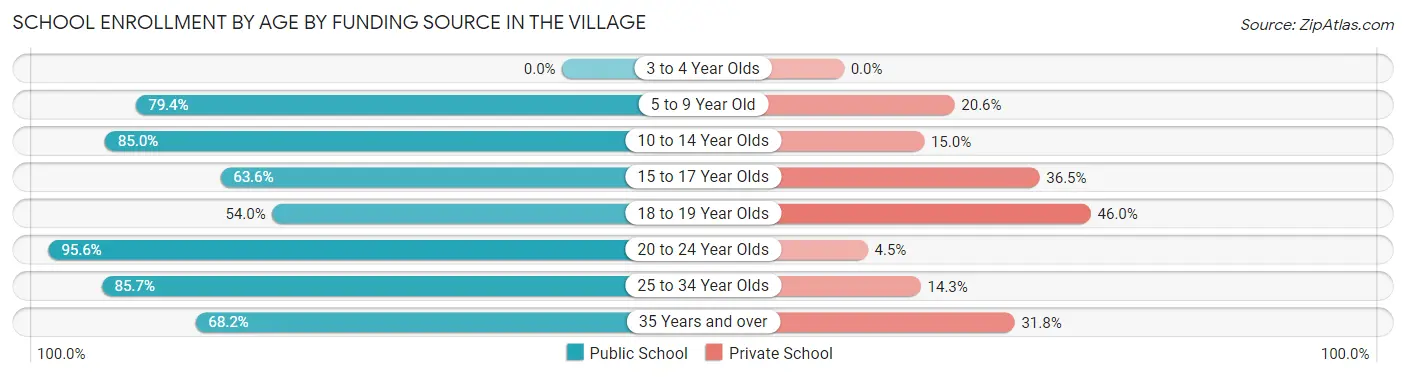
School Enrollment by Age by Funding Source in The Village
Out of a total of 1,623 students who are enrolled in schools in The Village, 313 (19.3%) attend a private institution, while the remaining 1,310 (80.7%) are enrolled in public schools. The age group of 18 to 19 year olds has the highest likelihood of being enrolled in private schools, with 46 (46.0% in the age bracket) enrolled. Conversely, the age group of 20 to 24 year olds has the lowest likelihood of being enrolled in a private school, with 322 (95.6% in the age bracket) attending a public institution.
| Age Bracket | Public School | Private School |
| 3 to 4 Year Olds | 0 (0.0%) | 0 (0.0%) |
| 5 to 9 Year Old | 254 (79.4%) | 66 (20.6%) |
| 10 to 14 Year Olds | 216 (85.0%) | 38 (15.0%) |
| 15 to 17 Year Olds | 129 (63.5%) | 74 (36.4%) |
| 18 to 19 Year Olds | 54 (54.0%) | 46 (46.0%) |
| 20 to 24 Year Olds | 322 (95.6%) | 15 (4.4%) |
| 25 to 34 Year Olds | 275 (85.7%) | 46 (14.3%) |
| 35 Years and over | 60 (68.2%) | 28 (31.8%) |
| Total | 1,310 (80.7%) | 313 (19.3%) |
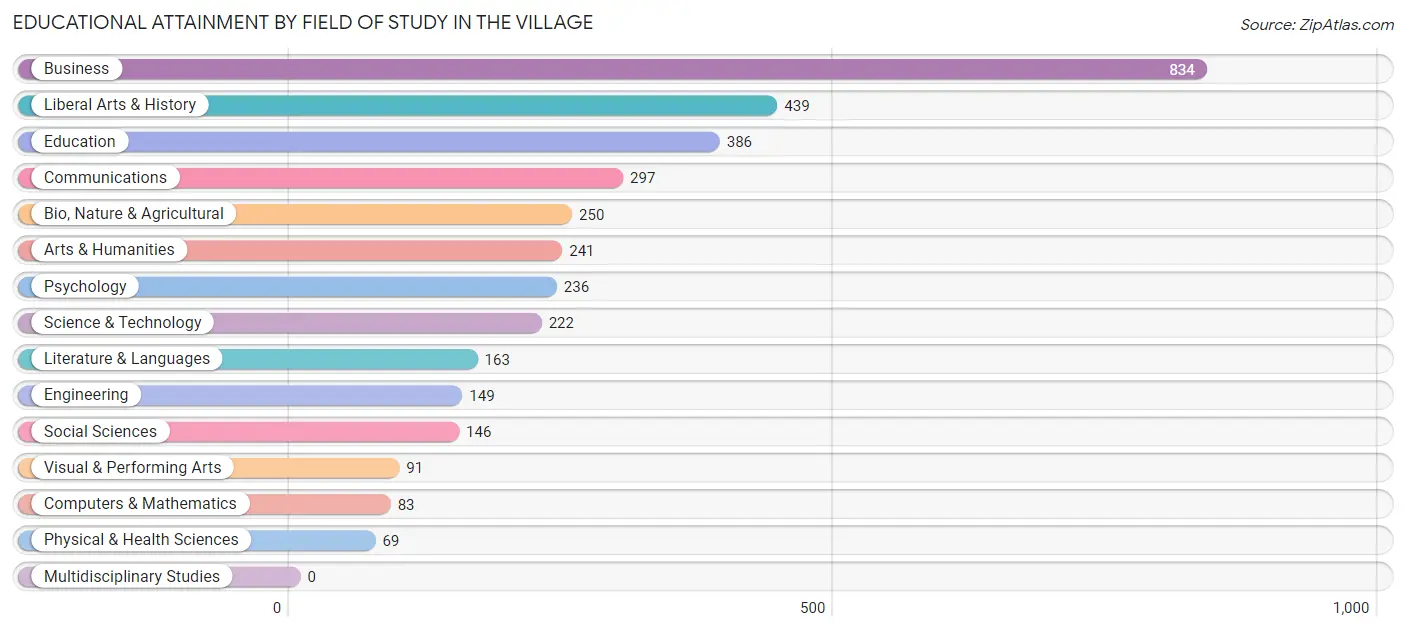
Educational Attainment by Field of Study in The Village
Business (834 | 23.1%), liberal arts & history (439 | 12.2%), education (386 | 10.7%), communications (297 | 8.2%), and bio, nature & agricultural (250 | 6.9%) are the most common fields of study among 3,606 individuals in The Village who have obtained a bachelor's degree or higher.
| Field of Study | # Graduates | % Graduates |
| Computers & Mathematics | 83 | 2.3% |
| Bio, Nature & Agricultural | 250 | 6.9% |
| Physical & Health Sciences | 69 | 1.9% |
| Psychology | 236 | 6.5% |
| Social Sciences | 146 | 4.1% |
| Engineering | 149 | 4.1% |
| Multidisciplinary Studies | 0 | 0.0% |
| Science & Technology | 222 | 6.2% |
| Business | 834 | 23.1% |
| Education | 386 | 10.7% |
| Literature & Languages | 163 | 4.5% |
| Liberal Arts & History | 439 | 12.2% |
| Visual & Performing Arts | 91 | 2.5% |
| Communications | 297 | 8.2% |
| Arts & Humanities | 241 | 6.7% |
| Total | 3,606 | 100.0% |
Transportation & Commute in The Village
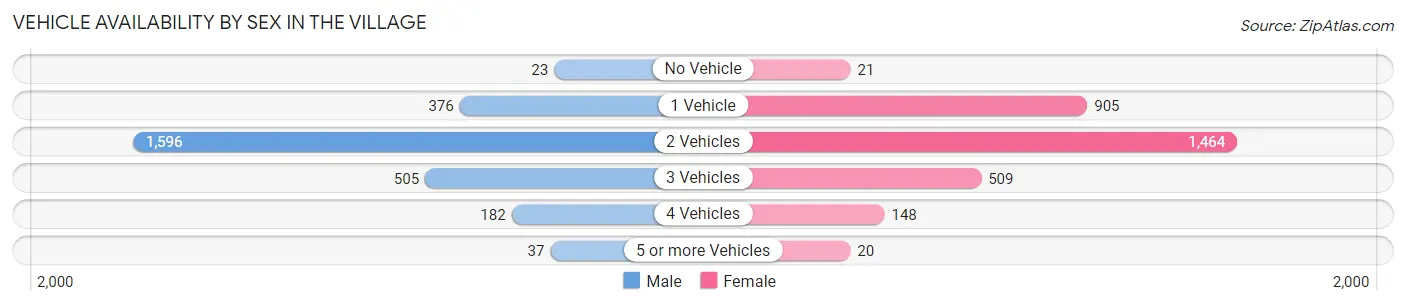
Vehicle Availability by Sex in The Village
The most prevalent vehicle ownership categories in The Village are males with 2 vehicles (1,596, accounting for 58.7%) and females with 2 vehicles (1,464, making up 52.0%).
| Vehicles Available | Male | Female |
| No Vehicle | 23 (0.9%) | 21 (0.7%) |
| 1 Vehicle | 376 (13.8%) | 905 (29.5%) |
| 2 Vehicles | 1,596 (58.7%) | 1,464 (47.7%) |
| 3 Vehicles | 505 (18.6%) | 509 (16.6%) |
| 4 Vehicles | 182 (6.7%) | 148 (4.8%) |
| 5 or more Vehicles | 37 (1.4%) | 20 (0.6%) |
| Total | 2,719 (100.0%) | 3,067 (100.0%) |
Commute Time in The Village
The most frequently occuring commute durations in The Village are 15 to 19 minutes (1,548 commuters, 28.8%), 20 to 24 minutes (1,069 commuters, 19.9%), and 10 to 14 minutes (705 commuters, 13.1%).
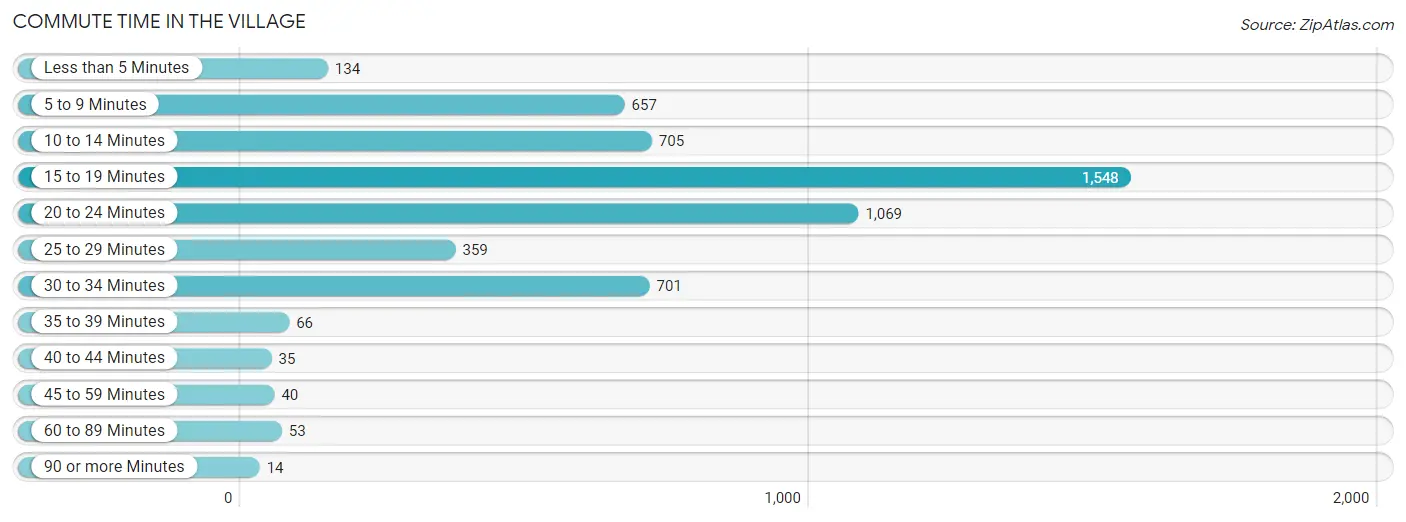
| Commute Time | # Commuters | % Commuters |
| Less than 5 Minutes | 134 | 2.5% |
| 5 to 9 Minutes | 657 | 12.2% |
| 10 to 14 Minutes | 705 | 13.1% |
| 15 to 19 Minutes | 1,548 | 28.8% |
| 20 to 24 Minutes | 1,069 | 19.9% |
| 25 to 29 Minutes | 359 | 6.7% |
| 30 to 34 Minutes | 701 | 13.0% |
| 35 to 39 Minutes | 66 | 1.2% |
| 40 to 44 Minutes | 35 | 0.6% |
| 45 to 59 Minutes | 40 | 0.7% |
| 60 to 89 Minutes | 53 | 1.0% |
| 90 or more Minutes | 14 | 0.3% |
Commute Time by Sex in The Village
The most common commute times in The Village are 15 to 19 minutes (841 commuters, 32.6%) for males and 15 to 19 minutes (707 commuters, 25.2%) for females.
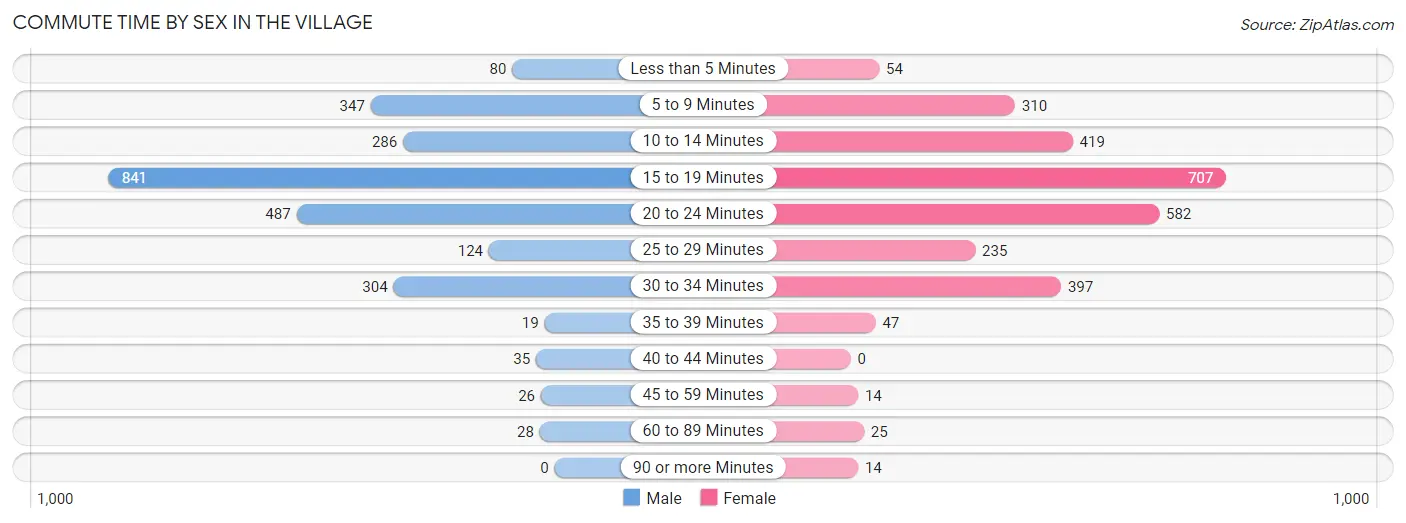
| Commute Time | Male | Female |
| Less than 5 Minutes | 80 (3.1%) | 54 (1.9%) |
| 5 to 9 Minutes | 347 (13.5%) | 310 (11.1%) |
| 10 to 14 Minutes | 286 (11.1%) | 419 (14.9%) |
| 15 to 19 Minutes | 841 (32.6%) | 707 (25.2%) |
| 20 to 24 Minutes | 487 (18.9%) | 582 (20.8%) |
| 25 to 29 Minutes | 124 (4.8%) | 235 (8.4%) |
| 30 to 34 Minutes | 304 (11.8%) | 397 (14.2%) |
| 35 to 39 Minutes | 19 (0.7%) | 47 (1.7%) |
| 40 to 44 Minutes | 35 (1.4%) | 0 (0.0%) |
| 45 to 59 Minutes | 26 (1.0%) | 14 (0.5%) |
| 60 to 89 Minutes | 28 (1.1%) | 25 (0.9%) |
| 90 or more Minutes | 0 (0.0%) | 14 (0.5%) |
Time of Departure to Work by Sex in The Village
The most frequent times of departure to work in The Village are 7:30 AM to 7:59 AM (484, 18.8%) for males and 7:00 AM to 7:29 AM (451, 16.1%) for females.
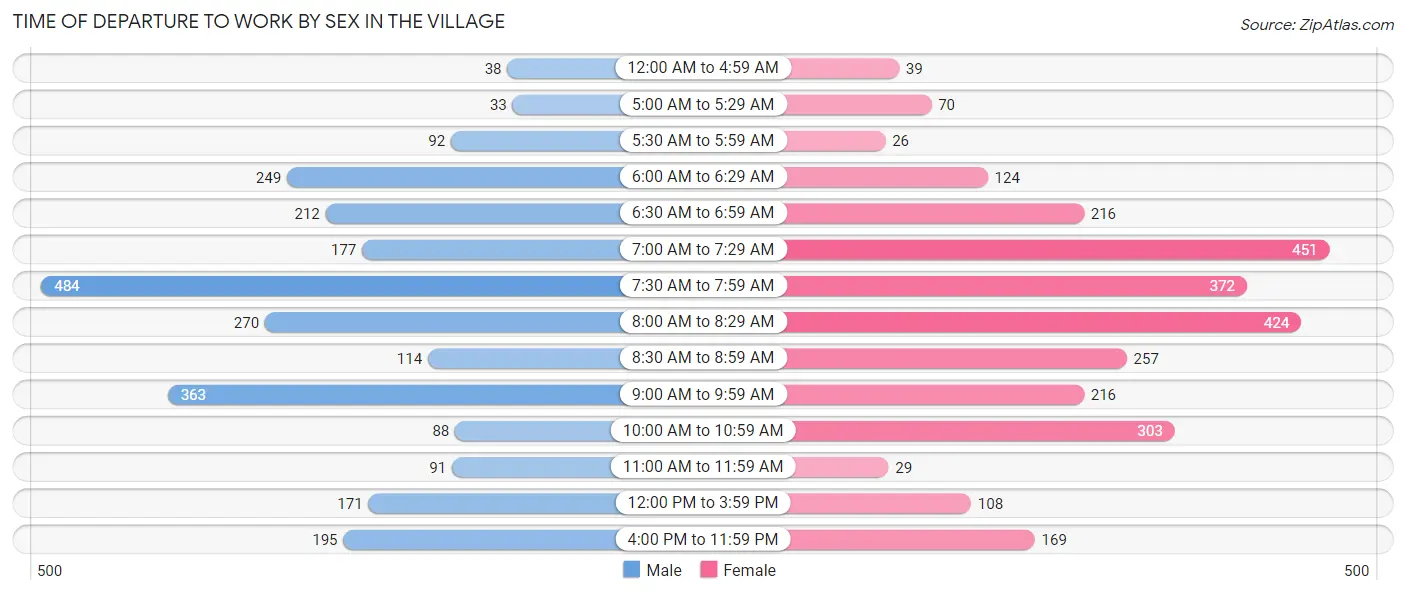
| Time of Departure | Male | Female |
| 12:00 AM to 4:59 AM | 38 (1.5%) | 39 (1.4%) |
| 5:00 AM to 5:29 AM | 33 (1.3%) | 70 (2.5%) |
| 5:30 AM to 5:59 AM | 92 (3.6%) | 26 (0.9%) |
| 6:00 AM to 6:29 AM | 249 (9.7%) | 124 (4.4%) |
| 6:30 AM to 6:59 AM | 212 (8.2%) | 216 (7.7%) |
| 7:00 AM to 7:29 AM | 177 (6.9%) | 451 (16.1%) |
| 7:30 AM to 7:59 AM | 484 (18.8%) | 372 (13.3%) |
| 8:00 AM to 8:29 AM | 270 (10.5%) | 424 (15.1%) |
| 8:30 AM to 8:59 AM | 114 (4.4%) | 257 (9.2%) |
| 9:00 AM to 9:59 AM | 363 (14.1%) | 216 (7.7%) |
| 10:00 AM to 10:59 AM | 88 (3.4%) | 303 (10.8%) |
| 11:00 AM to 11:59 AM | 91 (3.5%) | 29 (1.0%) |
| 12:00 PM to 3:59 PM | 171 (6.6%) | 108 (3.8%) |
| 4:00 PM to 11:59 PM | 195 (7.6%) | 169 (6.0%) |
| Total | 2,577 (100.0%) | 2,804 (100.0%) |
Housing Occupancy in The Village
Occupancy by Ownership in The Village
Of the total 4,749 dwellings in The Village, owner-occupied units account for 2,817 (59.3%), while renter-occupied units make up 1,932 (40.7%).
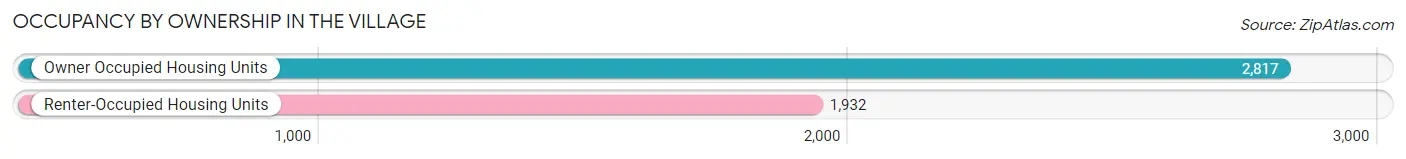
| Occupancy | # Housing Units | % Housing Units |
| Owner Occupied Housing Units | 2,817 | 59.3% |
| Renter-Occupied Housing Units | 1,932 | 40.7% |
| Total Occupied Housing Units | 4,749 | 100.0% |
Occupancy by Household Size in The Village
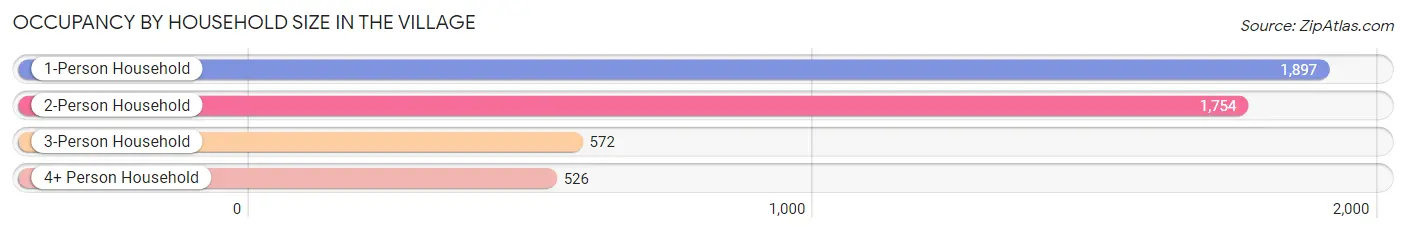
| Household Size | # Housing Units | % Housing Units |
| 1-Person Household | 1,897 | 40.0% |
| 2-Person Household | 1,754 | 36.9% |
| 3-Person Household | 572 | 12.0% |
| 4+ Person Household | 526 | 11.1% |
| Total Housing Units | 4,749 | 100.0% |
Occupancy by Ownership by Household Size in The Village
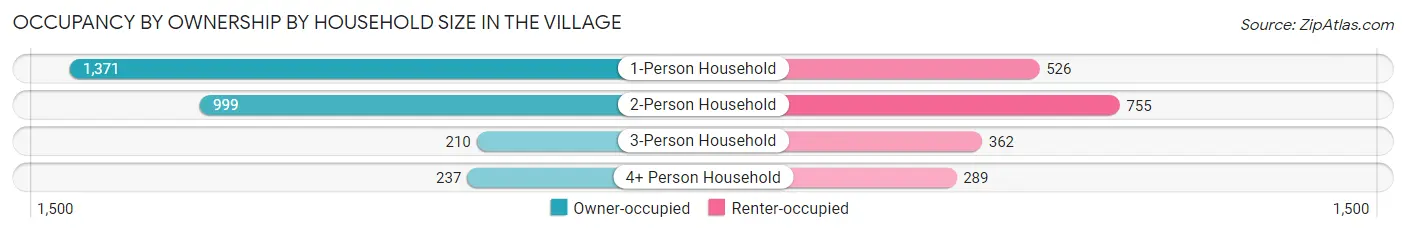
| Household Size | Owner-occupied | Renter-occupied |
| 1-Person Household | 1,371 (72.3%) | 526 (27.7%) |
| 2-Person Household | 999 (57.0%) | 755 (43.0%) |
| 3-Person Household | 210 (36.7%) | 362 (63.3%) |
| 4+ Person Household | 237 (45.1%) | 289 (54.9%) |
| Total Housing Units | 2,817 (59.3%) | 1,932 (40.7%) |
Occupancy by Educational Attainment in The Village
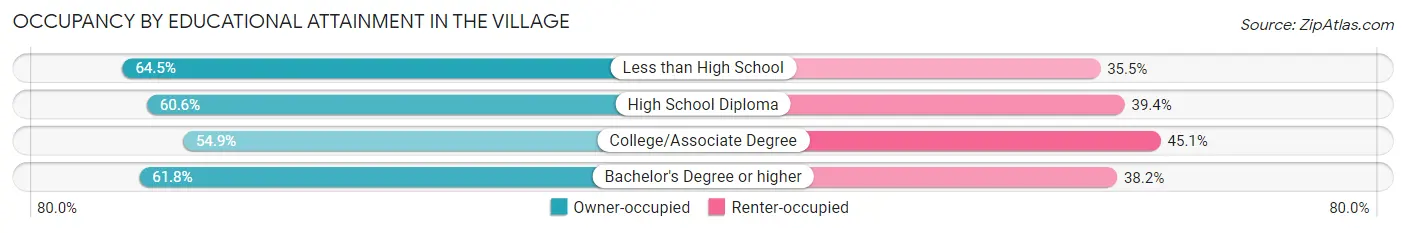
| Household Size | Owner-occupied | Renter-occupied |
| Less than High School | 98 (64.5%) | 54 (35.5%) |
| High School Diploma | 443 (60.6%) | 288 (39.4%) |
| College/Associate Degree | 899 (54.9%) | 739 (45.1%) |
| Bachelor's Degree or higher | 1,377 (61.8%) | 851 (38.2%) |
Occupancy by Age of Householder in The Village
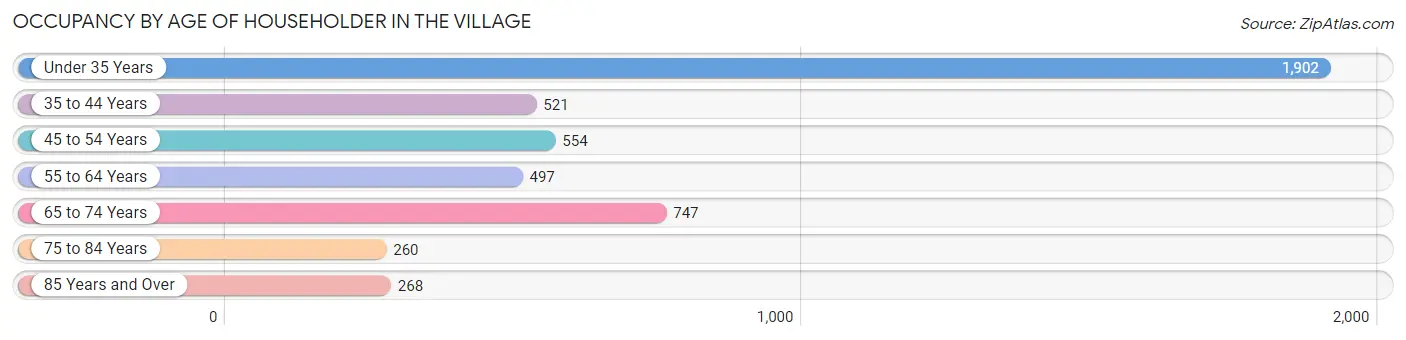
| Age Bracket | # Households | % Households |
| Under 35 Years | 1,902 | 40.1% |
| 35 to 44 Years | 521 | 11.0% |
| 45 to 54 Years | 554 | 11.7% |
| 55 to 64 Years | 497 | 10.5% |
| 65 to 74 Years | 747 | 15.7% |
| 75 to 84 Years | 260 | 5.5% |
| 85 Years and Over | 268 | 5.6% |
| Total | 4,749 | 100.0% |
Housing Finances in The Village
Median Income by Occupancy in The Village
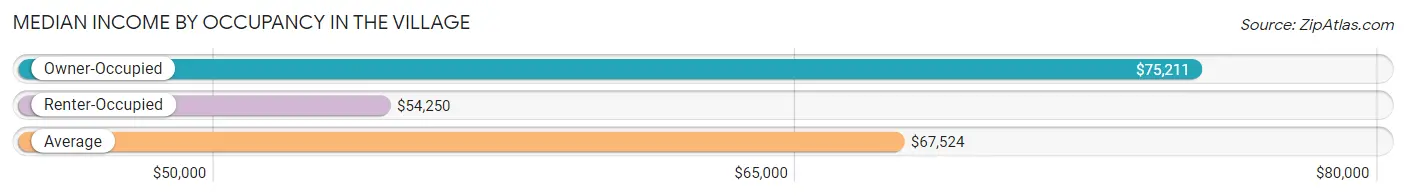
| Occupancy Type | # Households | Median Income |
| Owner-Occupied | 2,817 (59.3%) | $75,211 |
| Renter-Occupied | 1,932 (40.7%) | $54,250 |
| Average | 4,749 (100.0%) | $67,524 |
Occupancy by Householder Income Bracket in The Village
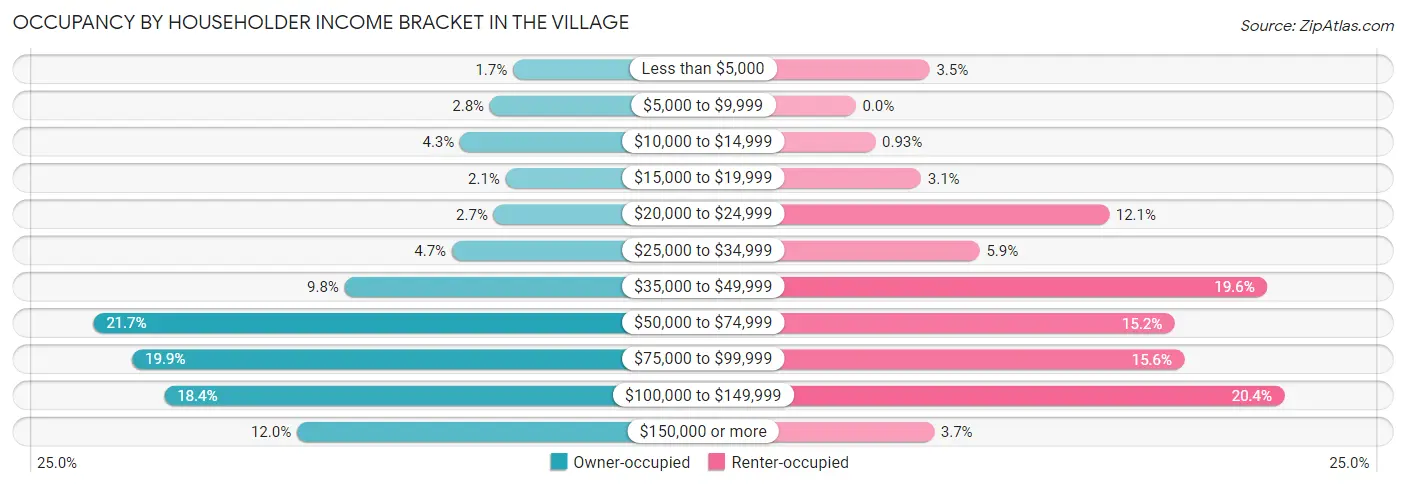
| Income Bracket | Owner-occupied | Renter-occupied |
| Less than $5,000 | 49 (1.7%) | 68 (3.5%) |
| $5,000 to $9,999 | 80 (2.8%) | 0 (0.0%) |
| $10,000 to $14,999 | 120 (4.3%) | 18 (0.9%) |
| $15,000 to $19,999 | 59 (2.1%) | 60 (3.1%) |
| $20,000 to $24,999 | 75 (2.7%) | 233 (12.1%) |
| $25,000 to $34,999 | 131 (4.6%) | 114 (5.9%) |
| $35,000 to $49,999 | 275 (9.8%) | 378 (19.6%) |
| $50,000 to $74,999 | 612 (21.7%) | 293 (15.2%) |
| $75,000 to $99,999 | 560 (19.9%) | 302 (15.6%) |
| $100,000 to $149,999 | 517 (18.3%) | 394 (20.4%) |
| $150,000 or more | 339 (12.0%) | 72 (3.7%) |
| Total | 2,817 (100.0%) | 1,932 (100.0%) |
Monthly Housing Cost Tiers in The Village
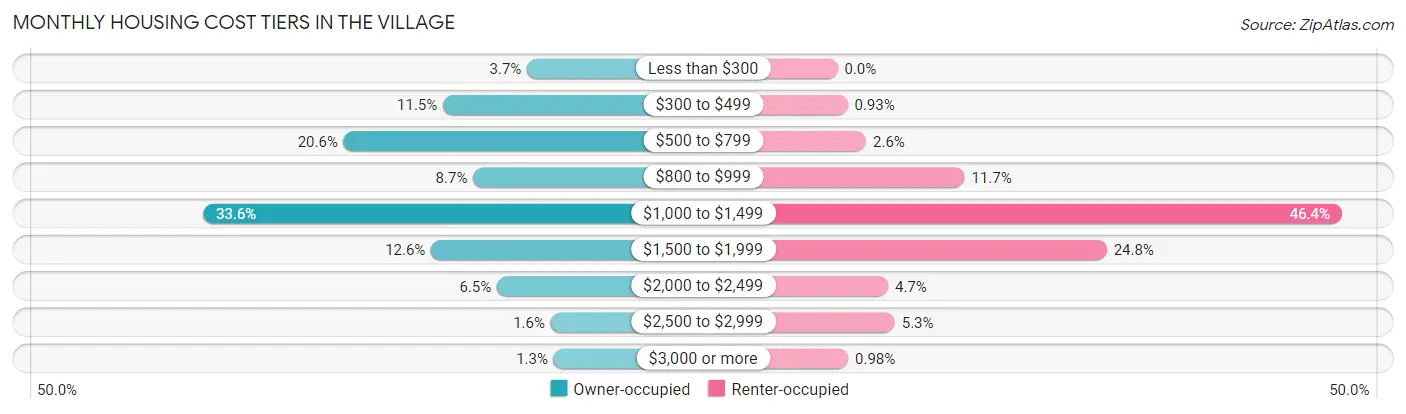
| Monthly Cost | Owner-occupied | Renter-occupied |
| Less than $300 | 105 (3.7%) | 0 (0.0%) |
| $300 to $499 | 323 (11.5%) | 18 (0.9%) |
| $500 to $799 | 581 (20.6%) | 51 (2.6%) |
| $800 to $999 | 245 (8.7%) | 226 (11.7%) |
| $1,000 to $1,499 | 946 (33.6%) | 897 (46.4%) |
| $1,500 to $1,999 | 354 (12.6%) | 479 (24.8%) |
| $2,000 to $2,499 | 183 (6.5%) | 90 (4.7%) |
| $2,500 to $2,999 | 44 (1.6%) | 102 (5.3%) |
| $3,000 or more | 36 (1.3%) | 19 (1.0%) |
| Total | 2,817 (100.0%) | 1,932 (100.0%) |
Physical Housing Characteristics in The Village
Housing Structures in The Village
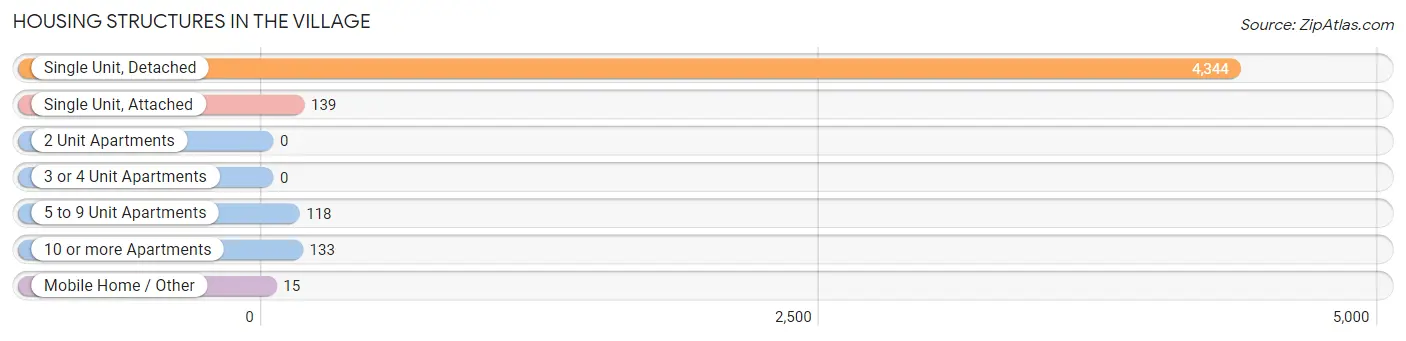
| Structure Type | # Housing Units | % Housing Units |
| Single Unit, Detached | 4,344 | 91.5% |
| Single Unit, Attached | 139 | 2.9% |
| 2 Unit Apartments | 0 | 0.0% |
| 3 or 4 Unit Apartments | 0 | 0.0% |
| 5 to 9 Unit Apartments | 118 | 2.5% |
| 10 or more Apartments | 133 | 2.8% |
| Mobile Home / Other | 15 | 0.3% |
| Total | 4,749 | 100.0% |
Housing Structures by Occupancy in The Village
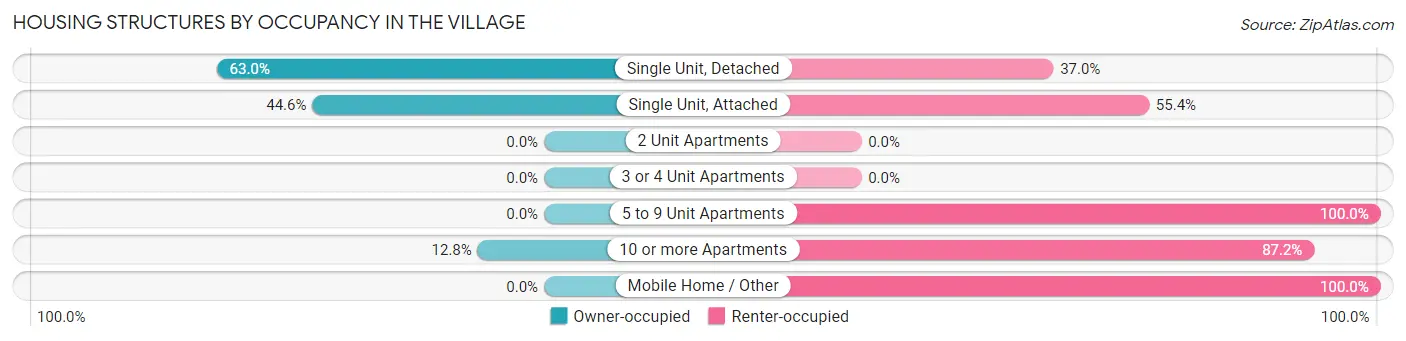
| Structure Type | Owner-occupied | Renter-occupied |
| Single Unit, Detached | 2,738 (63.0%) | 1,606 (37.0%) |
| Single Unit, Attached | 62 (44.6%) | 77 (55.4%) |
| 2 Unit Apartments | 0 (0.0%) | 0 (0.0%) |
| 3 or 4 Unit Apartments | 0 (0.0%) | 0 (0.0%) |
| 5 to 9 Unit Apartments | 0 (0.0%) | 118 (100.0%) |
| 10 or more Apartments | 17 (12.8%) | 116 (87.2%) |
| Mobile Home / Other | 0 (0.0%) | 15 (100.0%) |
| Total | 2,817 (59.3%) | 1,932 (40.7%) |
Housing Structures by Number of Rooms in The Village
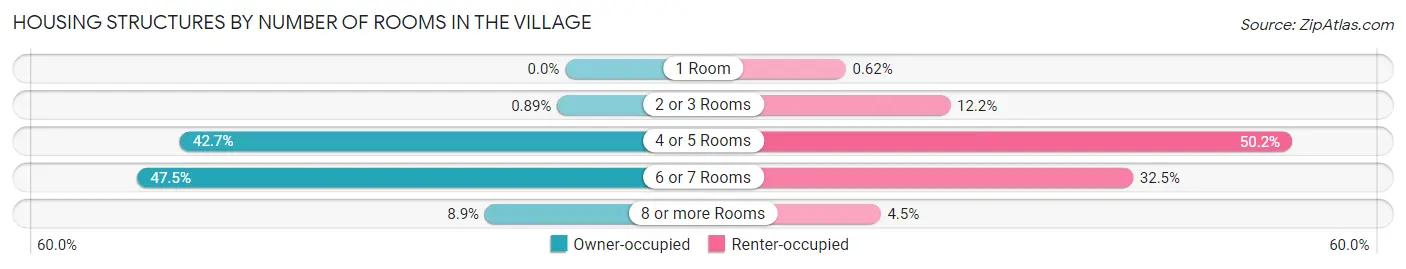
| Number of Rooms | Owner-occupied | Renter-occupied |
| 1 Room | 0 (0.0%) | 12 (0.6%) |
| 2 or 3 Rooms | 25 (0.9%) | 236 (12.2%) |
| 4 or 5 Rooms | 1,204 (42.7%) | 969 (50.2%) |
| 6 or 7 Rooms | 1,337 (47.5%) | 628 (32.5%) |
| 8 or more Rooms | 251 (8.9%) | 87 (4.5%) |
| Total | 2,817 (100.0%) | 1,932 (100.0%) |
Housing Structure by Heating Type in The Village
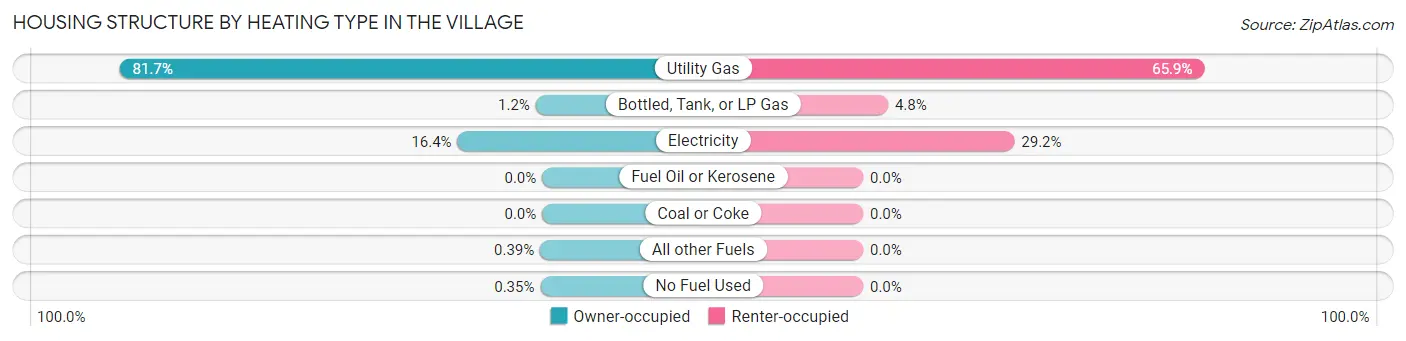
| Heating Type | Owner-occupied | Renter-occupied |
| Utility Gas | 2,300 (81.7%) | 1,274 (65.9%) |
| Bottled, Tank, or LP Gas | 35 (1.2%) | 93 (4.8%) |
| Electricity | 461 (16.4%) | 565 (29.2%) |
| Fuel Oil or Kerosene | 0 (0.0%) | 0 (0.0%) |
| Coal or Coke | 0 (0.0%) | 0 (0.0%) |
| All other Fuels | 11 (0.4%) | 0 (0.0%) |
| No Fuel Used | 10 (0.4%) | 0 (0.0%) |
| Total | 2,817 (100.0%) | 1,932 (100.0%) |
Household Vehicle Usage in The Village
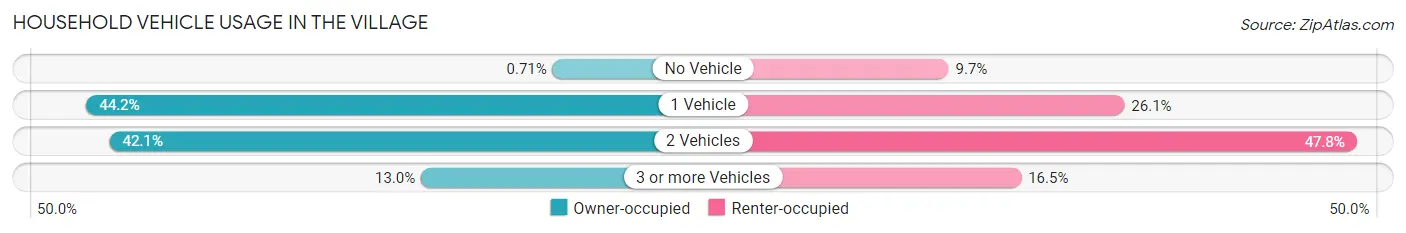
| Vehicles per Household | Owner-occupied | Renter-occupied |
| No Vehicle | 20 (0.7%) | 187 (9.7%) |
| 1 Vehicle | 1,246 (44.2%) | 504 (26.1%) |
| 2 Vehicles | 1,185 (42.1%) | 923 (47.8%) |
| 3 or more Vehicles | 366 (13.0%) | 318 (16.5%) |
| Total | 2,817 (100.0%) | 1,932 (100.0%) |
Real Estate & Mortgages in The Village
Real Estate and Mortgage Overview in The Village
| Characteristic | Without Mortgage | With Mortgage |
| Housing Units | 1,006 | 1,811 |
| Median Property Value | $166,100 | $174,800 |
| Median Household Income | $51,020 | $233 |
| Monthly Housing Costs | $537 | $30 |
| Real Estate Taxes | $1,591 | $72 |
Property Value by Mortgage Status in The Village
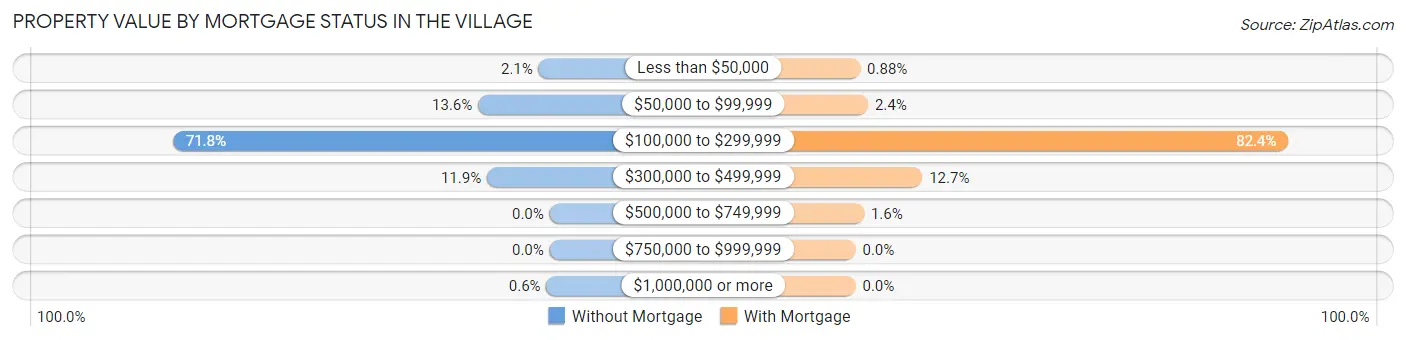
| Property Value | Without Mortgage | With Mortgage |
| Less than $50,000 | 21 (2.1%) | 16 (0.9%) |
| $50,000 to $99,999 | 137 (13.6%) | 43 (2.4%) |
| $100,000 to $299,999 | 722 (71.8%) | 1,493 (82.4%) |
| $300,000 to $499,999 | 120 (11.9%) | 230 (12.7%) |
| $500,000 to $749,999 | 0 (0.0%) | 29 (1.6%) |
| $750,000 to $999,999 | 0 (0.0%) | 0 (0.0%) |
| $1,000,000 or more | 6 (0.6%) | 0 (0.0%) |
| Total | 1,006 (100.0%) | 1,811 (100.0%) |
Household Income by Mortgage Status in The Village
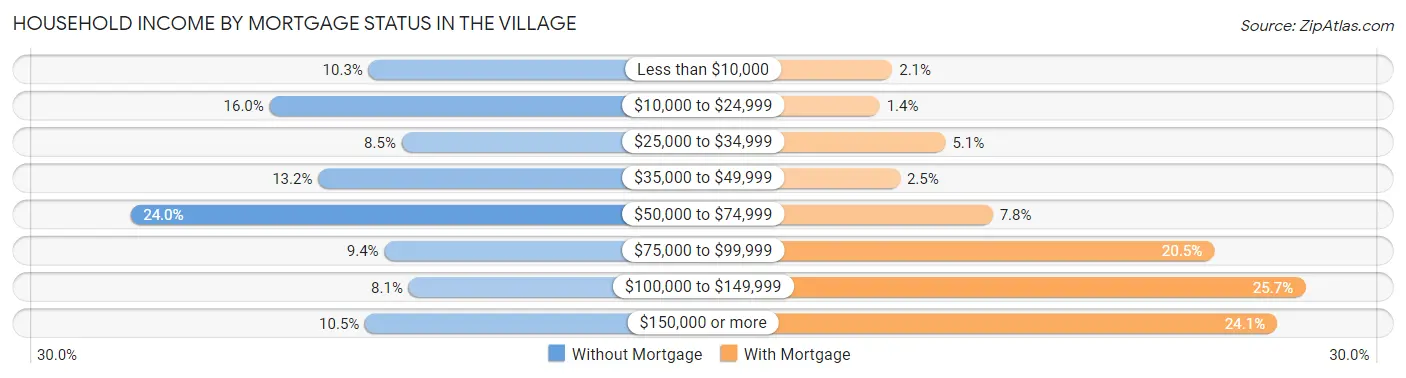
| Household Income | Without Mortgage | With Mortgage |
| Less than $10,000 | 104 (10.3%) | 38 (2.1%) |
| $10,000 to $24,999 | 161 (16.0%) | 25 (1.4%) |
| $25,000 to $34,999 | 85 (8.5%) | 93 (5.1%) |
| $35,000 to $49,999 | 133 (13.2%) | 46 (2.5%) |
| $50,000 to $74,999 | 241 (24.0%) | 142 (7.8%) |
| $75,000 to $99,999 | 95 (9.4%) | 371 (20.5%) |
| $100,000 to $149,999 | 81 (8.1%) | 465 (25.7%) |
| $150,000 or more | 106 (10.5%) | 436 (24.1%) |
| Total | 1,006 (100.0%) | 1,811 (100.0%) |
Property Value to Household Income Ratio in The Village
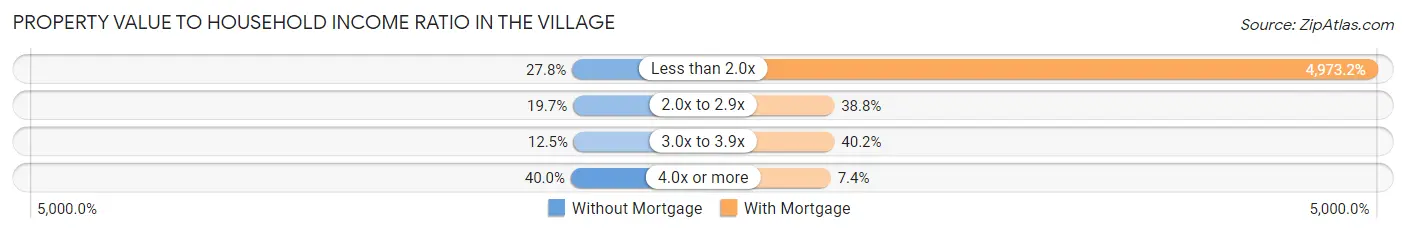
| Value-to-Income Ratio | Without Mortgage | With Mortgage |
| Less than 2.0x | 280 (27.8%) | 90,065 (4,973.2%) |
| 2.0x to 2.9x | 198 (19.7%) | 703 (38.8%) |
| 3.0x to 3.9x | 126 (12.5%) | 728 (40.2%) |
| 4.0x or more | 402 (40.0%) | 134 (7.4%) |
| Total | 1,006 (100.0%) | 1,811 (100.0%) |
Real Estate Taxes by Mortgage Status in The Village
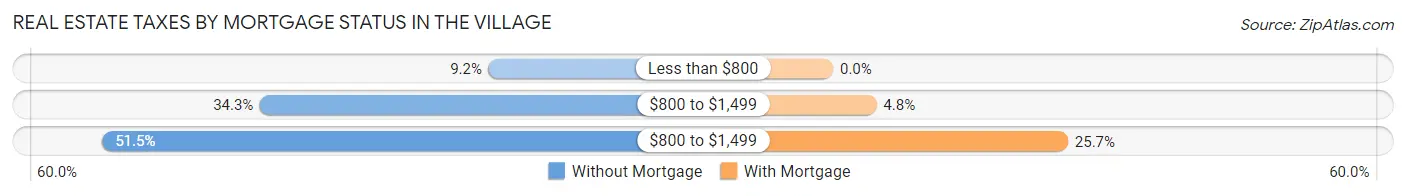
| Property Taxes | Without Mortgage | With Mortgage |
| Less than $800 | 93 (9.2%) | 0 (0.0%) |
| $800 to $1,499 | 345 (34.3%) | 86 (4.8%) |
| $800 to $1,499 | 518 (51.5%) | 466 (25.7%) |
| Total | 1,006 (100.0%) | 1,811 (100.0%) |
Health & Disability in The Village
Health Insurance Coverage by Age in The Village
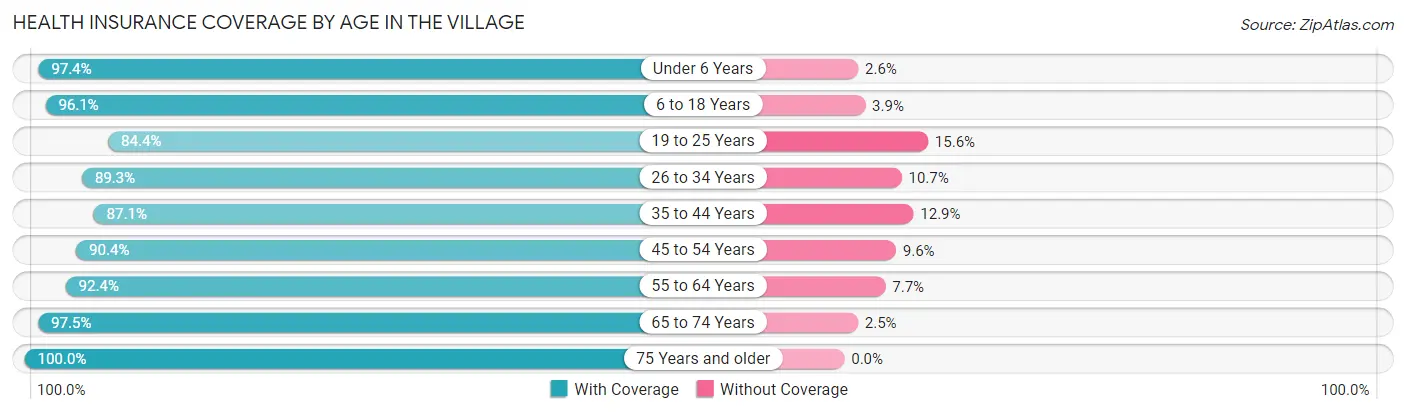
| Age Bracket | With Coverage | Without Coverage |
| Under 6 Years | 644 (97.4%) | 17 (2.6%) |
| 6 to 18 Years | 716 (96.1%) | 29 (3.9%) |
| 19 to 25 Years | 1,094 (84.4%) | 202 (15.6%) |
| 26 to 34 Years | 2,060 (89.3%) | 246 (10.7%) |
| 35 to 44 Years | 778 (87.1%) | 115 (12.9%) |
| 45 to 54 Years | 687 (90.4%) | 73 (9.6%) |
| 55 to 64 Years | 821 (92.3%) | 68 (7.6%) |
| 65 to 74 Years | 1,003 (97.5%) | 26 (2.5%) |
| 75 Years and older | 739 (100.0%) | 0 (0.0%) |
| Total | 8,542 (91.7%) | 776 (8.3%) |
Health Insurance Coverage by Citizenship Status in The Village
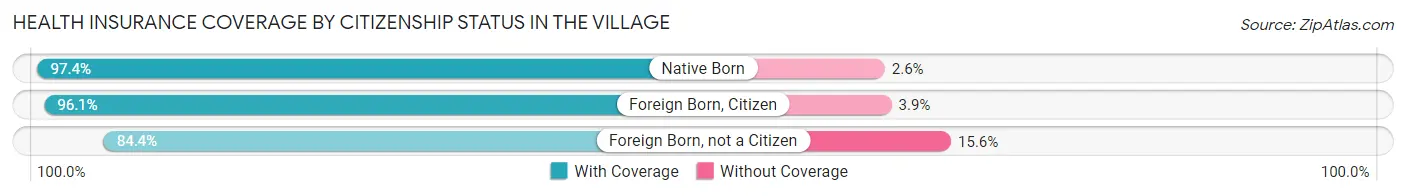
| Citizenship Status | With Coverage | Without Coverage |
| Native Born | 644 (97.4%) | 17 (2.6%) |
| Foreign Born, Citizen | 716 (96.1%) | 29 (3.9%) |
| Foreign Born, not a Citizen | 1,094 (84.4%) | 202 (15.6%) |
Health Insurance Coverage by Household Income in The Village
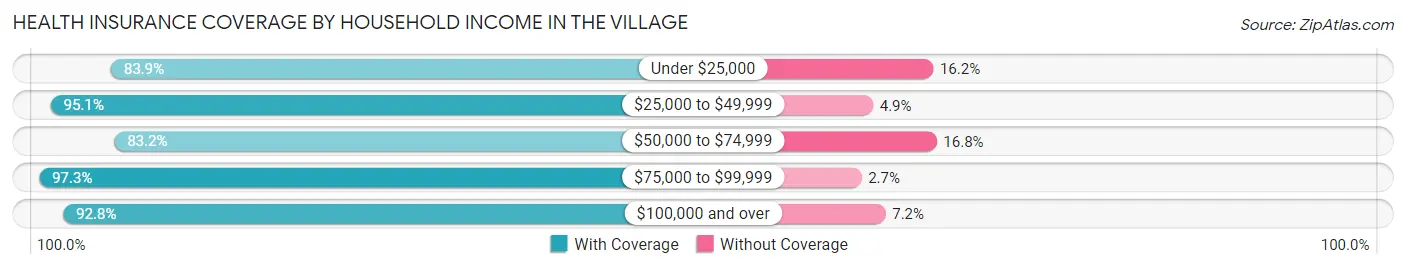
| Household Income | With Coverage | Without Coverage |
| Under $25,000 | 862 (83.9%) | 166 (16.2%) |
| $25,000 to $49,999 | 1,620 (95.1%) | 83 (4.9%) |
| $50,000 to $74,999 | 1,264 (83.2%) | 255 (16.8%) |
| $75,000 to $99,999 | 2,016 (97.3%) | 56 (2.7%) |
| $100,000 and over | 2,780 (92.8%) | 216 (7.2%) |
Public vs Private Health Insurance Coverage by Age in The Village
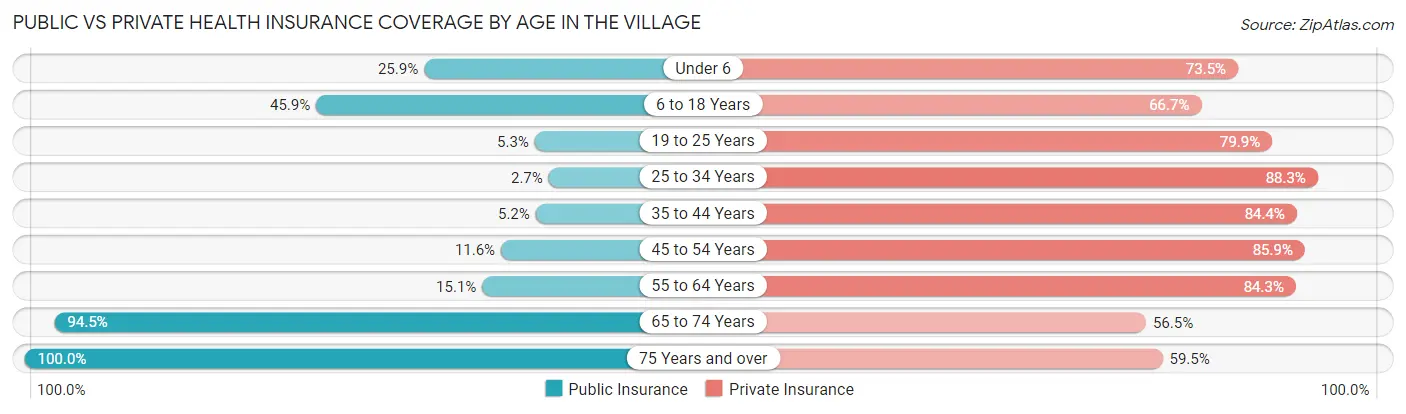
| Age Bracket | Public Insurance | Private Insurance |
| Under 6 | 171 (25.9%) | 486 (73.5%) |
| 6 to 18 Years | 342 (45.9%) | 497 (66.7%) |
| 19 to 25 Years | 69 (5.3%) | 1,035 (79.9%) |
| 25 to 34 Years | 63 (2.7%) | 2,037 (88.3%) |
| 35 to 44 Years | 46 (5.1%) | 754 (84.4%) |
| 45 to 54 Years | 88 (11.6%) | 653 (85.9%) |
| 55 to 64 Years | 134 (15.1%) | 749 (84.3%) |
| 65 to 74 Years | 972 (94.5%) | 581 (56.5%) |
| 75 Years and over | 739 (100.0%) | 440 (59.5%) |
| Total | 2,624 (28.2%) | 7,232 (77.6%) |
Disability Status by Sex by Age in The Village
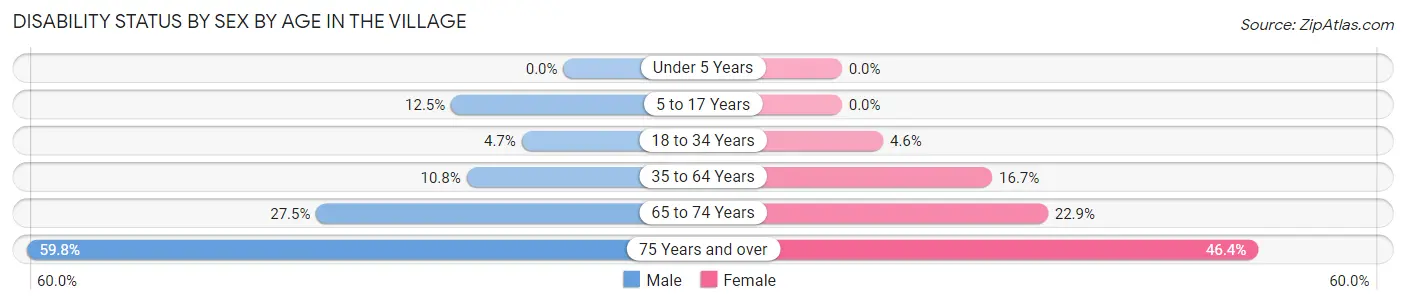
| Age Bracket | Male | Female |
| Under 5 Years | 0 (0.0%) | 0 (0.0%) |
| 5 to 17 Years | 49 (12.5%) | 0 (0.0%) |
| 18 to 34 Years | 79 (4.6%) | 91 (4.6%) |
| 35 to 64 Years | 133 (10.8%) | 219 (16.7%) |
| 65 to 74 Years | 96 (27.5%) | 156 (22.9%) |
| 75 Years and over | 220 (59.8%) | 172 (46.4%) |
Disability Class by Sex by Age in The Village
Disability Class: Hearing Difficulty
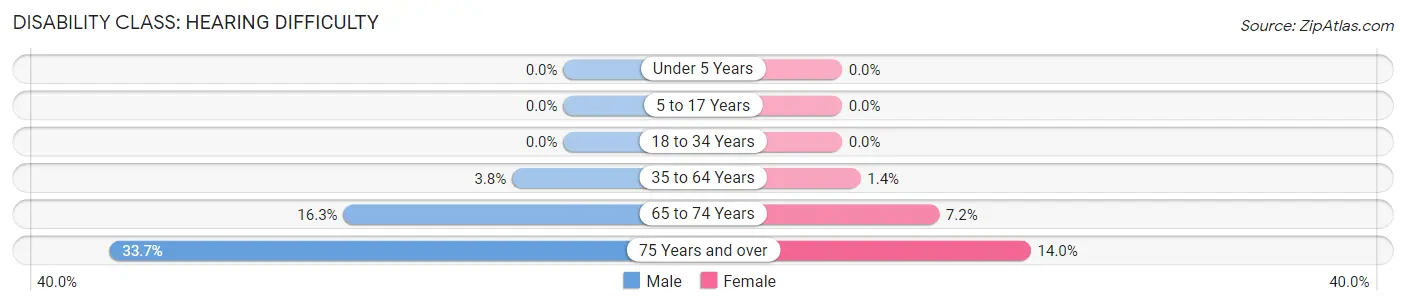
| Age Bracket | Male | Female |
| Under 5 Years | 0 (0.0%) | 0 (0.0%) |
| 5 to 17 Years | 0 (0.0%) | 0 (0.0%) |
| 18 to 34 Years | 0 (0.0%) | 0 (0.0%) |
| 35 to 64 Years | 47 (3.8%) | 18 (1.4%) |
| 65 to 74 Years | 57 (16.3%) | 49 (7.2%) |
| 75 Years and over | 124 (33.7%) | 52 (14.0%) |
Disability Class: Vision Difficulty
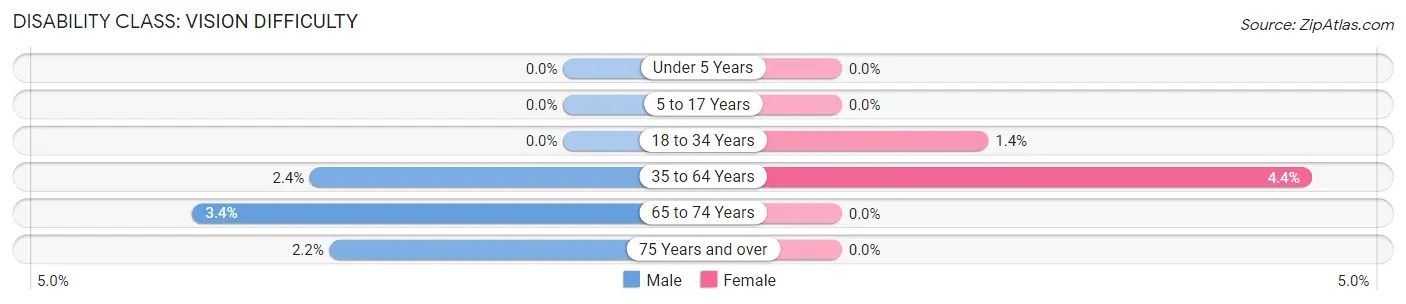
| Age Bracket | Male | Female |
| Under 5 Years | 0 (0.0%) | 0 (0.0%) |
| 5 to 17 Years | 0 (0.0%) | 0 (0.0%) |
| 18 to 34 Years | 0 (0.0%) | 27 (1.4%) |
| 35 to 64 Years | 29 (2.4%) | 57 (4.4%) |
| 65 to 74 Years | 12 (3.4%) | 0 (0.0%) |
| 75 Years and over | 8 (2.2%) | 0 (0.0%) |
Disability Class: Cognitive Difficulty
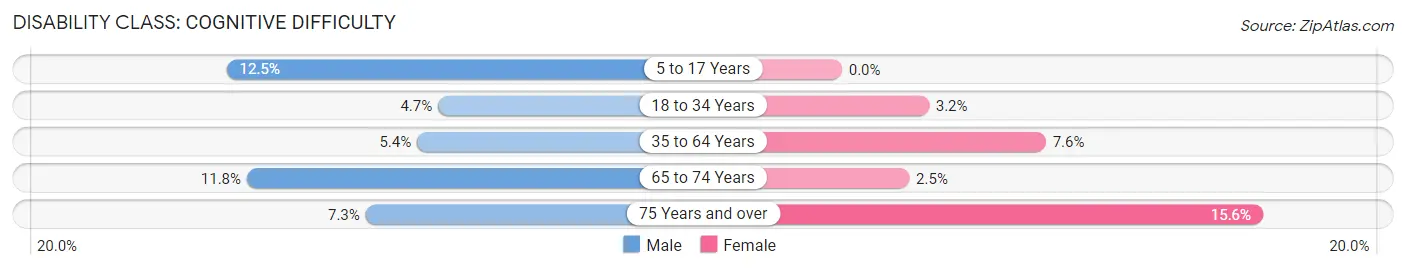
| Age Bracket | Male | Female |
| 5 to 17 Years | 49 (12.5%) | 0 (0.0%) |
| 18 to 34 Years | 79 (4.6%) | 64 (3.2%) |
| 35 to 64 Years | 67 (5.4%) | 99 (7.6%) |
| 65 to 74 Years | 41 (11.7%) | 17 (2.5%) |
| 75 Years and over | 27 (7.3%) | 58 (15.6%) |
Disability Class: Ambulatory Difficulty
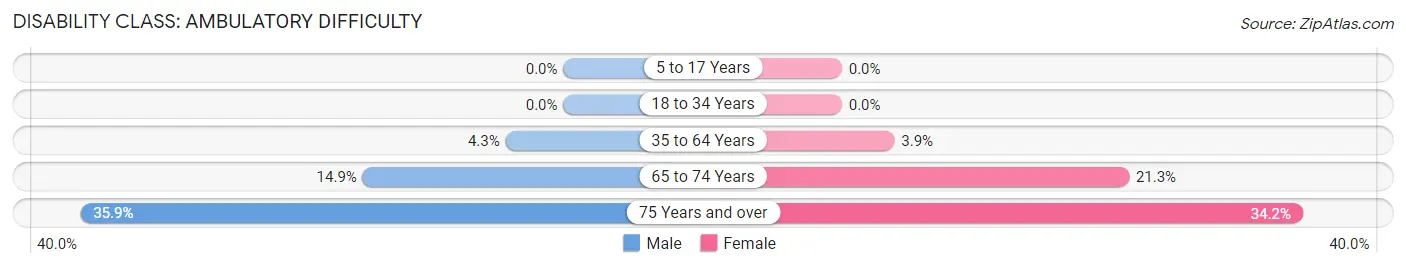
| Age Bracket | Male | Female |
| 5 to 17 Years | 0 (0.0%) | 0 (0.0%) |
| 18 to 34 Years | 0 (0.0%) | 0 (0.0%) |
| 35 to 64 Years | 53 (4.3%) | 51 (3.9%) |
| 65 to 74 Years | 52 (14.9%) | 145 (21.3%) |
| 75 Years and over | 132 (35.9%) | 127 (34.2%) |
Disability Class: Self-Care Difficulty
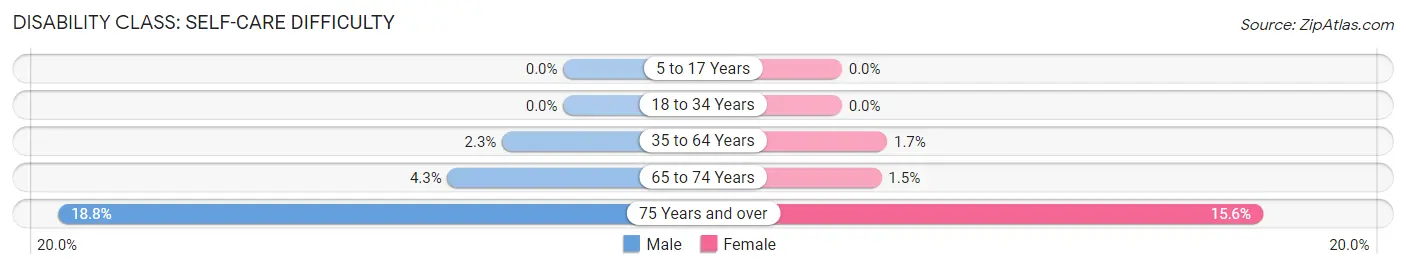
| Age Bracket | Male | Female |
| 5 to 17 Years | 0 (0.0%) | 0 (0.0%) |
| 18 to 34 Years | 0 (0.0%) | 0 (0.0%) |
| 35 to 64 Years | 28 (2.3%) | 22 (1.7%) |
| 65 to 74 Years | 15 (4.3%) | 10 (1.5%) |
| 75 Years and over | 69 (18.8%) | 58 (15.6%) |
Technology Access in The Village
Computing Device Access in The Village
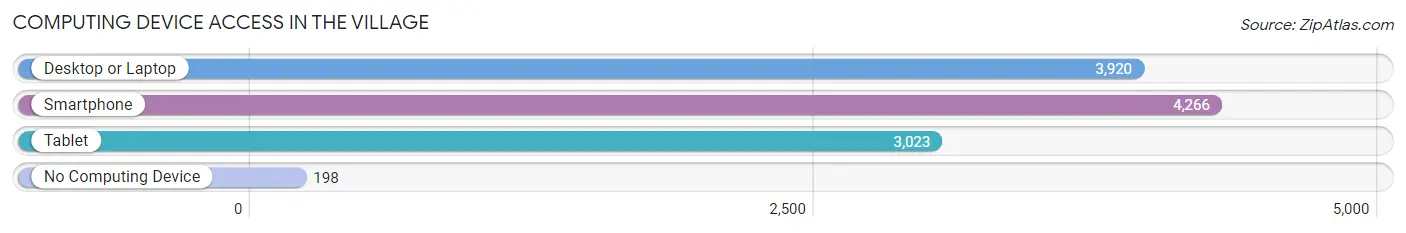
| Device Type | # Households | % Households |
| Desktop or Laptop | 3,920 | 82.5% |
| Smartphone | 4,266 | 89.8% |
| Tablet | 3,023 | 63.7% |
| No Computing Device | 198 | 4.2% |
| Total | 4,749 | 100.0% |
Internet Access in The Village
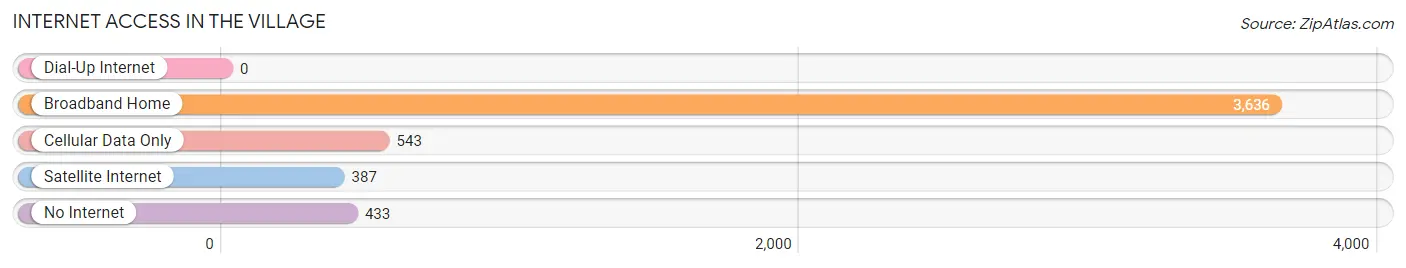
| Internet Type | # Households | % Households |
| Dial-Up Internet | 0 | 0.0% |
| Broadband Home | 3,636 | 76.6% |
| Cellular Data Only | 543 | 11.4% |
| Satellite Internet | 387 | 8.2% |
| No Internet | 433 | 9.1% |
| Total | 4,749 | 100.0% |
The Village Summary
The Village is a city located in Oklahoma County, Oklahoma, United States. It is located in the Oklahoma City metropolitan area and is part of the Oklahoma City-Shawnee Combined Statistical Area. As of the 2010 census, the population of The Village was 8,929.
History
The Village was founded in the early 1900s by a group of settlers from the Choctaw Nation. The settlers named the area The Village because of its rural setting and the fact that it was surrounded by small farms. The Village was incorporated in 1953 and has since grown to become a thriving community.
Geography
The Village is located in Oklahoma County, Oklahoma, approximately 10 miles north of Oklahoma City. It is situated in the Oklahoma City metropolitan area and is part of the Oklahoma City-Shawnee Combined Statistical Area. The Village is bordered by the cities of Nichols Hills, Oklahoma City, and Bethany. The city has a total area of 4.2 square miles, all of which is land.
Economy
The Village has a diverse economy, with a variety of businesses and industries. The city is home to several large employers, including the University of Oklahoma Health Sciences Center, the Oklahoma City Zoo, and the Oklahoma City National Memorial. The Village also has a number of small businesses, including restaurants, retail stores, and professional services.
Demographics
As of the 2010 census, the population of The Village was 8,929. The racial makeup of the city was 79.2% White, 8.2% African American, 0.7% Native American, 4.2% Asian, 0.1% Pacific Islander, 4.3% from other races, and 3.4% from two or more races. Hispanic or Latino of any race were 8.7% of the population.
The median income for a household in The Village was $50,945, and the median income for a family was $60,945. The per capita income for the city was $25,945. About 8.2% of families and 10.2% of the population were below the poverty line, including 14.2% of those under age 18 and 6.2% of those age 65 or over.
The Village is served by the Oklahoma City Public Schools system. The city is also home to several private schools, including The Village School, a K-8 school, and The Village Academy, a high school.
The Village is a vibrant and diverse community, with a variety of businesses, industries, and educational opportunities. The city is home to a number of parks and recreational facilities, including the Oklahoma City Zoo, the Oklahoma City National Memorial, and the University of Oklahoma Health Sciences Center. The Village is a great place to live, work, and play.
Common Questions
What is the Total Population of The Village?
Total Population of The Village is 9,479.
What is the Total Male Population of The Village?
Total Male Population of The Village is 4,281.
What is the Total Female Population of The Village?
Total Female Population of The Village is 5,198.
What is the Ratio of Males per 100 Females in The Village?
There are 82.36 Males per 100 Females in The Village.
What is the Ratio of Females per 100 Males in The Village?
There are 121.42 Females per 100 Males in The Village.
What is the Median Population Age in The Village?
Median Population Age in The Village is 32.5 Years.
What is the Average Family Size in The Village
Average Family Size in The Village is 2.6 People.
What is the Average Household Size in The Village
Average Household Size in The Village is 2.0 People.
What is Per Capita Income in The Village?
Per Capita income in The Village is $42,597.
What is the Median Family Income in The Village?
Median Family Income in The Village is $87,240.
What is the Median Household income in The Village?
Median Household Income in The Village is $67,524.
What is Income or Wage Gap in The Village?
Income or Wage Gap in The Village is 6.8%.
Women in The Village earn 93.2 cents for every dollar earned by a man.
What is Family Income Deficit in The Village?
Family Income Deficit in The Village is $7,751.
Families that are below poverty line in The Village earn $7,751 less on average than the poverty threshold level.
What is Inequality or Gini Index in The Village?
Inequality or Gini Index in The Village is 0.42.
How Large is the Labor Force in The Village?
There are 6,024 People in the Labor Forcein in The Village.
What is the Percentage of People in the Labor Force in The Village?
72.4% of People are in the Labor Force in The Village.
What is the Unemployment Rate in The Village?
Unemployment Rate in The Village is 2.1%.