Maple Ridge, OH
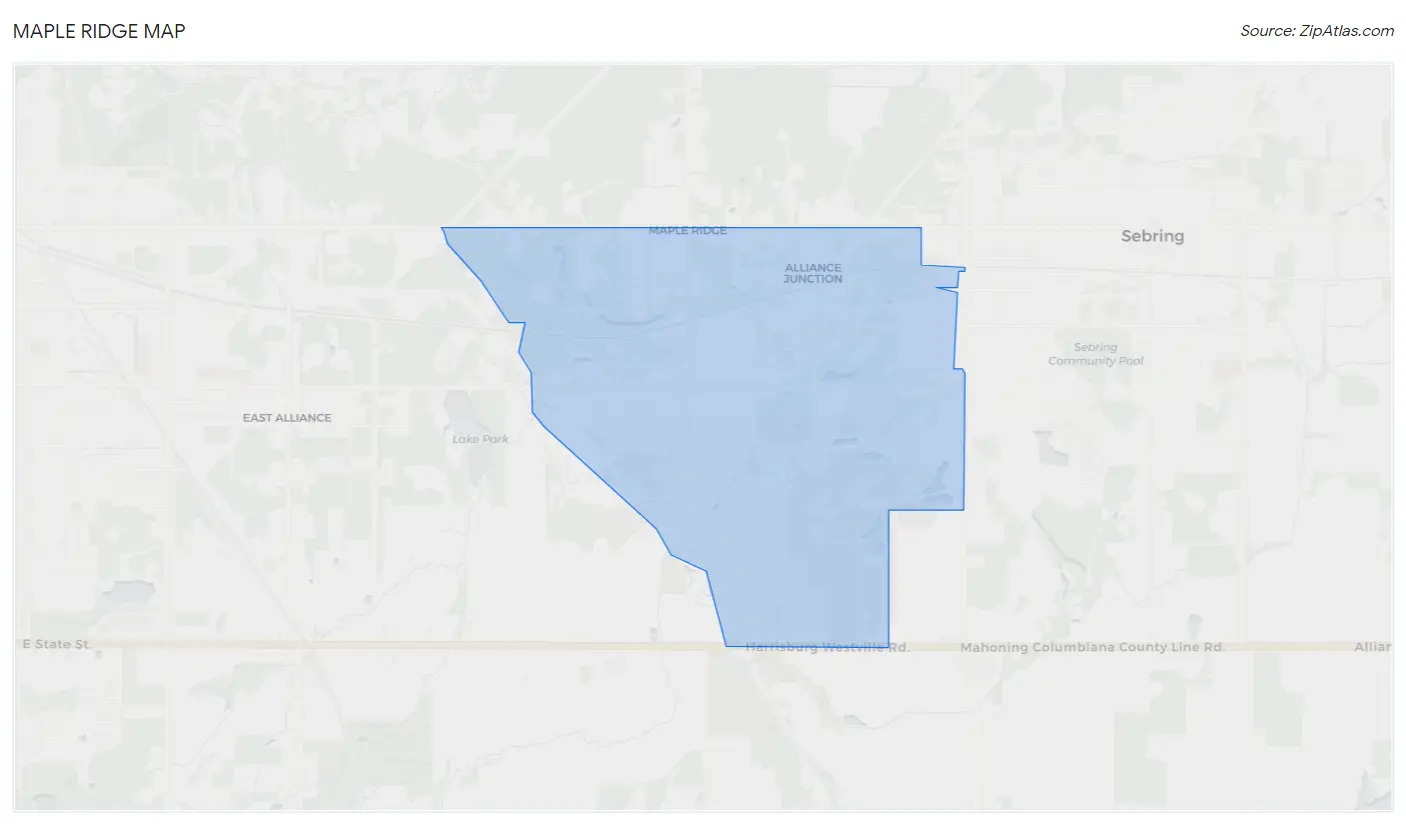
Maple Ridge Map
Maple Ridge Overview
490
TOTAL POPULATION
306
MALE POPULATION
184
FEMALE POPULATION
166.30
MALES / 100 FEMALES
60.13
FEMALES / 100 MALES
58.2
MEDIAN AGE
2.5
AVG FAMILY SIZE
2.0
AVG HOUSEHOLD SIZE
$29,583
PER CAPITA INCOME
$56,473
AVG FAMILY INCOME
$54,213
AVG HOUSEHOLD INCOME
0.28
INEQUALITY / GINI INDEX
289
LABOR FORCE [ PEOPLE ]
64.1%
PERCENT IN LABOR FORCE
4.5%
UNEMPLOYMENT RATE
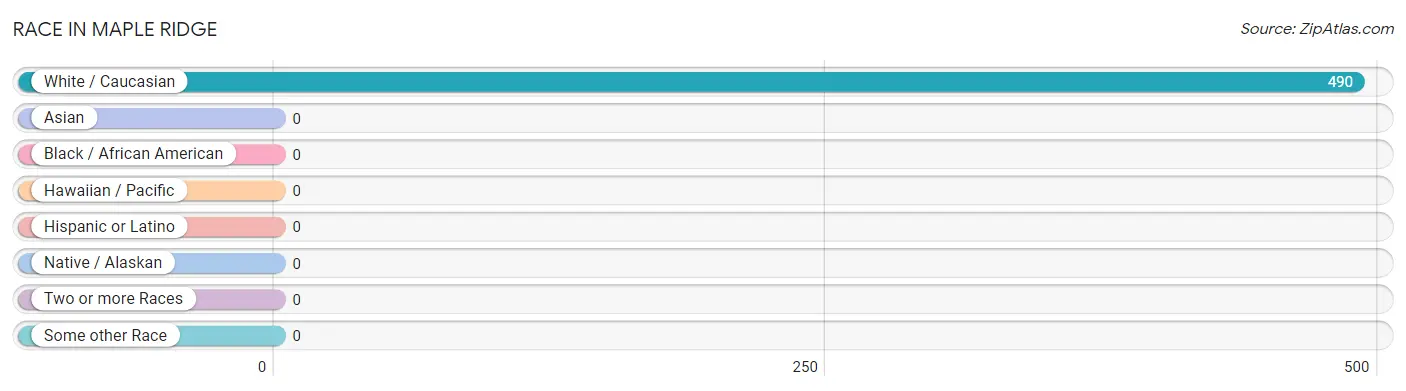
Race in Maple Ridge
The most populous races in Maple Ridge are , and White / Caucasian (490 | 100.0%).
| Race | # Population | % Population |
| Asian | 0 | 0.0% |
| Black / African American | 0 | 0.0% |
| Hawaiian / Pacific | 0 | 0.0% |
| Hispanic or Latino | 0 | 0.0% |
| Native / Alaskan | 0 | 0.0% |
| White / Caucasian | 490 | 100.0% |
| Two or more Races | 0 | 0.0% |
| Some other Race | 0 | 0.0% |
| Total | 490 | 100.0% |
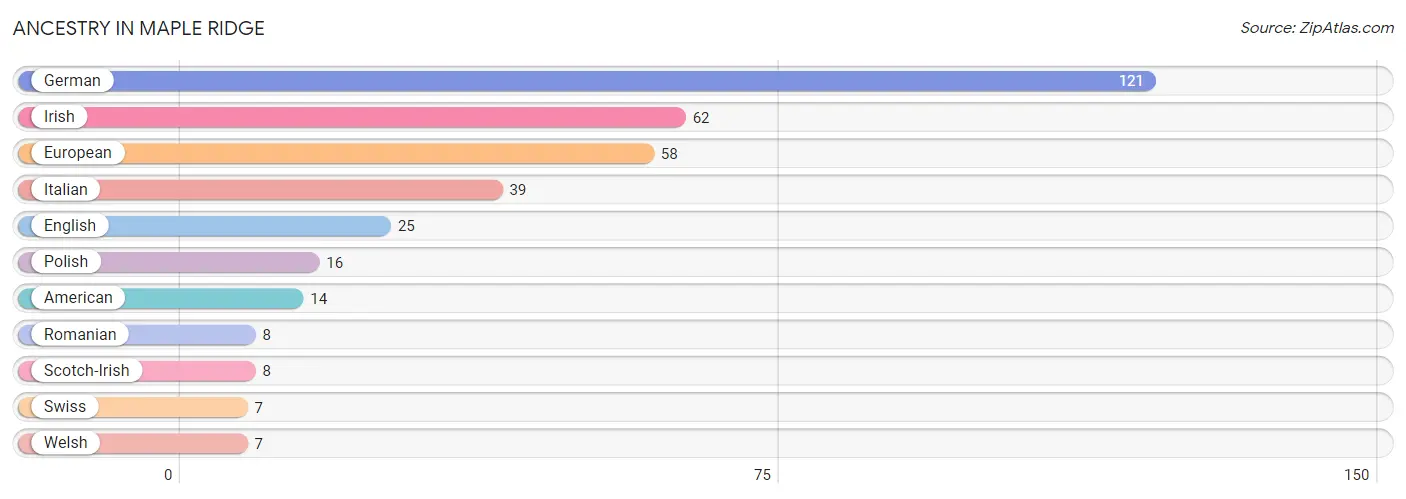
Ancestry in Maple Ridge
The most populous ancestries reported in Maple Ridge are German (121 | 24.7%), Irish (62 | 12.7%), European (58 | 11.8%), Italian (39 | 8.0%), and English (25 | 5.1%), together accounting for 62.2% of all Maple Ridge residents.
| Ancestry | # Population | % Population |
| American | 14 | 2.9% |
| English | 25 | 5.1% |
| European | 58 | 11.8% |
| German | 121 | 24.7% |
| Irish | 62 | 12.7% |
| Italian | 39 | 8.0% |
| Polish | 16 | 3.3% |
| Romanian | 8 | 1.6% |
| Scotch-Irish | 8 | 1.6% |
| Swiss | 7 | 1.4% |
| Welsh | 7 | 1.4% | View All 11 Rows |
Immigrants in Maple Ridge

| Immigration Origin | # Population | % Population | View All 0 Rows |
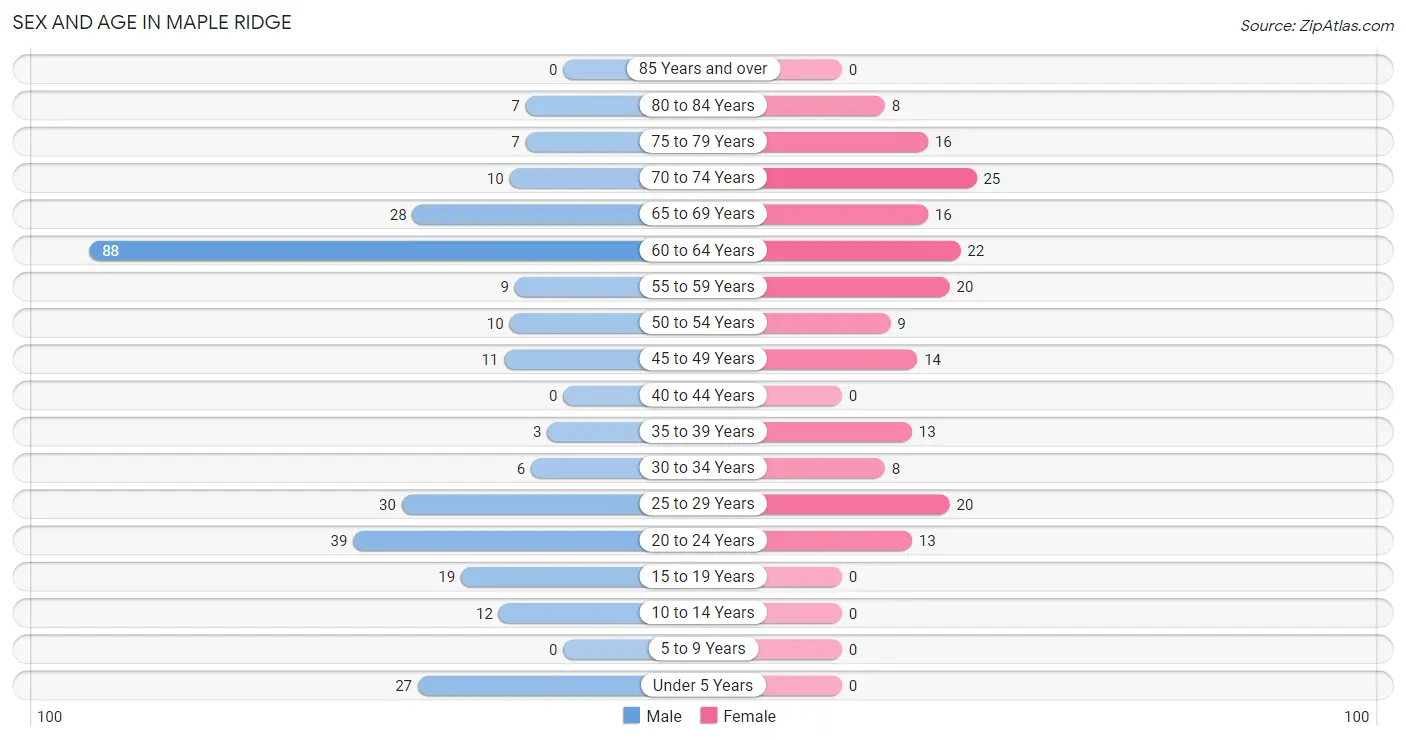
Sex and Age in Maple Ridge
Sex and Age in Maple Ridge
The most populous age groups in Maple Ridge are 60 to 64 Years (88 | 28.8%) for men and 70 to 74 Years (25 | 13.6%) for women.
| Age Bracket | Male | Female |
| Under 5 Years | 27 (8.8%) | 0 (0.0%) |
| 5 to 9 Years | 0 (0.0%) | 0 (0.0%) |
| 10 to 14 Years | 12 (3.9%) | 0 (0.0%) |
| 15 to 19 Years | 19 (6.2%) | 0 (0.0%) |
| 20 to 24 Years | 39 (12.8%) | 13 (7.1%) |
| 25 to 29 Years | 30 (9.8%) | 20 (10.9%) |
| 30 to 34 Years | 6 (2.0%) | 8 (4.3%) |
| 35 to 39 Years | 3 (1.0%) | 13 (7.1%) |
| 40 to 44 Years | 0 (0.0%) | 0 (0.0%) |
| 45 to 49 Years | 11 (3.6%) | 14 (7.6%) |
| 50 to 54 Years | 10 (3.3%) | 9 (4.9%) |
| 55 to 59 Years | 9 (2.9%) | 20 (10.9%) |
| 60 to 64 Years | 88 (28.8%) | 22 (12.0%) |
| 65 to 69 Years | 28 (9.1%) | 16 (8.7%) |
| 70 to 74 Years | 10 (3.3%) | 25 (13.6%) |
| 75 to 79 Years | 7 (2.3%) | 16 (8.7%) |
| 80 to 84 Years | 7 (2.3%) | 8 (4.3%) |
| 85 Years and over | 0 (0.0%) | 0 (0.0%) |
| Total | 306 (100.0%) | 184 (100.0%) |
Families and Households in Maple Ridge
Median Family Size in Maple Ridge
The median family size in Maple Ridge is 2.48 persons per family, with single female/mother families (19 | 12.9%) accounting for the largest median family size of 3.05 persons per family. On the other hand, single male/father families (34 | 23.1%) represent the smallest median family size with 2.15 persons per family.
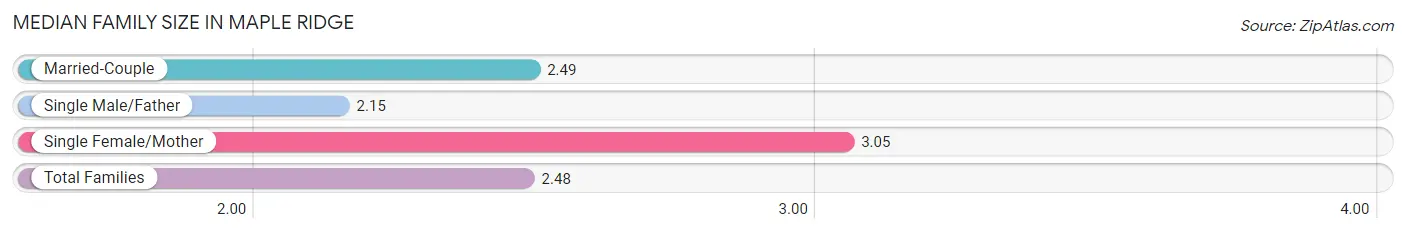
| Family Type | # Families | Family Size |
| Married-Couple | 94 (63.9%) | 2.49 |
| Single Male/Father | 34 (23.1%) | 2.15 |
| Single Female/Mother | 19 (12.9%) | 3.05 |
| Total Families | 147 (100.0%) | 2.48 |
Median Household Size in Maple Ridge
The median household size in Maple Ridge is 2.03 persons per household, with single female/mother households (19 | 7.9%) accounting for the largest median household size of 3.05 persons per household. non-family households (94 | 39.0%) represent the smallest median household size with 1.33 persons per household.
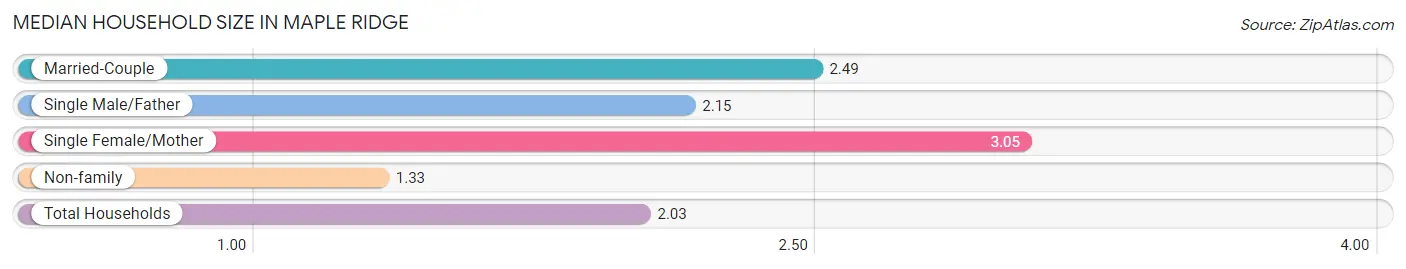
| Household Type | # Households | Household Size |
| Married-Couple | 94 (39.0%) | 2.49 |
| Single Male/Father | 34 (14.1%) | 2.15 |
| Single Female/Mother | 19 (7.9%) | 3.05 |
| Non-family | 94 (39.0%) | 1.33 |
| Total Households | 241 (100.0%) | 2.03 |
Household Size by Marriage Status in Maple Ridge
Out of a total of 241 households in Maple Ridge, 147 (61.0%) are family households, while 94 (39.0%) are nonfamily households. The most numerous type of family households are 2-person households, comprising 92, and the most common type of nonfamily households are 1-person households, comprising 76.
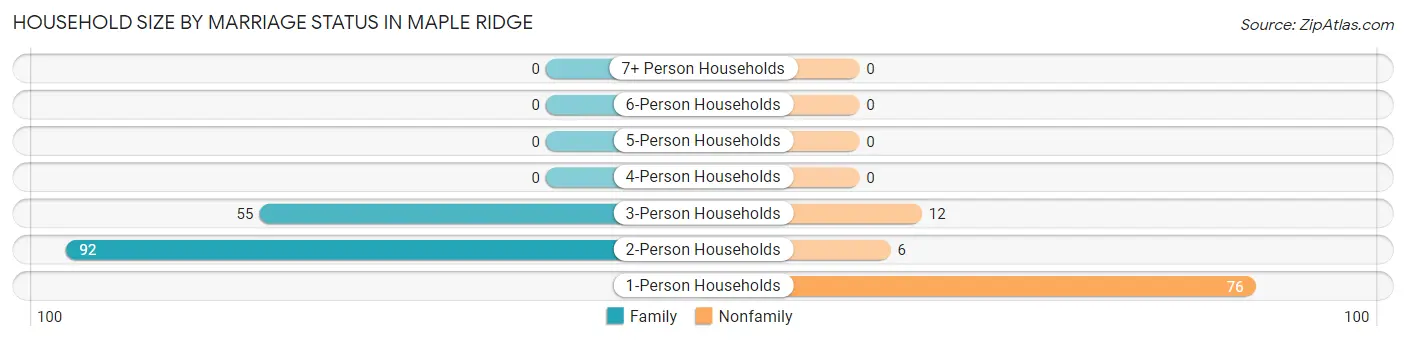
| Household Size | Family Households | Nonfamily Households |
| 1-Person Households | - | 76 (31.5%) |
| 2-Person Households | 92 (38.2%) | 6 (2.5%) |
| 3-Person Households | 55 (22.8%) | 12 (5.0%) |
| 4-Person Households | 0 (0.0%) | 0 (0.0%) |
| 5-Person Households | 0 (0.0%) | 0 (0.0%) |
| 6-Person Households | 0 (0.0%) | 0 (0.0%) |
| 7+ Person Households | 0 (0.0%) | 0 (0.0%) |
| Total | 147 (61.0%) | 94 (39.0%) |
Female Fertility in Maple Ridge
Fertility by Age in Maple Ridge
| Age Bracket | Women with Births | Births / 1,000 Women |
| 15 to 19 years | 0 (0.0%) | 0.0 |
| 20 to 34 years | 0 (0.0%) | 0.0 |
| 35 to 50 years | 0 (0.0%) | 0.0 |
| Total | 0 (0.0%) | 0.0 |
Fertility by Age by Marriage Status in Maple Ridge
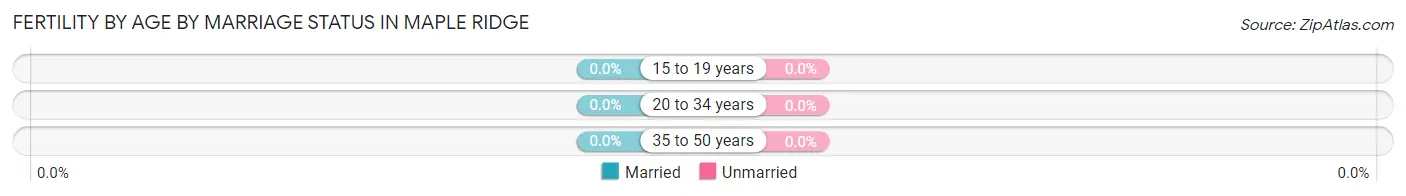
| Age Bracket | Married | Unmarried |
| 15 to 19 years | 0 (0.0%) | 0 (0.0%) |
| 20 to 34 years | 0 (0.0%) | 0 (0.0%) |
| 35 to 50 years | 0 (0.0%) | 0 (0.0%) |
| Total | 0 (0.0%) | 0 (0.0%) |
Fertility by Education in Maple Ridge
| Educational Attainment | Women with Births | Births / 1,000 Women |
| Less than High School | 0 (0.0%) | 0.0 |
| High School Diploma | 0 (0.0%) | 0.0 |
| College or Associate's Degree | 0 (0.0%) | 0.0 |
| Bachelor's Degree | 0 (0.0%) | 0.0 |
| Graduate Degree | 0 (0.0%) | 0.0 |
| Total | 0 (0.0%) | 0.0 |
Fertility by Education by Marriage Status in Maple Ridge
| Educational Attainment | Married | Unmarried |
| Less than High School | 0 (0.0%) | 0 (0.0%) |
| High School Diploma | 0 (0.0%) | 0 (0.0%) |
| College or Associate's Degree | 0 (0.0%) | 0 (0.0%) |
| Bachelor's Degree | 0 (0.0%) | 0 (0.0%) |
| Graduate Degree | 0 (0.0%) | 0 (0.0%) |
| Total | 0 (0.0%) | 0 (0.0%) |
Income in Maple Ridge
Income Overview in Maple Ridge
Per Capita Income in Maple Ridge is $29,583, while median incomes of families and households are $56,473 and $54,213 respectively.
| Characteristic | Number | Measure |
| Per Capita Income | 490 | $29,583 |
| Median Family Income | 147 | $56,473 |
| Mean Family Income | 147 | $69,065 |
| Median Household Income | 241 | $54,213 |
| Mean Household Income | 241 | $58,847 |
| Income Deficit | 147 | $0 |
| Wage / Income Gap (%) | 490 | 0.00% |
| Wage / Income Gap ($) | 490 | 100.00¢ per $1 |
| Gini / Inequality Index | 490 | 0.28 |
Earnings by Sex in Maple Ridge
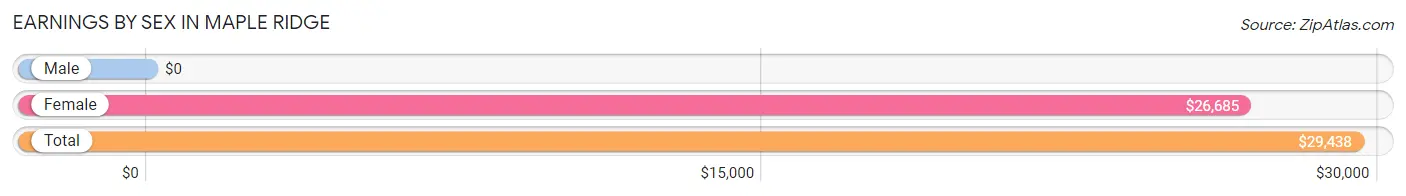
| Sex | Number | Average Earnings |
| Male | 217 (69.6%) | $0 |
| Female | 95 (30.4%) | $26,685 |
| Total | 312 (100.0%) | $29,438 |
Earnings by Sex by Income Bracket in Maple Ridge
The most common earnings brackets in Maple Ridge are $50,000 to $54,999 for men (84 | 38.7%) and $25,000 to $29,999 for women (34 | 35.8%).
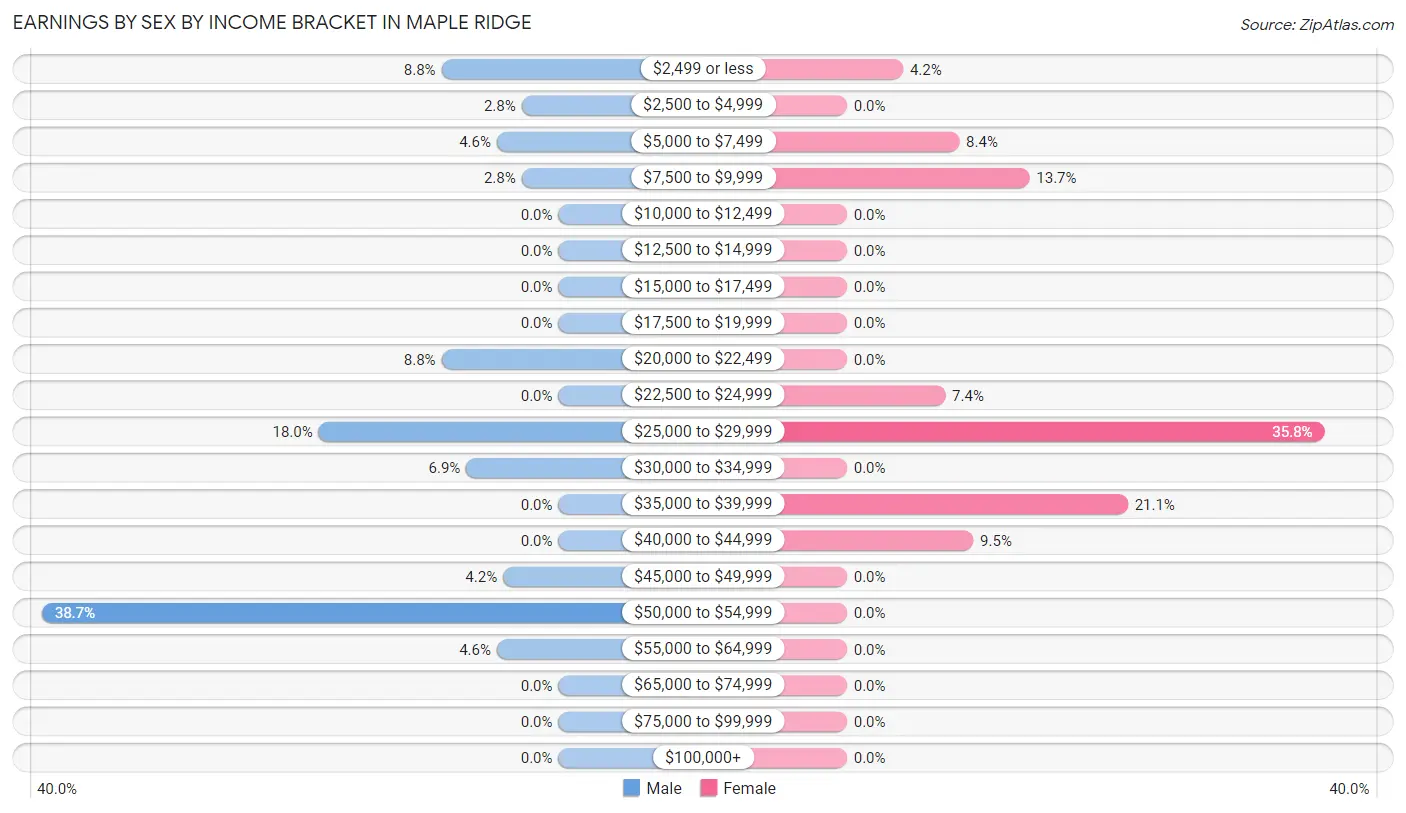
| Income | Male | Female |
| $2,499 or less | 19 (8.8%) | 4 (4.2%) |
| $2,500 to $4,999 | 6 (2.8%) | 0 (0.0%) |
| $5,000 to $7,499 | 10 (4.6%) | 8 (8.4%) |
| $7,500 to $9,999 | 6 (2.8%) | 13 (13.7%) |
| $10,000 to $12,499 | 0 (0.0%) | 0 (0.0%) |
| $12,500 to $14,999 | 0 (0.0%) | 0 (0.0%) |
| $15,000 to $17,499 | 0 (0.0%) | 0 (0.0%) |
| $17,500 to $19,999 | 0 (0.0%) | 0 (0.0%) |
| $20,000 to $22,499 | 19 (8.8%) | 0 (0.0%) |
| $22,500 to $24,999 | 0 (0.0%) | 7 (7.4%) |
| $25,000 to $29,999 | 39 (18.0%) | 34 (35.8%) |
| $30,000 to $34,999 | 15 (6.9%) | 0 (0.0%) |
| $35,000 to $39,999 | 0 (0.0%) | 20 (21.0%) |
| $40,000 to $44,999 | 0 (0.0%) | 9 (9.5%) |
| $45,000 to $49,999 | 9 (4.2%) | 0 (0.0%) |
| $50,000 to $54,999 | 84 (38.7%) | 0 (0.0%) |
| $55,000 to $64,999 | 10 (4.6%) | 0 (0.0%) |
| $65,000 to $74,999 | 0 (0.0%) | 0 (0.0%) |
| $75,000 to $99,999 | 0 (0.0%) | 0 (0.0%) |
| $100,000+ | 0 (0.0%) | 0 (0.0%) |
| Total | 217 (100.0%) | 95 (100.0%) |
Earnings by Sex by Educational Attainment in Maple Ridge
Average earnings in Maple Ridge are $29,957 for men and $27,391 for women, a difference of 8.6%. Men with an educational attainment of less than high school enjoy the highest average annual earnings of $53,382, while those with college or associate's degree education earn the least with $7,000. Women with an educational attainment of high school diploma earn the most with the average annual earnings of $35,188, while those with high school diploma education have the smallest earnings of $35,188.
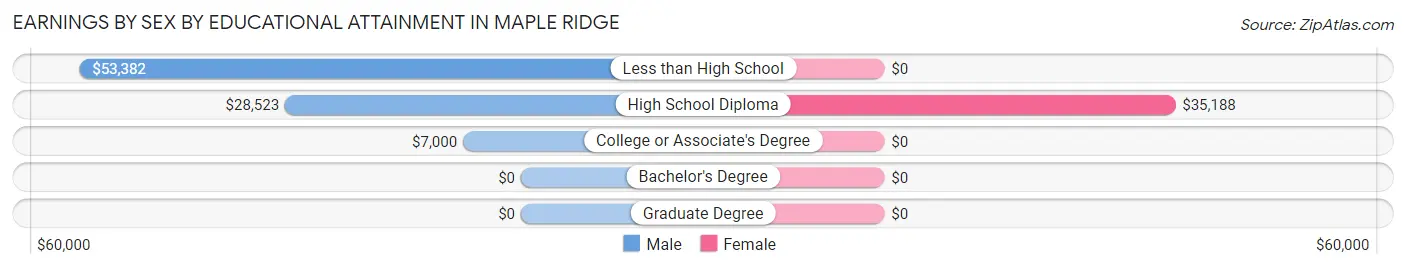
| Educational Attainment | Male Income | Female Income |
| Less than High School | $53,382 | $0 |
| High School Diploma | $28,523 | $35,188 |
| College or Associate's Degree | $7,000 | $0 |
| Bachelor's Degree | - | - |
| Graduate Degree | - | - |
| Total | $29,957 | $27,391 |
Family Income in Maple Ridge
Family Income Brackets in Maple Ridge
According to the Maple Ridge family income data, there are 60 families falling into the $50,000 to $74,999 income range, which is the most common income bracket and makes up 40.8% of all families.
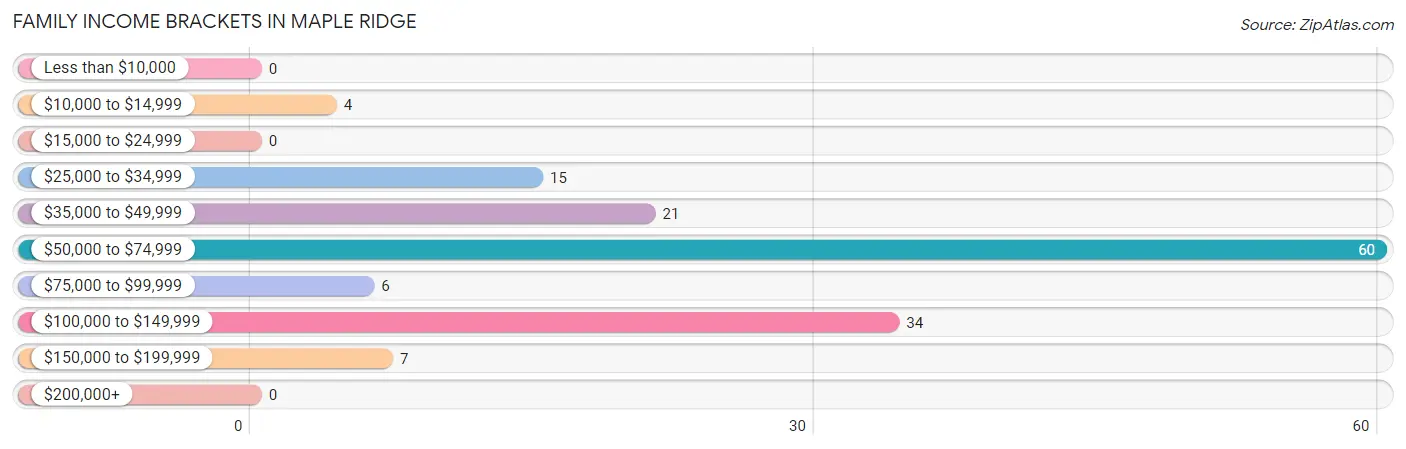
| Income Bracket | # Families | % Families |
| Less than $10,000 | 0 | 0.0% |
| $10,000 to $14,999 | 4 | 2.7% |
| $15,000 to $24,999 | 0 | 0.0% |
| $25,000 to $34,999 | 15 | 10.2% |
| $35,000 to $49,999 | 21 | 14.3% |
| $50,000 to $74,999 | 60 | 40.8% |
| $75,000 to $99,999 | 6 | 4.1% |
| $100,000 to $149,999 | 34 | 23.1% |
| $150,000 to $199,999 | 7 | 4.8% |
| $200,000+ | 0 | 0.0% |
Family Income by Famaliy Size in Maple Ridge
2-person families (92 | 62.6%) account for the highest median family income in Maple Ridge with $82,917 per family, while 2-person families (92 | 62.6%) have the highest median income of $41,458 per family member.
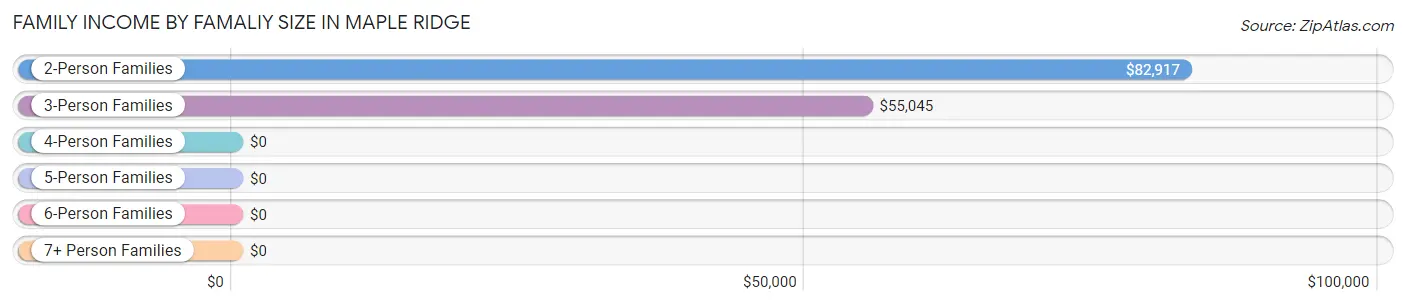
| Income Bracket | # Families | Median Income |
| 2-Person Families | 92 (62.6%) | $82,917 |
| 3-Person Families | 55 (37.4%) | $55,045 |
| 4-Person Families | 0 (0.0%) | $0 |
| 5-Person Families | 0 (0.0%) | $0 |
| 6-Person Families | 0 (0.0%) | $0 |
| 7+ Person Families | 0 (0.0%) | $0 |
| Total | 147 (100.0%) | $56,473 |
Family Income by Number of Earners in Maple Ridge
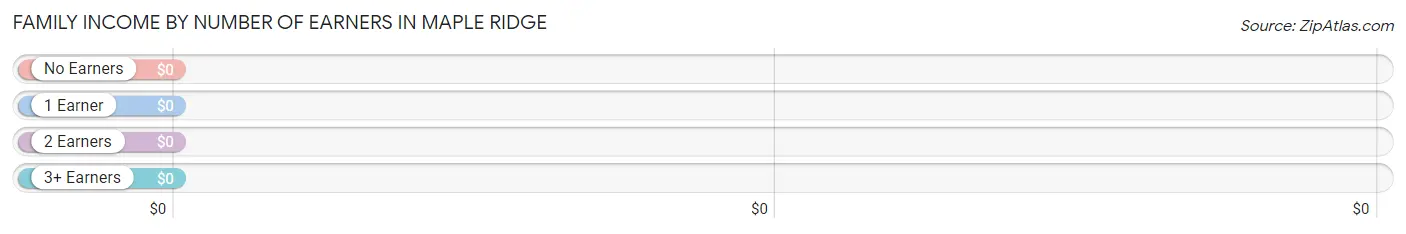
| Number of Earners | # Families | Median Income |
| No Earners | 22 (15.0%) | $0 |
| 1 Earner | 36 (24.5%) | $0 |
| 2 Earners | 89 (60.5%) | $0 |
| 3+ Earners | 0 (0.0%) | $0 |
| Total | 147 (100.0%) | $56,473 |
Household Income in Maple Ridge
Household Income Brackets in Maple Ridge
With 99 households falling in the category, the $50,000 to $74,999 income range is the most frequent in Maple Ridge, accounting for 41.1% of all households.
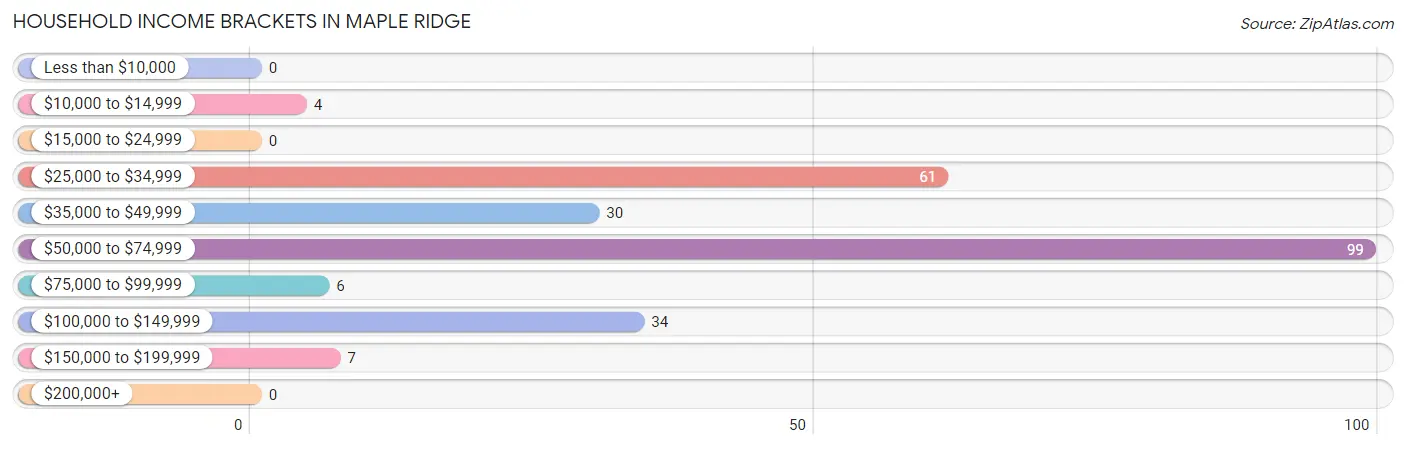
| Income Bracket | # Households | % Households |
| Less than $10,000 | 0 | 0.0% |
| $10,000 to $14,999 | 4 | 1.7% |
| $15,000 to $24,999 | 0 | 0.0% |
| $25,000 to $34,999 | 61 | 25.3% |
| $35,000 to $49,999 | 30 | 12.4% |
| $50,000 to $74,999 | 99 | 41.1% |
| $75,000 to $99,999 | 6 | 2.5% |
| $100,000 to $149,999 | 34 | 14.1% |
| $150,000 to $199,999 | 7 | 2.9% |
| $200,000+ | 0 | 0.0% |
Household Income by Householder Age in Maple Ridge
The median household income in Maple Ridge is $54,213, with the highest median household income of $56,369 found in the 45 to 64 years age bracket for the primary householder. A total of 121 households (50.2%) fall into this category.
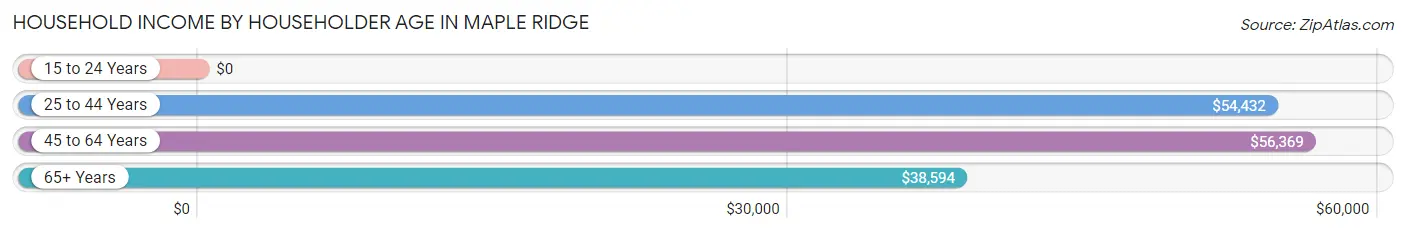
| Income Bracket | # Households | Median Income |
| 15 to 24 Years | 0 (0.0%) | $0 |
| 25 to 44 Years | 43 (17.8%) | $54,432 |
| 45 to 64 Years | 121 (50.2%) | $56,369 |
| 65+ Years | 77 (32.0%) | $38,594 |
| Total | 241 (100.0%) | $54,213 |
Poverty in Maple Ridge
Income Below Poverty by Sex and Age in Maple Ridge
With 4.6% poverty level for males and 7.1% for females among the residents of Maple Ridge, 16 and 17 year old males and 55 to 64 year old females are the most vulnerable to poverty, with 11 males (100.0%) and 9 females (21.4%) in their respective age groups living below the poverty level.
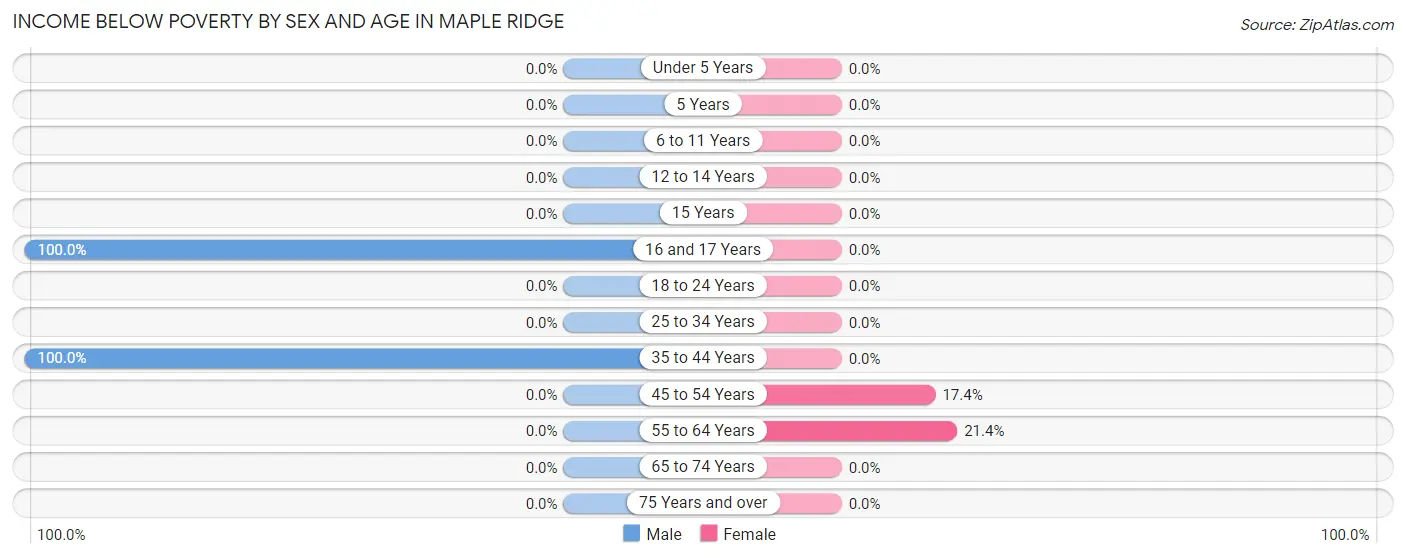
| Age Bracket | Male | Female |
| Under 5 Years | 0 (0.0%) | 0 (0.0%) |
| 5 Years | 0 (0.0%) | 0 (0.0%) |
| 6 to 11 Years | 0 (0.0%) | 0 (0.0%) |
| 12 to 14 Years | 0 (0.0%) | 0 (0.0%) |
| 15 Years | 0 (0.0%) | 0 (0.0%) |
| 16 and 17 Years | 11 (100.0%) | 0 (0.0%) |
| 18 to 24 Years | 0 (0.0%) | 0 (0.0%) |
| 25 to 34 Years | 0 (0.0%) | 0 (0.0%) |
| 35 to 44 Years | 3 (100.0%) | 0 (0.0%) |
| 45 to 54 Years | 0 (0.0%) | 4 (17.4%) |
| 55 to 64 Years | 0 (0.0%) | 9 (21.4%) |
| 65 to 74 Years | 0 (0.0%) | 0 (0.0%) |
| 75 Years and over | 0 (0.0%) | 0 (0.0%) |
| Total | 14 (4.6%) | 13 (7.1%) |
Income Above Poverty by Sex and Age in Maple Ridge
According to the poverty statistics in Maple Ridge, males aged under 5 years and females aged 18 to 24 years are the age groups that are most secure financially, with 100.0% of males and 100.0% of females in these age groups living above the poverty line.
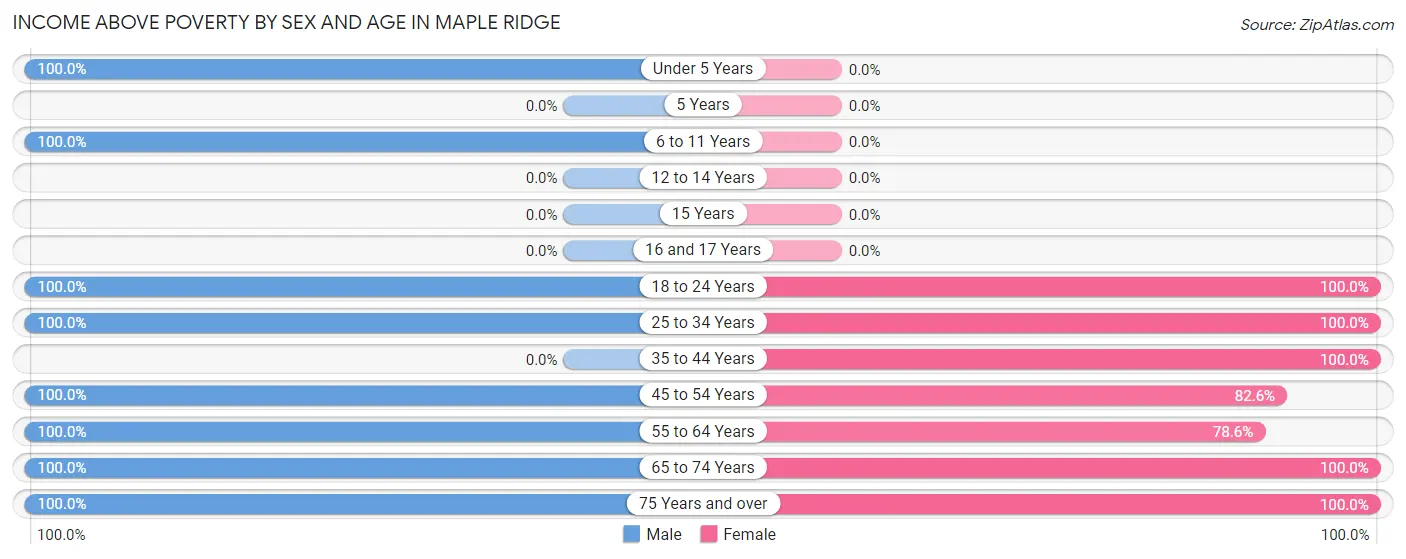
| Age Bracket | Male | Female |
| Under 5 Years | 27 (100.0%) | 0 (0.0%) |
| 5 Years | 0 (0.0%) | 0 (0.0%) |
| 6 to 11 Years | 12 (100.0%) | 0 (0.0%) |
| 12 to 14 Years | 0 (0.0%) | 0 (0.0%) |
| 15 Years | 0 (0.0%) | 0 (0.0%) |
| 16 and 17 Years | 0 (0.0%) | 0 (0.0%) |
| 18 to 24 Years | 47 (100.0%) | 13 (100.0%) |
| 25 to 34 Years | 36 (100.0%) | 28 (100.0%) |
| 35 to 44 Years | 0 (0.0%) | 13 (100.0%) |
| 45 to 54 Years | 21 (100.0%) | 19 (82.6%) |
| 55 to 64 Years | 97 (100.0%) | 33 (78.6%) |
| 65 to 74 Years | 38 (100.0%) | 41 (100.0%) |
| 75 Years and over | 14 (100.0%) | 24 (100.0%) |
| Total | 292 (95.4%) | 171 (92.9%) |
Income Below Poverty Among Married-Couple Families in Maple Ridge
The poverty statistics for married-couple families in Maple Ridge show that 4.3% or 4 of the total 94 families live below the poverty line. Families with no children have the highest poverty rate of 5.3%, comprising of 4 families. On the other hand, families with 1 or 2 children have the lowest poverty rate of 0.0%, which includes 0 families.
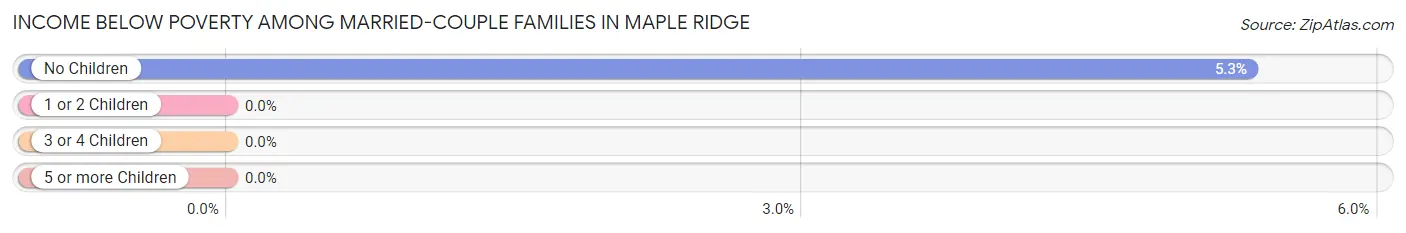
| Children | Above Poverty | Below Poverty |
| No Children | 71 (94.7%) | 4 (5.3%) |
| 1 or 2 Children | 19 (100.0%) | 0 (0.0%) |
| 3 or 4 Children | 0 (0.0%) | 0 (0.0%) |
| 5 or more Children | 0 (0.0%) | 0 (0.0%) |
| Total | 90 (95.7%) | 4 (4.3%) |
Income Below Poverty Among Single-Parent Households in Maple Ridge
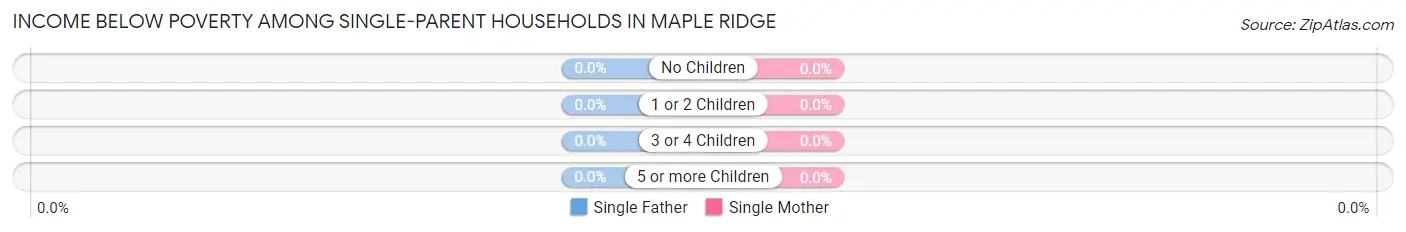
| Children | Single Father | Single Mother |
| No Children | 0 (0.0%) | 0 (0.0%) |
| 1 or 2 Children | 0 (0.0%) | 0 (0.0%) |
| 3 or 4 Children | 0 (0.0%) | 0 (0.0%) |
| 5 or more Children | 0 (0.0%) | 0 (0.0%) |
| Total | 0 (0.0%) | 0 (0.0%) |
Income Below Poverty Among Married-Couple vs Single-Parent Households in Maple Ridge
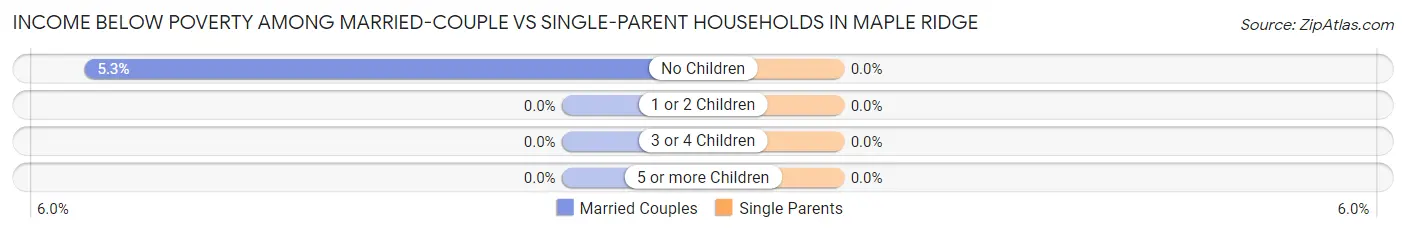
| Children | Married-Couple Families | Single-Parent Households |
| No Children | 4 (5.3%) | 0 (0.0%) |
| 1 or 2 Children | 0 (0.0%) | 0 (0.0%) |
| 3 or 4 Children | 0 (0.0%) | 0 (0.0%) |
| 5 or more Children | 0 (0.0%) | 0 (0.0%) |
| Total | 4 (4.3%) | 0 (0.0%) |
Employment Characteristics in Maple Ridge
Employment by Class of Employer in Maple Ridge
Among the 276 employed individuals in Maple Ridge, private company employees (235 | 85.1%), and not-for-profit organizations (41 | 14.9%) make up the most common classes of employment.
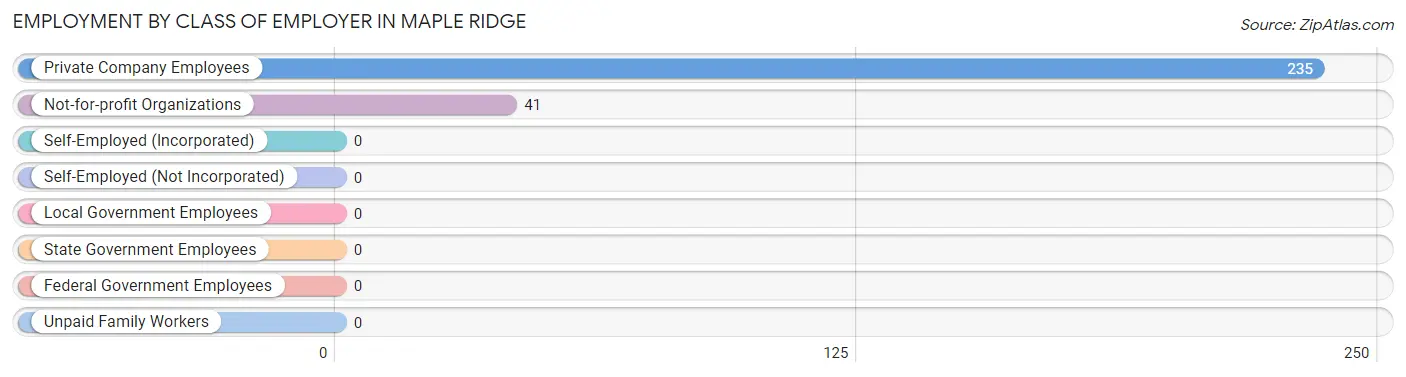
| Employer Class | # Employees | % Employees |
| Private Company Employees | 235 | 85.1% |
| Self-Employed (Incorporated) | 0 | 0.0% |
| Self-Employed (Not Incorporated) | 0 | 0.0% |
| Not-for-profit Organizations | 41 | 14.9% |
| Local Government Employees | 0 | 0.0% |
| State Government Employees | 0 | 0.0% |
| Federal Government Employees | 0 | 0.0% |
| Unpaid Family Workers | 0 | 0.0% |
| Total | 276 | 100.0% |
Employment Status by Age in Maple Ridge
According to the labor force statistics for Maple Ridge, out of the total population over 16 years of age (451), 64.1% or 289 individuals are in the labor force, with 4.5% or 13 of them unemployed. The age group with the highest labor force participation rate is 20 to 24 years, with 100.0% or 52 individuals in the labor force. Within the labor force, the 20 to 24 years age range has the highest percentage of unemployed individuals, with 25.0% or 13 of them being unemployed.
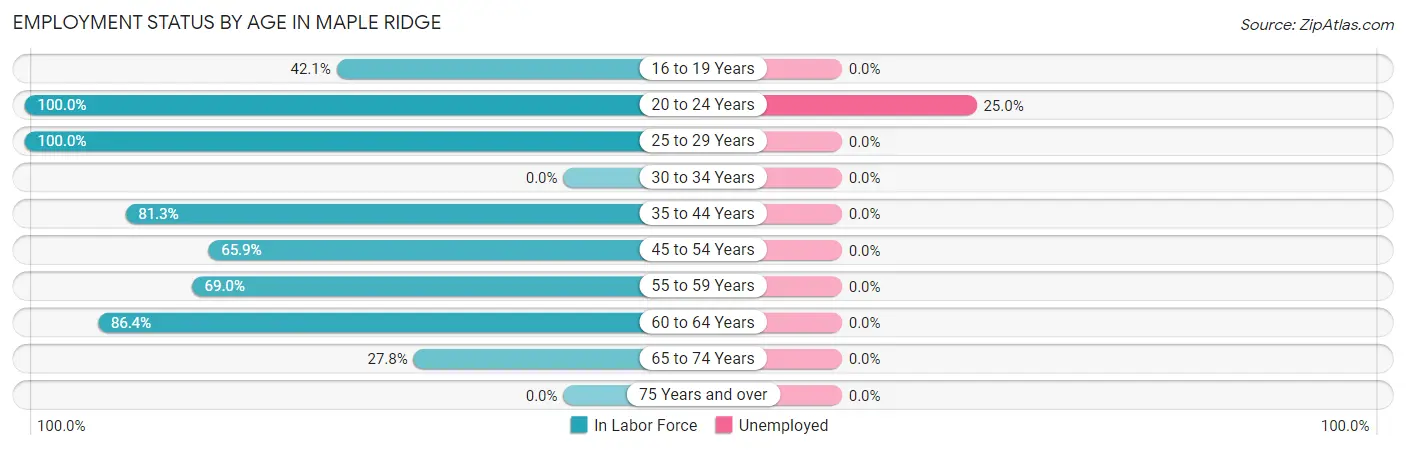
| Age Bracket | In Labor Force | Unemployed |
| 16 to 19 Years | 8 (42.1%) | 0 (0.0%) |
| 20 to 24 Years | 52 (100.0%) | 13 (25.0%) |
| 25 to 29 Years | 50 (100.0%) | 0 (0.0%) |
| 30 to 34 Years | 0 (0.0%) | 0 (0.0%) |
| 35 to 44 Years | 13 (81.3%) | 0 (0.0%) |
| 45 to 54 Years | 29 (65.9%) | 0 (0.0%) |
| 55 to 59 Years | 20 (69.0%) | 0 (0.0%) |
| 60 to 64 Years | 95 (86.4%) | 0 (0.0%) |
| 65 to 74 Years | 22 (27.8%) | 0 (0.0%) |
| 75 Years and over | 0 (0.0%) | 0 (0.0%) |
| Total | 289 (64.1%) | 13 (4.5%) |
Employment Status by Educational Attainment in Maple Ridge

| Educational Attainment | In Labor Force | Unemployed |
| Less than High School | 75 (91.5%) | 0 (0.0%) |
| High School Diploma | 104 (83.2%) | 0 (0.0%) |
| College / Associate Degree | 28 (59.6%) | 0 (0.0%) |
| Bachelor's Degree or higher | 0 (0.0%) | 0 (0.0%) |
| Total | 207 (78.7%) | 0 (0.0%) |
Employment Occupations by Sex in Maple Ridge
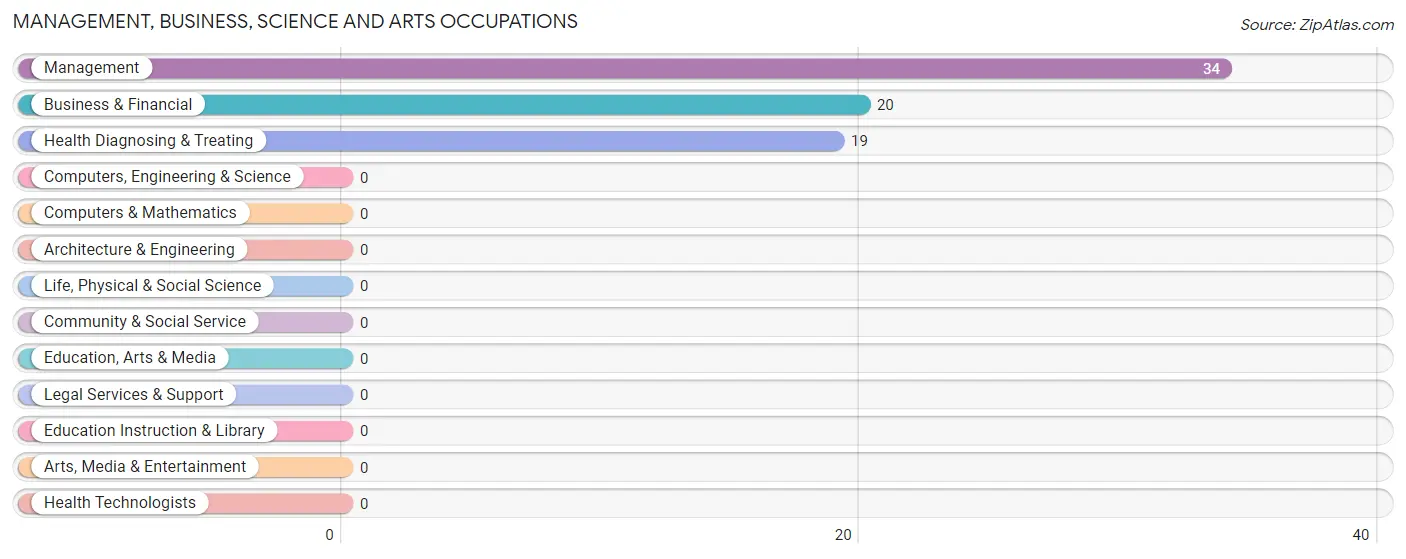
Management, Business, Science and Arts Occupations
The most common Management, Business, Science and Arts occupations in Maple Ridge are Management (34 | 12.3%), Business & Financial (20 | 7.2%), and Health Diagnosing & Treating (19 | 6.9%).
Management, Business, Science and Arts Occupations by Sex
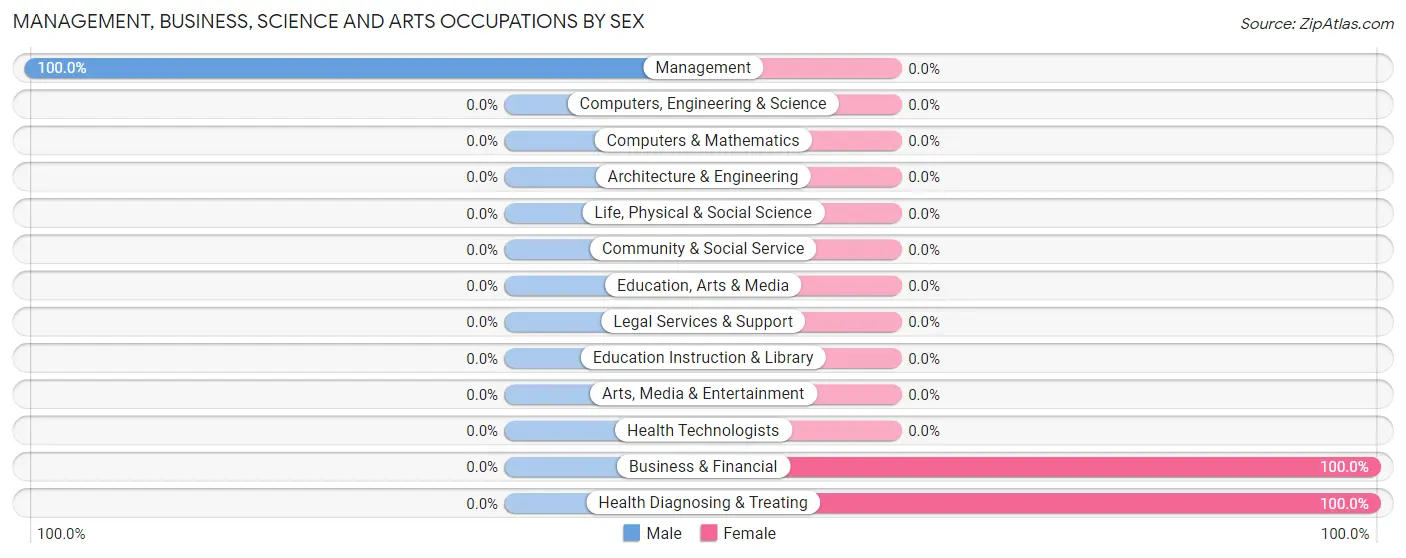
| Occupation | Male | Female |
| Management | 34 (100.0%) | 0 (0.0%) |
| Business & Financial | 0 (0.0%) | 20 (100.0%) |
| Computers, Engineering & Science | 0 (0.0%) | 0 (0.0%) |
| Computers & Mathematics | 0 (0.0%) | 0 (0.0%) |
| Architecture & Engineering | 0 (0.0%) | 0 (0.0%) |
| Life, Physical & Social Science | 0 (0.0%) | 0 (0.0%) |
| Community & Social Service | 0 (0.0%) | 0 (0.0%) |
| Education, Arts & Media | 0 (0.0%) | 0 (0.0%) |
| Legal Services & Support | 0 (0.0%) | 0 (0.0%) |
| Education Instruction & Library | 0 (0.0%) | 0 (0.0%) |
| Arts, Media & Entertainment | 0 (0.0%) | 0 (0.0%) |
| Health Diagnosing & Treating | 0 (0.0%) | 19 (100.0%) |
| Health Technologists | 0 (0.0%) | 0 (0.0%) |
| Total (Category) | 34 (46.6%) | 39 (53.4%) |
| Total (Overall) | 206 (74.6%) | 70 (25.4%) |
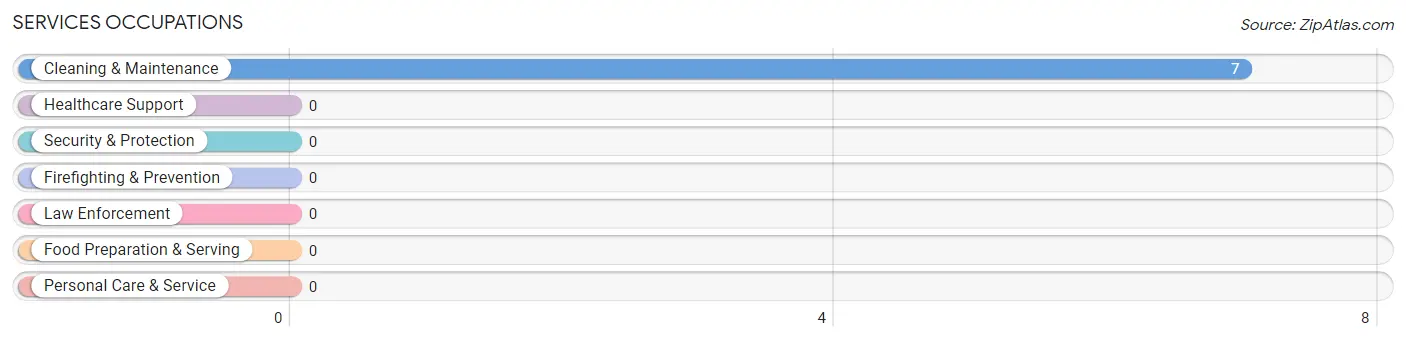
Services Occupations
The most common Services occupations in Maple Ridge are , and Cleaning & Maintenance (7 | 2.5%).
Services Occupations by Sex
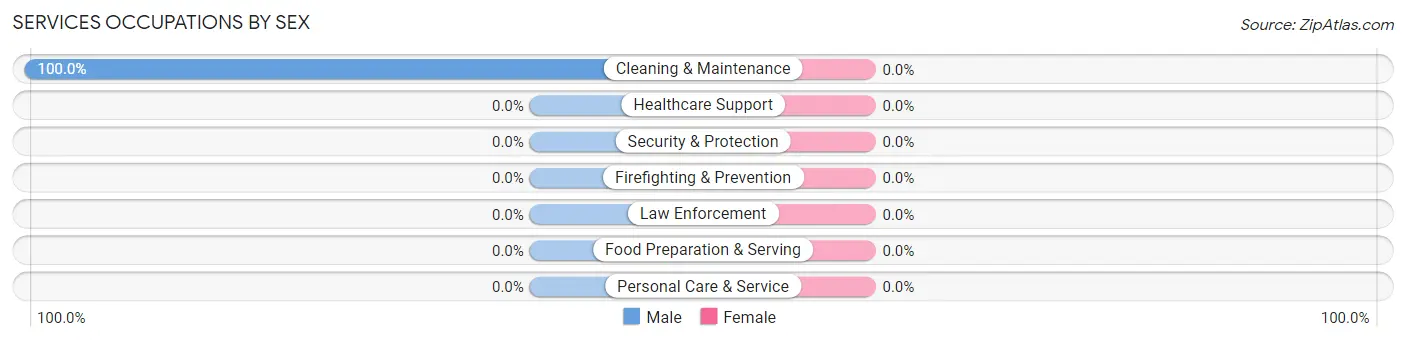
| Occupation | Male | Female |
| Healthcare Support | 0 (0.0%) | 0 (0.0%) |
| Security & Protection | 0 (0.0%) | 0 (0.0%) |
| Firefighting & Prevention | 0 (0.0%) | 0 (0.0%) |
| Law Enforcement | 0 (0.0%) | 0 (0.0%) |
| Food Preparation & Serving | 0 (0.0%) | 0 (0.0%) |
| Cleaning & Maintenance | 7 (100.0%) | 0 (0.0%) |
| Personal Care & Service | 0 (0.0%) | 0 (0.0%) |
| Total (Category) | 7 (100.0%) | 0 (0.0%) |
| Total (Overall) | 206 (74.6%) | 70 (25.4%) |
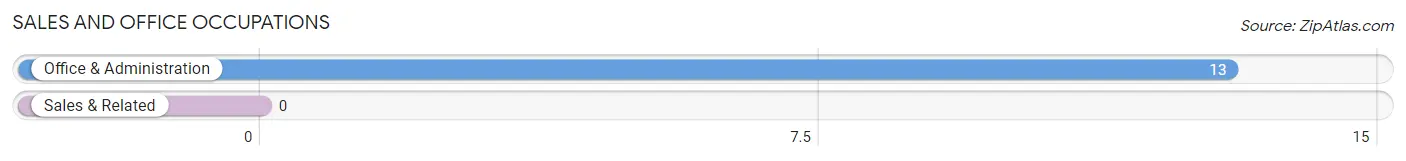
Sales and Office Occupations
The most common Sales and Office occupations in Maple Ridge are , and Office & Administration (13 | 4.7%).
Sales and Office Occupations by Sex
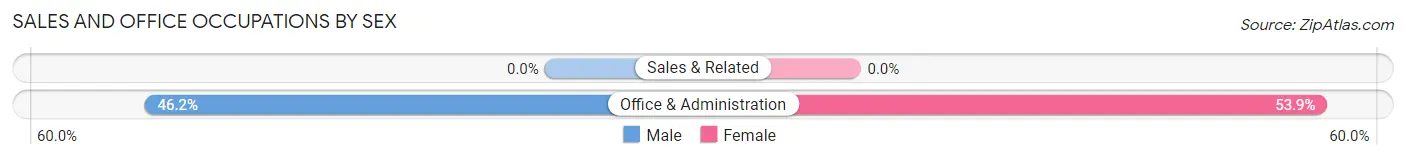
| Occupation | Male | Female |
| Sales & Related | 0 (0.0%) | 0 (0.0%) |
| Office & Administration | 6 (46.2%) | 7 (53.8%) |
| Total (Category) | 6 (46.2%) | 7 (53.8%) |
| Total (Overall) | 206 (74.6%) | 70 (25.4%) |
Natural Resources, Construction and Maintenance Occupations
The most common Natural Resources, Construction and Maintenance occupations in Maple Ridge are Construction & Extraction (50 | 18.1%), and Installation, Maintenance & Repair (21 | 7.6%).
Natural Resources, Construction and Maintenance Occupations by Sex
| Occupation | Male | Female |
| Farming, Fishing & Forestry | 0 (0.0%) | 0 (0.0%) |
| Construction & Extraction | 50 (100.0%) | 0 (0.0%) |
| Installation, Maintenance & Repair | 21 (100.0%) | 0 (0.0%) |
| Total (Category) | 71 (100.0%) | 0 (0.0%) |
| Total (Overall) | 206 (74.6%) | 70 (25.4%) |
Production, Transportation and Moving Occupations
The most common Production, Transportation and Moving occupations in Maple Ridge are Material Moving (39 | 14.1%), Production (38 | 13.8%), and Transportation (35 | 12.7%).
Production, Transportation and Moving Occupations by Sex
| Occupation | Male | Female |
| Production | 25 (65.8%) | 13 (34.2%) |
| Transportation | 35 (100.0%) | 0 (0.0%) |
| Material Moving | 28 (71.8%) | 11 (28.2%) |
| Total (Category) | 88 (78.6%) | 24 (21.4%) |
| Total (Overall) | 206 (74.6%) | 70 (25.4%) |
Employment Industries by Sex in Maple Ridge
Employment Industries in Maple Ridge
The major employment industries in Maple Ridge include Construction (73 | 26.5%), Manufacturing (71 | 25.7%), Transportation & Warehousing (49 | 17.7%), Retail Trade (30 | 10.9%), and Health Care & Social Assistance (25 | 9.1%).
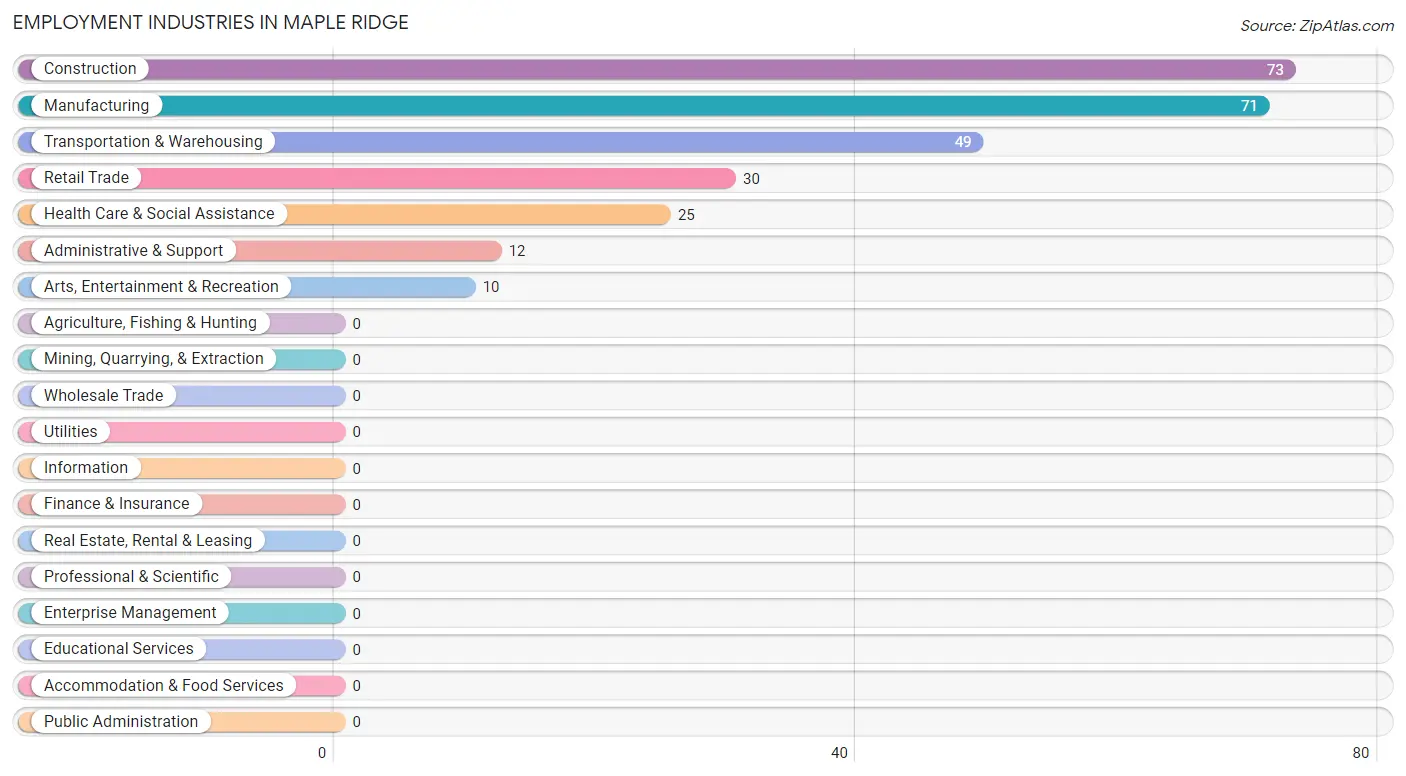
Employment Industries by Sex in Maple Ridge
The Maple Ridge industries that see more men than women are Construction (100.0%), Administrative & Support (100.0%), and Arts, Entertainment & Recreation (100.0%), whereas the industries that tend to have a higher number of women are Health Care & Social Assistance (76.0%), Transportation & Warehousing (40.8%), and Retail Trade (36.7%).
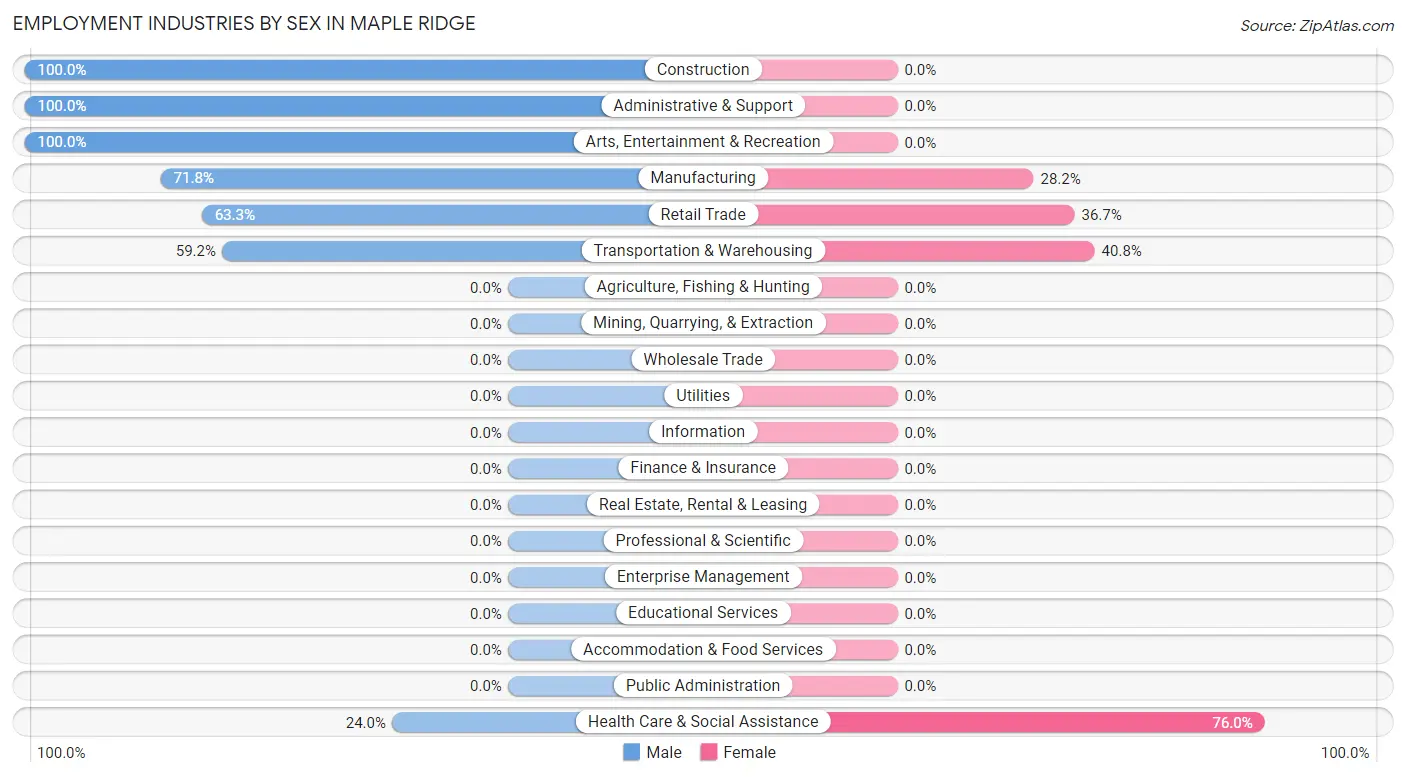
| Industry | Male | Female |
| Agriculture, Fishing & Hunting | 0 (0.0%) | 0 (0.0%) |
| Mining, Quarrying, & Extraction | 0 (0.0%) | 0 (0.0%) |
| Construction | 73 (100.0%) | 0 (0.0%) |
| Manufacturing | 51 (71.8%) | 20 (28.2%) |
| Wholesale Trade | 0 (0.0%) | 0 (0.0%) |
| Retail Trade | 19 (63.3%) | 11 (36.7%) |
| Transportation & Warehousing | 29 (59.2%) | 20 (40.8%) |
| Utilities | 0 (0.0%) | 0 (0.0%) |
| Information | 0 (0.0%) | 0 (0.0%) |
| Finance & Insurance | 0 (0.0%) | 0 (0.0%) |
| Real Estate, Rental & Leasing | 0 (0.0%) | 0 (0.0%) |
| Professional & Scientific | 0 (0.0%) | 0 (0.0%) |
| Enterprise Management | 0 (0.0%) | 0 (0.0%) |
| Administrative & Support | 12 (100.0%) | 0 (0.0%) |
| Educational Services | 0 (0.0%) | 0 (0.0%) |
| Health Care & Social Assistance | 6 (24.0%) | 19 (76.0%) |
| Arts, Entertainment & Recreation | 10 (100.0%) | 0 (0.0%) |
| Accommodation & Food Services | 0 (0.0%) | 0 (0.0%) |
| Public Administration | 0 (0.0%) | 0 (0.0%) |
| Total | 206 (74.6%) | 70 (25.4%) |
Education in Maple Ridge
School Enrollment in Maple Ridge
The most common levels of schooling among the 67 students in Maple Ridge are nursery / preschool (27 | 40.3%), high school (19 | 28.4%), and middle school (12 | 17.9%).
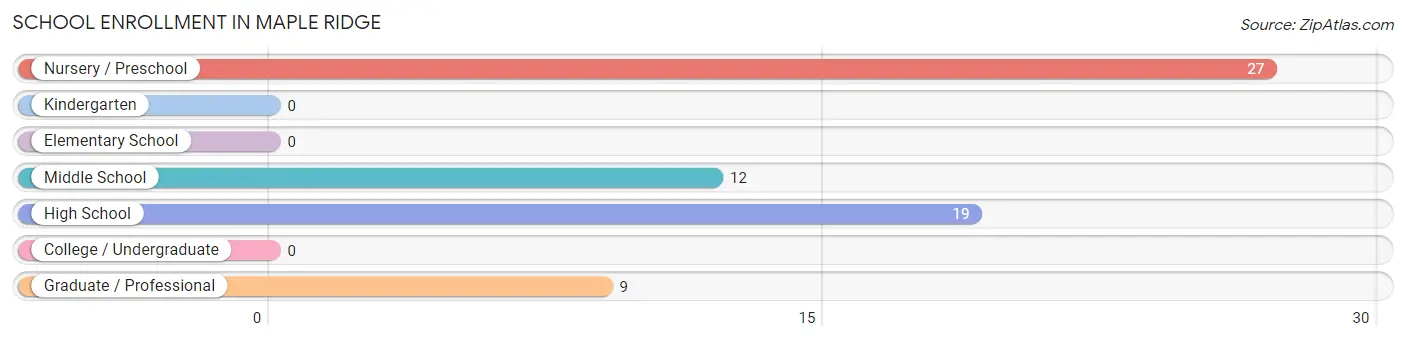
| School Level | # Students | % Students |
| Nursery / Preschool | 27 | 40.3% |
| Kindergarten | 0 | 0.0% |
| Elementary School | 0 | 0.0% |
| Middle School | 12 | 17.9% |
| High School | 19 | 28.4% |
| College / Undergraduate | 0 | 0.0% |
| Graduate / Professional | 9 | 13.4% |
| Total | 67 | 100.0% |
School Enrollment by Age by Funding Source in Maple Ridge
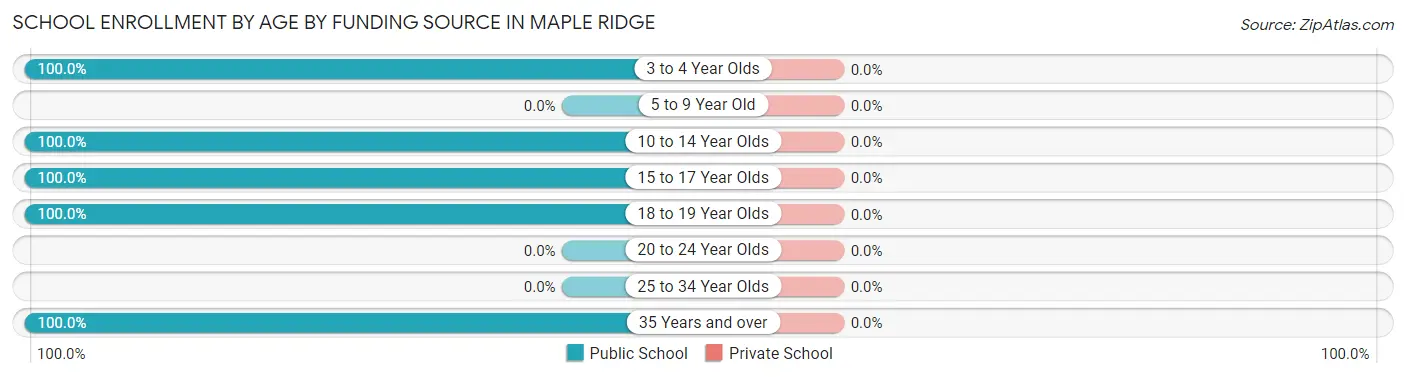
| Age Bracket | Public School | Private School |
| 3 to 4 Year Olds | 27 (100.0%) | 0 (0.0%) |
| 5 to 9 Year Old | 0 (0.0%) | 0 (0.0%) |
| 10 to 14 Year Olds | 12 (100.0%) | 0 (0.0%) |
| 15 to 17 Year Olds | 11 (100.0%) | 0 (0.0%) |
| 18 to 19 Year Olds | 8 (100.0%) | 0 (0.0%) |
| 20 to 24 Year Olds | 0 (0.0%) | 0 (0.0%) |
| 25 to 34 Year Olds | 0 (0.0%) | 0 (0.0%) |
| 35 Years and over | 9 (100.0%) | 0 (0.0%) |
| Total | 67 (100.0%) | 0 (0.0%) |
Educational Attainment by Field of Study in Maple Ridge
Science & technology (9 | 56.2%), and bio, nature & agricultural (7 | 43.8%) are the most common fields of study among 16 individuals in Maple Ridge who have obtained a bachelor's degree or higher.
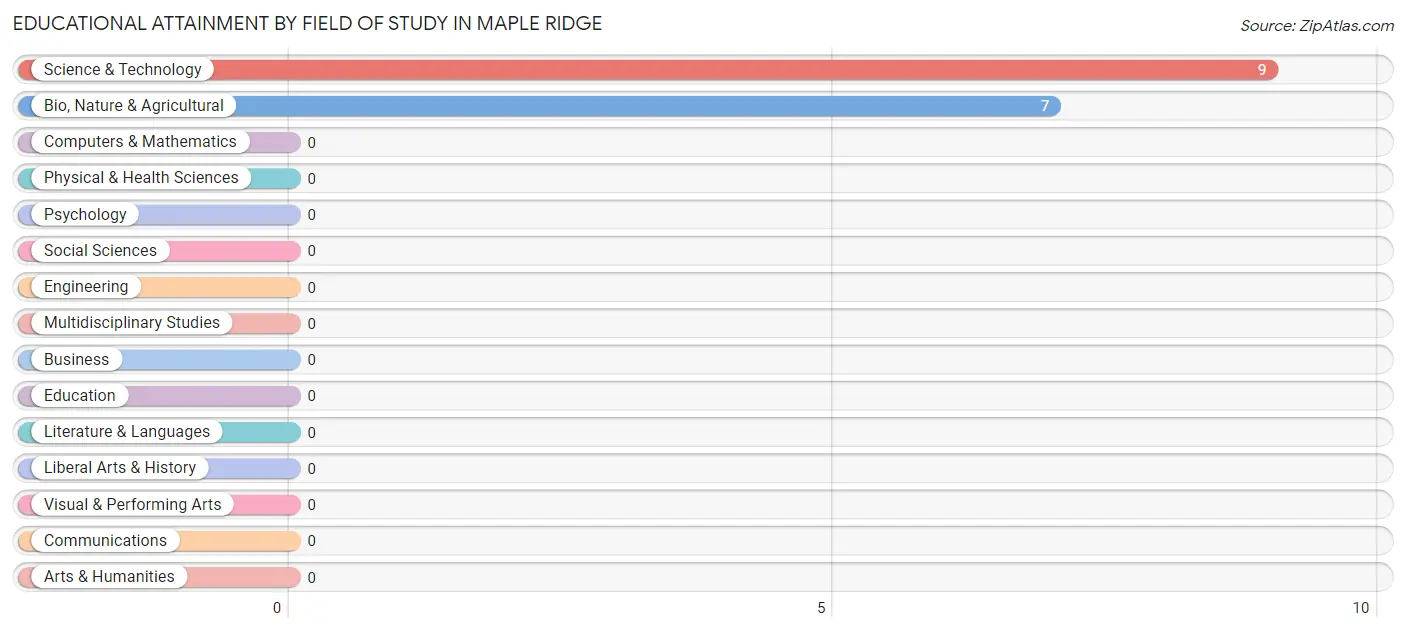
| Field of Study | # Graduates | % Graduates |
| Computers & Mathematics | 0 | 0.0% |
| Bio, Nature & Agricultural | 7 | 43.8% |
| Physical & Health Sciences | 0 | 0.0% |
| Psychology | 0 | 0.0% |
| Social Sciences | 0 | 0.0% |
| Engineering | 0 | 0.0% |
| Multidisciplinary Studies | 0 | 0.0% |
| Science & Technology | 9 | 56.2% |
| Business | 0 | 0.0% |
| Education | 0 | 0.0% |
| Literature & Languages | 0 | 0.0% |
| Liberal Arts & History | 0 | 0.0% |
| Visual & Performing Arts | 0 | 0.0% |
| Communications | 0 | 0.0% |
| Arts & Humanities | 0 | 0.0% |
| Total | 16 | 100.0% |
Transportation & Commute in Maple Ridge
Vehicle Availability by Sex in Maple Ridge
The most prevalent vehicle ownership categories in Maple Ridge are males with 2 vehicles (149, accounting for 72.3%) and females with 2 vehicles (31, making up 212.9%).
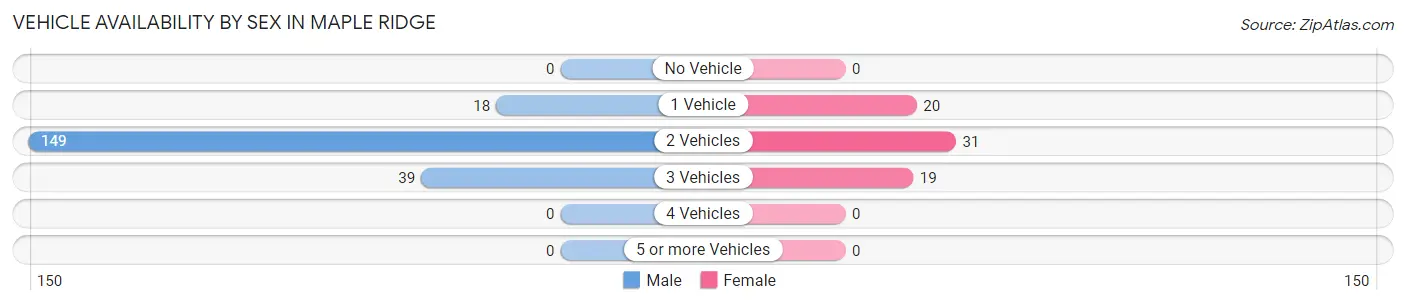
| Vehicles Available | Male | Female |
| No Vehicle | 0 (0.0%) | 0 (0.0%) |
| 1 Vehicle | 18 (8.7%) | 20 (28.6%) |
| 2 Vehicles | 149 (72.3%) | 31 (44.3%) |
| 3 Vehicles | 39 (18.9%) | 19 (27.1%) |
| 4 Vehicles | 0 (0.0%) | 0 (0.0%) |
| 5 or more Vehicles | 0 (0.0%) | 0 (0.0%) |
| Total | 206 (100.0%) | 70 (100.0%) |
Commute Time in Maple Ridge
The most frequently occuring commute durations in Maple Ridge are 10 to 14 minutes (62 commuters, 24.8%), 15 to 19 minutes (58 commuters, 23.2%), and 5 to 9 minutes (50 commuters, 20.0%).
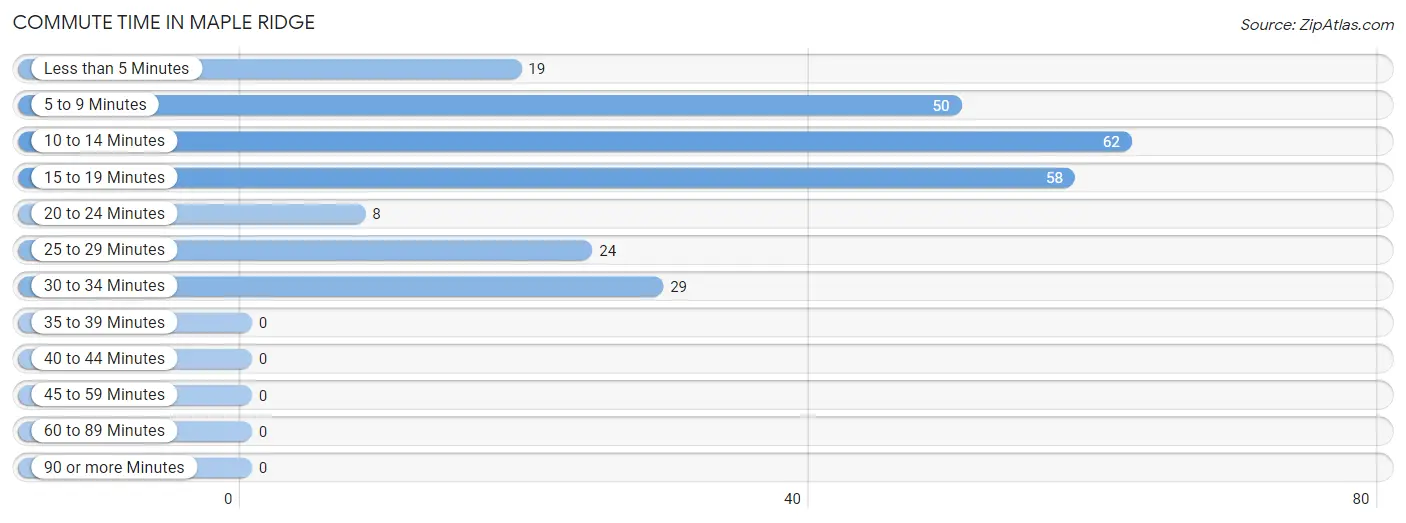
| Commute Time | # Commuters | % Commuters |
| Less than 5 Minutes | 19 | 7.6% |
| 5 to 9 Minutes | 50 | 20.0% |
| 10 to 14 Minutes | 62 | 24.8% |
| 15 to 19 Minutes | 58 | 23.2% |
| 20 to 24 Minutes | 8 | 3.2% |
| 25 to 29 Minutes | 24 | 9.6% |
| 30 to 34 Minutes | 29 | 11.6% |
| 35 to 39 Minutes | 0 | 0.0% |
| 40 to 44 Minutes | 0 | 0.0% |
| 45 to 59 Minutes | 0 | 0.0% |
| 60 to 89 Minutes | 0 | 0.0% |
| 90 or more Minutes | 0 | 0.0% |
Commute Time by Sex in Maple Ridge
The most common commute times in Maple Ridge are 15 to 19 minutes (58 commuters, 29.0%) for males and 10 to 14 minutes (21 commuters, 42.0%) for females.
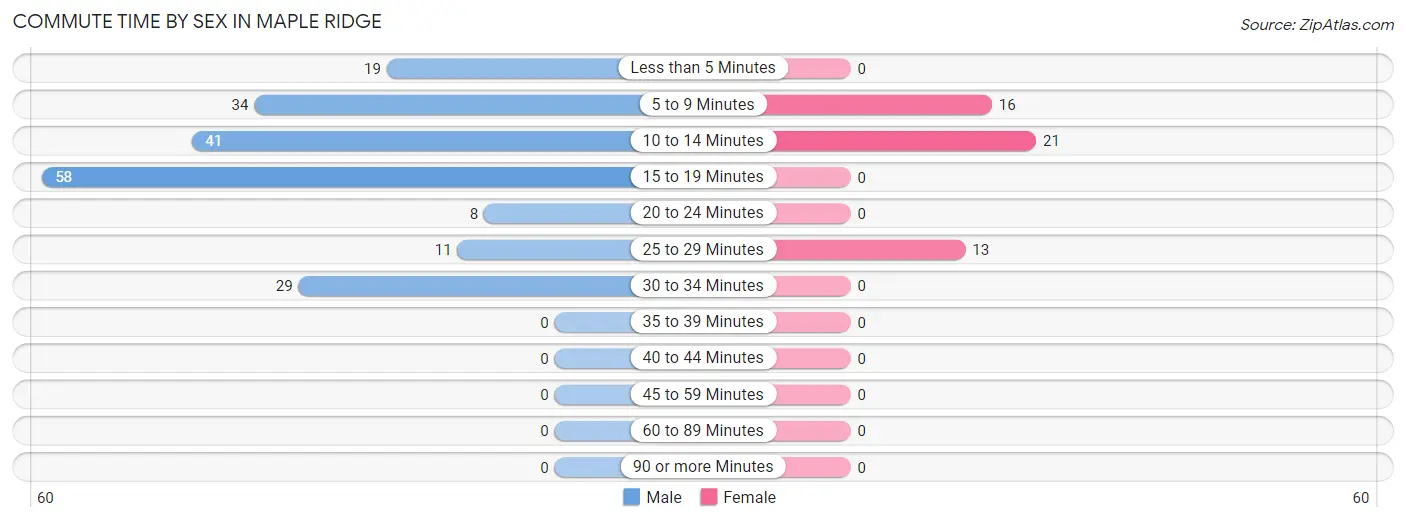
| Commute Time | Male | Female |
| Less than 5 Minutes | 19 (9.5%) | 0 (0.0%) |
| 5 to 9 Minutes | 34 (17.0%) | 16 (32.0%) |
| 10 to 14 Minutes | 41 (20.5%) | 21 (42.0%) |
| 15 to 19 Minutes | 58 (29.0%) | 0 (0.0%) |
| 20 to 24 Minutes | 8 (4.0%) | 0 (0.0%) |
| 25 to 29 Minutes | 11 (5.5%) | 13 (26.0%) |
| 30 to 34 Minutes | 29 (14.5%) | 0 (0.0%) |
| 35 to 39 Minutes | 0 (0.0%) | 0 (0.0%) |
| 40 to 44 Minutes | 0 (0.0%) | 0 (0.0%) |
| 45 to 59 Minutes | 0 (0.0%) | 0 (0.0%) |
| 60 to 89 Minutes | 0 (0.0%) | 0 (0.0%) |
| 90 or more Minutes | 0 (0.0%) | 0 (0.0%) |
Time of Departure to Work by Sex in Maple Ridge
The most frequent times of departure to work in Maple Ridge are 8:00 AM to 8:29 AM (73, 36.5%) for males and 6:00 AM to 6:29 AM (23, 46.0%) for females.
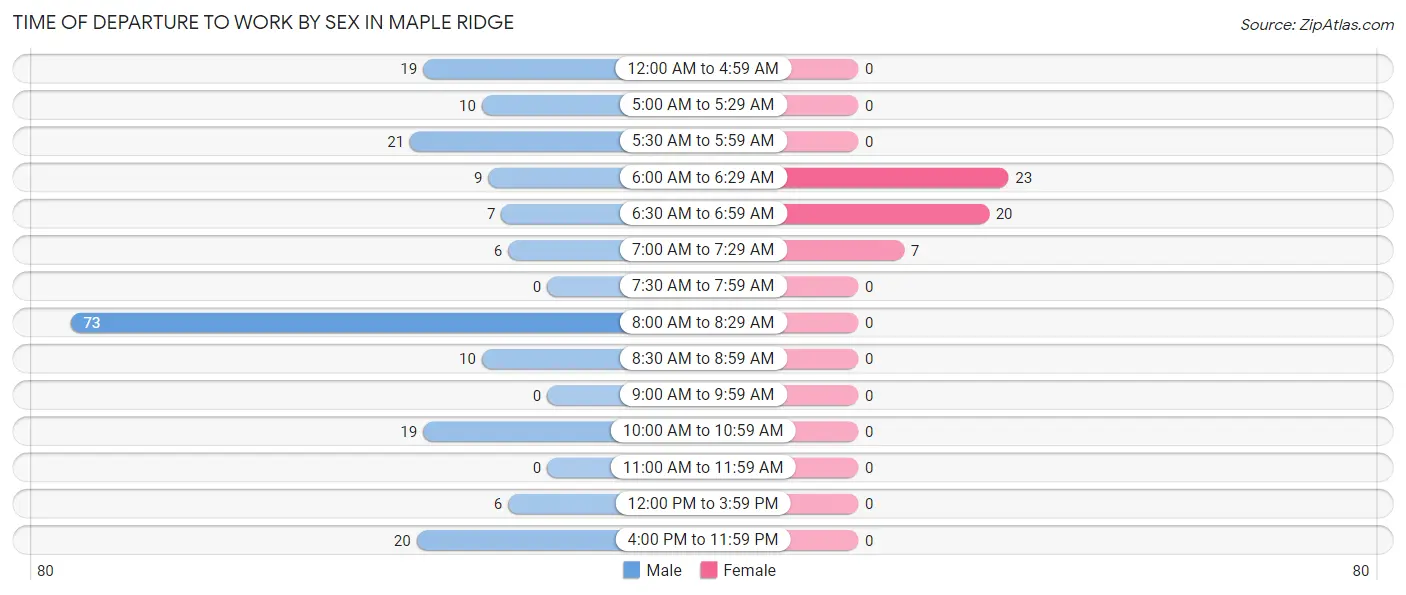
| Time of Departure | Male | Female |
| 12:00 AM to 4:59 AM | 19 (9.5%) | 0 (0.0%) |
| 5:00 AM to 5:29 AM | 10 (5.0%) | 0 (0.0%) |
| 5:30 AM to 5:59 AM | 21 (10.5%) | 0 (0.0%) |
| 6:00 AM to 6:29 AM | 9 (4.5%) | 23 (46.0%) |
| 6:30 AM to 6:59 AM | 7 (3.5%) | 20 (40.0%) |
| 7:00 AM to 7:29 AM | 6 (3.0%) | 7 (14.0%) |
| 7:30 AM to 7:59 AM | 0 (0.0%) | 0 (0.0%) |
| 8:00 AM to 8:29 AM | 73 (36.5%) | 0 (0.0%) |
| 8:30 AM to 8:59 AM | 10 (5.0%) | 0 (0.0%) |
| 9:00 AM to 9:59 AM | 0 (0.0%) | 0 (0.0%) |
| 10:00 AM to 10:59 AM | 19 (9.5%) | 0 (0.0%) |
| 11:00 AM to 11:59 AM | 0 (0.0%) | 0 (0.0%) |
| 12:00 PM to 3:59 PM | 6 (3.0%) | 0 (0.0%) |
| 4:00 PM to 11:59 PM | 20 (10.0%) | 0 (0.0%) |
| Total | 200 (100.0%) | 50 (100.0%) |
Housing Occupancy in Maple Ridge
Occupancy by Ownership in Maple Ridge
Of the total 241 dwellings in Maple Ridge, owner-occupied units account for 208 (86.3%), while renter-occupied units make up 33 (13.7%).
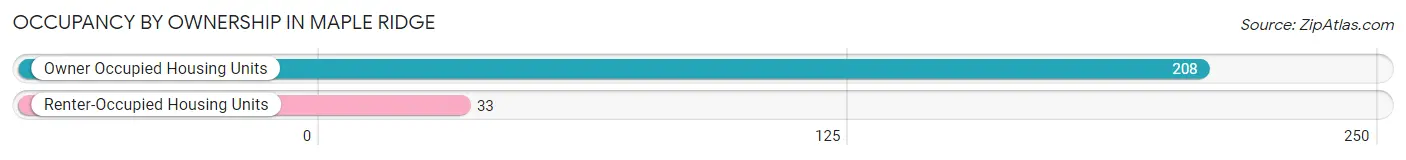
| Occupancy | # Housing Units | % Housing Units |
| Owner Occupied Housing Units | 208 | 86.3% |
| Renter-Occupied Housing Units | 33 | 13.7% |
| Total Occupied Housing Units | 241 | 100.0% |
Occupancy by Household Size in Maple Ridge
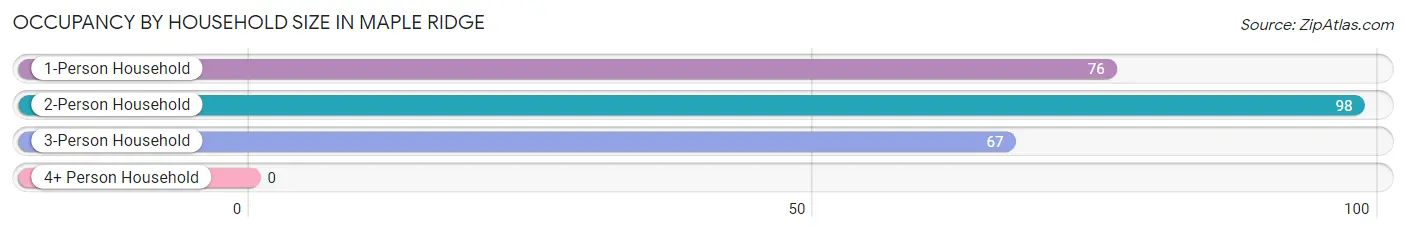
| Household Size | # Housing Units | % Housing Units |
| 1-Person Household | 76 | 31.5% |
| 2-Person Household | 98 | 40.7% |
| 3-Person Household | 67 | 27.8% |
| 4+ Person Household | 0 | 0.0% |
| Total Housing Units | 241 | 100.0% |
Occupancy by Ownership by Household Size in Maple Ridge
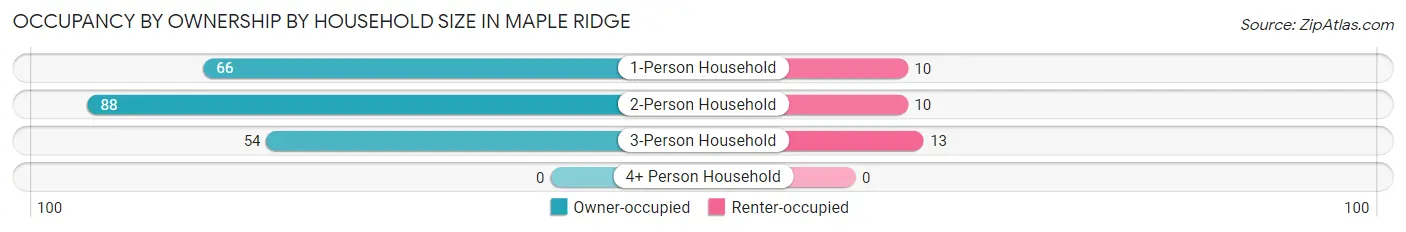
| Household Size | Owner-occupied | Renter-occupied |
| 1-Person Household | 66 (86.8%) | 10 (13.2%) |
| 2-Person Household | 88 (89.8%) | 10 (10.2%) |
| 3-Person Household | 54 (80.6%) | 13 (19.4%) |
| 4+ Person Household | 0 (0.0%) | 0 (0.0%) |
| Total Housing Units | 208 (86.3%) | 33 (13.7%) |
Occupancy by Educational Attainment in Maple Ridge
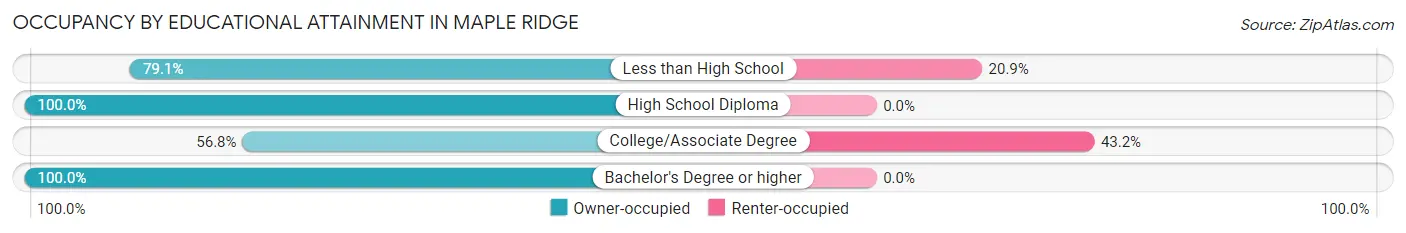
| Household Size | Owner-occupied | Renter-occupied |
| Less than High School | 53 (79.1%) | 14 (20.9%) |
| High School Diploma | 114 (100.0%) | 0 (0.0%) |
| College/Associate Degree | 25 (56.8%) | 19 (43.2%) |
| Bachelor's Degree or higher | 16 (100.0%) | 0 (0.0%) |
Occupancy by Age of Householder in Maple Ridge
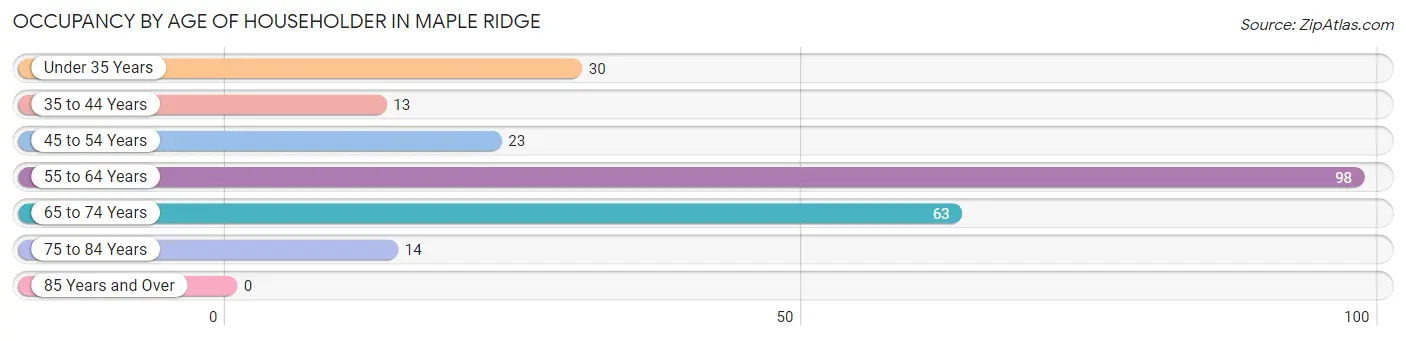
| Age Bracket | # Households | % Households |
| Under 35 Years | 30 | 12.4% |
| 35 to 44 Years | 13 | 5.4% |
| 45 to 54 Years | 23 | 9.5% |
| 55 to 64 Years | 98 | 40.7% |
| 65 to 74 Years | 63 | 26.1% |
| 75 to 84 Years | 14 | 5.8% |
| 85 Years and Over | 0 | 0.0% |
| Total | 241 | 100.0% |
Housing Finances in Maple Ridge
Median Income by Occupancy in Maple Ridge
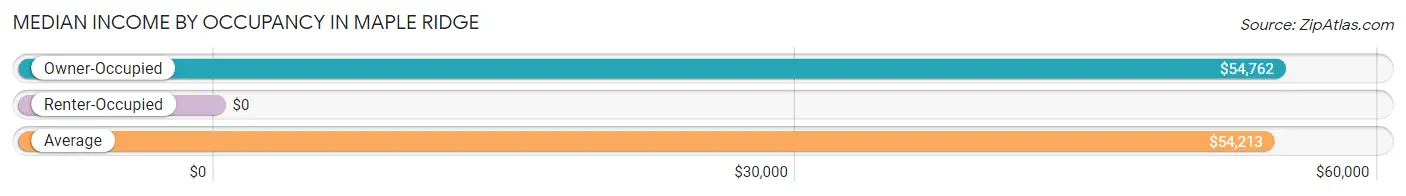
| Occupancy Type | # Households | Median Income |
| Owner-Occupied | 208 (86.3%) | $54,762 |
| Renter-Occupied | 33 (13.7%) | $0 |
| Average | 241 (100.0%) | $54,213 |
Occupancy by Householder Income Bracket in Maple Ridge
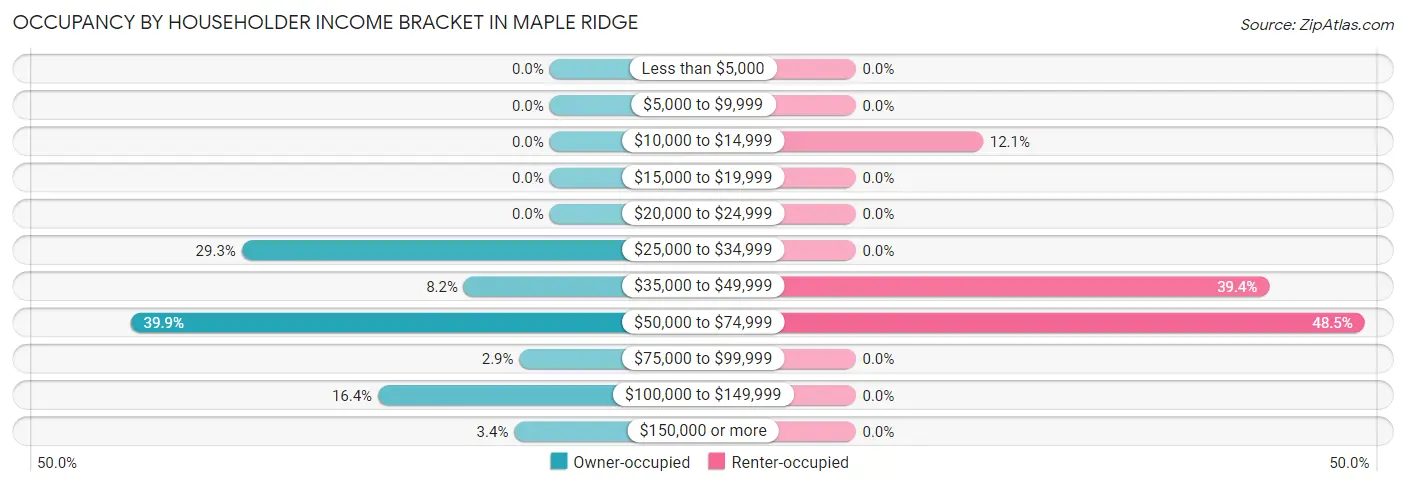
| Income Bracket | Owner-occupied | Renter-occupied |
| Less than $5,000 | 0 (0.0%) | 0 (0.0%) |
| $5,000 to $9,999 | 0 (0.0%) | 0 (0.0%) |
| $10,000 to $14,999 | 0 (0.0%) | 4 (12.1%) |
| $15,000 to $19,999 | 0 (0.0%) | 0 (0.0%) |
| $20,000 to $24,999 | 0 (0.0%) | 0 (0.0%) |
| $25,000 to $34,999 | 61 (29.3%) | 0 (0.0%) |
| $35,000 to $49,999 | 17 (8.2%) | 13 (39.4%) |
| $50,000 to $74,999 | 83 (39.9%) | 16 (48.5%) |
| $75,000 to $99,999 | 6 (2.9%) | 0 (0.0%) |
| $100,000 to $149,999 | 34 (16.4%) | 0 (0.0%) |
| $150,000 or more | 7 (3.4%) | 0 (0.0%) |
| Total | 208 (100.0%) | 33 (100.0%) |
Monthly Housing Cost Tiers in Maple Ridge
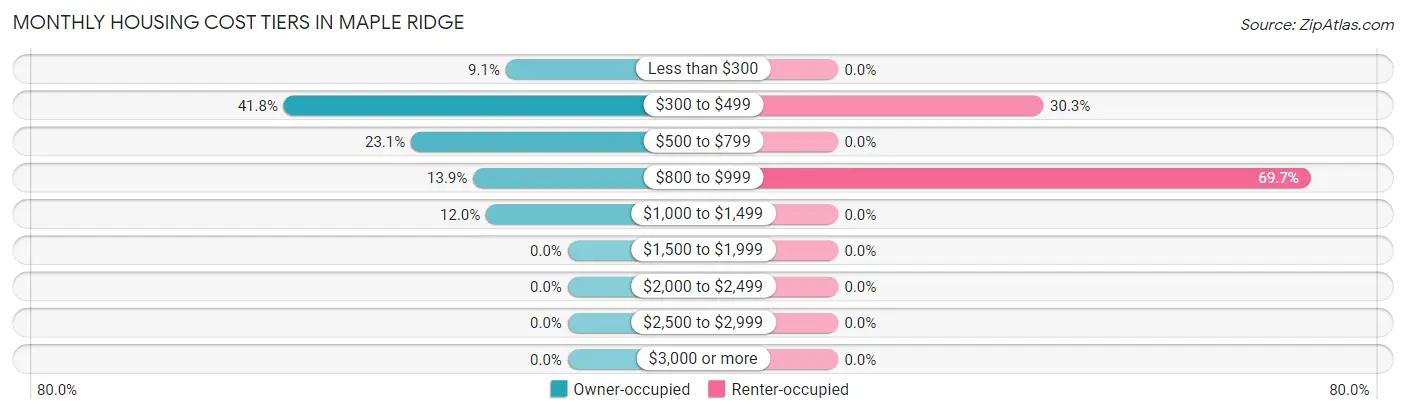
| Monthly Cost | Owner-occupied | Renter-occupied |
| Less than $300 | 19 (9.1%) | 0 (0.0%) |
| $300 to $499 | 87 (41.8%) | 10 (30.3%) |
| $500 to $799 | 48 (23.1%) | 0 (0.0%) |
| $800 to $999 | 29 (13.9%) | 23 (69.7%) |
| $1,000 to $1,499 | 25 (12.0%) | 0 (0.0%) |
| $1,500 to $1,999 | 0 (0.0%) | 0 (0.0%) |
| $2,000 to $2,499 | 0 (0.0%) | 0 (0.0%) |
| $2,500 to $2,999 | 0 (0.0%) | 0 (0.0%) |
| $3,000 or more | 0 (0.0%) | 0 (0.0%) |
| Total | 208 (100.0%) | 33 (100.0%) |
Physical Housing Characteristics in Maple Ridge
Housing Structures in Maple Ridge
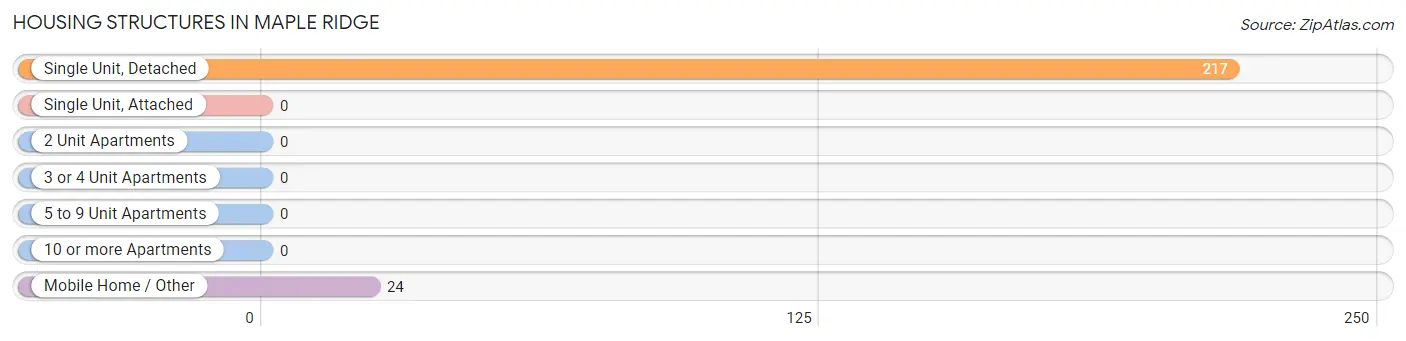
| Structure Type | # Housing Units | % Housing Units |
| Single Unit, Detached | 217 | 90.0% |
| Single Unit, Attached | 0 | 0.0% |
| 2 Unit Apartments | 0 | 0.0% |
| 3 or 4 Unit Apartments | 0 | 0.0% |
| 5 to 9 Unit Apartments | 0 | 0.0% |
| 10 or more Apartments | 0 | 0.0% |
| Mobile Home / Other | 24 | 10.0% |
| Total | 241 | 100.0% |
Housing Structures by Occupancy in Maple Ridge
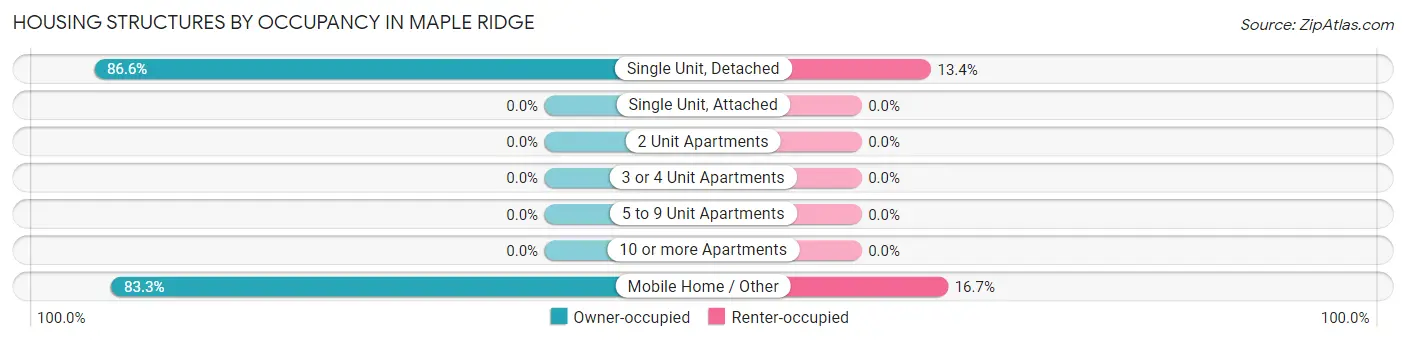
| Structure Type | Owner-occupied | Renter-occupied |
| Single Unit, Detached | 188 (86.6%) | 29 (13.4%) |
| Single Unit, Attached | 0 (0.0%) | 0 (0.0%) |
| 2 Unit Apartments | 0 (0.0%) | 0 (0.0%) |
| 3 or 4 Unit Apartments | 0 (0.0%) | 0 (0.0%) |
| 5 to 9 Unit Apartments | 0 (0.0%) | 0 (0.0%) |
| 10 or more Apartments | 0 (0.0%) | 0 (0.0%) |
| Mobile Home / Other | 20 (83.3%) | 4 (16.7%) |
| Total | 208 (86.3%) | 33 (13.7%) |
Housing Structures by Number of Rooms in Maple Ridge
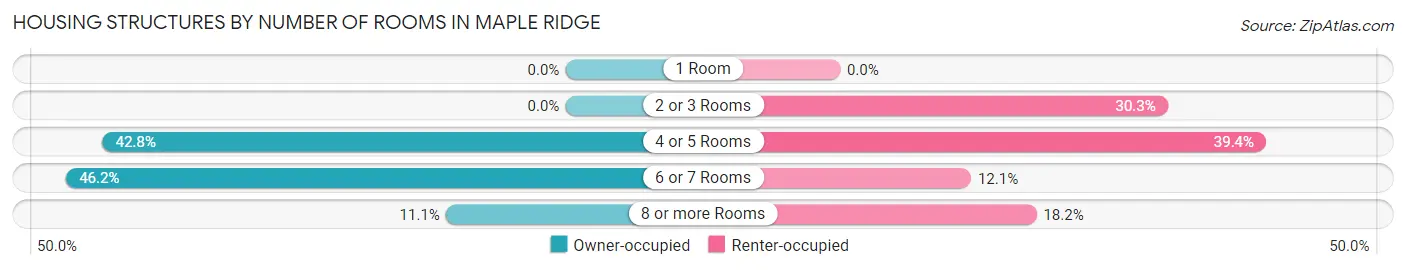
| Number of Rooms | Owner-occupied | Renter-occupied |
| 1 Room | 0 (0.0%) | 0 (0.0%) |
| 2 or 3 Rooms | 0 (0.0%) | 10 (30.3%) |
| 4 or 5 Rooms | 89 (42.8%) | 13 (39.4%) |
| 6 or 7 Rooms | 96 (46.2%) | 4 (12.1%) |
| 8 or more Rooms | 23 (11.1%) | 6 (18.2%) |
| Total | 208 (100.0%) | 33 (100.0%) |
Housing Structure by Heating Type in Maple Ridge
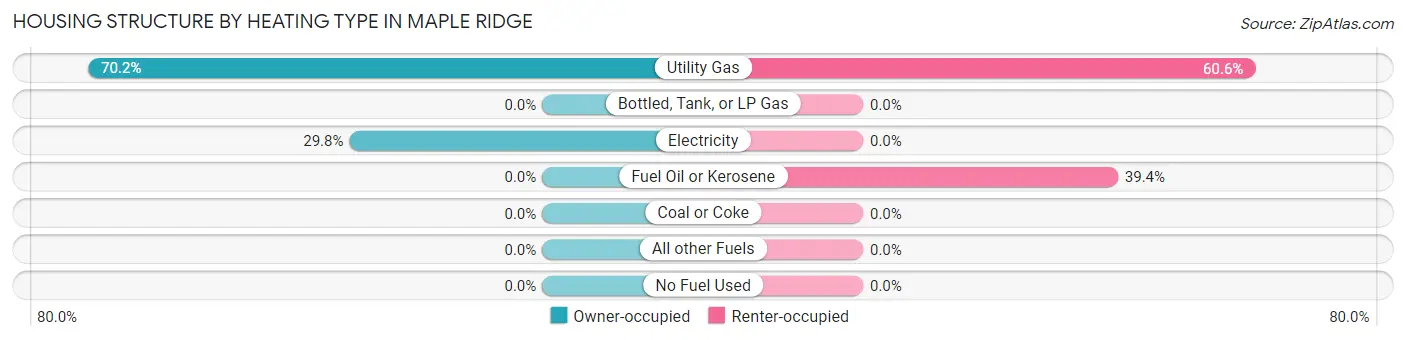
| Heating Type | Owner-occupied | Renter-occupied |
| Utility Gas | 146 (70.2%) | 20 (60.6%) |
| Bottled, Tank, or LP Gas | 0 (0.0%) | 0 (0.0%) |
| Electricity | 62 (29.8%) | 0 (0.0%) |
| Fuel Oil or Kerosene | 0 (0.0%) | 13 (39.4%) |
| Coal or Coke | 0 (0.0%) | 0 (0.0%) |
| All other Fuels | 0 (0.0%) | 0 (0.0%) |
| No Fuel Used | 0 (0.0%) | 0 (0.0%) |
| Total | 208 (100.0%) | 33 (100.0%) |
Household Vehicle Usage in Maple Ridge
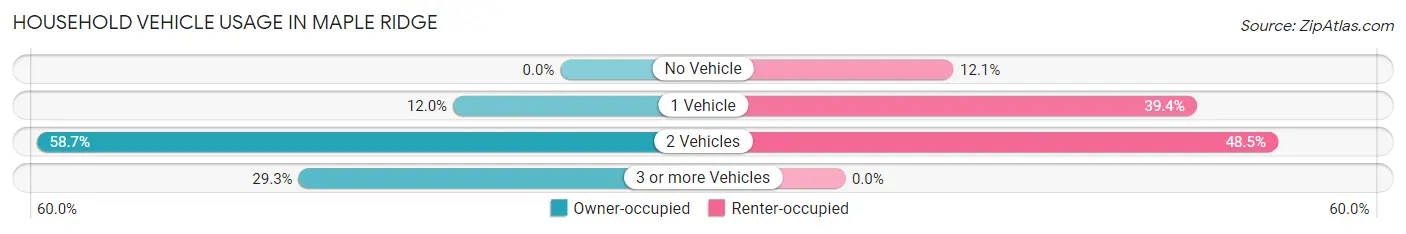
| Vehicles per Household | Owner-occupied | Renter-occupied |
| No Vehicle | 0 (0.0%) | 4 (12.1%) |
| 1 Vehicle | 25 (12.0%) | 13 (39.4%) |
| 2 Vehicles | 122 (58.7%) | 16 (48.5%) |
| 3 or more Vehicles | 61 (29.3%) | 0 (0.0%) |
| Total | 208 (100.0%) | 33 (100.0%) |
Real Estate & Mortgages in Maple Ridge
Real Estate and Mortgage Overview in Maple Ridge
| Characteristic | Without Mortgage | With Mortgage |
| Housing Units | 114 | 94 |
| Median Property Value | $154,200 | $93,700 |
| Median Household Income | $57,292 | $0 |
| Monthly Housing Costs | $336 | $0 |
| Real Estate Taxes | $719 | $0 |
Property Value by Mortgage Status in Maple Ridge
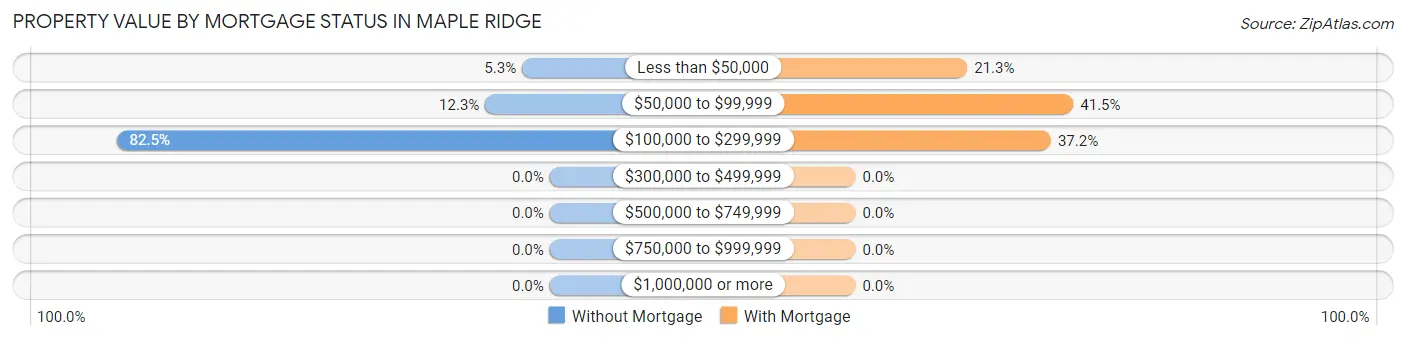
| Property Value | Without Mortgage | With Mortgage |
| Less than $50,000 | 6 (5.3%) | 20 (21.3%) |
| $50,000 to $99,999 | 14 (12.3%) | 39 (41.5%) |
| $100,000 to $299,999 | 94 (82.5%) | 35 (37.2%) |
| $300,000 to $499,999 | 0 (0.0%) | 0 (0.0%) |
| $500,000 to $749,999 | 0 (0.0%) | 0 (0.0%) |
| $750,000 to $999,999 | 0 (0.0%) | 0 (0.0%) |
| $1,000,000 or more | 0 (0.0%) | 0 (0.0%) |
| Total | 114 (100.0%) | 94 (100.0%) |
Household Income by Mortgage Status in Maple Ridge
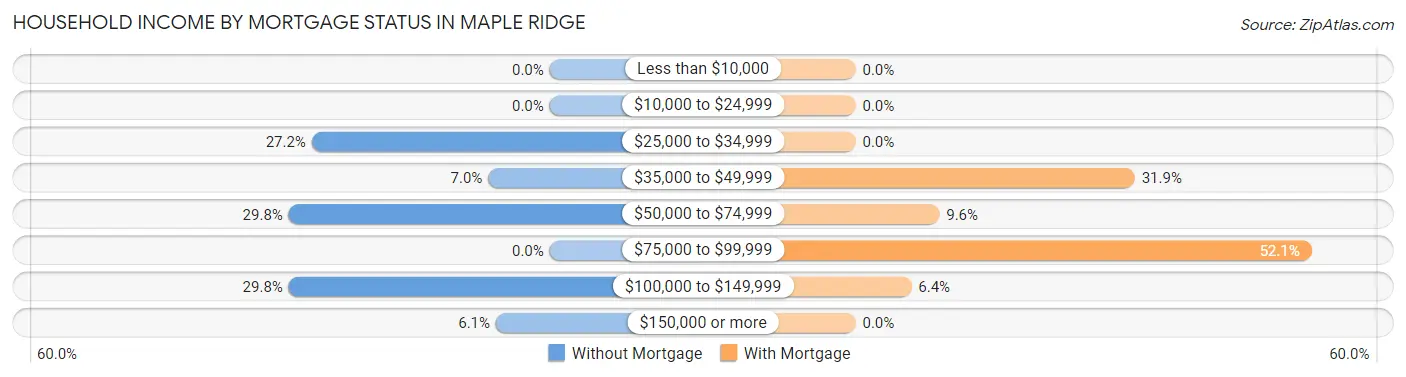
| Household Income | Without Mortgage | With Mortgage |
| Less than $10,000 | 0 (0.0%) | 0 (0.0%) |
| $10,000 to $24,999 | 0 (0.0%) | 0 (0.0%) |
| $25,000 to $34,999 | 31 (27.2%) | 0 (0.0%) |
| $35,000 to $49,999 | 8 (7.0%) | 30 (31.9%) |
| $50,000 to $74,999 | 34 (29.8%) | 9 (9.6%) |
| $75,000 to $99,999 | 0 (0.0%) | 49 (52.1%) |
| $100,000 to $149,999 | 34 (29.8%) | 6 (6.4%) |
| $150,000 or more | 7 (6.1%) | 0 (0.0%) |
| Total | 114 (100.0%) | 94 (100.0%) |
Property Value to Household Income Ratio in Maple Ridge
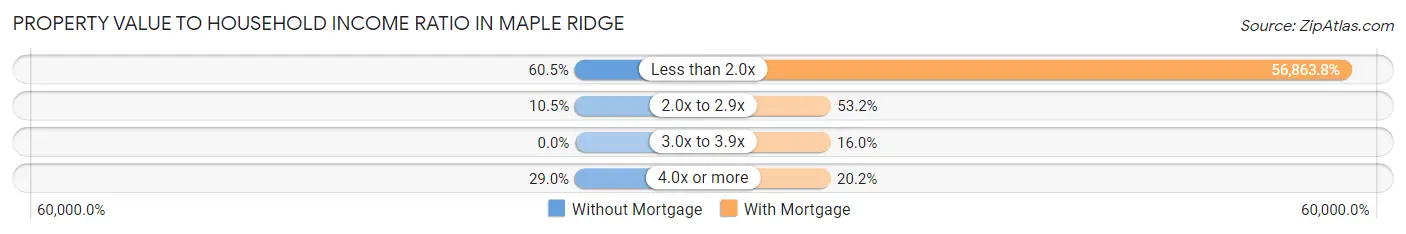
| Value-to-Income Ratio | Without Mortgage | With Mortgage |
| Less than 2.0x | 69 (60.5%) | 53,452 (56,863.8%) |
| 2.0x to 2.9x | 12 (10.5%) | 50 (53.2%) |
| 3.0x to 3.9x | 0 (0.0%) | 15 (16.0%) |
| 4.0x or more | 33 (28.9%) | 19 (20.2%) |
| Total | 114 (100.0%) | 94 (100.0%) |
Real Estate Taxes by Mortgage Status in Maple Ridge
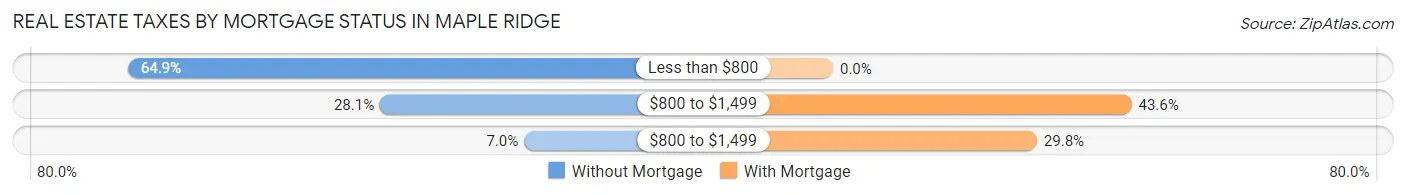
| Property Taxes | Without Mortgage | With Mortgage |
| Less than $800 | 74 (64.9%) | 0 (0.0%) |
| $800 to $1,499 | 32 (28.1%) | 41 (43.6%) |
| $800 to $1,499 | 8 (7.0%) | 28 (29.8%) |
| Total | 114 (100.0%) | 94 (100.0%) |
Health & Disability in Maple Ridge
Health Insurance Coverage by Age in Maple Ridge
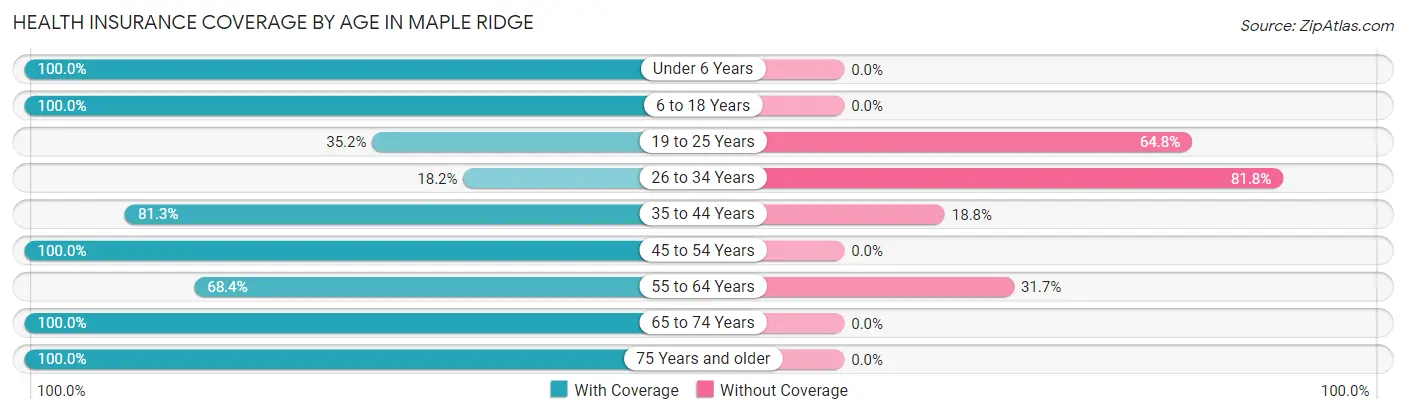
| Age Bracket | With Coverage | Without Coverage |
| Under 6 Years | 27 (100.0%) | 0 (0.0%) |
| 6 to 18 Years | 23 (100.0%) | 0 (0.0%) |
| 19 to 25 Years | 32 (35.2%) | 59 (64.8%) |
| 26 to 34 Years | 6 (18.2%) | 27 (81.8%) |
| 35 to 44 Years | 13 (81.2%) | 3 (18.8%) |
| 45 to 54 Years | 44 (100.0%) | 0 (0.0%) |
| 55 to 64 Years | 95 (68.3%) | 44 (31.7%) |
| 65 to 74 Years | 79 (100.0%) | 0 (0.0%) |
| 75 Years and older | 38 (100.0%) | 0 (0.0%) |
| Total | 357 (72.9%) | 133 (27.1%) |
Health Insurance Coverage by Citizenship Status in Maple Ridge
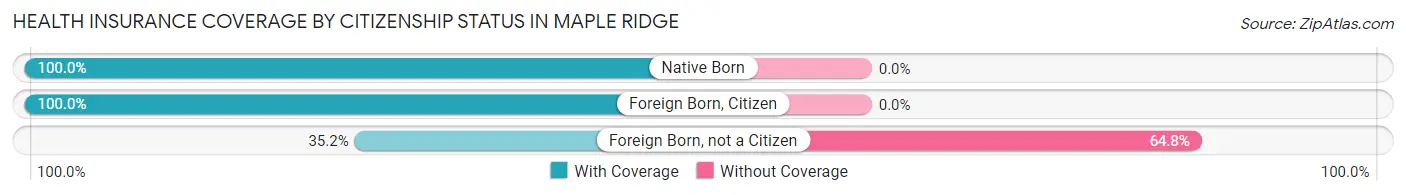
| Citizenship Status | With Coverage | Without Coverage |
| Native Born | 27 (100.0%) | 0 (0.0%) |
| Foreign Born, Citizen | 23 (100.0%) | 0 (0.0%) |
| Foreign Born, not a Citizen | 32 (35.2%) | 59 (64.8%) |
Health Insurance Coverage by Household Income in Maple Ridge
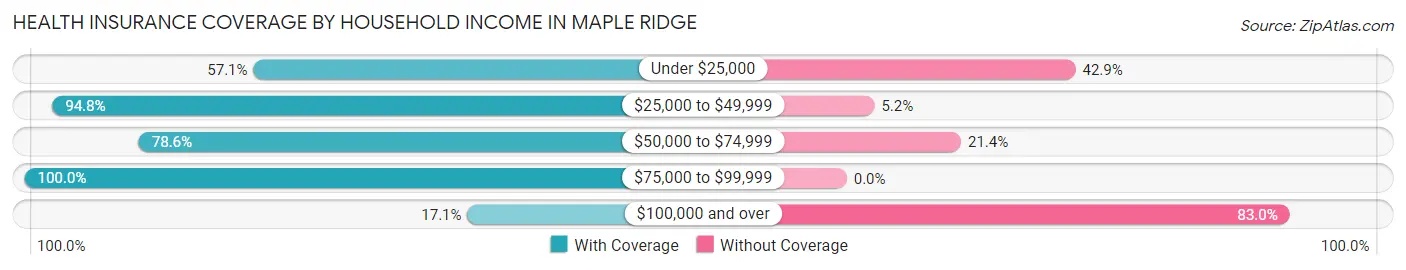
| Household Income | With Coverage | Without Coverage |
| Under $25,000 | 4 (57.1%) | 3 (42.9%) |
| $25,000 to $49,999 | 146 (94.8%) | 8 (5.2%) |
| $50,000 to $74,999 | 180 (78.6%) | 49 (21.4%) |
| $75,000 to $99,999 | 12 (100.0%) | 0 (0.0%) |
| $100,000 and over | 15 (17.1%) | 73 (83.0%) |
Public vs Private Health Insurance Coverage by Age in Maple Ridge
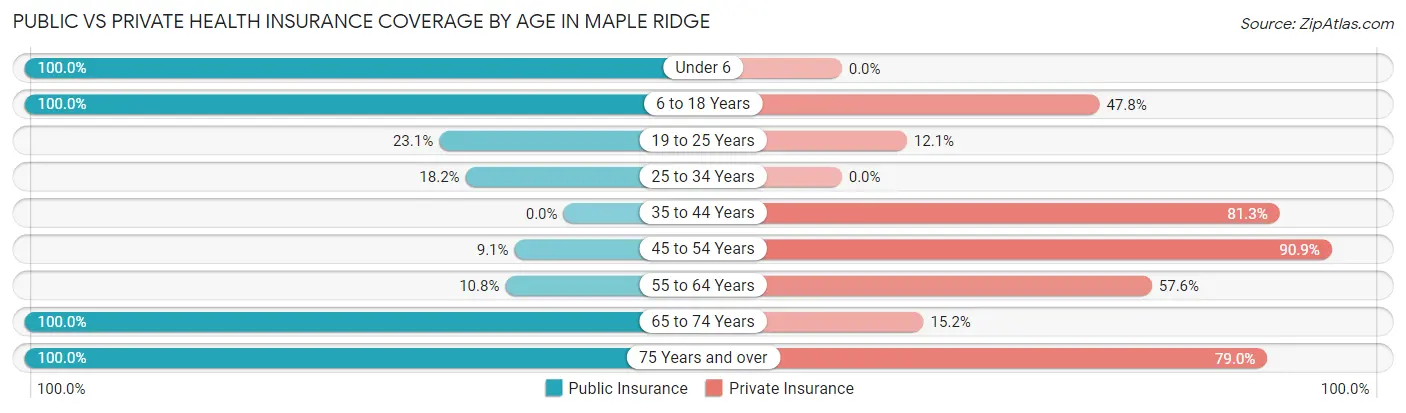
| Age Bracket | Public Insurance | Private Insurance |
| Under 6 | 27 (100.0%) | 0 (0.0%) |
| 6 to 18 Years | 23 (100.0%) | 11 (47.8%) |
| 19 to 25 Years | 21 (23.1%) | 11 (12.1%) |
| 25 to 34 Years | 6 (18.2%) | 0 (0.0%) |
| 35 to 44 Years | 0 (0.0%) | 13 (81.2%) |
| 45 to 54 Years | 4 (9.1%) | 40 (90.9%) |
| 55 to 64 Years | 15 (10.8%) | 80 (57.6%) |
| 65 to 74 Years | 79 (100.0%) | 12 (15.2%) |
| 75 Years and over | 38 (100.0%) | 30 (78.9%) |
| Total | 213 (43.5%) | 197 (40.2%) |
Disability Status by Sex by Age in Maple Ridge
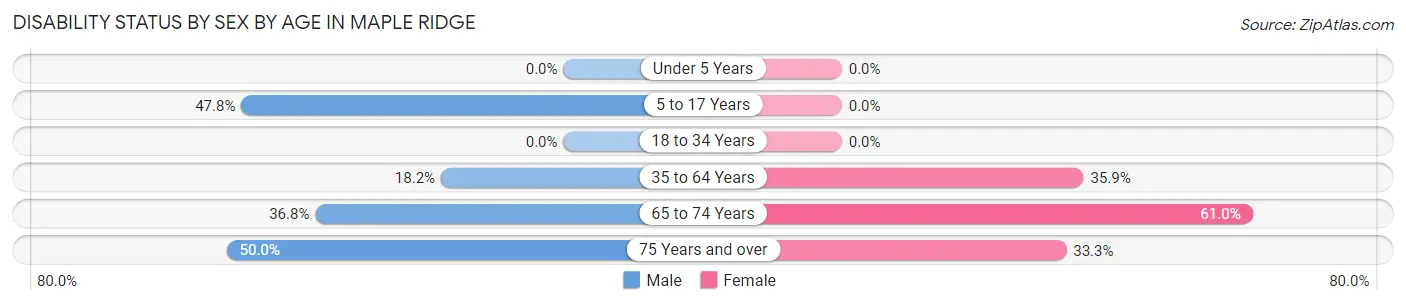
| Age Bracket | Male | Female |
| Under 5 Years | 0 (0.0%) | 0 (0.0%) |
| 5 to 17 Years | 11 (47.8%) | 0 (0.0%) |
| 18 to 34 Years | 0 (0.0%) | 0 (0.0%) |
| 35 to 64 Years | 22 (18.2%) | 28 (35.9%) |
| 65 to 74 Years | 14 (36.8%) | 25 (61.0%) |
| 75 Years and over | 7 (50.0%) | 8 (33.3%) |
Disability Class by Sex by Age in Maple Ridge
Disability Class: Hearing Difficulty
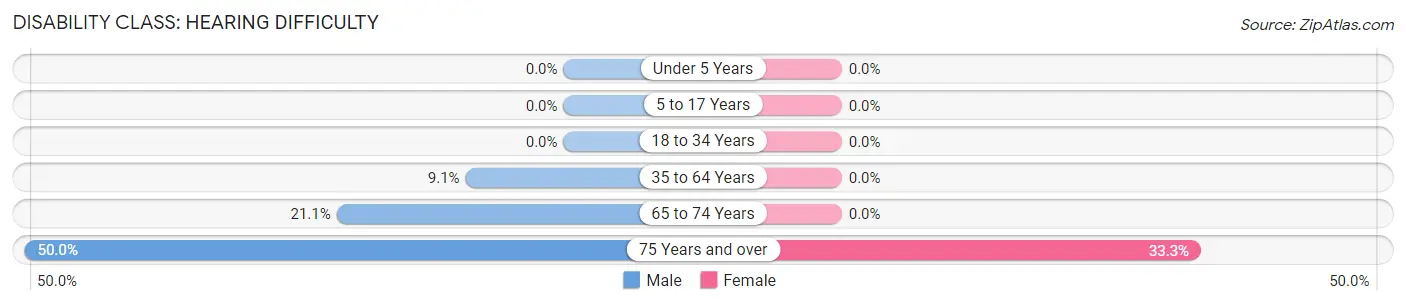
| Age Bracket | Male | Female |
| Under 5 Years | 0 (0.0%) | 0 (0.0%) |
| 5 to 17 Years | 0 (0.0%) | 0 (0.0%) |
| 18 to 34 Years | 0 (0.0%) | 0 (0.0%) |
| 35 to 64 Years | 11 (9.1%) | 0 (0.0%) |
| 65 to 74 Years | 8 (21.0%) | 0 (0.0%) |
| 75 Years and over | 7 (50.0%) | 8 (33.3%) |
Disability Class: Vision Difficulty
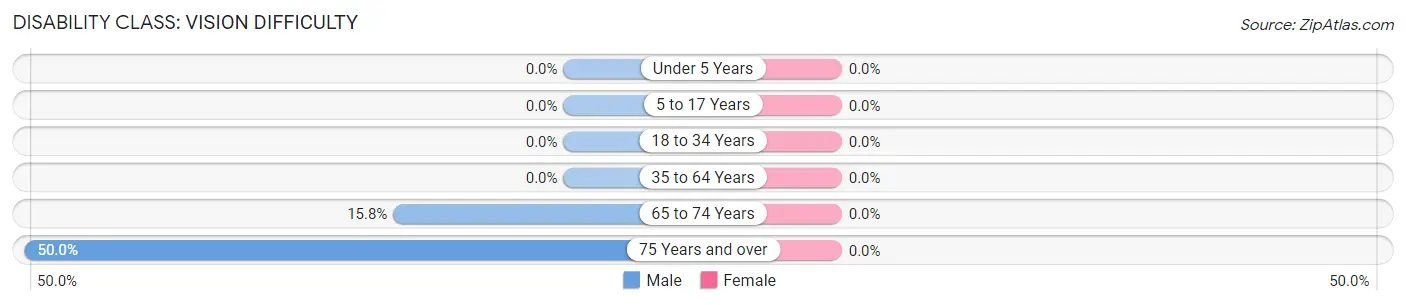
| Age Bracket | Male | Female |
| Under 5 Years | 0 (0.0%) | 0 (0.0%) |
| 5 to 17 Years | 0 (0.0%) | 0 (0.0%) |
| 18 to 34 Years | 0 (0.0%) | 0 (0.0%) |
| 35 to 64 Years | 0 (0.0%) | 0 (0.0%) |
| 65 to 74 Years | 6 (15.8%) | 0 (0.0%) |
| 75 Years and over | 7 (50.0%) | 0 (0.0%) |
Disability Class: Cognitive Difficulty
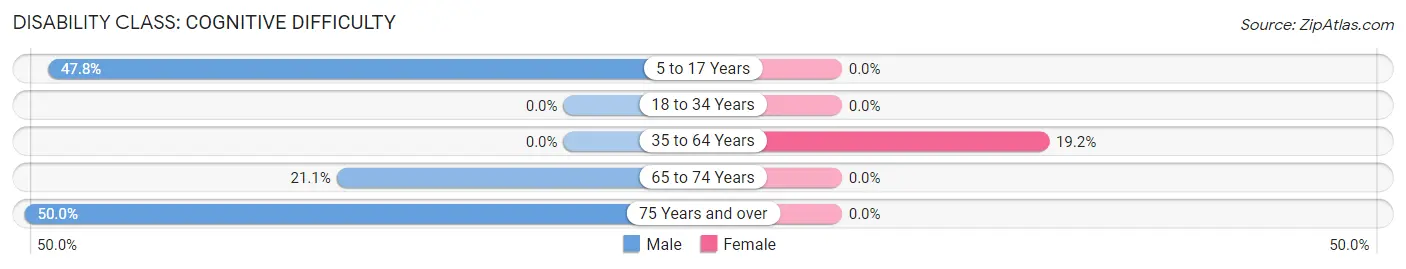
| Age Bracket | Male | Female |
| 5 to 17 Years | 11 (47.8%) | 0 (0.0%) |
| 18 to 34 Years | 0 (0.0%) | 0 (0.0%) |
| 35 to 64 Years | 0 (0.0%) | 15 (19.2%) |
| 65 to 74 Years | 8 (21.0%) | 0 (0.0%) |
| 75 Years and over | 7 (50.0%) | 0 (0.0%) |
Disability Class: Ambulatory Difficulty

| Age Bracket | Male | Female |
| 5 to 17 Years | 0 (0.0%) | 0 (0.0%) |
| 18 to 34 Years | 0 (0.0%) | 0 (0.0%) |
| 35 to 64 Years | 11 (9.1%) | 19 (24.4%) |
| 65 to 74 Years | 8 (21.0%) | 25 (61.0%) |
| 75 Years and over | 7 (50.0%) | 8 (33.3%) |
Disability Class: Self-Care Difficulty
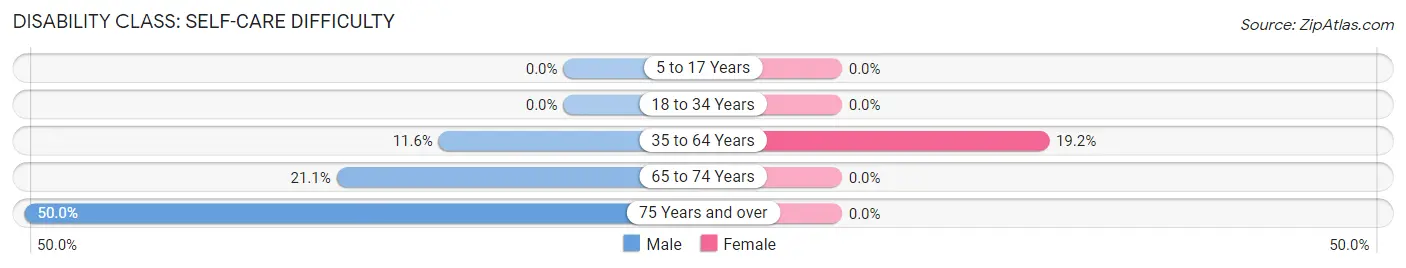
| Age Bracket | Male | Female |
| 5 to 17 Years | 0 (0.0%) | 0 (0.0%) |
| 18 to 34 Years | 0 (0.0%) | 0 (0.0%) |
| 35 to 64 Years | 14 (11.6%) | 15 (19.2%) |
| 65 to 74 Years | 8 (21.0%) | 0 (0.0%) |
| 75 Years and over | 7 (50.0%) | 0 (0.0%) |
Technology Access in Maple Ridge
Computing Device Access in Maple Ridge
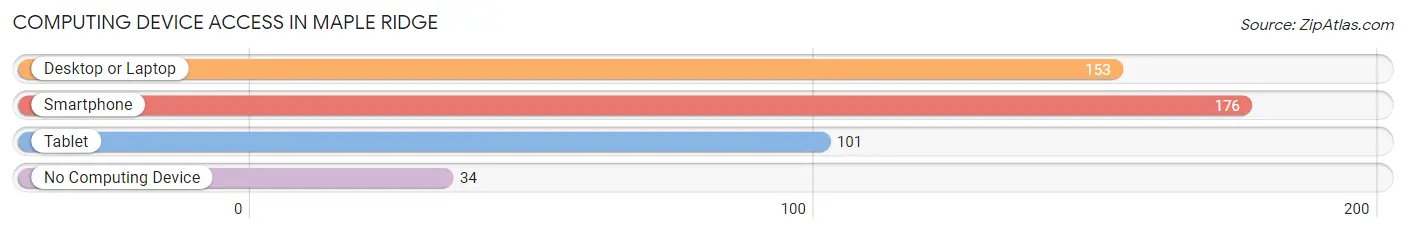
| Device Type | # Households | % Households |
| Desktop or Laptop | 153 | 63.5% |
| Smartphone | 176 | 73.0% |
| Tablet | 101 | 41.9% |
| No Computing Device | 34 | 14.1% |
| Total | 241 | 100.0% |
Internet Access in Maple Ridge
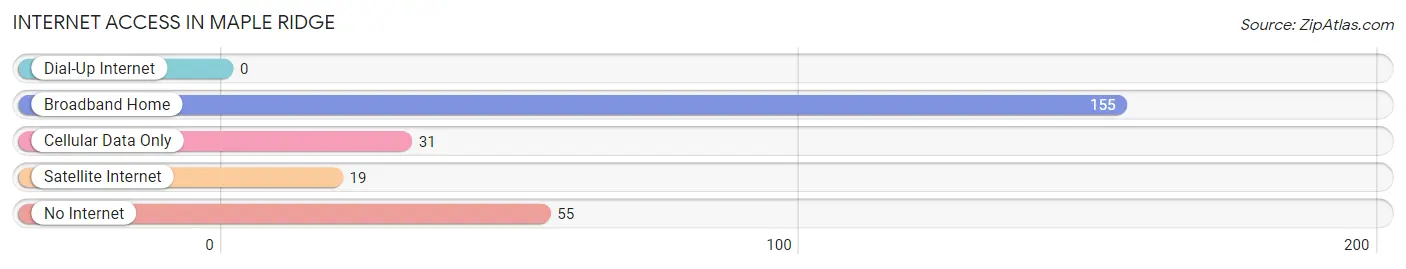
| Internet Type | # Households | % Households |
| Dial-Up Internet | 0 | 0.0% |
| Broadband Home | 155 | 64.3% |
| Cellular Data Only | 31 | 12.9% |
| Satellite Internet | 19 | 7.9% |
| No Internet | 55 | 22.8% |
| Total | 241 | 100.0% |
Maple Ridge Summary
Maple Ridge is a small village located in the state of Ohio, United States. It is situated in the county of Portage and is part of the Akron Metropolitan Statistical Area. The village has a population of approximately 1,000 people and covers an area of 0.6 square miles.
History
Maple Ridge was founded in 1820 by a group of settlers from Connecticut. The village was originally known as “Maple Grove” and was named after the abundance of maple trees in the area. The village was incorporated in 1837 and was officially renamed “Maple Ridge” in 1845.
The village was a popular stop for travelers on the Ohio and Erie Canal, which was built in the early 19th century. The canal was used to transport goods and people between Cleveland and Akron. The village was also home to a number of mills, including a grist mill, a saw mill, and a woolen mill.
Geography
Maple Ridge is located in the northeastern part of Portage County, Ohio. It is situated on the banks of the Cuyahoga River, which flows through the village. The village is surrounded by rolling hills and is located near the Cuyahoga Valley National Park.
The village has a humid continental climate, with hot summers and cold winters. The average temperature in the summer is around 75°F and the average temperature in the winter is around 25°F. The village receives an average of 40 inches of precipitation per year.
Economy
The economy of Maple Ridge is largely based on agriculture and tourism. The village is home to a number of farms, which produce a variety of crops, including corn, soybeans, and wheat. The village is also home to a number of small businesses, including restaurants, shops, and a bed and breakfast.
Tourism is an important part of the economy of Maple Ridge. The village is home to a number of attractions, including the Cuyahoga Valley National Park, the Ohio and Erie Canal, and the Maple Ridge Historical Society Museum. The village also hosts a number of festivals and events throughout the year, including the Maple Ridge Festival and the Maple Ridge Harvest Festival.
Demographics
As of the 2010 census, the population of Maple Ridge was 1,000 people. The racial makeup of the village was 97.2% White, 0.7% African American, 0.3% Native American, 0.3% Asian, and 1.5% from other races. The median household income was $45,000 and the median family income was $50,000.
The village is served by the Portage County School District. The village has one elementary school, one middle school, and one high school. The village also has a public library and a number of churches.
Conclusion
Maple Ridge is a small village located in the state of Ohio, United States. It is situated in the county of Portage and is part of the Akron Metropolitan Statistical Area. The village has a population of approximately 1,000 people and covers an area of 0.6 square miles. The economy of Maple Ridge is largely based on agriculture and tourism. The village is home to a number of attractions, including the Cuyahoga Valley National Park, the Ohio and Erie Canal, and the Maple Ridge Historical Society Museum. The village is served by the Portage County School District and has a public library and a number of churches.
Common Questions
What is the Total Population of Maple Ridge?
Total Population of Maple Ridge is 490.
What is the Total Male Population of Maple Ridge?
Total Male Population of Maple Ridge is 306.
What is the Total Female Population of Maple Ridge?
Total Female Population of Maple Ridge is 184.
What is the Ratio of Males per 100 Females in Maple Ridge?
There are 166.30 Males per 100 Females in Maple Ridge.
What is the Ratio of Females per 100 Males in Maple Ridge?
There are 60.13 Females per 100 Males in Maple Ridge.
What is the Median Population Age in Maple Ridge?
Median Population Age in Maple Ridge is 58.2 Years.
What is the Average Family Size in Maple Ridge
Average Family Size in Maple Ridge is 2.5 People.
What is the Average Household Size in Maple Ridge
Average Household Size in Maple Ridge is 2.0 People.
What is Per Capita Income in Maple Ridge?
Per Capita income in Maple Ridge is $29,583.
What is the Median Family Income in Maple Ridge?
Median Family Income in Maple Ridge is $56,473.
What is the Median Household income in Maple Ridge?
Median Household Income in Maple Ridge is $54,213.
What is Inequality or Gini Index in Maple Ridge?
Inequality or Gini Index in Maple Ridge is 0.28.
How Large is the Labor Force in Maple Ridge?
There are 289 People in the Labor Forcein in Maple Ridge.
What is the Percentage of People in the Labor Force in Maple Ridge?
64.1% of People are in the Labor Force in Maple Ridge.
What is the Unemployment Rate in Maple Ridge?
Unemployment Rate in Maple Ridge is 4.5%.