Vinton, OH
Vinton Map
Vinton Overview
288
TOTAL POPULATION
150
MALE POPULATION
138
FEMALE POPULATION
108.70
MALES / 100 FEMALES
92.00
FEMALES / 100 MALES
35.9
MEDIAN AGE
3.1
AVG FAMILY SIZE
2.4
AVG HOUSEHOLD SIZE
$25,741
PER CAPITA INCOME
$74,375
AVG FAMILY INCOME
$55,417
AVG HOUSEHOLD INCOME
$7,500
FAMILY INCOME DEFICIT
0.46
INEQUALITY / GINI INDEX
162
LABOR FORCE [ PEOPLE ]
68.1%
PERCENT IN LABOR FORCE
23.5%
UNEMPLOYMENT RATE
Vinton Zip Codes
Vinton Area Codes
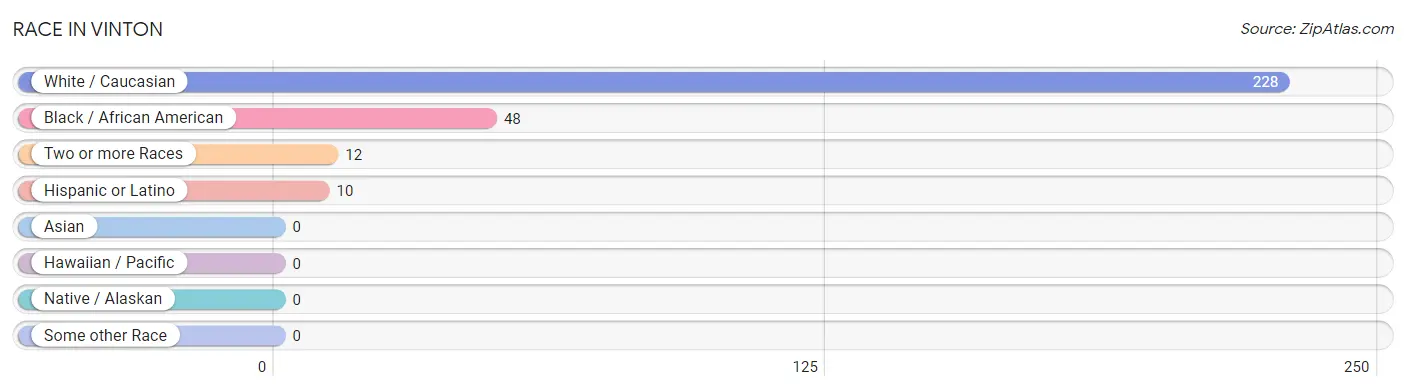
Race in Vinton
The most populous races in Vinton are White / Caucasian (228 | 79.2%), Black / African American (48 | 16.7%), and Two or more Races (12 | 4.2%).
| Race | # Population | % Population |
| Asian | 0 | 0.0% |
| Black / African American | 48 | 16.7% |
| Hawaiian / Pacific | 0 | 0.0% |
| Hispanic or Latino | 10 | 3.5% |
| Native / Alaskan | 0 | 0.0% |
| White / Caucasian | 228 | 79.2% |
| Two or more Races | 12 | 4.2% |
| Some other Race | 0 | 0.0% |
| Total | 288 | 100.0% |
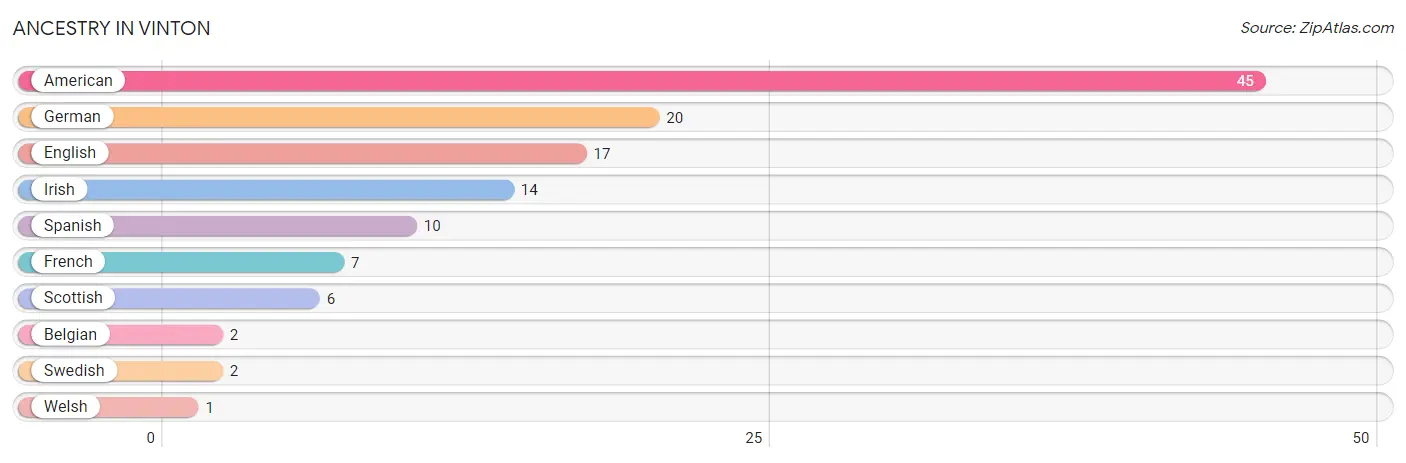
Ancestry in Vinton
The most populous ancestries reported in Vinton are American (45 | 15.6%), German (20 | 6.9%), English (17 | 5.9%), Irish (14 | 4.9%), and Spanish (10 | 3.5%), together accounting for 36.8% of all Vinton residents.
| Ancestry | # Population | % Population |
| American | 45 | 15.6% |
| Belgian | 2 | 0.7% |
| English | 17 | 5.9% |
| French | 7 | 2.4% |
| German | 20 | 6.9% |
| Irish | 14 | 4.9% |
| Scottish | 6 | 2.1% |
| Spanish | 10 | 3.5% |
| Swedish | 2 | 0.7% |
| Welsh | 1 | 0.4% | View All 10 Rows |
Immigrants in Vinton

| Immigration Origin | # Population | % Population | View All 0 Rows |
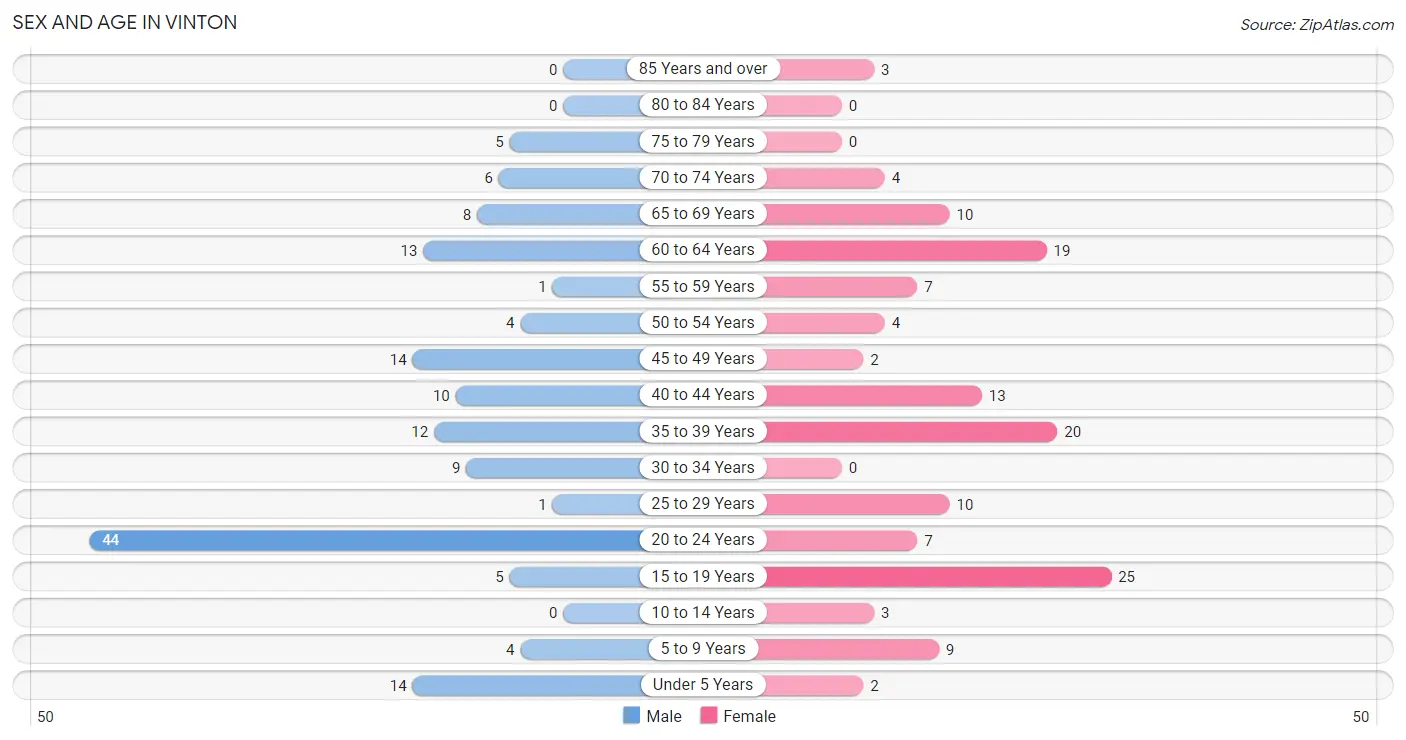
Sex and Age in Vinton
Sex and Age in Vinton
The most populous age groups in Vinton are 20 to 24 Years (44 | 29.3%) for men and 15 to 19 Years (25 | 18.1%) for women.
| Age Bracket | Male | Female |
| Under 5 Years | 14 (9.3%) | 2 (1.5%) |
| 5 to 9 Years | 4 (2.7%) | 9 (6.5%) |
| 10 to 14 Years | 0 (0.0%) | 3 (2.2%) |
| 15 to 19 Years | 5 (3.3%) | 25 (18.1%) |
| 20 to 24 Years | 44 (29.3%) | 7 (5.1%) |
| 25 to 29 Years | 1 (0.7%) | 10 (7.2%) |
| 30 to 34 Years | 9 (6.0%) | 0 (0.0%) |
| 35 to 39 Years | 12 (8.0%) | 20 (14.5%) |
| 40 to 44 Years | 10 (6.7%) | 13 (9.4%) |
| 45 to 49 Years | 14 (9.3%) | 2 (1.5%) |
| 50 to 54 Years | 4 (2.7%) | 4 (2.9%) |
| 55 to 59 Years | 1 (0.7%) | 7 (5.1%) |
| 60 to 64 Years | 13 (8.7%) | 19 (13.8%) |
| 65 to 69 Years | 8 (5.3%) | 10 (7.2%) |
| 70 to 74 Years | 6 (4.0%) | 4 (2.9%) |
| 75 to 79 Years | 5 (3.3%) | 0 (0.0%) |
| 80 to 84 Years | 0 (0.0%) | 0 (0.0%) |
| 85 Years and over | 0 (0.0%) | 3 (2.2%) |
| Total | 150 (100.0%) | 138 (100.0%) |
Families and Households in Vinton
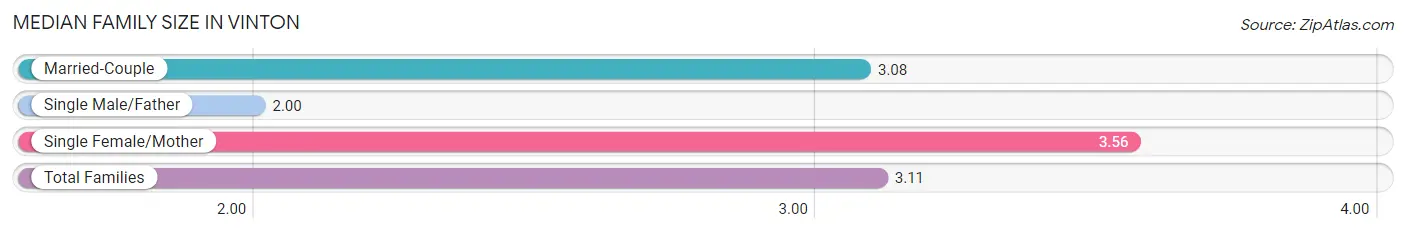
Median Family Size in Vinton
The median family size in Vinton is 3.11 persons per family, with single female/mother families (9 | 11.8%) accounting for the largest median family size of 3.56 persons per family. On the other hand, single male/father families (2 | 2.6%) represent the smallest median family size with 2.00 persons per family.
| Family Type | # Families | Family Size |
| Married-Couple | 65 (85.5%) | 3.08 |
| Single Male/Father | 2 (2.6%) | 2.00 |
| Single Female/Mother | 9 (11.8%) | 3.56 |
| Total Families | 76 (100.0%) | 3.11 |
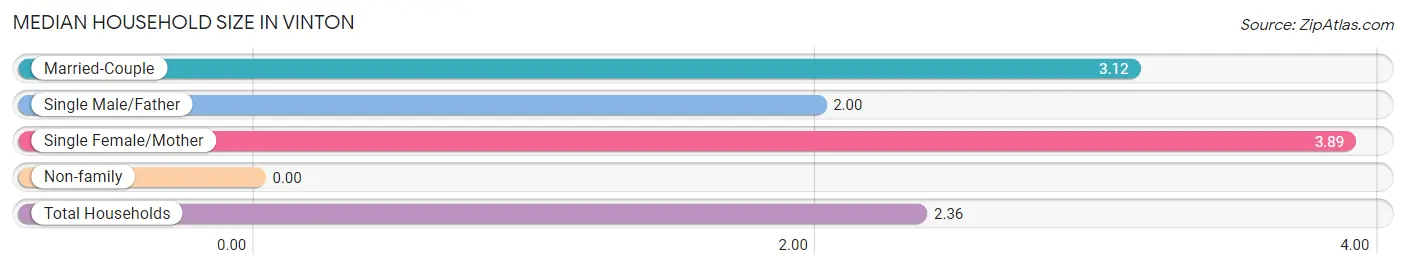
Median Household Size in Vinton
| Household Type | # Households | Household Size |
| Married-Couple | 65 (53.3%) | 3.12 |
| Single Male/Father | 2 (1.6%) | 2.00 |
| Single Female/Mother | 9 (7.4%) | 3.89 |
| Non-family | 46 (37.7%) | - |
| Total Households | 122 (100.0%) | 2.36 |
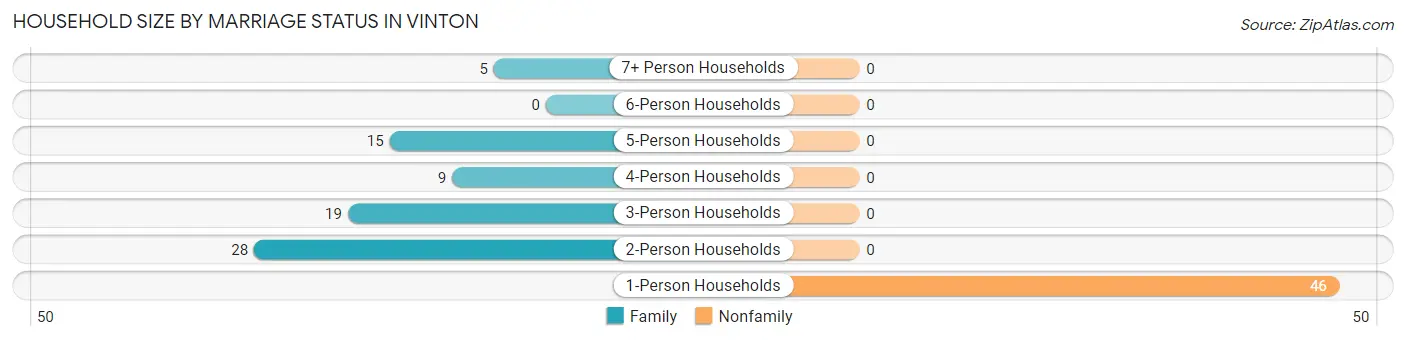
Household Size by Marriage Status in Vinton
Out of a total of 122 households in Vinton, 76 (62.3%) are family households, while 46 (37.7%) are nonfamily households. The most numerous type of family households are 2-person households, comprising 28, and the most common type of nonfamily households are 1-person households, comprising 46.
| Household Size | Family Households | Nonfamily Households |
| 1-Person Households | - | 46 (37.7%) |
| 2-Person Households | 28 (23.0%) | 0 (0.0%) |
| 3-Person Households | 19 (15.6%) | 0 (0.0%) |
| 4-Person Households | 9 (7.4%) | 0 (0.0%) |
| 5-Person Households | 15 (12.3%) | 0 (0.0%) |
| 6-Person Households | 0 (0.0%) | 0 (0.0%) |
| 7+ Person Households | 5 (4.1%) | 0 (0.0%) |
| Total | 76 (62.3%) | 46 (37.7%) |
Female Fertility in Vinton
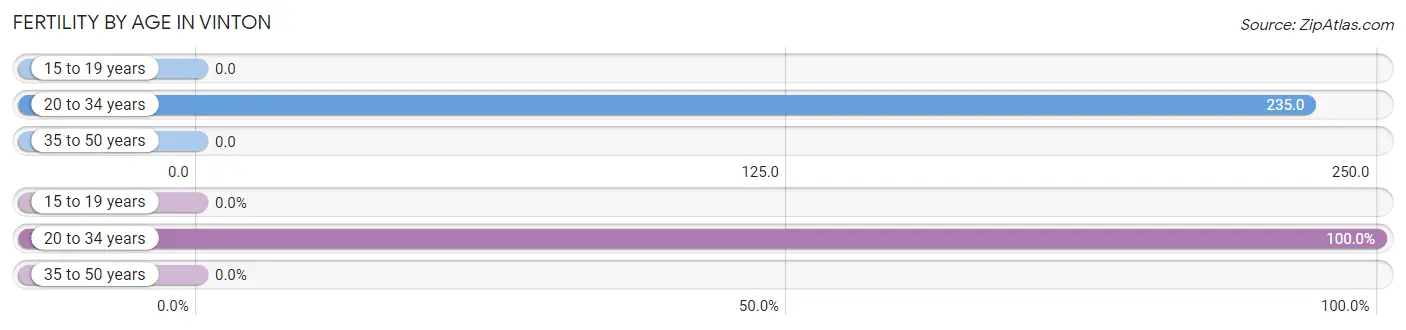
Fertility by Age in Vinton
Average fertility rate in Vinton is 50.0 births per 1,000 women. Women in the age bracket of 20 to 34 years have the highest fertility rate with 235.0 births per 1,000 women. Women in the age bracket of 20 to 34 years acount for 100.0% of all women with births.
| Age Bracket | Women with Births | Births / 1,000 Women |
| 15 to 19 years | 0 (0.0%) | 0.0 |
| 20 to 34 years | 4 (100.0%) | 235.0 |
| 35 to 50 years | 0 (0.0%) | 0.0 |
| Total | 4 (100.0%) | 50.0 |
Fertility by Age by Marriage Status in Vinton
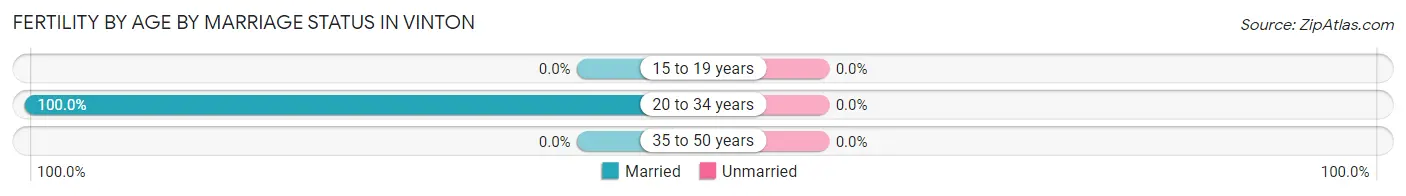
| Age Bracket | Married | Unmarried |
| 15 to 19 years | 0 (0.0%) | 0 (0.0%) |
| 20 to 34 years | 4 (100.0%) | 0 (0.0%) |
| 35 to 50 years | 0 (0.0%) | 0 (0.0%) |
| Total | 4 (100.0%) | 0 (0.0%) |
Fertility by Education in Vinton
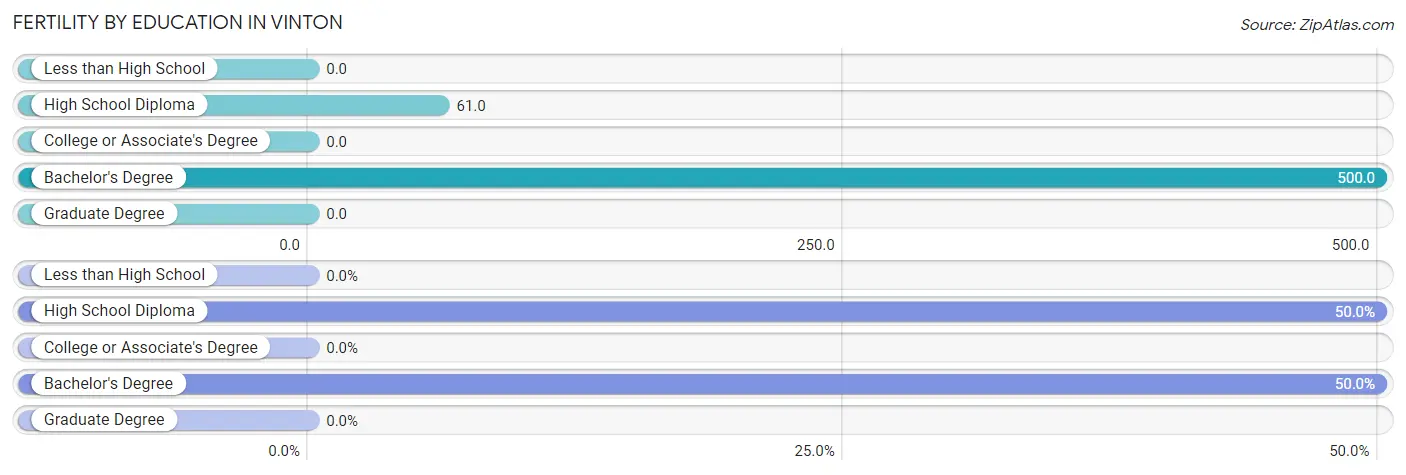
| Educational Attainment | Women with Births | Births / 1,000 Women |
| Less than High School | 0 (0.0%) | 0.0 |
| High School Diploma | 2 (50.0%) | 61.0 |
| College or Associate's Degree | 0 (0.0%) | 0.0 |
| Bachelor's Degree | 2 (50.0%) | 500.0 |
| Graduate Degree | 0 (0.0%) | 0.0 |
| Total | 4 (100.0%) | 50.0 |
Fertility by Education by Marriage Status in Vinton
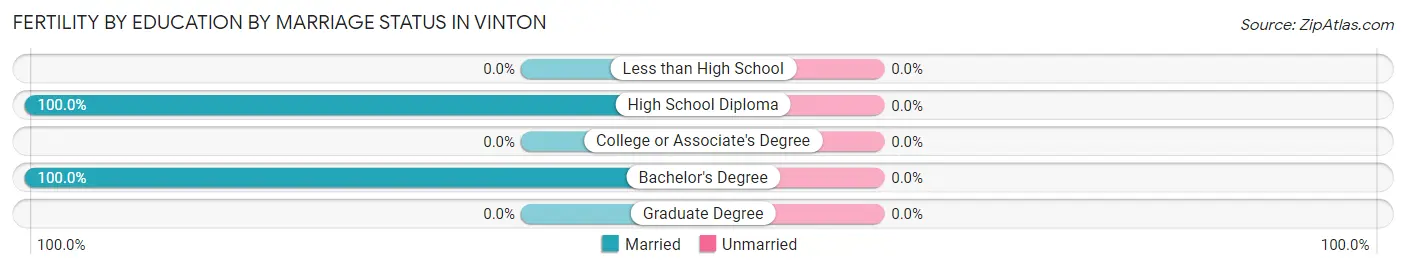
| Educational Attainment | Married | Unmarried |
| Less than High School | 0 (0.0%) | 0 (0.0%) |
| High School Diploma | 2 (100.0%) | 0 (0.0%) |
| College or Associate's Degree | 0 (0.0%) | 0 (0.0%) |
| Bachelor's Degree | 2 (100.0%) | 0 (0.0%) |
| Graduate Degree | 0 (0.0%) | 0 (0.0%) |
| Total | 4 (100.0%) | 0 (0.0%) |
Income in Vinton
Income Overview in Vinton
Per Capita Income in Vinton is $25,741, while median incomes of families and households are $74,375 and $55,417 respectively.
| Characteristic | Number | Measure |
| Per Capita Income | 288 | $25,741 |
| Median Family Income | 76 | $74,375 |
| Mean Family Income | 76 | $85,225 |
| Median Household Income | 122 | $55,417 |
| Mean Household Income | 122 | $60,871 |
| Income Deficit | 76 | $7,500 |
| Wage / Income Gap (%) | 288 | 0.00% |
| Wage / Income Gap ($) | 288 | 100.00¢ per $1 |
| Gini / Inequality Index | 288 | 0.46 |
Earnings by Sex in Vinton
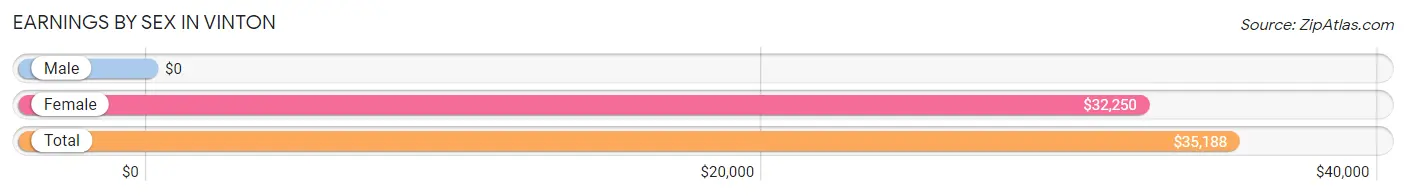
| Sex | Number | Average Earnings |
| Male | 106 (61.3%) | $0 |
| Female | 67 (38.7%) | $32,250 |
| Total | 173 (100.0%) | $35,188 |
Earnings by Sex by Income Bracket in Vinton
The most common earnings brackets in Vinton are $12,500 to $14,999 for men (33 | 31.1%) and $35,000 to $39,999 for women (14 | 20.9%).
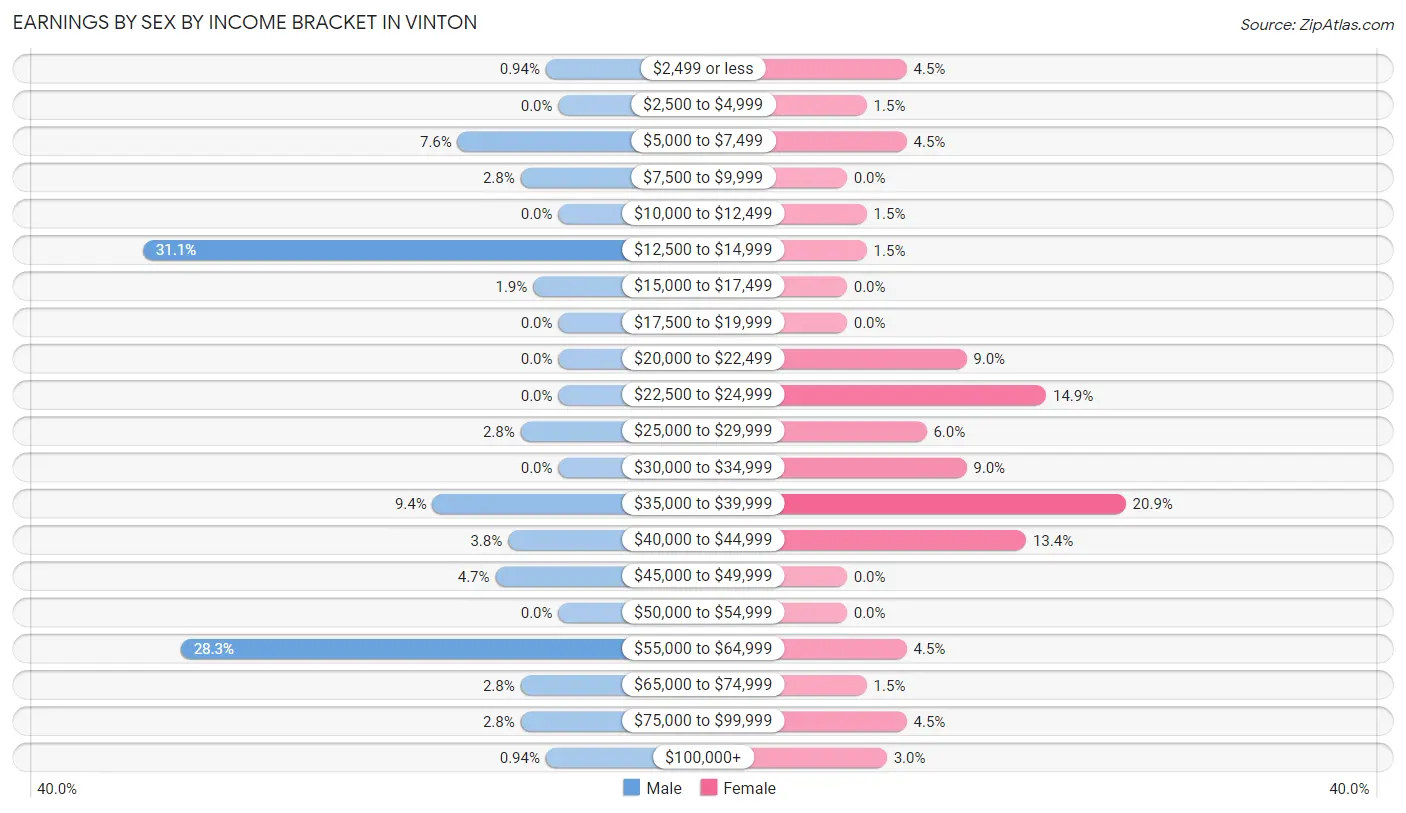
| Income | Male | Female |
| $2,499 or less | 1 (0.9%) | 3 (4.5%) |
| $2,500 to $4,999 | 0 (0.0%) | 1 (1.5%) |
| $5,000 to $7,499 | 8 (7.5%) | 3 (4.5%) |
| $7,500 to $9,999 | 3 (2.8%) | 0 (0.0%) |
| $10,000 to $12,499 | 0 (0.0%) | 1 (1.5%) |
| $12,500 to $14,999 | 33 (31.1%) | 1 (1.5%) |
| $15,000 to $17,499 | 2 (1.9%) | 0 (0.0%) |
| $17,500 to $19,999 | 0 (0.0%) | 0 (0.0%) |
| $20,000 to $22,499 | 0 (0.0%) | 6 (9.0%) |
| $22,500 to $24,999 | 0 (0.0%) | 10 (14.9%) |
| $25,000 to $29,999 | 3 (2.8%) | 4 (6.0%) |
| $30,000 to $34,999 | 0 (0.0%) | 6 (9.0%) |
| $35,000 to $39,999 | 10 (9.4%) | 14 (20.9%) |
| $40,000 to $44,999 | 4 (3.8%) | 9 (13.4%) |
| $45,000 to $49,999 | 5 (4.7%) | 0 (0.0%) |
| $50,000 to $54,999 | 0 (0.0%) | 0 (0.0%) |
| $55,000 to $64,999 | 30 (28.3%) | 3 (4.5%) |
| $65,000 to $74,999 | 3 (2.8%) | 1 (1.5%) |
| $75,000 to $99,999 | 3 (2.8%) | 3 (4.5%) |
| $100,000+ | 1 (0.9%) | 2 (3.0%) |
| Total | 106 (100.0%) | 67 (100.0%) |
Earnings by Sex by Educational Attainment in Vinton
Average earnings in Vinton are $56,029 for men and $31,500 for women, a difference of 43.8%. Men with an educational attainment of college or associate's degree enjoy the highest average annual earnings of $58,295, while those with high school diploma education earn the least with $45,500. Women with an educational attainment of bachelor's degree earn the most with the average annual earnings of $70,000, while those with high school diploma education have the smallest earnings of $24,861.
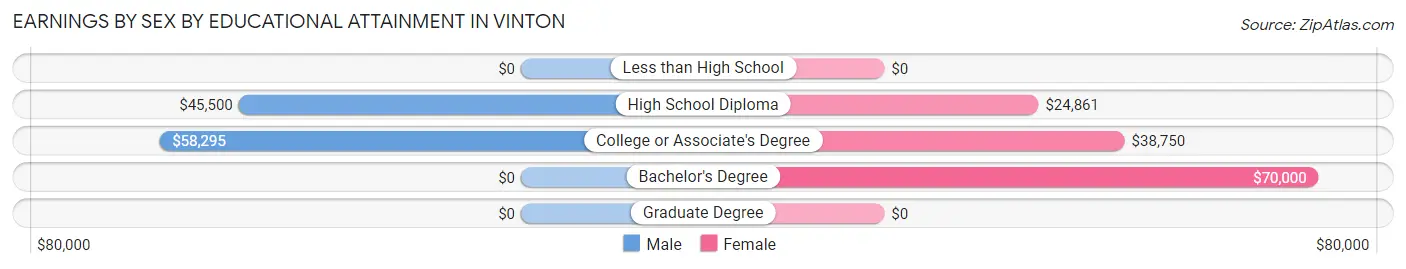
| Educational Attainment | Male Income | Female Income |
| Less than High School | - | - |
| High School Diploma | $45,500 | $24,861 |
| College or Associate's Degree | $58,295 | $38,750 |
| Bachelor's Degree | - | - |
| Graduate Degree | - | - |
| Total | $56,029 | $31,500 |
Family Income in Vinton
Family Income Brackets in Vinton
According to the Vinton family income data, there are 25 families falling into the $50,000 to $74,999 income range, which is the most common income bracket and makes up 32.9% of all families.
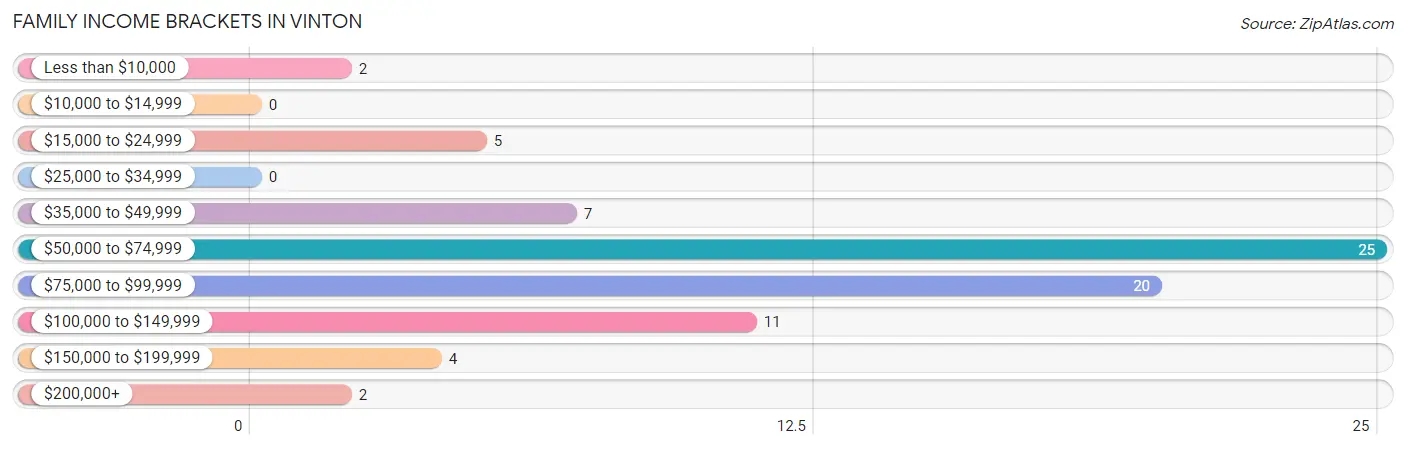
| Income Bracket | # Families | % Families |
| Less than $10,000 | 2 | 2.6% |
| $10,000 to $14,999 | 0 | 0.0% |
| $15,000 to $24,999 | 5 | 6.6% |
| $25,000 to $34,999 | 0 | 0.0% |
| $35,000 to $49,999 | 7 | 9.2% |
| $50,000 to $74,999 | 25 | 32.9% |
| $75,000 to $99,999 | 20 | 26.3% |
| $100,000 to $149,999 | 11 | 14.5% |
| $150,000 to $199,999 | 4 | 5.3% |
| $200,000+ | 2 | 2.6% |
Family Income by Famaliy Size in Vinton
5-person families (15 | 19.7%) account for the highest median family income in Vinton with $91,354 per family, while 3-person families (23 | 30.3%) have the highest median income of $30,347 per family member.
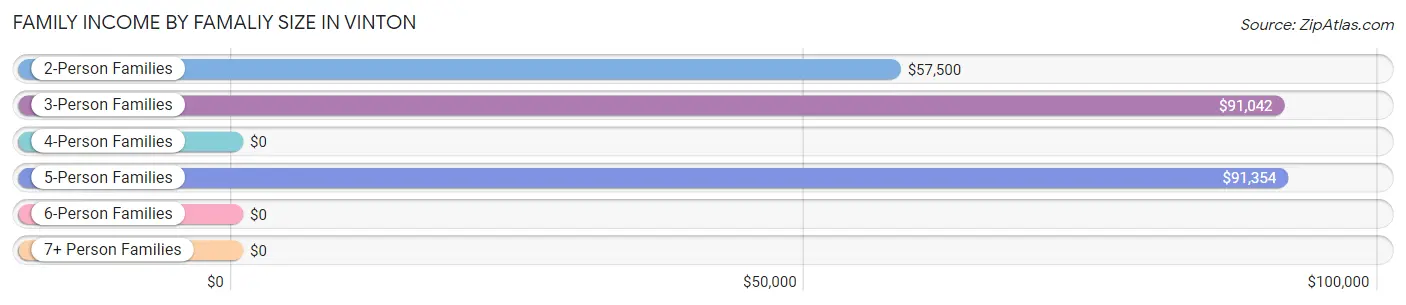
| Income Bracket | # Families | Median Income |
| 2-Person Families | 28 (36.8%) | $57,500 |
| 3-Person Families | 23 (30.3%) | $91,042 |
| 4-Person Families | 5 (6.6%) | $0 |
| 5-Person Families | 15 (19.7%) | $91,354 |
| 6-Person Families | 3 (4.0%) | $0 |
| 7+ Person Families | 2 (2.6%) | $0 |
| Total | 76 (100.0%) | $74,375 |
Family Income by Number of Earners in Vinton
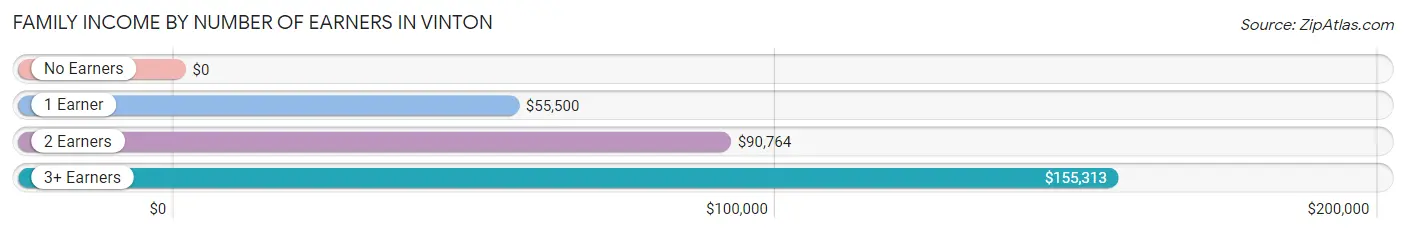
| Number of Earners | # Families | Median Income |
| No Earners | 6 (7.9%) | $0 |
| 1 Earner | 24 (31.6%) | $55,500 |
| 2 Earners | 35 (46.1%) | $90,764 |
| 3+ Earners | 11 (14.5%) | $155,313 |
| Total | 76 (100.0%) | $74,375 |
Household Income in Vinton
Household Income Brackets in Vinton
With 36 households falling in the category, the $10,000 to $14,999 income range is the most frequent in Vinton, accounting for 29.5% of all households. In contrast, only 1 households (0.8%) fall into the $25,000 to $34,999 income bracket, making it the least populous group.
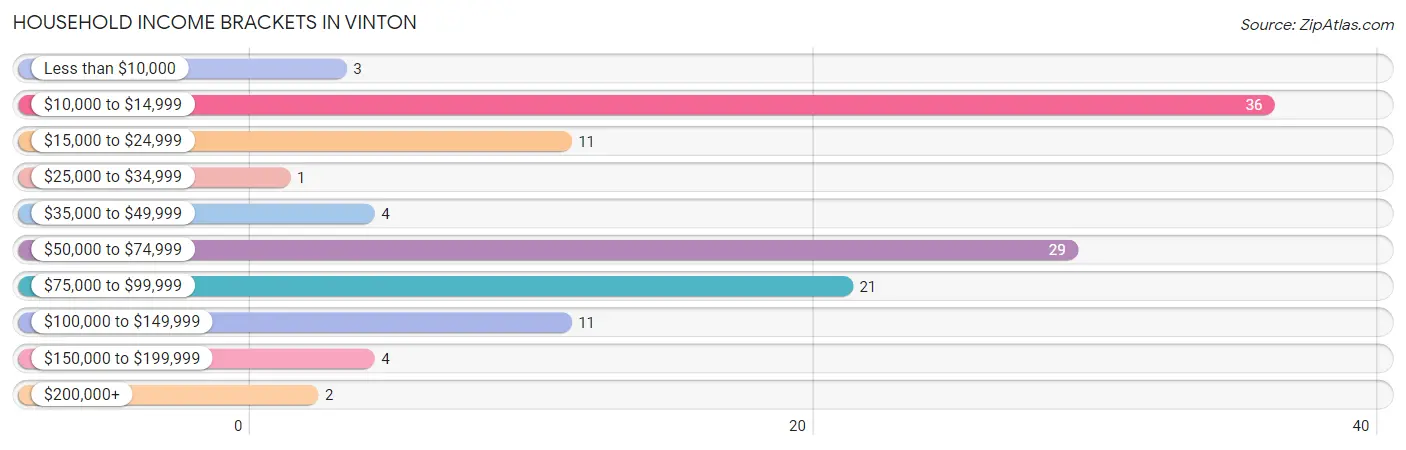
| Income Bracket | # Households | % Households |
| Less than $10,000 | 3 | 2.5% |
| $10,000 to $14,999 | 36 | 29.5% |
| $15,000 to $24,999 | 11 | 9.0% |
| $25,000 to $34,999 | 1 | 0.8% |
| $35,000 to $49,999 | 4 | 3.3% |
| $50,000 to $74,999 | 29 | 23.8% |
| $75,000 to $99,999 | 21 | 17.2% |
| $100,000 to $149,999 | 11 | 9.0% |
| $150,000 to $199,999 | 4 | 3.3% |
| $200,000+ | 2 | 1.6% |
Household Income by Householder Age in Vinton
The median household income in Vinton is $55,417, with the highest median household income of $90,833 found in the 25 to 44 years age bracket for the primary householder. A total of 42 households (34.4%) fall into this category. Meanwhile, the 15 to 24 years age bracket for the primary householder has the lowest median household income of $0, with 37 households (30.3%) in this group.
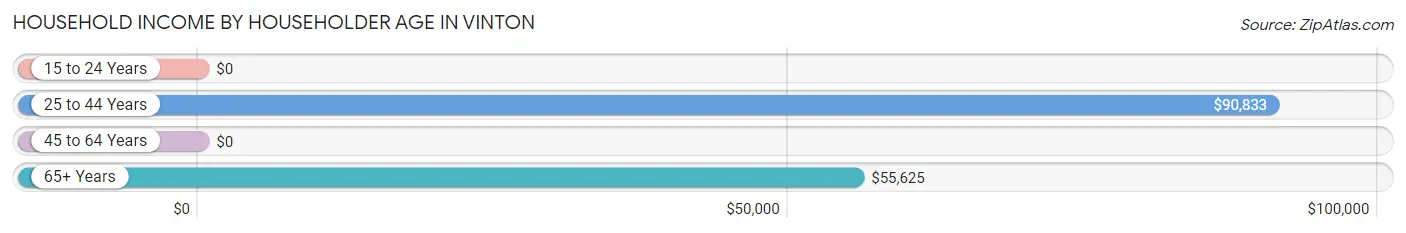
| Income Bracket | # Households | Median Income |
| 15 to 24 Years | 37 (30.3%) | $0 |
| 25 to 44 Years | 42 (34.4%) | $90,833 |
| 45 to 64 Years | 22 (18.0%) | $0 |
| 65+ Years | 21 (17.2%) | $55,625 |
| Total | 122 (100.0%) | $55,417 |
Poverty in Vinton
Income Below Poverty by Sex and Age in Vinton
With 26.7% poverty level for males and 12.3% for females among the residents of Vinton, 18 to 24 year old males and 75 year old and over females are the most vulnerable to poverty, with 34 males (69.4%) and 3 females (100.0%) in their respective age groups living below the poverty level.
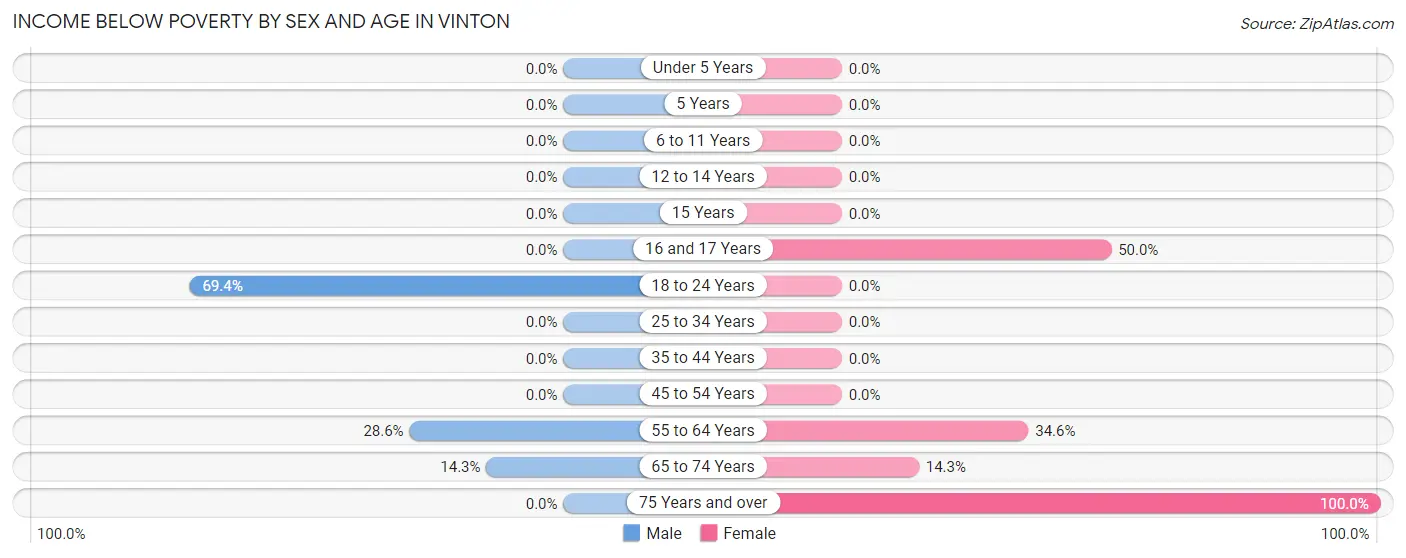
| Age Bracket | Male | Female |
| Under 5 Years | 0 (0.0%) | 0 (0.0%) |
| 5 Years | 0 (0.0%) | 0 (0.0%) |
| 6 to 11 Years | 0 (0.0%) | 0 (0.0%) |
| 12 to 14 Years | 0 (0.0%) | 0 (0.0%) |
| 15 Years | 0 (0.0%) | 0 (0.0%) |
| 16 and 17 Years | 0 (0.0%) | 3 (50.0%) |
| 18 to 24 Years | 34 (69.4%) | 0 (0.0%) |
| 25 to 34 Years | 0 (0.0%) | 0 (0.0%) |
| 35 to 44 Years | 0 (0.0%) | 0 (0.0%) |
| 45 to 54 Years | 0 (0.0%) | 0 (0.0%) |
| 55 to 64 Years | 4 (28.6%) | 9 (34.6%) |
| 65 to 74 Years | 2 (14.3%) | 2 (14.3%) |
| 75 Years and over | 0 (0.0%) | 3 (100.0%) |
| Total | 40 (26.7%) | 17 (12.3%) |
Income Above Poverty by Sex and Age in Vinton
According to the poverty statistics in Vinton, males aged under 5 years and females aged under 5 years are the age groups that are most secure financially, with 100.0% of males and 100.0% of females in these age groups living above the poverty line.
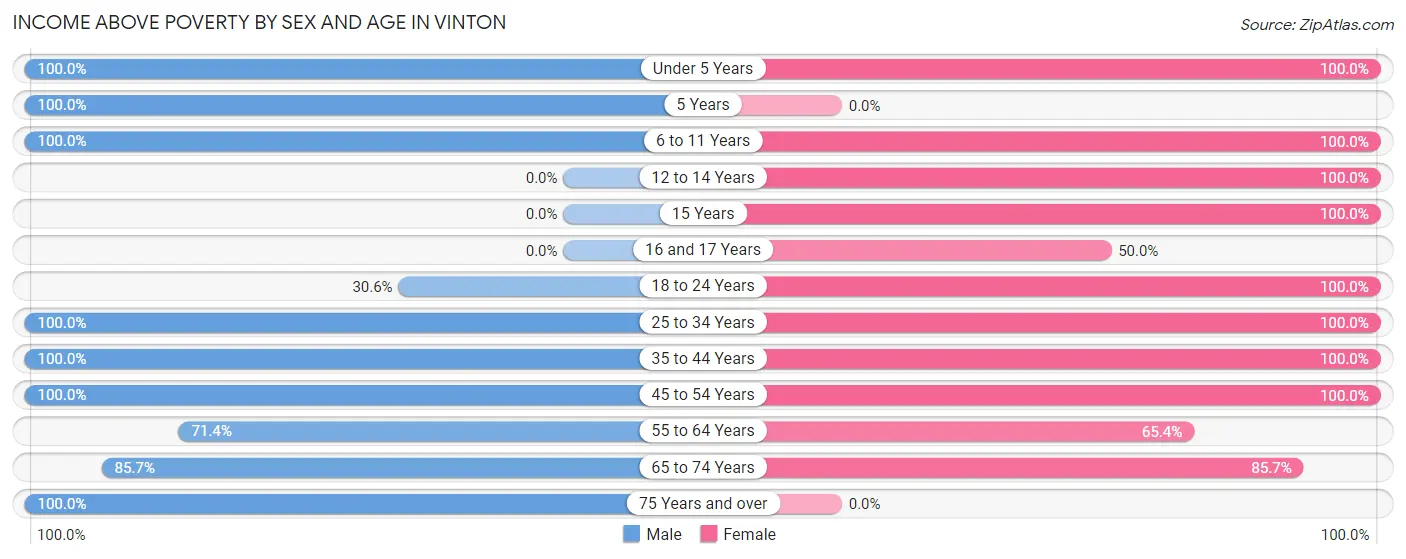
| Age Bracket | Male | Female |
| Under 5 Years | 14 (100.0%) | 2 (100.0%) |
| 5 Years | 2 (100.0%) | 0 (0.0%) |
| 6 to 11 Years | 2 (100.0%) | 9 (100.0%) |
| 12 to 14 Years | 0 (0.0%) | 3 (100.0%) |
| 15 Years | 0 (0.0%) | 18 (100.0%) |
| 16 and 17 Years | 0 (0.0%) | 3 (50.0%) |
| 18 to 24 Years | 15 (30.6%) | 8 (100.0%) |
| 25 to 34 Years | 10 (100.0%) | 10 (100.0%) |
| 35 to 44 Years | 22 (100.0%) | 33 (100.0%) |
| 45 to 54 Years | 18 (100.0%) | 6 (100.0%) |
| 55 to 64 Years | 10 (71.4%) | 17 (65.4%) |
| 65 to 74 Years | 12 (85.7%) | 12 (85.7%) |
| 75 Years and over | 5 (100.0%) | 0 (0.0%) |
| Total | 110 (73.3%) | 121 (87.7%) |
Income Below Poverty Among Married-Couple Families in Vinton
The poverty statistics for married-couple families in Vinton show that 10.8% or 7 of the total 65 families live below the poverty line. Families with no children have the highest poverty rate of 14.8%, comprising of 4 families. On the other hand, families with 3 or 4 children have the lowest poverty rate of 0.0%, which includes 0 families.
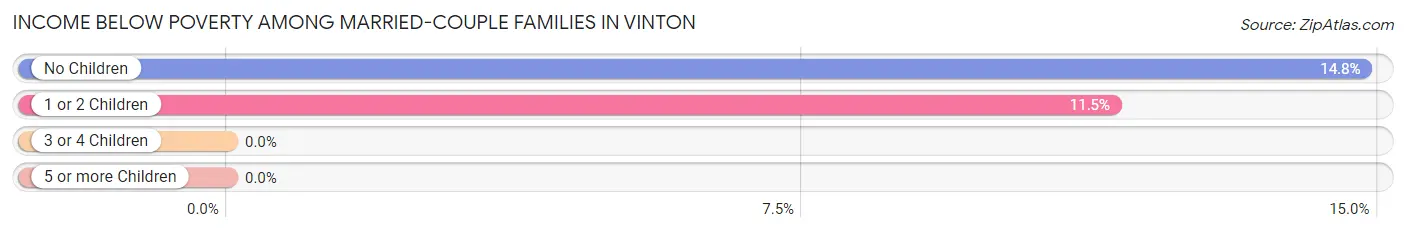
| Children | Above Poverty | Below Poverty |
| No Children | 23 (85.2%) | 4 (14.8%) |
| 1 or 2 Children | 23 (88.5%) | 3 (11.5%) |
| 3 or 4 Children | 12 (100.0%) | 0 (0.0%) |
| 5 or more Children | 0 (0.0%) | 0 (0.0%) |
| Total | 58 (89.2%) | 7 (10.8%) |
Income Below Poverty Among Single-Parent Households in Vinton
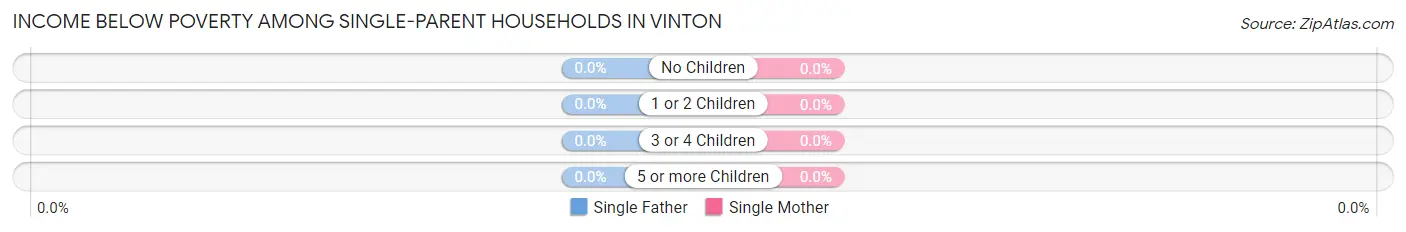
| Children | Single Father | Single Mother |
| No Children | 0 (0.0%) | 0 (0.0%) |
| 1 or 2 Children | 0 (0.0%) | 0 (0.0%) |
| 3 or 4 Children | 0 (0.0%) | 0 (0.0%) |
| 5 or more Children | 0 (0.0%) | 0 (0.0%) |
| Total | 0 (0.0%) | 0 (0.0%) |
Income Below Poverty Among Married-Couple vs Single-Parent Households in Vinton
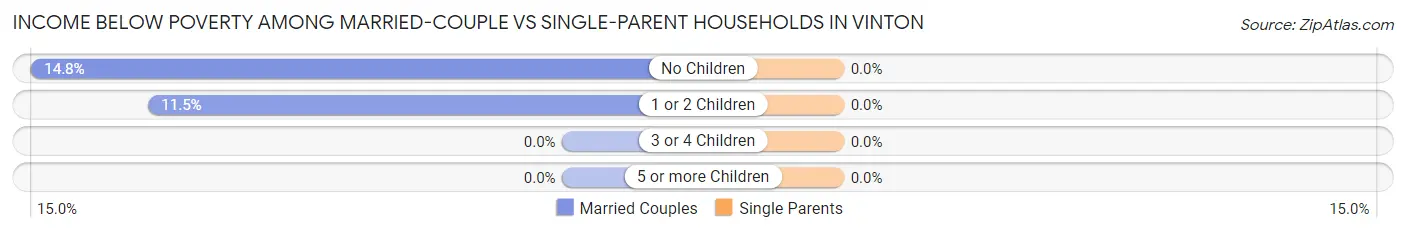
| Children | Married-Couple Families | Single-Parent Households |
| No Children | 4 (14.8%) | 0 (0.0%) |
| 1 or 2 Children | 3 (11.5%) | 0 (0.0%) |
| 3 or 4 Children | 0 (0.0%) | 0 (0.0%) |
| 5 or more Children | 0 (0.0%) | 0 (0.0%) |
| Total | 7 (10.8%) | 0 (0.0%) |
Employment Characteristics in Vinton
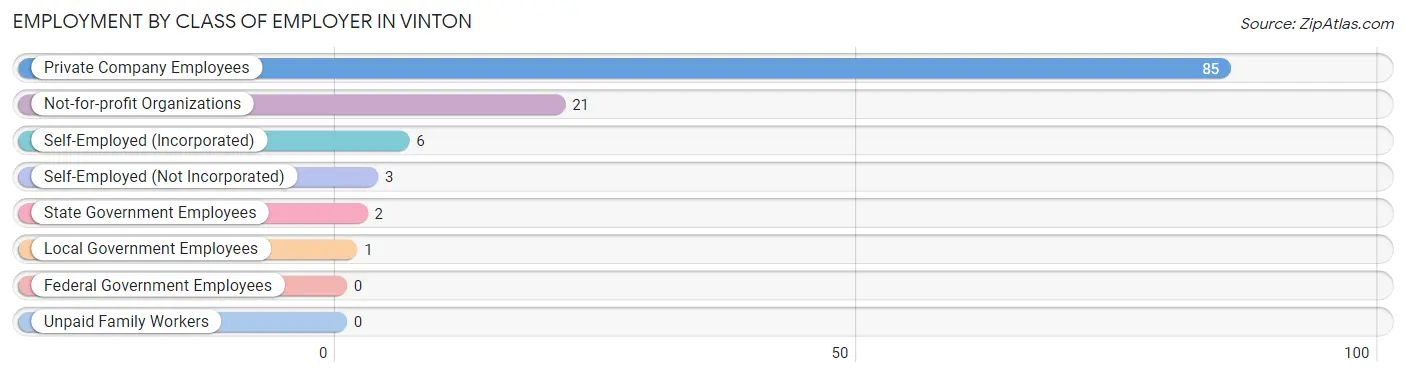
Employment by Class of Employer in Vinton
Among the 118 employed individuals in Vinton, private company employees (85 | 72.0%), not-for-profit organizations (21 | 17.8%), and self-employed (incorporated) (6 | 5.1%) make up the most common classes of employment.
| Employer Class | # Employees | % Employees |
| Private Company Employees | 85 | 72.0% |
| Self-Employed (Incorporated) | 6 | 5.1% |
| Self-Employed (Not Incorporated) | 3 | 2.5% |
| Not-for-profit Organizations | 21 | 17.8% |
| Local Government Employees | 1 | 0.9% |
| State Government Employees | 2 | 1.7% |
| Federal Government Employees | 0 | 0.0% |
| Unpaid Family Workers | 0 | 0.0% |
| Total | 118 | 100.0% |
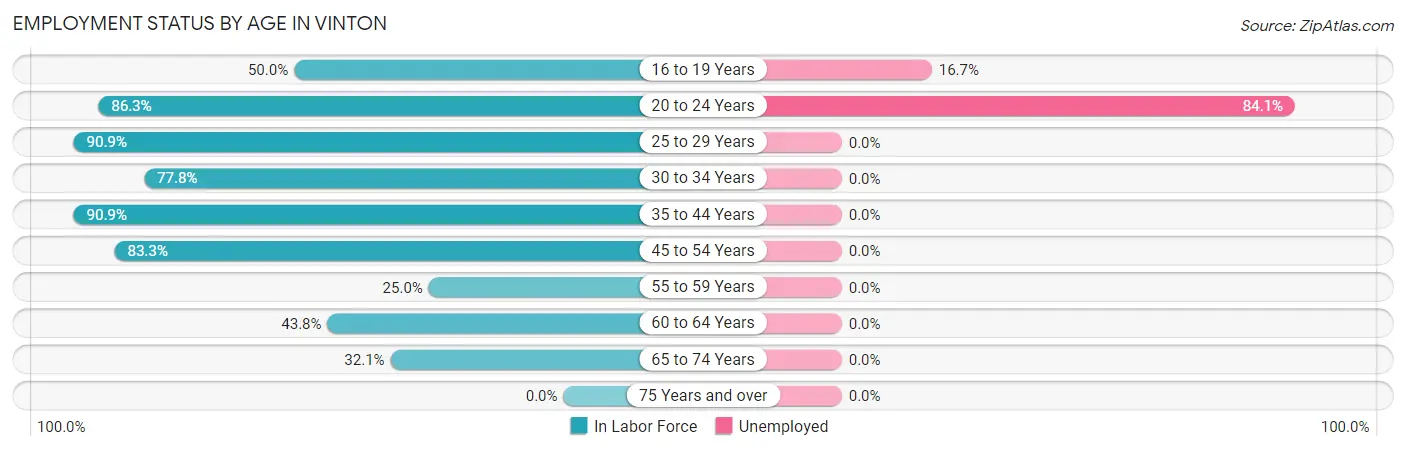
Employment Status by Age in Vinton
According to the labor force statistics for Vinton, out of the total population over 16 years of age (238), 68.1% or 162 individuals are in the labor force, with 23.5% or 38 of them unemployed. The age group with the highest labor force participation rate is 25 to 29 years, with 90.9% or 10 individuals in the labor force. Within the labor force, the 20 to 24 years age range has the highest percentage of unemployed individuals, with 84.1% or 37 of them being unemployed.
| Age Bracket | In Labor Force | Unemployed |
| 16 to 19 Years | 6 (50.0%) | 1 (16.7%) |
| 20 to 24 Years | 44 (86.3%) | 37 (84.1%) |
| 25 to 29 Years | 10 (90.9%) | 0 (0.0%) |
| 30 to 34 Years | 7 (77.8%) | 0 (0.0%) |
| 35 to 44 Years | 50 (90.9%) | 0 (0.0%) |
| 45 to 54 Years | 20 (83.3%) | 0 (0.0%) |
| 55 to 59 Years | 2 (25.0%) | 0 (0.0%) |
| 60 to 64 Years | 14 (43.8%) | 0 (0.0%) |
| 65 to 74 Years | 9 (32.1%) | 0 (0.0%) |
| 75 Years and over | 0 (0.0%) | 0 (0.0%) |
| Total | 162 (68.1%) | 38 (23.5%) |
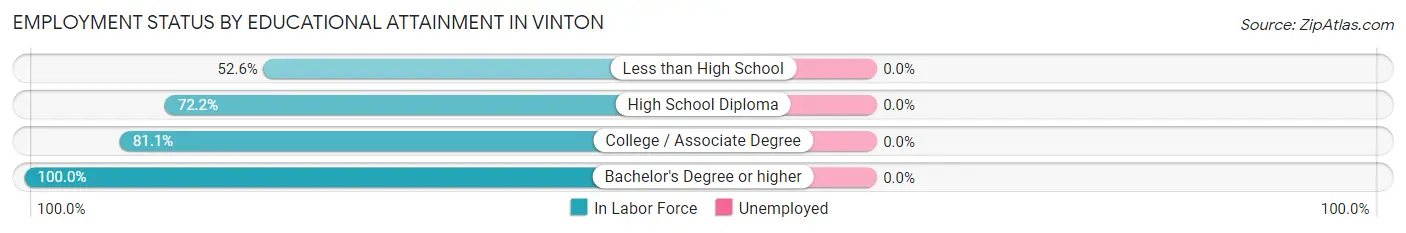
Employment Status by Educational Attainment in Vinton
| Educational Attainment | In Labor Force | Unemployed |
| Less than High School | 10 (52.6%) | 0 (0.0%) |
| High School Diploma | 52 (72.2%) | 0 (0.0%) |
| College / Associate Degree | 30 (81.1%) | 0 (0.0%) |
| Bachelor's Degree or higher | 11 (100.0%) | 0 (0.0%) |
| Total | 103 (74.1%) | 0 (0.0%) |
Employment Occupations by Sex in Vinton
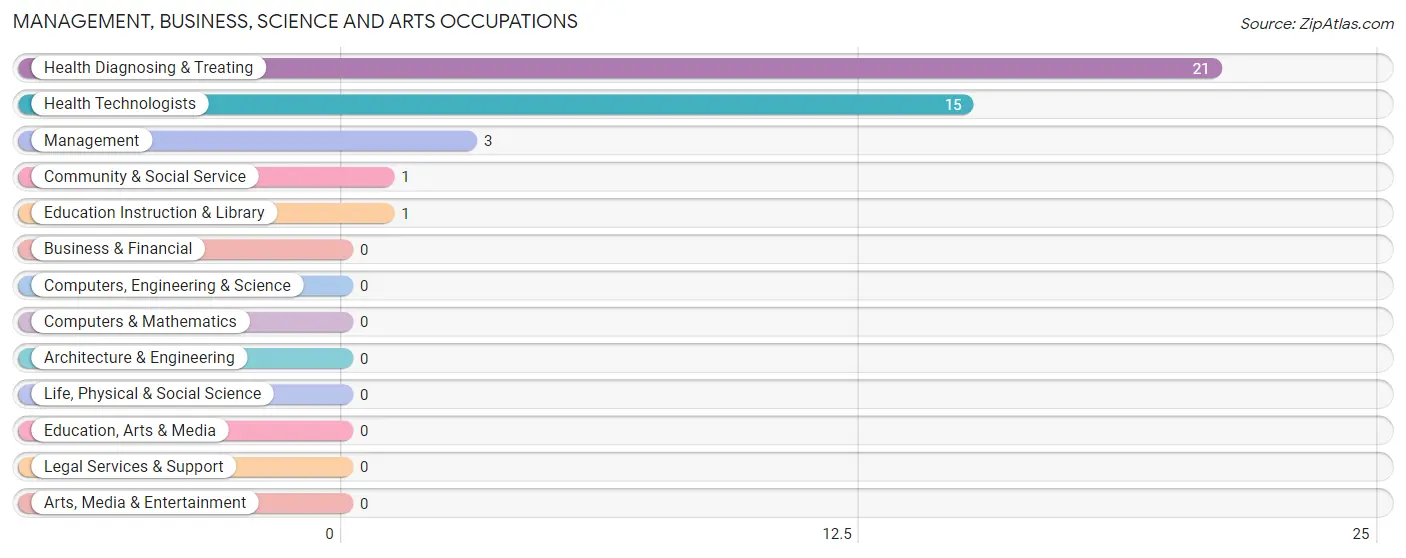
Management, Business, Science and Arts Occupations
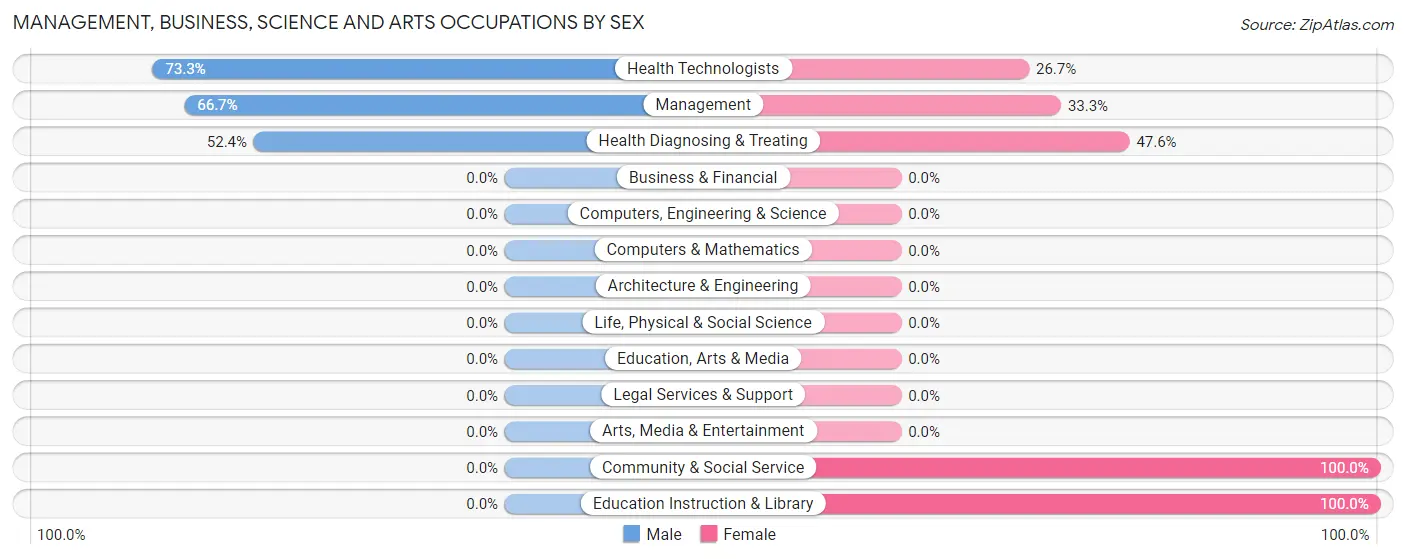
The most common Management, Business, Science and Arts occupations in Vinton are Health Diagnosing & Treating (21 | 16.9%), Health Technologists (15 | 12.1%), Management (3 | 2.4%), Community & Social Service (1 | 0.8%), and Education Instruction & Library (1 | 0.8%).
Management, Business, Science and Arts Occupations by Sex
Within the Management, Business, Science and Arts occupations in Vinton, the most male-oriented occupations are Health Technologists (73.3%), Management (66.7%), and Health Diagnosing & Treating (52.4%), while the most female-oriented occupations are Community & Social Service (100.0%), Education Instruction & Library (100.0%), and Health Diagnosing & Treating (47.6%).
| Occupation | Male | Female |
| Management | 2 (66.7%) | 1 (33.3%) |
| Business & Financial | 0 (0.0%) | 0 (0.0%) |
| Computers, Engineering & Science | 0 (0.0%) | 0 (0.0%) |
| Computers & Mathematics | 0 (0.0%) | 0 (0.0%) |
| Architecture & Engineering | 0 (0.0%) | 0 (0.0%) |
| Life, Physical & Social Science | 0 (0.0%) | 0 (0.0%) |
| Community & Social Service | 0 (0.0%) | 1 (100.0%) |
| Education, Arts & Media | 0 (0.0%) | 0 (0.0%) |
| Legal Services & Support | 0 (0.0%) | 0 (0.0%) |
| Education Instruction & Library | 0 (0.0%) | 1 (100.0%) |
| Arts, Media & Entertainment | 0 (0.0%) | 0 (0.0%) |
| Health Diagnosing & Treating | 11 (52.4%) | 10 (47.6%) |
| Health Technologists | 11 (73.3%) | 4 (26.7%) |
| Total (Category) | 13 (52.0%) | 12 (48.0%) |
| Total (Overall) | 57 (46.0%) | 67 (54.0%) |
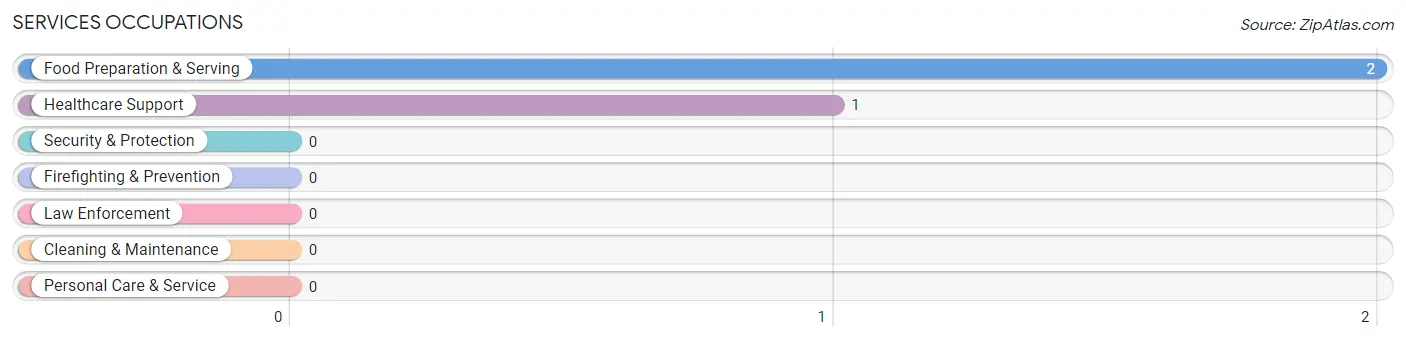
Services Occupations
The most common Services occupations in Vinton are Food Preparation & Serving (2 | 1.6%), and Healthcare Support (1 | 0.8%).
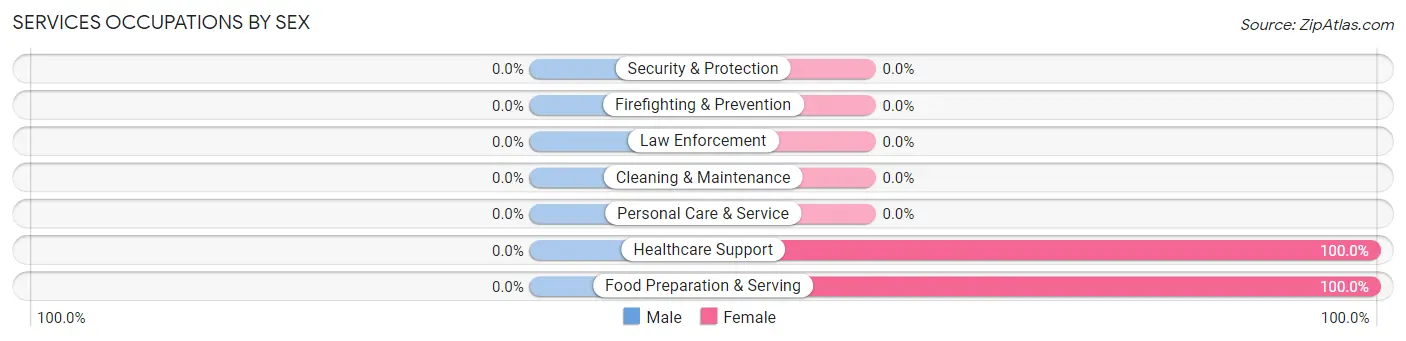
Services Occupations by Sex
| Occupation | Male | Female |
| Healthcare Support | 0 (0.0%) | 1 (100.0%) |
| Security & Protection | 0 (0.0%) | 0 (0.0%) |
| Firefighting & Prevention | 0 (0.0%) | 0 (0.0%) |
| Law Enforcement | 0 (0.0%) | 0 (0.0%) |
| Food Preparation & Serving | 0 (0.0%) | 2 (100.0%) |
| Cleaning & Maintenance | 0 (0.0%) | 0 (0.0%) |
| Personal Care & Service | 0 (0.0%) | 0 (0.0%) |
| Total (Category) | 0 (0.0%) | 3 (100.0%) |
| Total (Overall) | 57 (46.0%) | 67 (54.0%) |
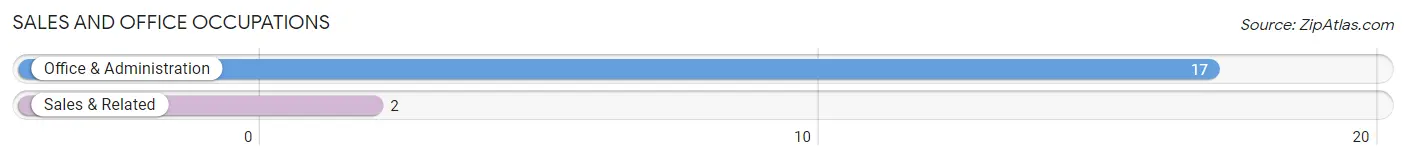
Sales and Office Occupations
The most common Sales and Office occupations in Vinton are Office & Administration (17 | 13.7%), and Sales & Related (2 | 1.6%).
Sales and Office Occupations by Sex
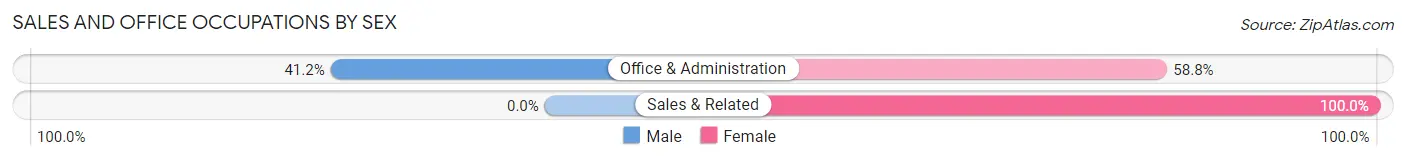
| Occupation | Male | Female |
| Sales & Related | 0 (0.0%) | 2 (100.0%) |
| Office & Administration | 7 (41.2%) | 10 (58.8%) |
| Total (Category) | 7 (36.8%) | 12 (63.2%) |
| Total (Overall) | 57 (46.0%) | 67 (54.0%) |
Natural Resources, Construction and Maintenance Occupations
The most common Natural Resources, Construction and Maintenance occupations in Vinton are , and Construction & Extraction (4 | 3.2%).
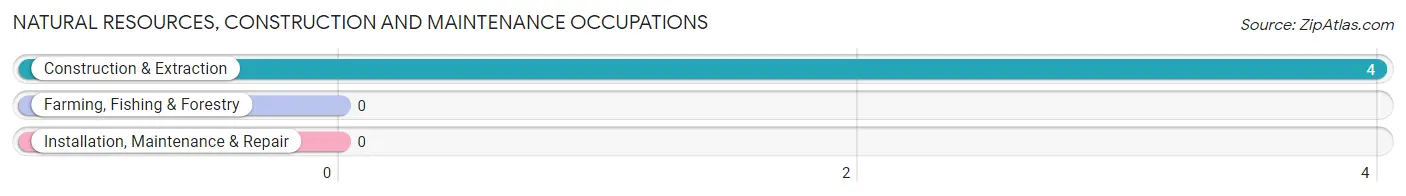
Natural Resources, Construction and Maintenance Occupations by Sex
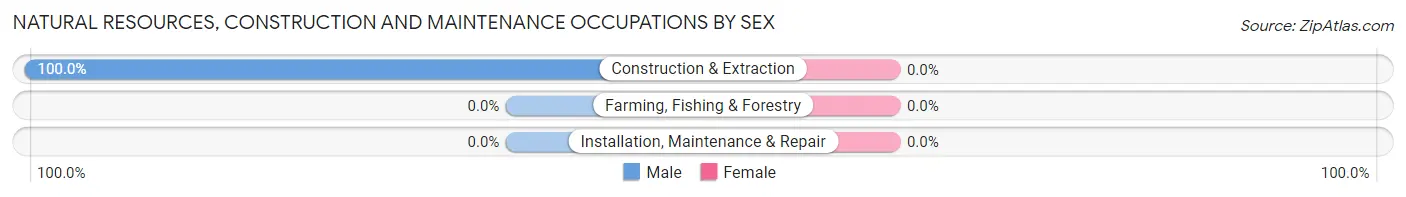
| Occupation | Male | Female |
| Farming, Fishing & Forestry | 0 (0.0%) | 0 (0.0%) |
| Construction & Extraction | 4 (100.0%) | 0 (0.0%) |
| Installation, Maintenance & Repair | 0 (0.0%) | 0 (0.0%) |
| Total (Category) | 4 (100.0%) | 0 (0.0%) |
| Total (Overall) | 57 (46.0%) | 67 (54.0%) |
Production, Transportation and Moving Occupations
The most common Production, Transportation and Moving occupations in Vinton are Production (39 | 31.5%), Material Moving (24 | 19.4%), and Transportation (10 | 8.1%).
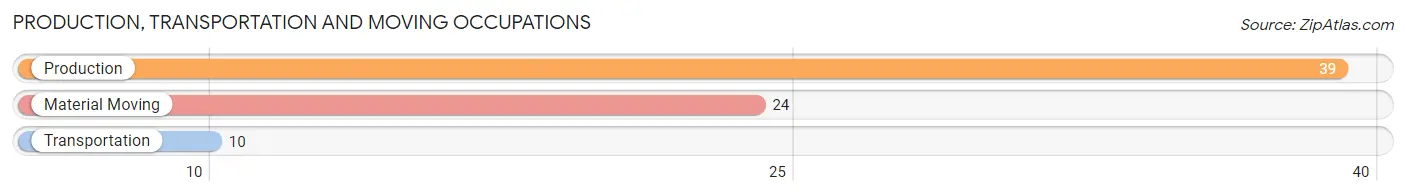
Production, Transportation and Moving Occupations by Sex
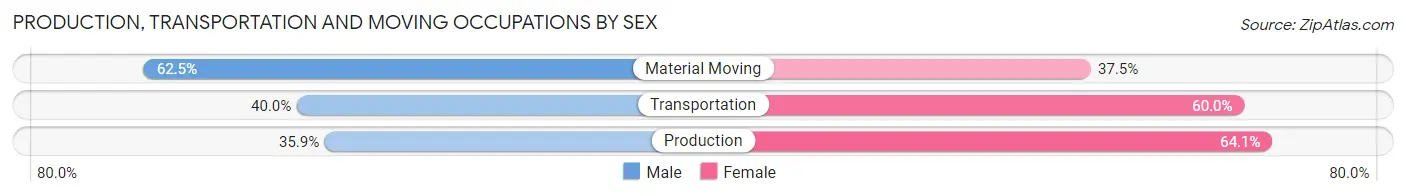
| Occupation | Male | Female |
| Production | 14 (35.9%) | 25 (64.1%) |
| Transportation | 4 (40.0%) | 6 (60.0%) |
| Material Moving | 15 (62.5%) | 9 (37.5%) |
| Total (Category) | 33 (45.2%) | 40 (54.8%) |
| Total (Overall) | 57 (46.0%) | 67 (54.0%) |
Employment Industries by Sex in Vinton
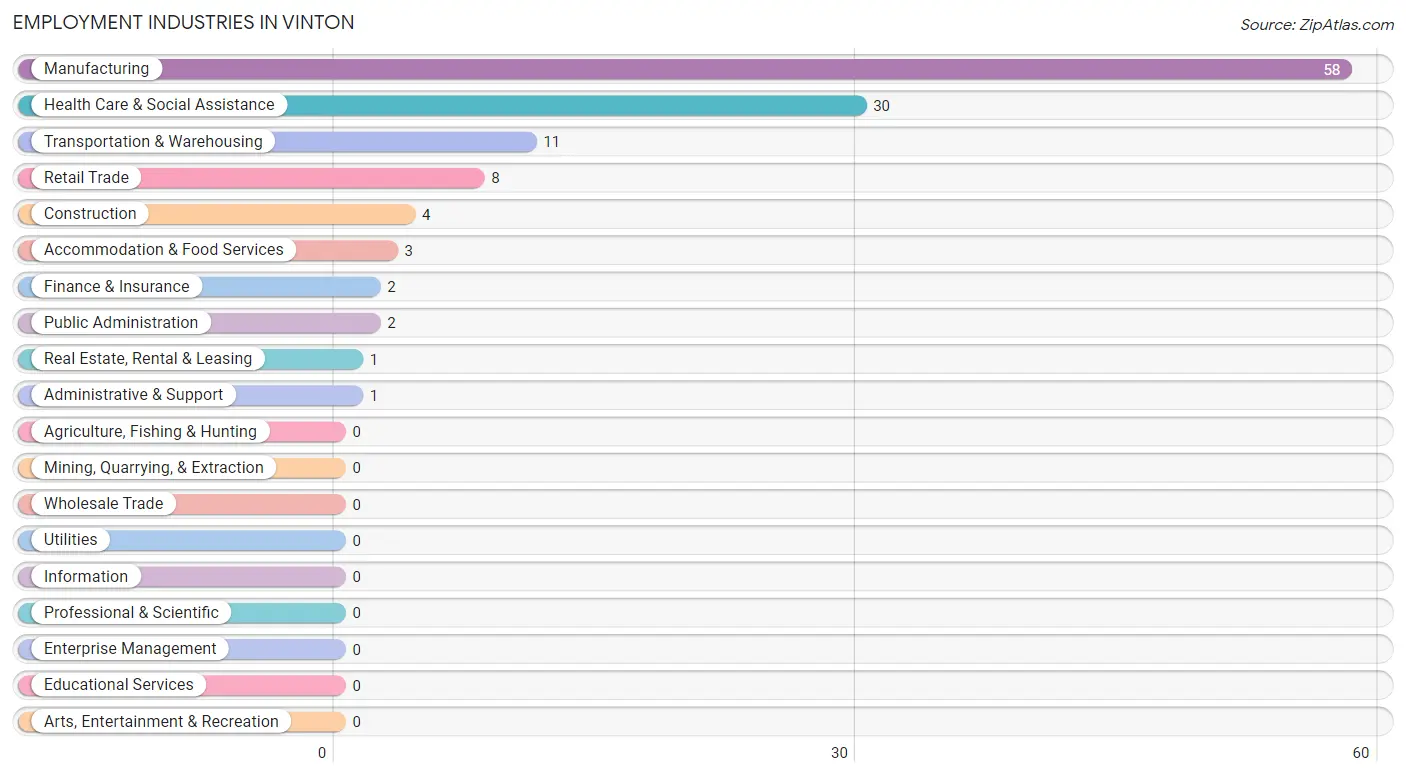
Employment Industries in Vinton
The major employment industries in Vinton include Manufacturing (58 | 46.8%), Health Care & Social Assistance (30 | 24.2%), Transportation & Warehousing (11 | 8.9%), Retail Trade (8 | 6.5%), and Construction (4 | 3.2%).
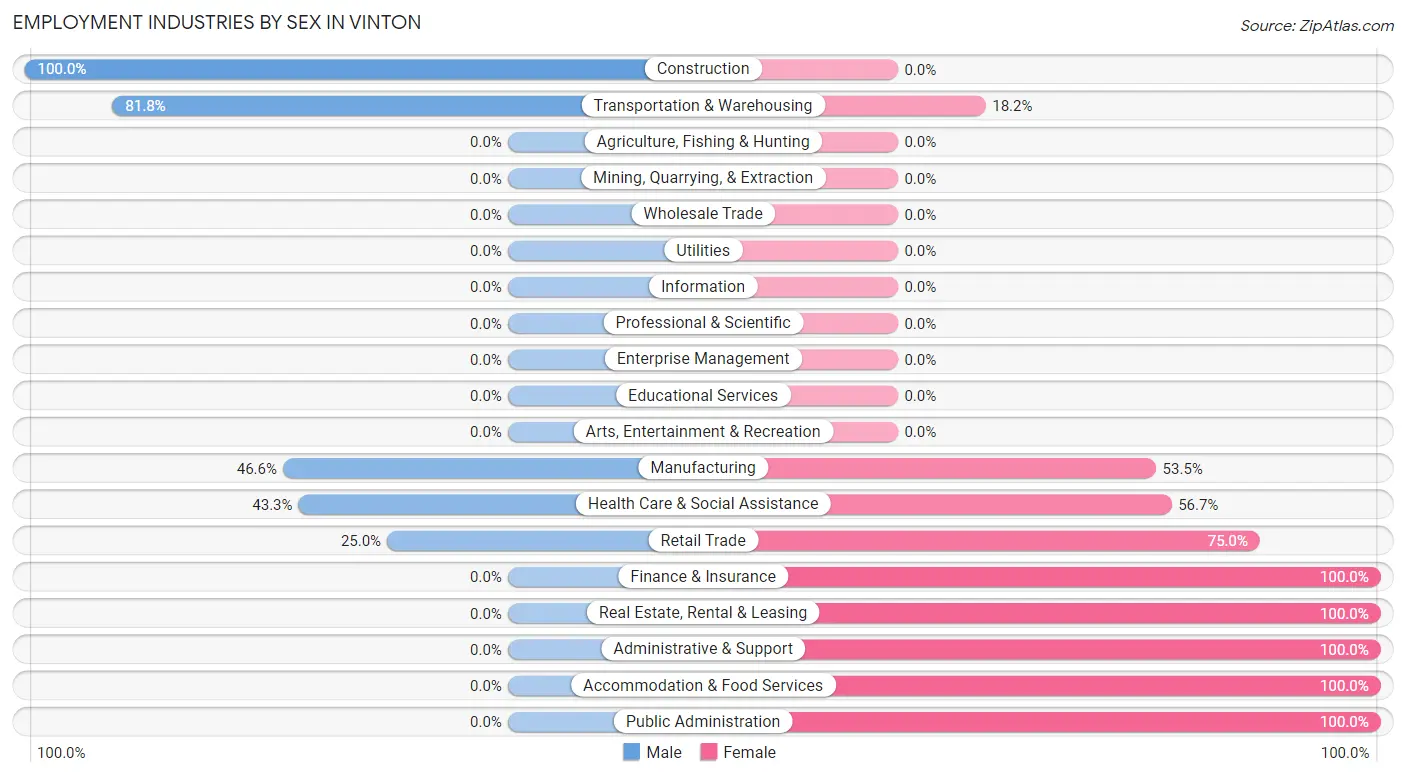
Employment Industries by Sex in Vinton
The Vinton industries that see more men than women are Construction (100.0%), Transportation & Warehousing (81.8%), and Manufacturing (46.6%), whereas the industries that tend to have a higher number of women are Finance & Insurance (100.0%), Real Estate, Rental & Leasing (100.0%), and Administrative & Support (100.0%).
| Industry | Male | Female |
| Agriculture, Fishing & Hunting | 0 (0.0%) | 0 (0.0%) |
| Mining, Quarrying, & Extraction | 0 (0.0%) | 0 (0.0%) |
| Construction | 4 (100.0%) | 0 (0.0%) |
| Manufacturing | 27 (46.6%) | 31 (53.4%) |
| Wholesale Trade | 0 (0.0%) | 0 (0.0%) |
| Retail Trade | 2 (25.0%) | 6 (75.0%) |
| Transportation & Warehousing | 9 (81.8%) | 2 (18.2%) |
| Utilities | 0 (0.0%) | 0 (0.0%) |
| Information | 0 (0.0%) | 0 (0.0%) |
| Finance & Insurance | 0 (0.0%) | 2 (100.0%) |
| Real Estate, Rental & Leasing | 0 (0.0%) | 1 (100.0%) |
| Professional & Scientific | 0 (0.0%) | 0 (0.0%) |
| Enterprise Management | 0 (0.0%) | 0 (0.0%) |
| Administrative & Support | 0 (0.0%) | 1 (100.0%) |
| Educational Services | 0 (0.0%) | 0 (0.0%) |
| Health Care & Social Assistance | 13 (43.3%) | 17 (56.7%) |
| Arts, Entertainment & Recreation | 0 (0.0%) | 0 (0.0%) |
| Accommodation & Food Services | 0 (0.0%) | 3 (100.0%) |
| Public Administration | 0 (0.0%) | 2 (100.0%) |
| Total | 57 (46.0%) | 67 (54.0%) |
Education in Vinton
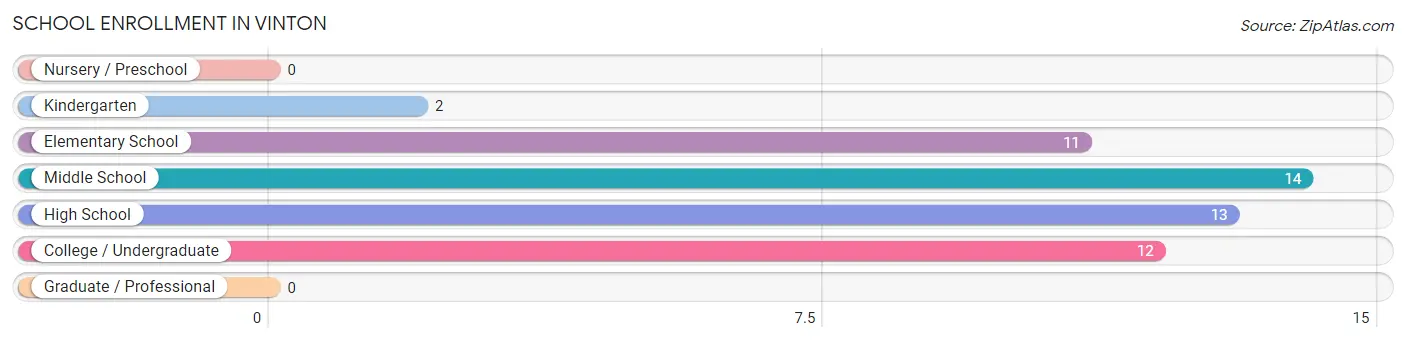
School Enrollment in Vinton
The most common levels of schooling among the 52 students in Vinton are middle school (14 | 26.9%), high school (13 | 25.0%), and college / undergraduate (12 | 23.1%).
| School Level | # Students | % Students |
| Nursery / Preschool | 0 | 0.0% |
| Kindergarten | 2 | 3.8% |
| Elementary School | 11 | 21.1% |
| Middle School | 14 | 26.9% |
| High School | 13 | 25.0% |
| College / Undergraduate | 12 | 23.1% |
| Graduate / Professional | 0 | 0.0% |
| Total | 52 | 100.0% |
School Enrollment by Age by Funding Source in Vinton
Out of a total of 52 students who are enrolled in schools in Vinton, 12 (23.1%) attend a private institution, while the remaining 40 (76.9%) are enrolled in public schools. The age group of 20 to 24 year olds has the highest likelihood of being enrolled in private schools, with 7 (100.0% in the age bracket) enrolled. Conversely, the age group of 5 to 9 year old has the lowest likelihood of being enrolled in a private school, with 13 (100.0% in the age bracket) attending a public institution.
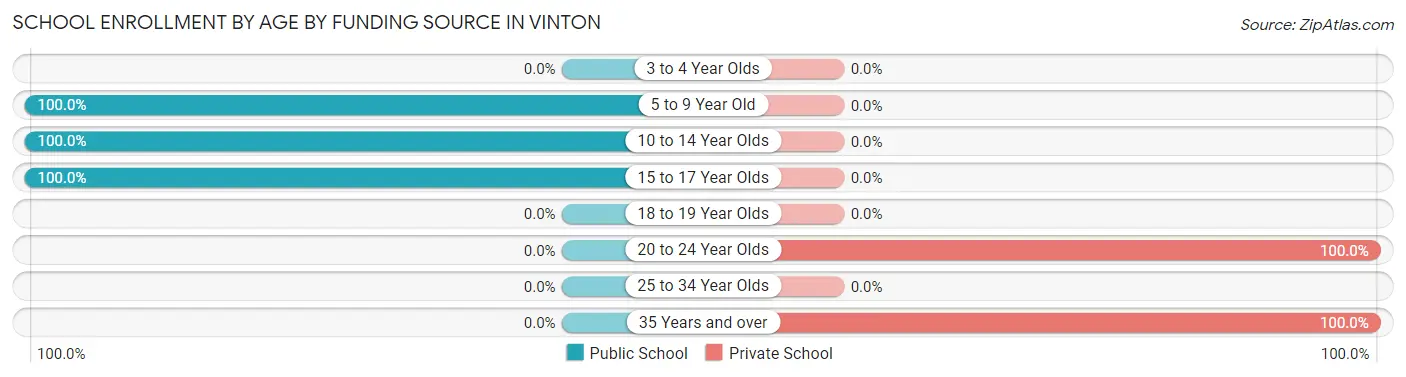
| Age Bracket | Public School | Private School |
| 3 to 4 Year Olds | 0 (0.0%) | 0 (0.0%) |
| 5 to 9 Year Old | 13 (100.0%) | 0 (0.0%) |
| 10 to 14 Year Olds | 3 (100.0%) | 0 (0.0%) |
| 15 to 17 Year Olds | 24 (100.0%) | 0 (0.0%) |
| 18 to 19 Year Olds | 0 (0.0%) | 0 (0.0%) |
| 20 to 24 Year Olds | 0 (0.0%) | 7 (100.0%) |
| 25 to 34 Year Olds | 0 (0.0%) | 0 (0.0%) |
| 35 Years and over | 0 (0.0%) | 5 (100.0%) |
| Total | 40 (76.9%) | 12 (23.1%) |
Educational Attainment by Field of Study in Vinton
Business (8 | 72.7%), and science & technology (3 | 27.3%) are the most common fields of study among 11 individuals in Vinton who have obtained a bachelor's degree or higher.
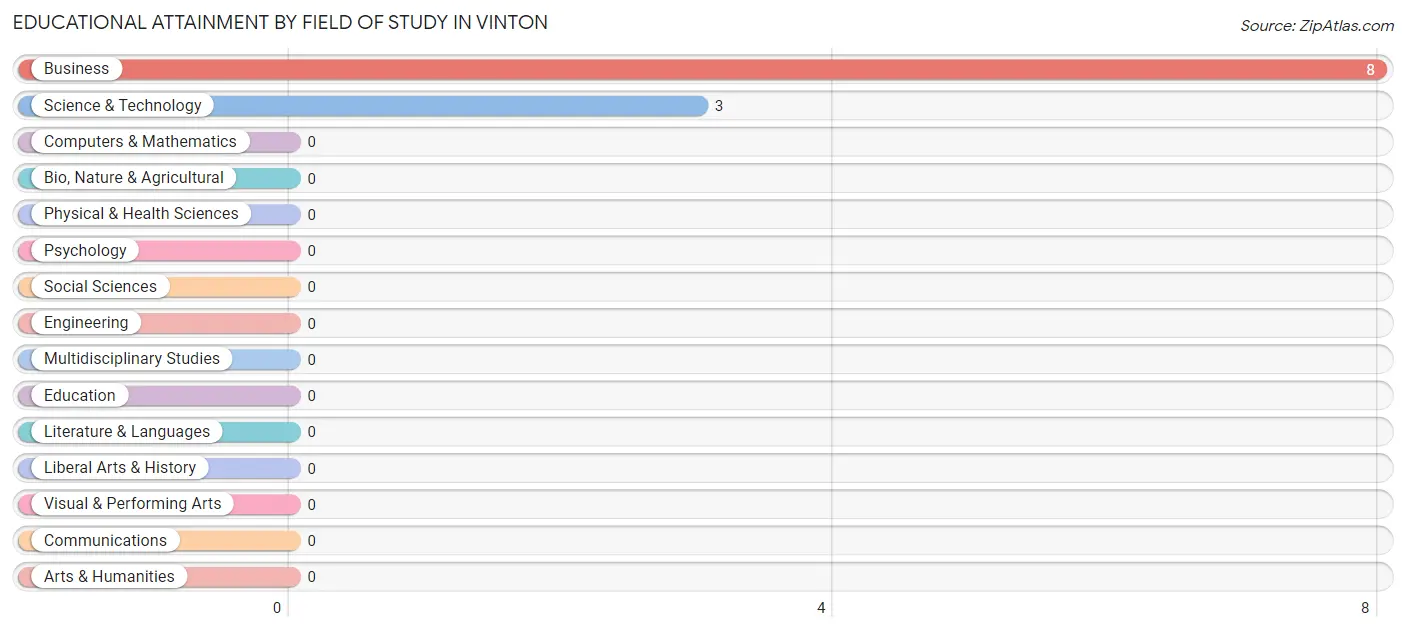
| Field of Study | # Graduates | % Graduates |
| Computers & Mathematics | 0 | 0.0% |
| Bio, Nature & Agricultural | 0 | 0.0% |
| Physical & Health Sciences | 0 | 0.0% |
| Psychology | 0 | 0.0% |
| Social Sciences | 0 | 0.0% |
| Engineering | 0 | 0.0% |
| Multidisciplinary Studies | 0 | 0.0% |
| Science & Technology | 3 | 27.3% |
| Business | 8 | 72.7% |
| Education | 0 | 0.0% |
| Literature & Languages | 0 | 0.0% |
| Liberal Arts & History | 0 | 0.0% |
| Visual & Performing Arts | 0 | 0.0% |
| Communications | 0 | 0.0% |
| Arts & Humanities | 0 | 0.0% |
| Total | 11 | 100.0% |
Transportation & Commute in Vinton
Vehicle Availability by Sex in Vinton
The most prevalent vehicle ownership categories in Vinton are males with 3 vehicles (36, accounting for 63.2%) and females with 3 vehicles (28, making up 59.0%).
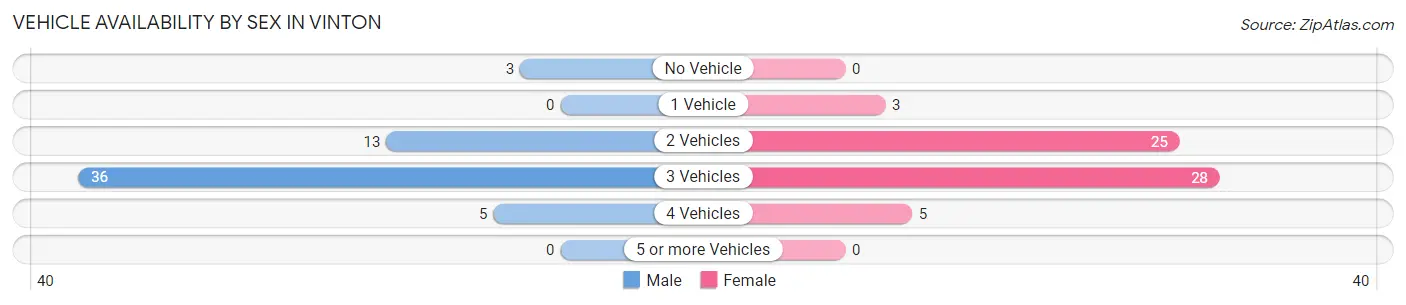
| Vehicles Available | Male | Female |
| No Vehicle | 3 (5.3%) | 0 (0.0%) |
| 1 Vehicle | 0 (0.0%) | 3 (4.9%) |
| 2 Vehicles | 13 (22.8%) | 25 (41.0%) |
| 3 Vehicles | 36 (63.2%) | 28 (45.9%) |
| 4 Vehicles | 5 (8.8%) | 5 (8.2%) |
| 5 or more Vehicles | 0 (0.0%) | 0 (0.0%) |
| Total | 57 (100.0%) | 61 (100.0%) |
Commute Time in Vinton
The most frequently occuring commute durations in Vinton are 20 to 24 minutes (23 commuters, 20.2%), 30 to 34 minutes (22 commuters, 19.3%), and 45 to 59 minutes (16 commuters, 14.0%).
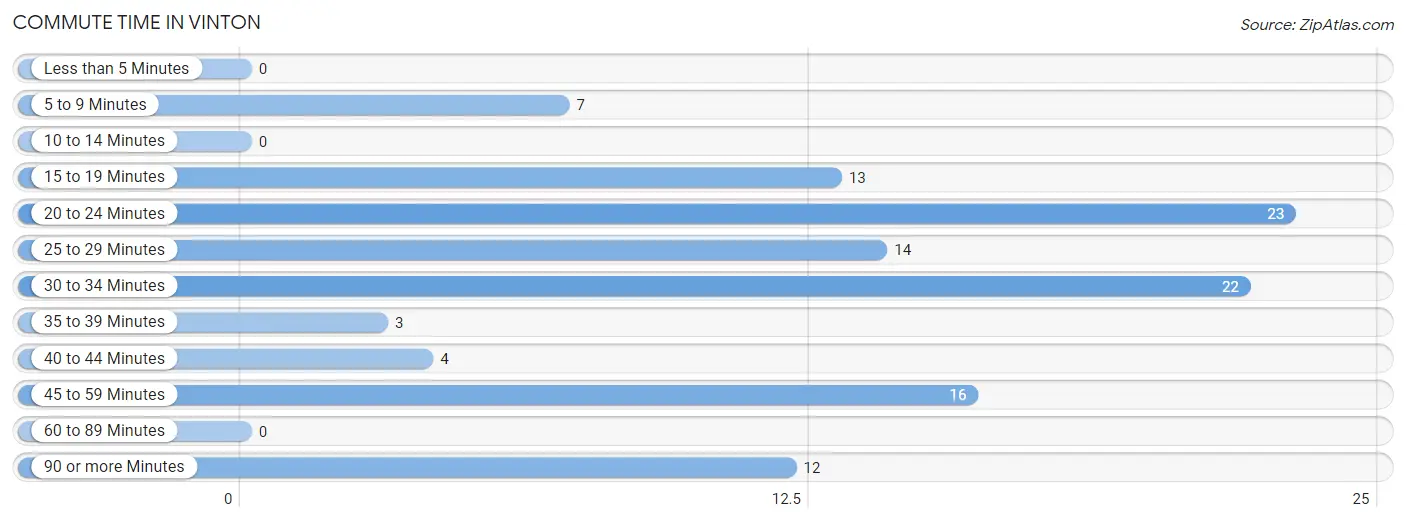
| Commute Time | # Commuters | % Commuters |
| Less than 5 Minutes | 0 | 0.0% |
| 5 to 9 Minutes | 7 | 6.1% |
| 10 to 14 Minutes | 0 | 0.0% |
| 15 to 19 Minutes | 13 | 11.4% |
| 20 to 24 Minutes | 23 | 20.2% |
| 25 to 29 Minutes | 14 | 12.3% |
| 30 to 34 Minutes | 22 | 19.3% |
| 35 to 39 Minutes | 3 | 2.6% |
| 40 to 44 Minutes | 4 | 3.5% |
| 45 to 59 Minutes | 16 | 14.0% |
| 60 to 89 Minutes | 0 | 0.0% |
| 90 or more Minutes | 12 | 10.5% |
Commute Time by Sex in Vinton
The most common commute times in Vinton are 20 to 24 minutes (21 commuters, 36.8%) for males and 25 to 29 minutes (14 commuters, 24.6%) for females.
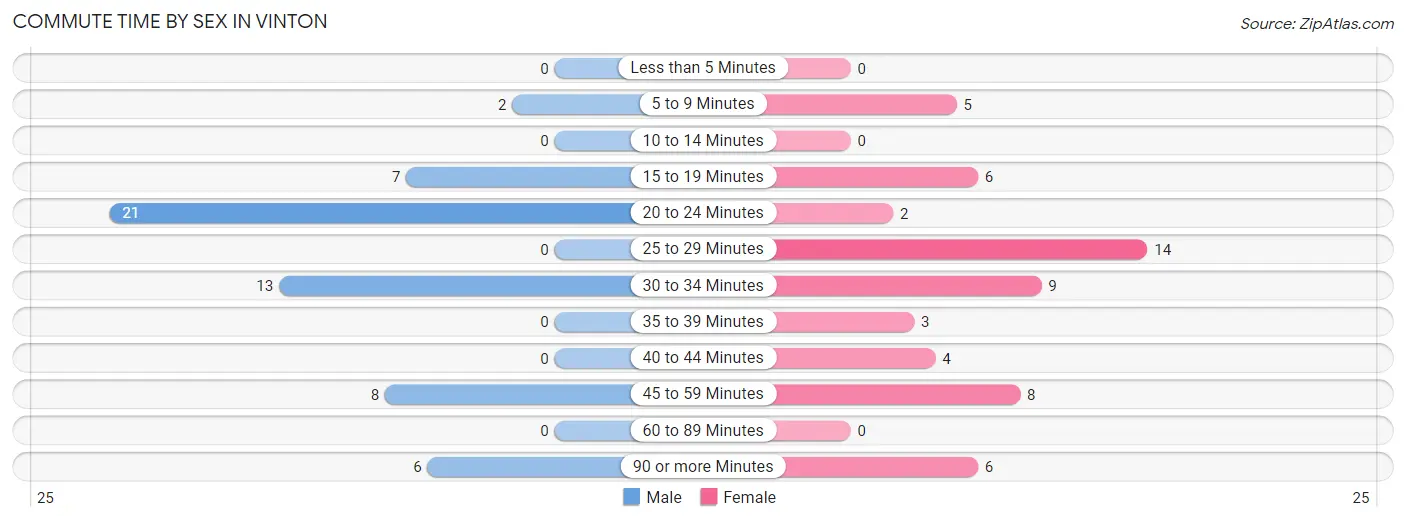
| Commute Time | Male | Female |
| Less than 5 Minutes | 0 (0.0%) | 0 (0.0%) |
| 5 to 9 Minutes | 2 (3.5%) | 5 (8.8%) |
| 10 to 14 Minutes | 0 (0.0%) | 0 (0.0%) |
| 15 to 19 Minutes | 7 (12.3%) | 6 (10.5%) |
| 20 to 24 Minutes | 21 (36.8%) | 2 (3.5%) |
| 25 to 29 Minutes | 0 (0.0%) | 14 (24.6%) |
| 30 to 34 Minutes | 13 (22.8%) | 9 (15.8%) |
| 35 to 39 Minutes | 0 (0.0%) | 3 (5.3%) |
| 40 to 44 Minutes | 0 (0.0%) | 4 (7.0%) |
| 45 to 59 Minutes | 8 (14.0%) | 8 (14.0%) |
| 60 to 89 Minutes | 0 (0.0%) | 0 (0.0%) |
| 90 or more Minutes | 6 (10.5%) | 6 (10.5%) |
Time of Departure to Work by Sex in Vinton
The most frequent times of departure to work in Vinton are 4:00 PM to 11:59 PM (25, 43.9%) for males and 5:30 AM to 5:59 AM (12, 21.0%) for females.
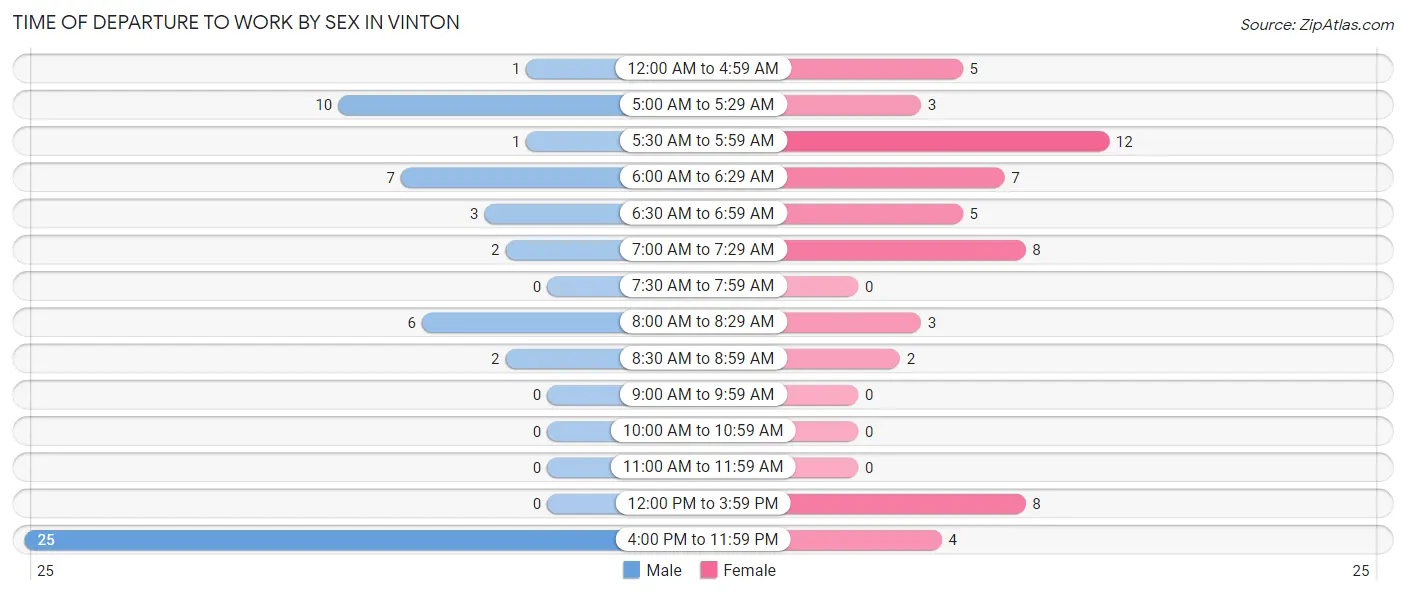
| Time of Departure | Male | Female |
| 12:00 AM to 4:59 AM | 1 (1.8%) | 5 (8.8%) |
| 5:00 AM to 5:29 AM | 10 (17.5%) | 3 (5.3%) |
| 5:30 AM to 5:59 AM | 1 (1.8%) | 12 (21.0%) |
| 6:00 AM to 6:29 AM | 7 (12.3%) | 7 (12.3%) |
| 6:30 AM to 6:59 AM | 3 (5.3%) | 5 (8.8%) |
| 7:00 AM to 7:29 AM | 2 (3.5%) | 8 (14.0%) |
| 7:30 AM to 7:59 AM | 0 (0.0%) | 0 (0.0%) |
| 8:00 AM to 8:29 AM | 6 (10.5%) | 3 (5.3%) |
| 8:30 AM to 8:59 AM | 2 (3.5%) | 2 (3.5%) |
| 9:00 AM to 9:59 AM | 0 (0.0%) | 0 (0.0%) |
| 10:00 AM to 10:59 AM | 0 (0.0%) | 0 (0.0%) |
| 11:00 AM to 11:59 AM | 0 (0.0%) | 0 (0.0%) |
| 12:00 PM to 3:59 PM | 0 (0.0%) | 8 (14.0%) |
| 4:00 PM to 11:59 PM | 25 (43.9%) | 4 (7.0%) |
| Total | 57 (100.0%) | 57 (100.0%) |
Housing Occupancy in Vinton
Occupancy by Ownership in Vinton
Of the total 122 dwellings in Vinton, owner-occupied units account for 63 (51.6%), while renter-occupied units make up 59 (48.4%).
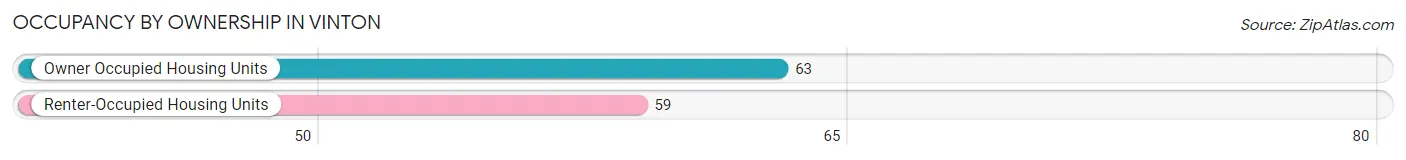
| Occupancy | # Housing Units | % Housing Units |
| Owner Occupied Housing Units | 63 | 51.6% |
| Renter-Occupied Housing Units | 59 | 48.4% |
| Total Occupied Housing Units | 122 | 100.0% |
Occupancy by Household Size in Vinton
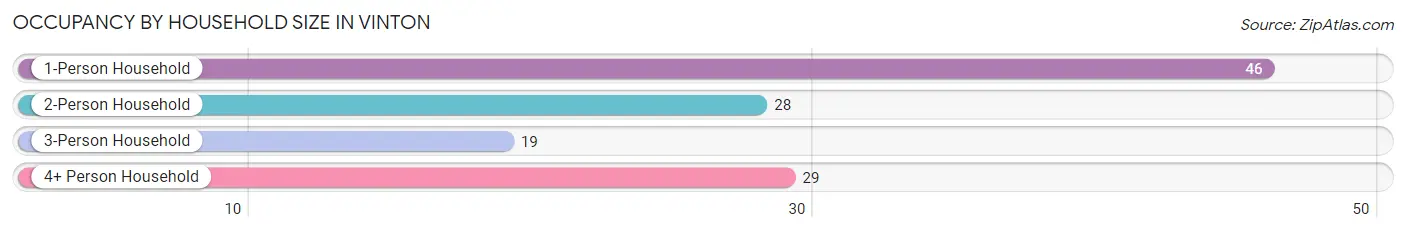
| Household Size | # Housing Units | % Housing Units |
| 1-Person Household | 46 | 37.7% |
| 2-Person Household | 28 | 23.0% |
| 3-Person Household | 19 | 15.6% |
| 4+ Person Household | 29 | 23.8% |
| Total Housing Units | 122 | 100.0% |
Occupancy by Ownership by Household Size in Vinton
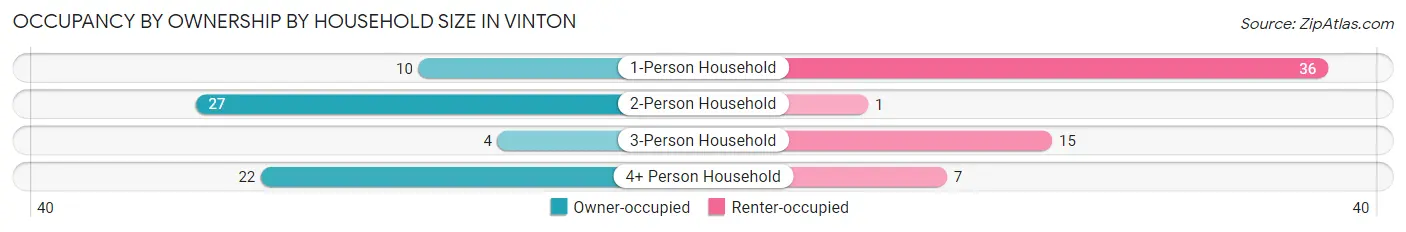
| Household Size | Owner-occupied | Renter-occupied |
| 1-Person Household | 10 (21.7%) | 36 (78.3%) |
| 2-Person Household | 27 (96.4%) | 1 (3.6%) |
| 3-Person Household | 4 (21.0%) | 15 (78.9%) |
| 4+ Person Household | 22 (75.9%) | 7 (24.1%) |
| Total Housing Units | 63 (51.6%) | 59 (48.4%) |
Occupancy by Educational Attainment in Vinton
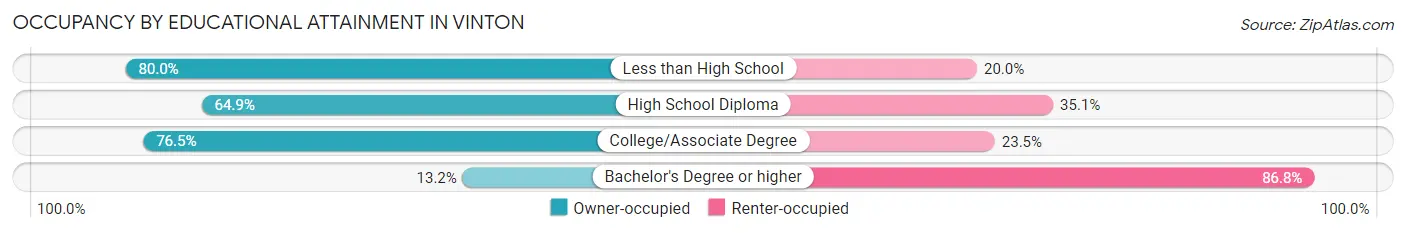
| Household Size | Owner-occupied | Renter-occupied |
| Less than High School | 8 (80.0%) | 2 (20.0%) |
| High School Diploma | 37 (64.9%) | 20 (35.1%) |
| College/Associate Degree | 13 (76.5%) | 4 (23.5%) |
| Bachelor's Degree or higher | 5 (13.2%) | 33 (86.8%) |
Occupancy by Age of Householder in Vinton
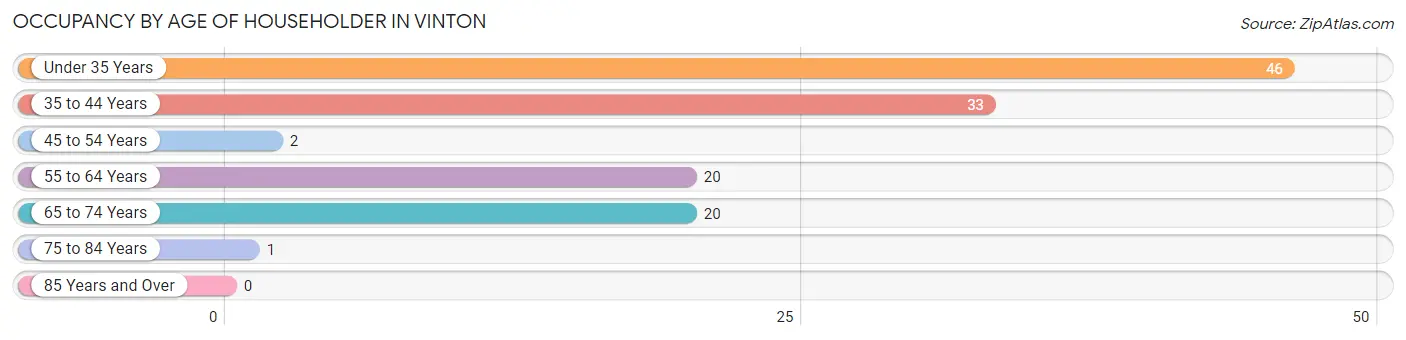
| Age Bracket | # Households | % Households |
| Under 35 Years | 46 | 37.7% |
| 35 to 44 Years | 33 | 27.1% |
| 45 to 54 Years | 2 | 1.6% |
| 55 to 64 Years | 20 | 16.4% |
| 65 to 74 Years | 20 | 16.4% |
| 75 to 84 Years | 1 | 0.8% |
| 85 Years and Over | 0 | 0.0% |
| Total | 122 | 100.0% |
Housing Finances in Vinton
Median Income by Occupancy in Vinton
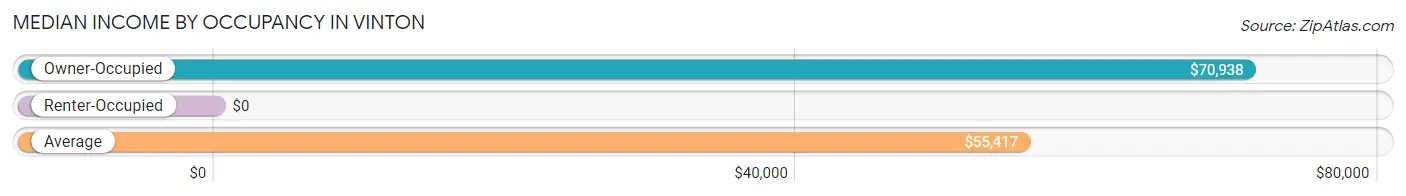
| Occupancy Type | # Households | Median Income |
| Owner-Occupied | 63 (51.6%) | $70,938 |
| Renter-Occupied | 59 (48.4%) | $0 |
| Average | 122 (100.0%) | $55,417 |
Occupancy by Householder Income Bracket in Vinton
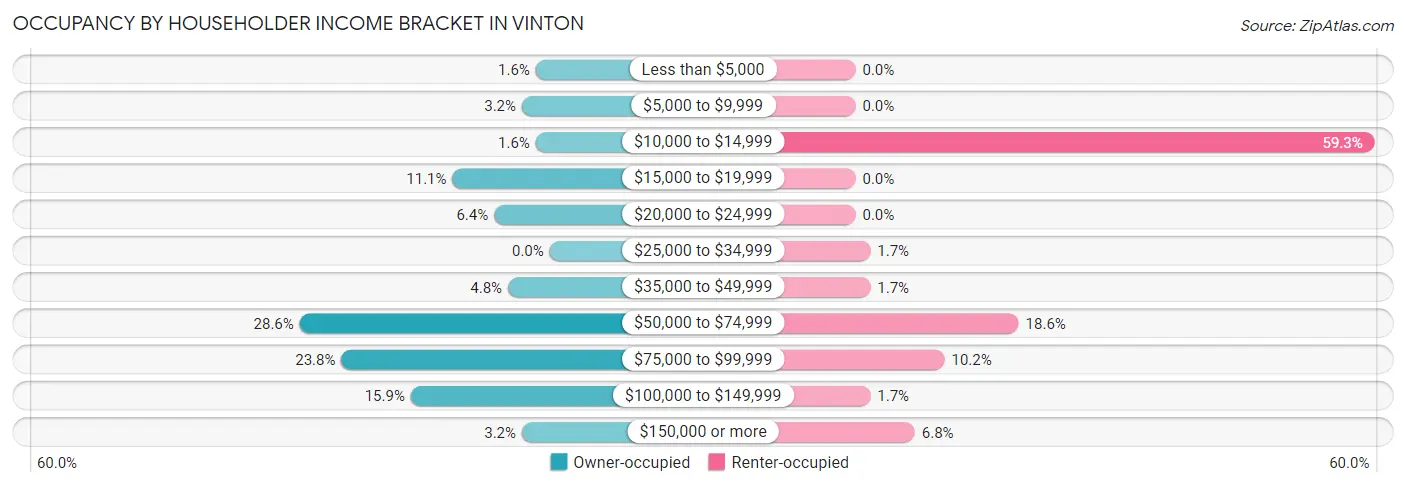
| Income Bracket | Owner-occupied | Renter-occupied |
| Less than $5,000 | 1 (1.6%) | 0 (0.0%) |
| $5,000 to $9,999 | 2 (3.2%) | 0 (0.0%) |
| $10,000 to $14,999 | 1 (1.6%) | 35 (59.3%) |
| $15,000 to $19,999 | 7 (11.1%) | 0 (0.0%) |
| $20,000 to $24,999 | 4 (6.4%) | 0 (0.0%) |
| $25,000 to $34,999 | 0 (0.0%) | 1 (1.7%) |
| $35,000 to $49,999 | 3 (4.8%) | 1 (1.7%) |
| $50,000 to $74,999 | 18 (28.6%) | 11 (18.6%) |
| $75,000 to $99,999 | 15 (23.8%) | 6 (10.2%) |
| $100,000 to $149,999 | 10 (15.9%) | 1 (1.7%) |
| $150,000 or more | 2 (3.2%) | 4 (6.8%) |
| Total | 63 (100.0%) | 59 (100.0%) |
Monthly Housing Cost Tiers in Vinton
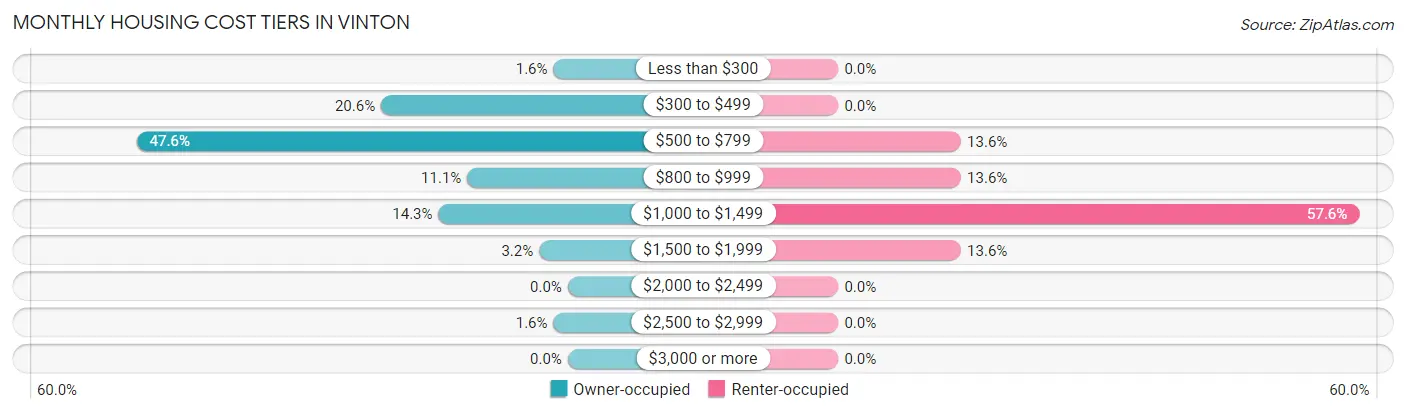
| Monthly Cost | Owner-occupied | Renter-occupied |
| Less than $300 | 1 (1.6%) | 0 (0.0%) |
| $300 to $499 | 13 (20.6%) | 0 (0.0%) |
| $500 to $799 | 30 (47.6%) | 8 (13.6%) |
| $800 to $999 | 7 (11.1%) | 8 (13.6%) |
| $1,000 to $1,499 | 9 (14.3%) | 34 (57.6%) |
| $1,500 to $1,999 | 2 (3.2%) | 8 (13.6%) |
| $2,000 to $2,499 | 0 (0.0%) | 0 (0.0%) |
| $2,500 to $2,999 | 1 (1.6%) | 0 (0.0%) |
| $3,000 or more | 0 (0.0%) | 0 (0.0%) |
| Total | 63 (100.0%) | 59 (100.0%) |
Physical Housing Characteristics in Vinton
Housing Structures in Vinton
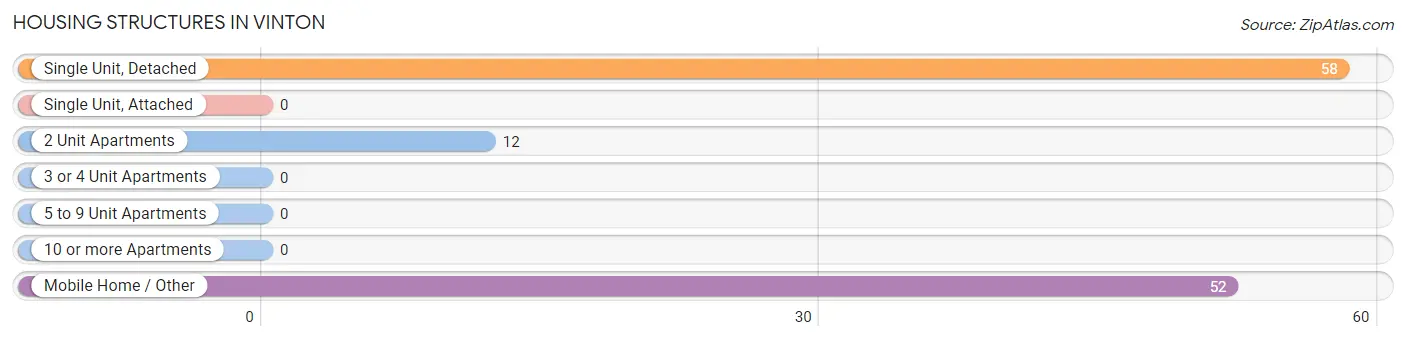
| Structure Type | # Housing Units | % Housing Units |
| Single Unit, Detached | 58 | 47.5% |
| Single Unit, Attached | 0 | 0.0% |
| 2 Unit Apartments | 12 | 9.8% |
| 3 or 4 Unit Apartments | 0 | 0.0% |
| 5 to 9 Unit Apartments | 0 | 0.0% |
| 10 or more Apartments | 0 | 0.0% |
| Mobile Home / Other | 52 | 42.6% |
| Total | 122 | 100.0% |
Housing Structures by Occupancy in Vinton
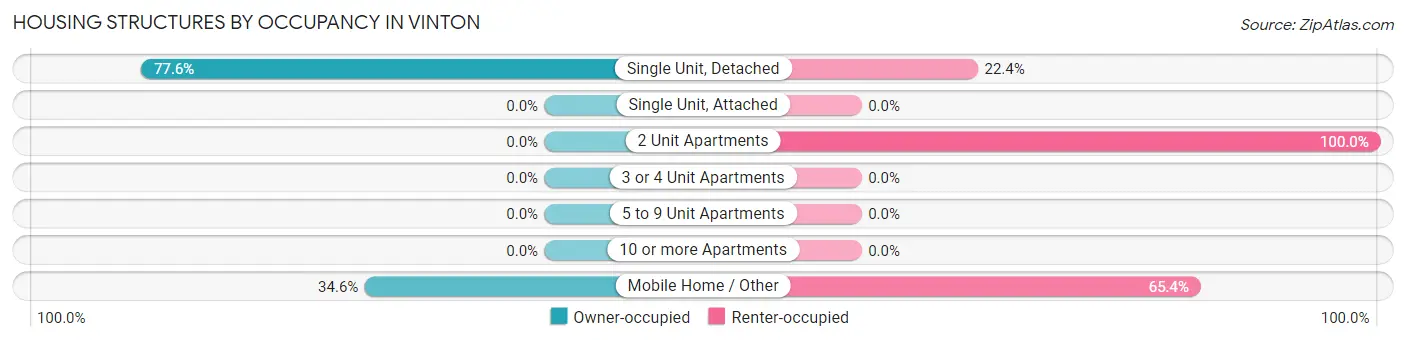
| Structure Type | Owner-occupied | Renter-occupied |
| Single Unit, Detached | 45 (77.6%) | 13 (22.4%) |
| Single Unit, Attached | 0 (0.0%) | 0 (0.0%) |
| 2 Unit Apartments | 0 (0.0%) | 12 (100.0%) |
| 3 or 4 Unit Apartments | 0 (0.0%) | 0 (0.0%) |
| 5 to 9 Unit Apartments | 0 (0.0%) | 0 (0.0%) |
| 10 or more Apartments | 0 (0.0%) | 0 (0.0%) |
| Mobile Home / Other | 18 (34.6%) | 34 (65.4%) |
| Total | 63 (51.6%) | 59 (48.4%) |
Housing Structures by Number of Rooms in Vinton
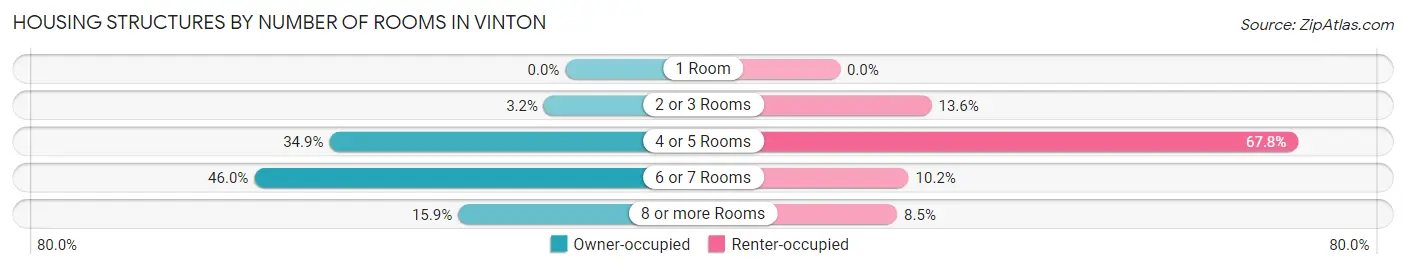
| Number of Rooms | Owner-occupied | Renter-occupied |
| 1 Room | 0 (0.0%) | 0 (0.0%) |
| 2 or 3 Rooms | 2 (3.2%) | 8 (13.6%) |
| 4 or 5 Rooms | 22 (34.9%) | 40 (67.8%) |
| 6 or 7 Rooms | 29 (46.0%) | 6 (10.2%) |
| 8 or more Rooms | 10 (15.9%) | 5 (8.5%) |
| Total | 63 (100.0%) | 59 (100.0%) |
Housing Structure by Heating Type in Vinton
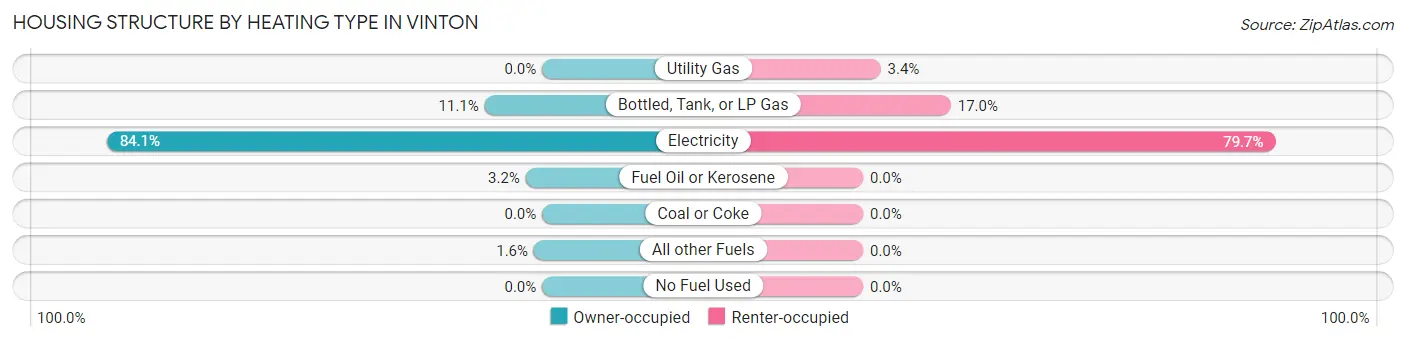
| Heating Type | Owner-occupied | Renter-occupied |
| Utility Gas | 0 (0.0%) | 2 (3.4%) |
| Bottled, Tank, or LP Gas | 7 (11.1%) | 10 (17.0%) |
| Electricity | 53 (84.1%) | 47 (79.7%) |
| Fuel Oil or Kerosene | 2 (3.2%) | 0 (0.0%) |
| Coal or Coke | 0 (0.0%) | 0 (0.0%) |
| All other Fuels | 1 (1.6%) | 0 (0.0%) |
| No Fuel Used | 0 (0.0%) | 0 (0.0%) |
| Total | 63 (100.0%) | 59 (100.0%) |
Household Vehicle Usage in Vinton
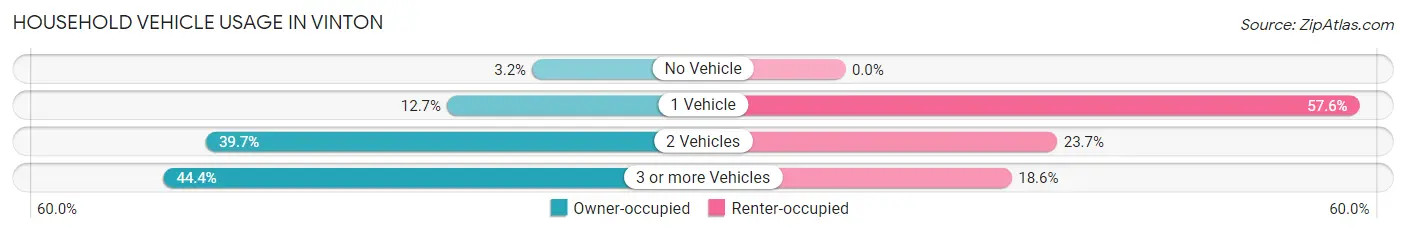
| Vehicles per Household | Owner-occupied | Renter-occupied |
| No Vehicle | 2 (3.2%) | 0 (0.0%) |
| 1 Vehicle | 8 (12.7%) | 34 (57.6%) |
| 2 Vehicles | 25 (39.7%) | 14 (23.7%) |
| 3 or more Vehicles | 28 (44.4%) | 11 (18.6%) |
| Total | 63 (100.0%) | 59 (100.0%) |
Real Estate & Mortgages in Vinton
Real Estate and Mortgage Overview in Vinton
| Characteristic | Without Mortgage | With Mortgage |
| Housing Units | 34 | 29 |
| Median Property Value | $98,000 | $85,400 |
| Median Household Income | $55,000 | $2 |
| Monthly Housing Costs | $533 | $0 |
| Real Estate Taxes | $1,067 | $4 |
Property Value by Mortgage Status in Vinton
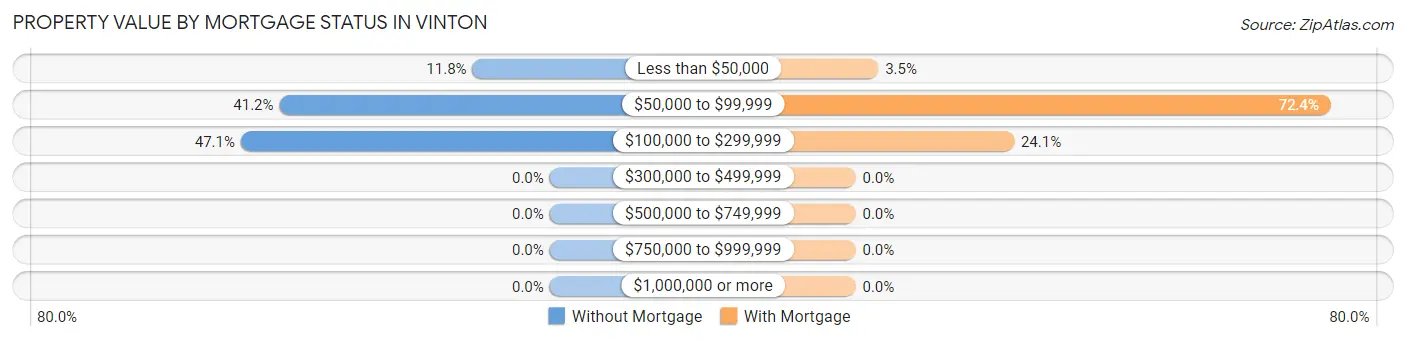
| Property Value | Without Mortgage | With Mortgage |
| Less than $50,000 | 4 (11.8%) | 1 (3.5%) |
| $50,000 to $99,999 | 14 (41.2%) | 21 (72.4%) |
| $100,000 to $299,999 | 16 (47.1%) | 7 (24.1%) |
| $300,000 to $499,999 | 0 (0.0%) | 0 (0.0%) |
| $500,000 to $749,999 | 0 (0.0%) | 0 (0.0%) |
| $750,000 to $999,999 | 0 (0.0%) | 0 (0.0%) |
| $1,000,000 or more | 0 (0.0%) | 0 (0.0%) |
| Total | 34 (100.0%) | 29 (100.0%) |
Household Income by Mortgage Status in Vinton
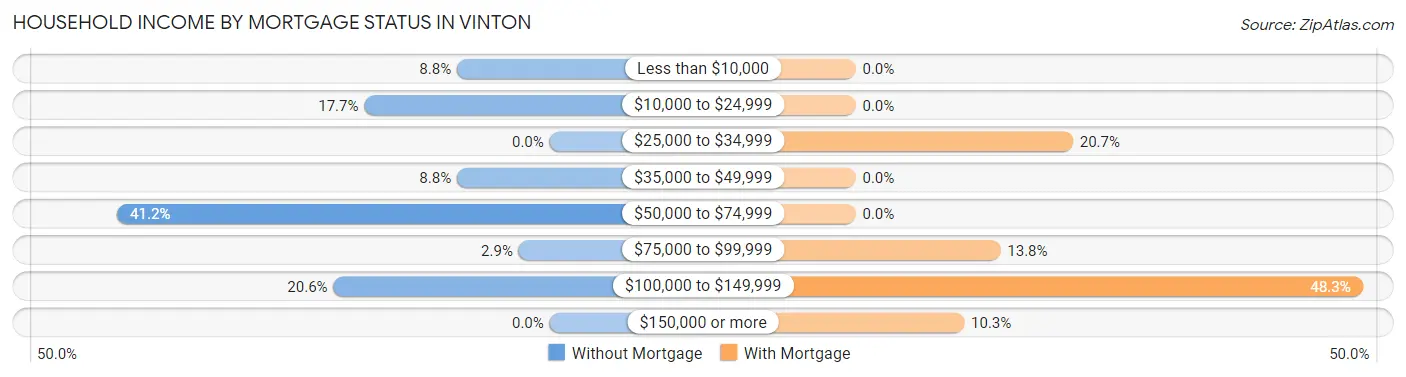
| Household Income | Without Mortgage | With Mortgage |
| Less than $10,000 | 3 (8.8%) | 0 (0.0%) |
| $10,000 to $24,999 | 6 (17.6%) | 0 (0.0%) |
| $25,000 to $34,999 | 0 (0.0%) | 6 (20.7%) |
| $35,000 to $49,999 | 3 (8.8%) | 0 (0.0%) |
| $50,000 to $74,999 | 14 (41.2%) | 0 (0.0%) |
| $75,000 to $99,999 | 1 (2.9%) | 4 (13.8%) |
| $100,000 to $149,999 | 7 (20.6%) | 14 (48.3%) |
| $150,000 or more | 0 (0.0%) | 3 (10.3%) |
| Total | 34 (100.0%) | 29 (100.0%) |
Property Value to Household Income Ratio in Vinton
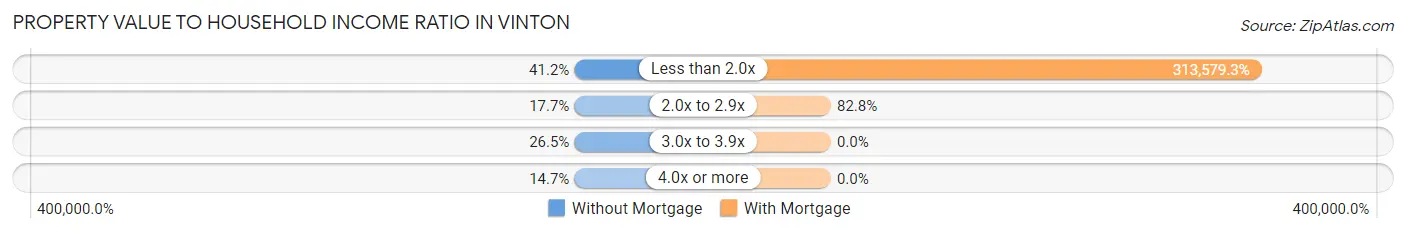
| Value-to-Income Ratio | Without Mortgage | With Mortgage |
| Less than 2.0x | 14 (41.2%) | 90,938 (313,579.3%) |
| 2.0x to 2.9x | 6 (17.6%) | 24 (82.8%) |
| 3.0x to 3.9x | 9 (26.5%) | 0 (0.0%) |
| 4.0x or more | 5 (14.7%) | 0 (0.0%) |
| Total | 34 (100.0%) | 29 (100.0%) |
Real Estate Taxes by Mortgage Status in Vinton
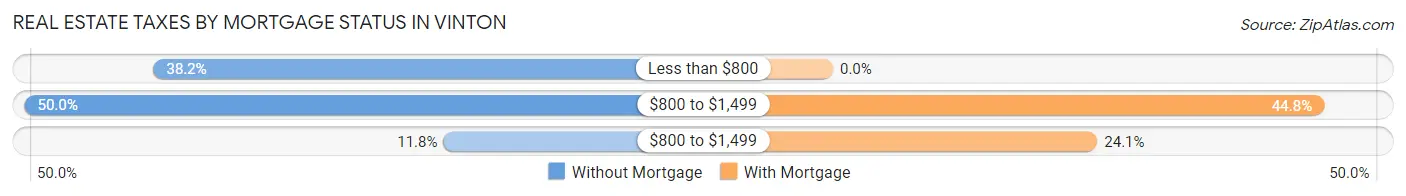
| Property Taxes | Without Mortgage | With Mortgage |
| Less than $800 | 13 (38.2%) | 0 (0.0%) |
| $800 to $1,499 | 17 (50.0%) | 13 (44.8%) |
| $800 to $1,499 | 4 (11.8%) | 7 (24.1%) |
| Total | 34 (100.0%) | 29 (100.0%) |
Health & Disability in Vinton
Health Insurance Coverage by Age in Vinton
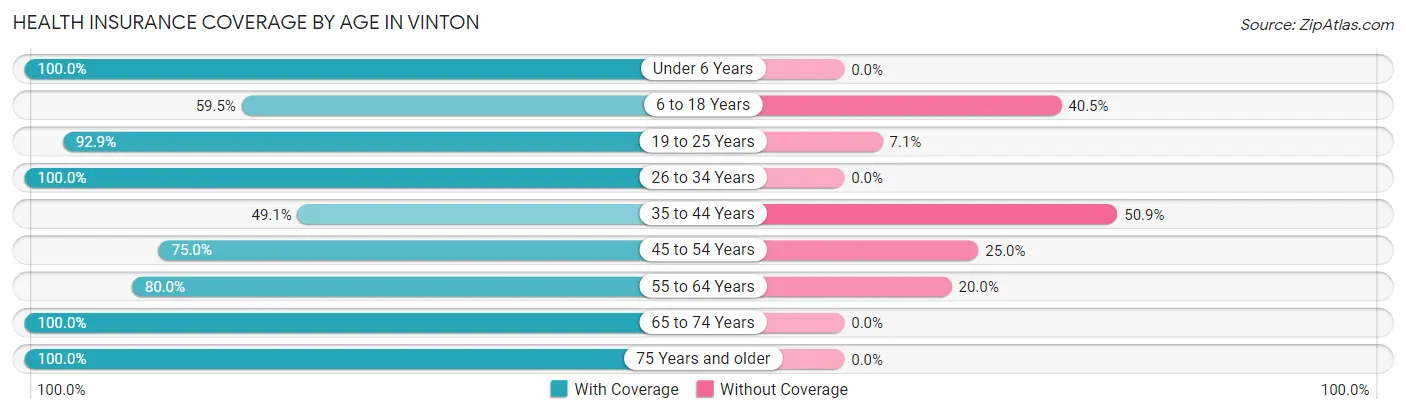
| Age Bracket | With Coverage | Without Coverage |
| Under 6 Years | 18 (100.0%) | 0 (0.0%) |
| 6 to 18 Years | 25 (59.5%) | 17 (40.5%) |
| 19 to 25 Years | 52 (92.9%) | 4 (7.1%) |
| 26 to 34 Years | 17 (100.0%) | 0 (0.0%) |
| 35 to 44 Years | 27 (49.1%) | 28 (50.9%) |
| 45 to 54 Years | 18 (75.0%) | 6 (25.0%) |
| 55 to 64 Years | 32 (80.0%) | 8 (20.0%) |
| 65 to 74 Years | 28 (100.0%) | 0 (0.0%) |
| 75 Years and older | 8 (100.0%) | 0 (0.0%) |
| Total | 225 (78.1%) | 63 (21.9%) |
Health Insurance Coverage by Citizenship Status in Vinton
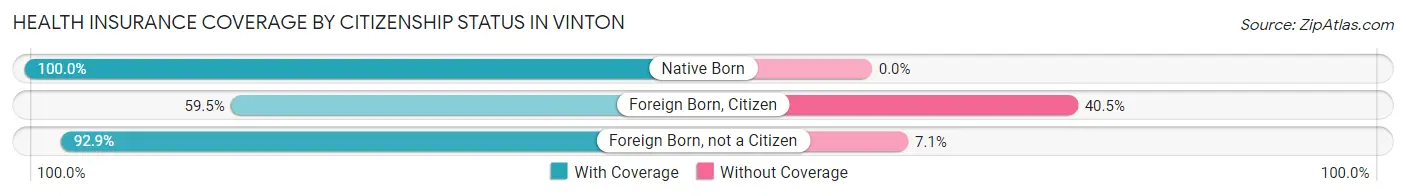
| Citizenship Status | With Coverage | Without Coverage |
| Native Born | 18 (100.0%) | 0 (0.0%) |
| Foreign Born, Citizen | 25 (59.5%) | 17 (40.5%) |
| Foreign Born, not a Citizen | 52 (92.9%) | 4 (7.1%) |
Health Insurance Coverage by Household Income in Vinton
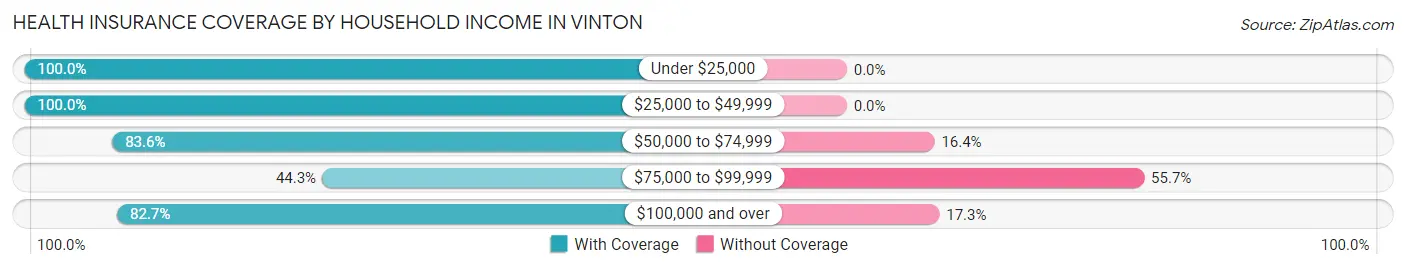
| Household Income | With Coverage | Without Coverage |
| Under $25,000 | 59 (100.0%) | 0 (0.0%) |
| $25,000 to $49,999 | 17 (100.0%) | 0 (0.0%) |
| $50,000 to $74,999 | 56 (83.6%) | 11 (16.4%) |
| $75,000 to $99,999 | 31 (44.3%) | 39 (55.7%) |
| $100,000 and over | 62 (82.7%) | 13 (17.3%) |
Public vs Private Health Insurance Coverage by Age in Vinton
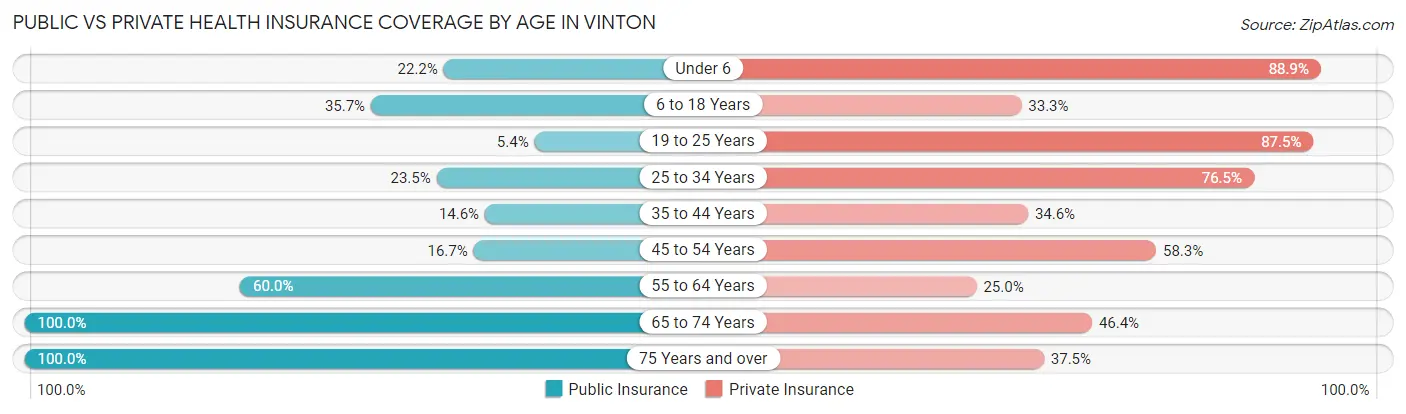
| Age Bracket | Public Insurance | Private Insurance |
| Under 6 | 4 (22.2%) | 16 (88.9%) |
| 6 to 18 Years | 15 (35.7%) | 14 (33.3%) |
| 19 to 25 Years | 3 (5.4%) | 49 (87.5%) |
| 25 to 34 Years | 4 (23.5%) | 13 (76.5%) |
| 35 to 44 Years | 8 (14.5%) | 19 (34.5%) |
| 45 to 54 Years | 4 (16.7%) | 14 (58.3%) |
| 55 to 64 Years | 24 (60.0%) | 10 (25.0%) |
| 65 to 74 Years | 28 (100.0%) | 13 (46.4%) |
| 75 Years and over | 8 (100.0%) | 3 (37.5%) |
| Total | 98 (34.0%) | 151 (52.4%) |
Disability Status by Sex by Age in Vinton
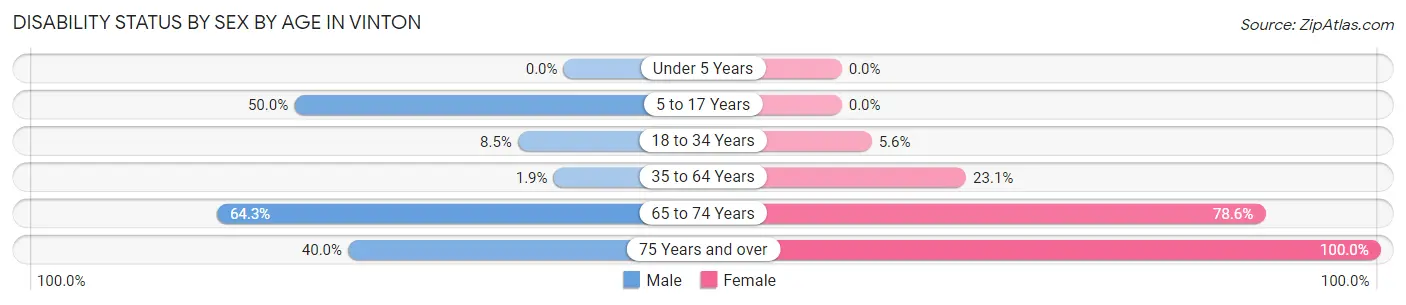
| Age Bracket | Male | Female |
| Under 5 Years | 0 (0.0%) | 0 (0.0%) |
| 5 to 17 Years | 2 (50.0%) | 0 (0.0%) |
| 18 to 34 Years | 5 (8.5%) | 1 (5.6%) |
| 35 to 64 Years | 1 (1.8%) | 15 (23.1%) |
| 65 to 74 Years | 9 (64.3%) | 11 (78.6%) |
| 75 Years and over | 2 (40.0%) | 3 (100.0%) |
Disability Class by Sex by Age in Vinton
Disability Class: Hearing Difficulty
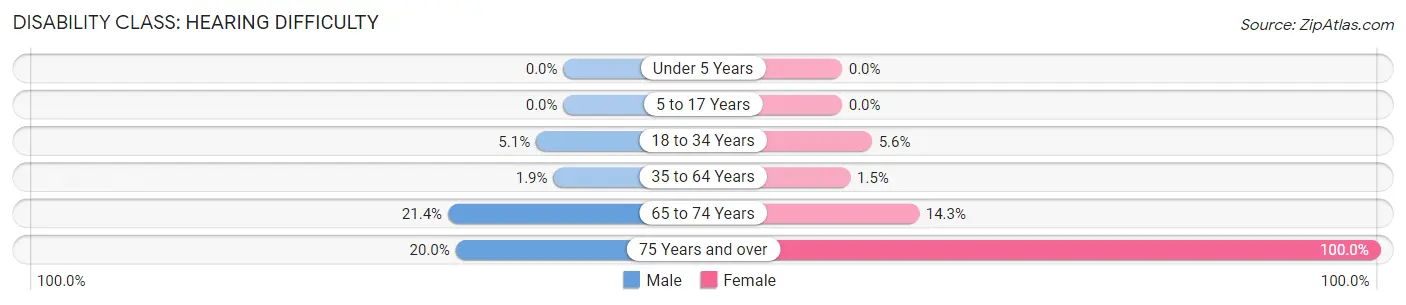
| Age Bracket | Male | Female |
| Under 5 Years | 0 (0.0%) | 0 (0.0%) |
| 5 to 17 Years | 0 (0.0%) | 0 (0.0%) |
| 18 to 34 Years | 3 (5.1%) | 1 (5.6%) |
| 35 to 64 Years | 1 (1.8%) | 1 (1.5%) |
| 65 to 74 Years | 3 (21.4%) | 2 (14.3%) |
| 75 Years and over | 1 (20.0%) | 3 (100.0%) |
Disability Class: Vision Difficulty
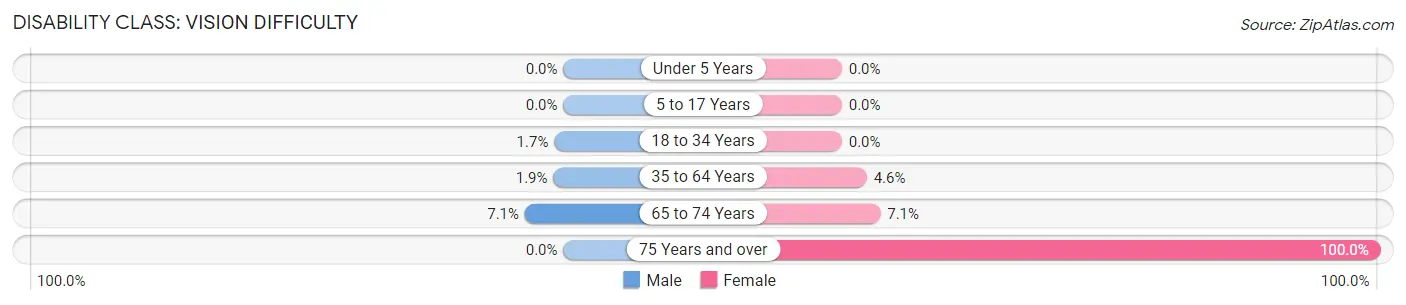
| Age Bracket | Male | Female |
| Under 5 Years | 0 (0.0%) | 0 (0.0%) |
| 5 to 17 Years | 0 (0.0%) | 0 (0.0%) |
| 18 to 34 Years | 1 (1.7%) | 0 (0.0%) |
| 35 to 64 Years | 1 (1.8%) | 3 (4.6%) |
| 65 to 74 Years | 1 (7.1%) | 1 (7.1%) |
| 75 Years and over | 0 (0.0%) | 3 (100.0%) |
Disability Class: Cognitive Difficulty
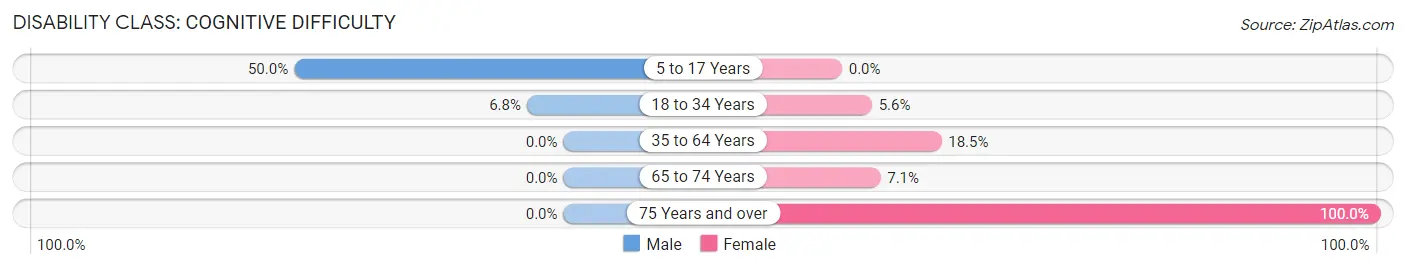
| Age Bracket | Male | Female |
| 5 to 17 Years | 2 (50.0%) | 0 (0.0%) |
| 18 to 34 Years | 4 (6.8%) | 1 (5.6%) |
| 35 to 64 Years | 0 (0.0%) | 12 (18.5%) |
| 65 to 74 Years | 0 (0.0%) | 1 (7.1%) |
| 75 Years and over | 0 (0.0%) | 3 (100.0%) |
Disability Class: Ambulatory Difficulty
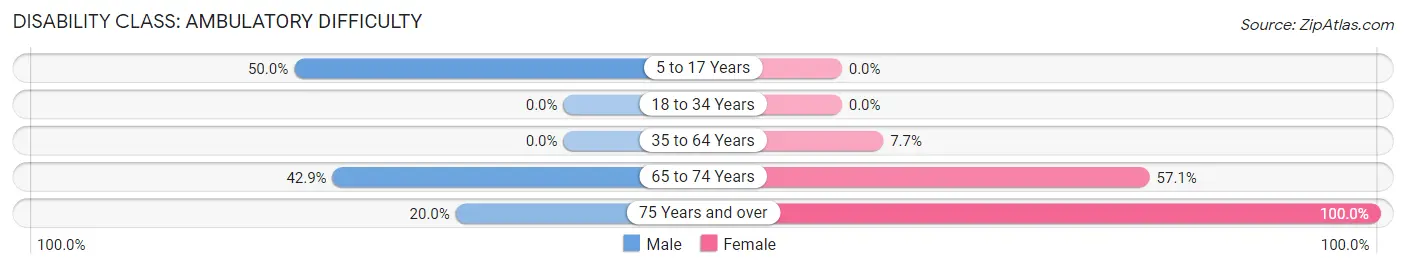
| Age Bracket | Male | Female |
| 5 to 17 Years | 2 (50.0%) | 0 (0.0%) |
| 18 to 34 Years | 0 (0.0%) | 0 (0.0%) |
| 35 to 64 Years | 0 (0.0%) | 5 (7.7%) |
| 65 to 74 Years | 6 (42.9%) | 8 (57.1%) |
| 75 Years and over | 1 (20.0%) | 3 (100.0%) |
Disability Class: Self-Care Difficulty
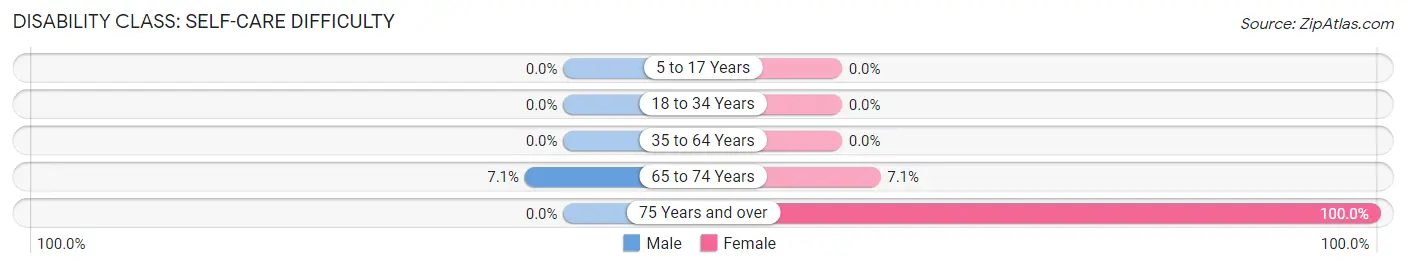
| Age Bracket | Male | Female |
| 5 to 17 Years | 0 (0.0%) | 0 (0.0%) |
| 18 to 34 Years | 0 (0.0%) | 0 (0.0%) |
| 35 to 64 Years | 0 (0.0%) | 0 (0.0%) |
| 65 to 74 Years | 1 (7.1%) | 1 (7.1%) |
| 75 Years and over | 0 (0.0%) | 3 (100.0%) |
Technology Access in Vinton
Computing Device Access in Vinton
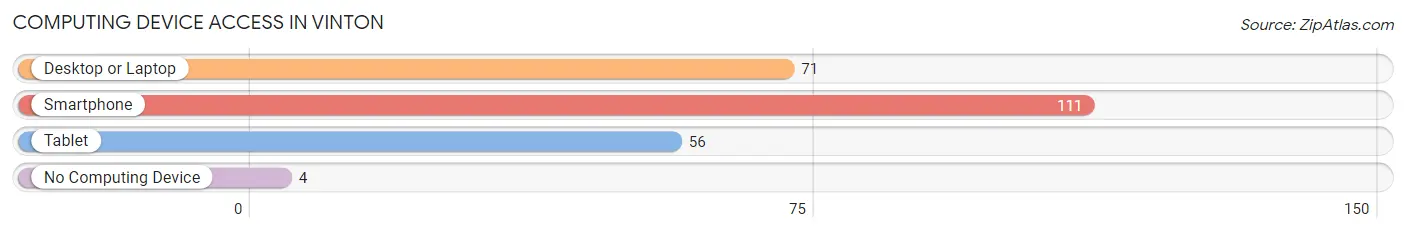
| Device Type | # Households | % Households |
| Desktop or Laptop | 71 | 58.2% |
| Smartphone | 111 | 91.0% |
| Tablet | 56 | 45.9% |
| No Computing Device | 4 | 3.3% |
| Total | 122 | 100.0% |
Internet Access in Vinton
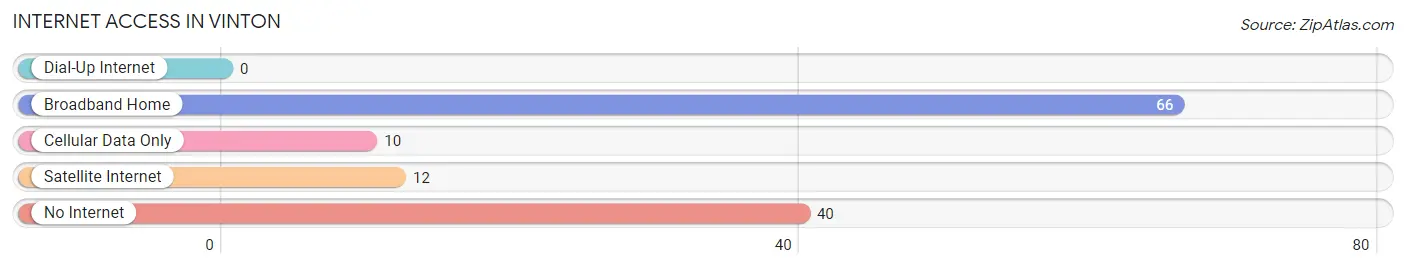
| Internet Type | # Households | % Households |
| Dial-Up Internet | 0 | 0.0% |
| Broadband Home | 66 | 54.1% |
| Cellular Data Only | 10 | 8.2% |
| Satellite Internet | 12 | 9.8% |
| No Internet | 40 | 32.8% |
| Total | 122 | 100.0% |
Vinton Summary
Vinton, Ohio is a small village located in Gallia County, Ohio. It is situated on the Ohio River, approximately 30 miles south of the state capital of Columbus. The village has a population of approximately 1,000 people and is part of the Point Pleasant Micropolitan Statistical Area.
History
Vinton was founded in 1817 by William Vinton, a Revolutionary War veteran. The village was originally known as Vintonville, but the name was changed to Vinton in 1820. The village was incorporated in 1837.
Vinton was a major port on the Ohio River during the 19th century. It was a major stop for steamboats traveling up and down the river. The village was also a major center for the production of salt, which was mined from nearby salt springs.
Geography
Vinton is located in southeastern Ohio, approximately 30 miles south of the state capital of Columbus. The village is situated on the Ohio River, which forms the western boundary of the village. The village is located in a rural area, with the nearest major city being Huntington, West Virginia, which is approximately 25 miles to the east.
The village has a total area of 0.7 square miles, all of which is land. The terrain is mostly flat, with some rolling hills in the surrounding area.
Economy
The economy of Vinton is largely based on agriculture and tourism. The village is home to several small businesses, including a grocery store, a hardware store, and a few restaurants. The village also has a small marina, which is popular with boaters and fishermen.
The village is also home to a number of small manufacturing companies, including a plastics manufacturer and a metal fabrication company.
Demographics
As of the 2010 census, the population of Vinton was 1,000. The racial makeup of the village was 97.2% White, 0.7% African American, 0.2% Native American, 0.2% Asian, 0.2% from other races, and 1.7% from two or more races. Hispanic or Latino of any race were 0.7% of the population.
The median income for a household in the village was $31,250, and the median income for a family was $37,500. The per capita income for the village was $15,945. About 11.2% of families and 14.2% of the population were below the poverty line, including 18.2% of those under age 18 and 8.3% of those age 65 or over.
Conclusion
Vinton, Ohio is a small village located in Gallia County, Ohio. It is situated on the Ohio River, approximately 30 miles south of the state capital of Columbus. The village has a population of approximately 1,000 people and is part of the Point Pleasant Micropolitan Statistical Area. The economy of Vinton is largely based on agriculture and tourism, and the village is home to several small businesses. The racial makeup of the village is predominantly White, with a small percentage of African American, Native American, and Asian residents. The median income for a household in the village is $31,250, and the per capita income for the village is $15,945.
Common Questions
What is the Total Population of Vinton?
Total Population of Vinton is 288.
What is the Total Male Population of Vinton?
Total Male Population of Vinton is 150.
What is the Total Female Population of Vinton?
Total Female Population of Vinton is 138.
What is the Ratio of Males per 100 Females in Vinton?
There are 108.70 Males per 100 Females in Vinton.
What is the Ratio of Females per 100 Males in Vinton?
There are 92.00 Females per 100 Males in Vinton.
What is the Median Population Age in Vinton?
Median Population Age in Vinton is 35.9 Years.
What is the Average Family Size in Vinton
Average Family Size in Vinton is 3.1 People.
What is the Average Household Size in Vinton
Average Household Size in Vinton is 2.4 People.
What is Per Capita Income in Vinton?
Per Capita income in Vinton is $25,741.
What is the Median Family Income in Vinton?
Median Family Income in Vinton is $74,375.
What is the Median Household income in Vinton?
Median Household Income in Vinton is $55,417.
What is Family Income Deficit in Vinton?
Family Income Deficit in Vinton is $7,500.
Families that are below poverty line in Vinton earn $7,500 less on average than the poverty threshold level.
What is Inequality or Gini Index in Vinton?
Inequality or Gini Index in Vinton is 0.46.
How Large is the Labor Force in Vinton?
There are 162 People in the Labor Forcein in Vinton.
What is the Percentage of People in the Labor Force in Vinton?
68.1% of People are in the Labor Force in Vinton.
What is the Unemployment Rate in Vinton?
Unemployment Rate in Vinton is 23.5%.