West Jefferson, OH
West Jefferson Map
West Jefferson Overview
4,186
TOTAL POPULATION
1,937
MALE POPULATION
2,249
FEMALE POPULATION
86.13
MALES / 100 FEMALES
116.11
FEMALES / 100 MALES
46.6
MEDIAN AGE
3.0
AVG FAMILY SIZE
2.5
AVG HOUSEHOLD SIZE
$31,577
PER CAPITA INCOME
$77,591
AVG FAMILY INCOME
$63,750
AVG HOUSEHOLD INCOME
30.6%
WAGE / INCOME GAP [ % ]
69.4¢/ $1
WAGE / INCOME GAP [ $ ]
0.37
INEQUALITY / GINI INDEX
2,356
LABOR FORCE [ PEOPLE ]
65.2%
PERCENT IN LABOR FORCE
2.2%
UNEMPLOYMENT RATE
West Jefferson Zip Codes
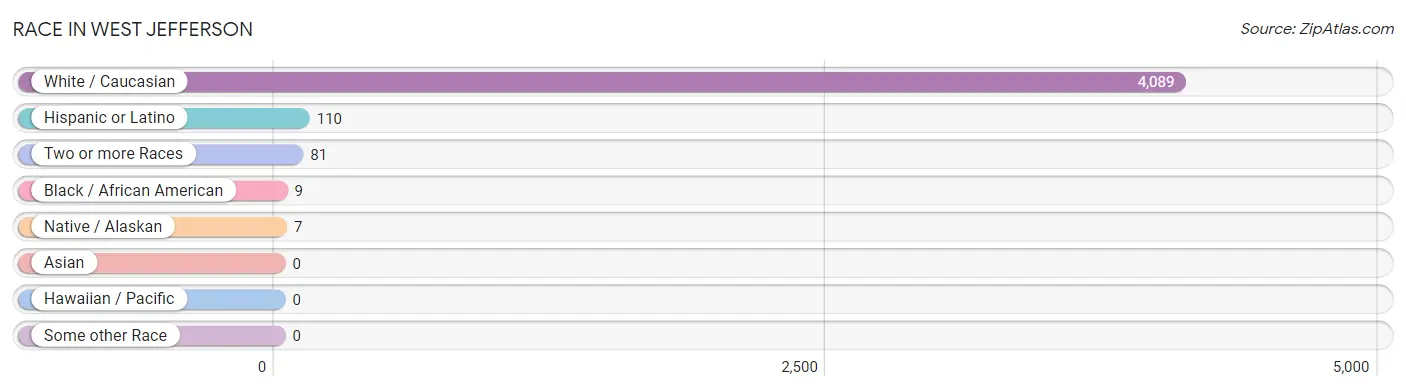
Race in West Jefferson
The most populous races in West Jefferson are White / Caucasian (4,089 | 97.7%), Hispanic or Latino (110 | 2.6%), and Two or more Races (81 | 1.9%).
| Race | # Population | % Population |
| Asian | 0 | 0.0% |
| Black / African American | 9 | 0.2% |
| Hawaiian / Pacific | 0 | 0.0% |
| Hispanic or Latino | 110 | 2.6% |
| Native / Alaskan | 7 | 0.2% |
| White / Caucasian | 4,089 | 97.7% |
| Two or more Races | 81 | 1.9% |
| Some other Race | 0 | 0.0% |
| Total | 4,186 | 100.0% |
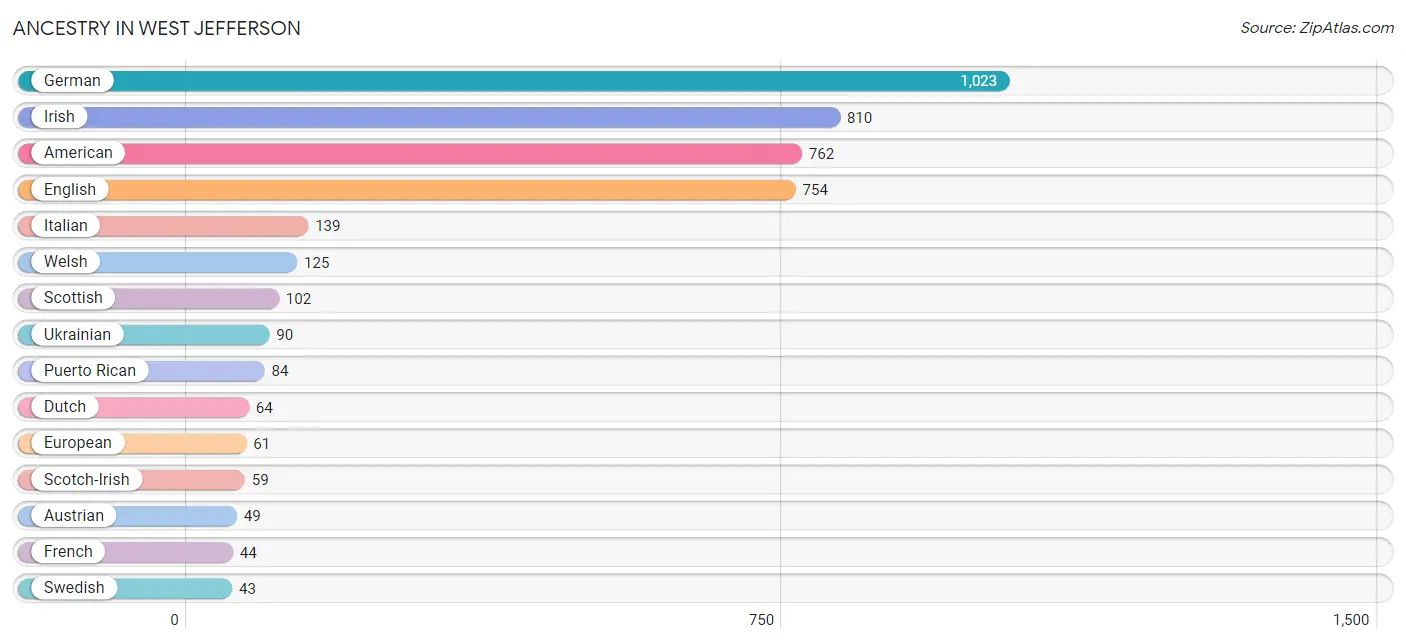
Ancestry in West Jefferson
The most populous ancestries reported in West Jefferson are German (1,023 | 24.4%), Irish (810 | 19.4%), American (762 | 18.2%), English (754 | 18.0%), and Italian (139 | 3.3%), together accounting for 83.3% of all West Jefferson residents.
| Ancestry | # Population | % Population |
| African | 34 | 0.8% |
| American | 762 | 18.2% |
| Arab | 25 | 0.6% |
| Austrian | 49 | 1.2% |
| British | 27 | 0.6% |
| Cherokee | 8 | 0.2% |
| Cuban | 6 | 0.1% |
| Dutch | 64 | 1.5% |
| English | 754 | 18.0% |
| European | 61 | 1.5% |
| French | 44 | 1.1% |
| French Canadian | 16 | 0.4% |
| German | 1,023 | 24.4% |
| Hungarian | 7 | 0.2% |
| Irish | 810 | 19.4% |
| Italian | 139 | 3.3% |
| Mexican | 20 | 0.5% |
| Northern European | 27 | 0.6% |
| Norwegian | 11 | 0.3% |
| Pennsylvania German | 10 | 0.2% |
| Polish | 39 | 0.9% |
| Puerto Rican | 84 | 2.0% |
| Scandinavian | 8 | 0.2% |
| Scotch-Irish | 59 | 1.4% |
| Scottish | 102 | 2.4% |
| Slavic | 5 | 0.1% |
| Subsaharan African | 34 | 0.8% |
| Swedish | 43 | 1.0% |
| Syrian | 25 | 0.6% |
| Ukrainian | 90 | 2.1% |
| Welsh | 125 | 3.0% | View All 31 Rows |
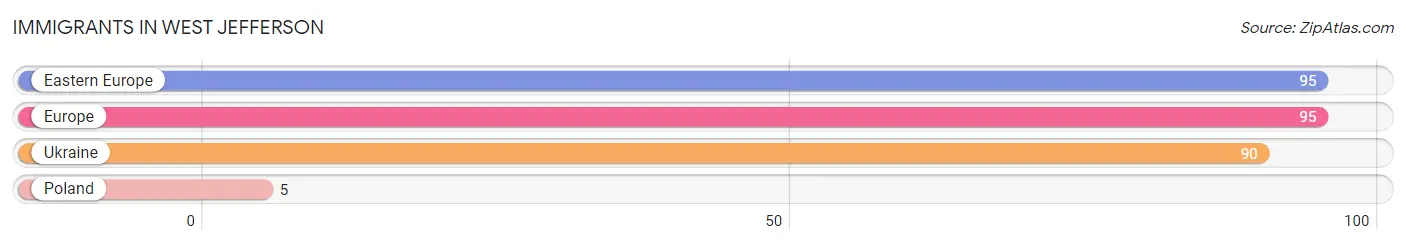
Immigrants in West Jefferson
The most numerous immigrant groups reported in West Jefferson came from Eastern Europe (95 | 2.3%), Europe (95 | 2.3%), Ukraine (90 | 2.1%), and Poland (5 | 0.1%), together accounting for 6.8% of all West Jefferson residents.
| Immigration Origin | # Population | % Population |
| Eastern Europe | 95 | 2.3% |
| Europe | 95 | 2.3% |
| Poland | 5 | 0.1% |
| Ukraine | 90 | 2.1% | View All 4 Rows |
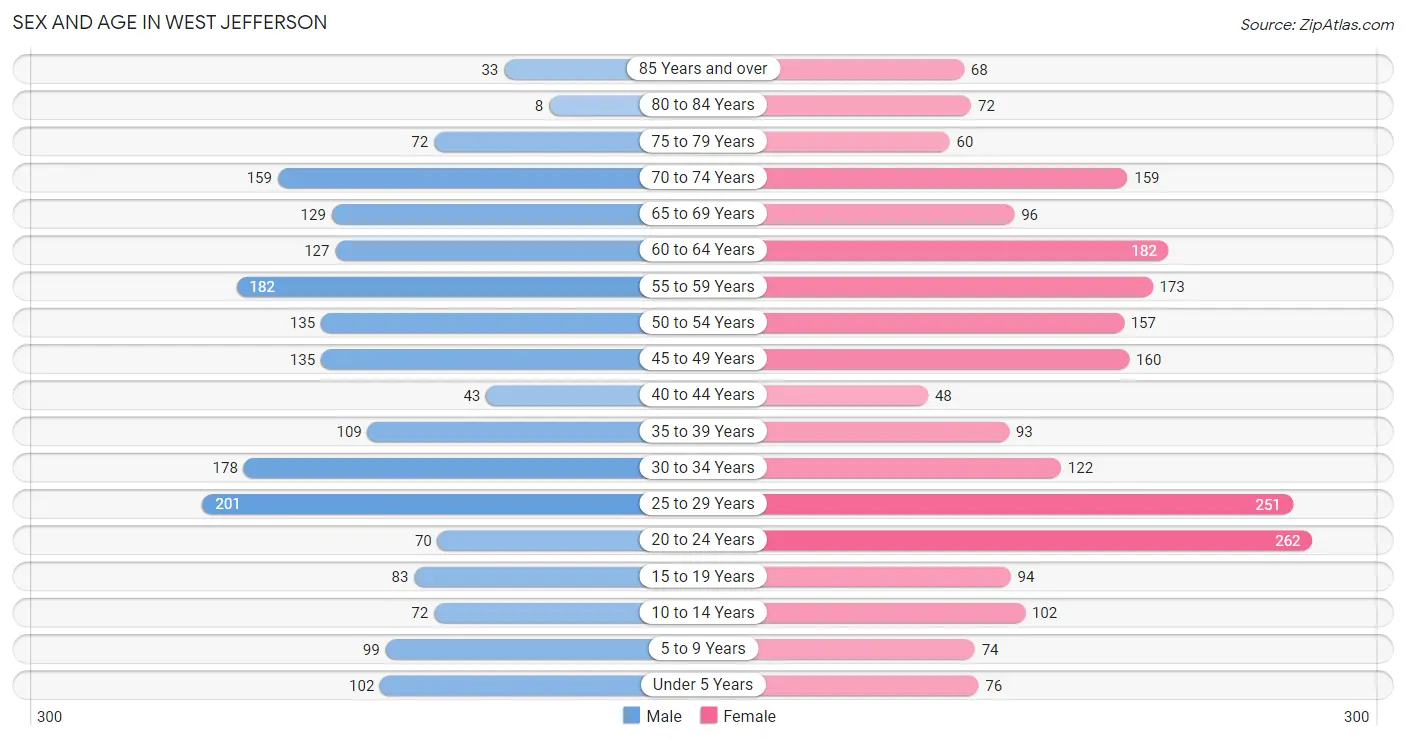
Sex and Age in West Jefferson
Sex and Age in West Jefferson
The most populous age groups in West Jefferson are 25 to 29 Years (201 | 10.4%) for men and 20 to 24 Years (262 | 11.7%) for women.
| Age Bracket | Male | Female |
| Under 5 Years | 102 (5.3%) | 76 (3.4%) |
| 5 to 9 Years | 99 (5.1%) | 74 (3.3%) |
| 10 to 14 Years | 72 (3.7%) | 102 (4.5%) |
| 15 to 19 Years | 83 (4.3%) | 94 (4.2%) |
| 20 to 24 Years | 70 (3.6%) | 262 (11.7%) |
| 25 to 29 Years | 201 (10.4%) | 251 (11.2%) |
| 30 to 34 Years | 178 (9.2%) | 122 (5.4%) |
| 35 to 39 Years | 109 (5.6%) | 93 (4.1%) |
| 40 to 44 Years | 43 (2.2%) | 48 (2.1%) |
| 45 to 49 Years | 135 (7.0%) | 160 (7.1%) |
| 50 to 54 Years | 135 (7.0%) | 157 (7.0%) |
| 55 to 59 Years | 182 (9.4%) | 173 (7.7%) |
| 60 to 64 Years | 127 (6.6%) | 182 (8.1%) |
| 65 to 69 Years | 129 (6.7%) | 96 (4.3%) |
| 70 to 74 Years | 159 (8.2%) | 159 (7.1%) |
| 75 to 79 Years | 72 (3.7%) | 60 (2.7%) |
| 80 to 84 Years | 8 (0.4%) | 72 (3.2%) |
| 85 Years and over | 33 (1.7%) | 68 (3.0%) |
| Total | 1,937 (100.0%) | 2,249 (100.0%) |
Families and Households in West Jefferson
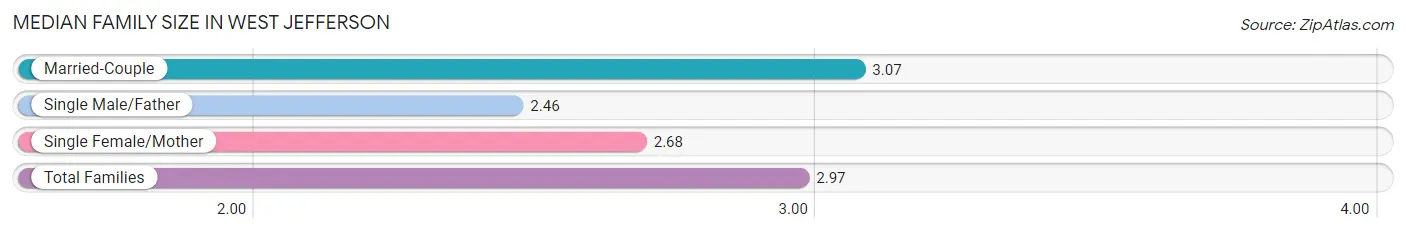
Median Family Size in West Jefferson
The median family size in West Jefferson is 2.97 persons per family, with married-couple families (847 | 76.8%) accounting for the largest median family size of 3.07 persons per family. On the other hand, single male/father families (57 | 5.2%) represent the smallest median family size with 2.46 persons per family.
| Family Type | # Families | Family Size |
| Married-Couple | 847 (76.8%) | 3.07 |
| Single Male/Father | 57 (5.2%) | 2.46 |
| Single Female/Mother | 199 (18.0%) | 2.68 |
| Total Families | 1,103 (100.0%) | 2.97 |
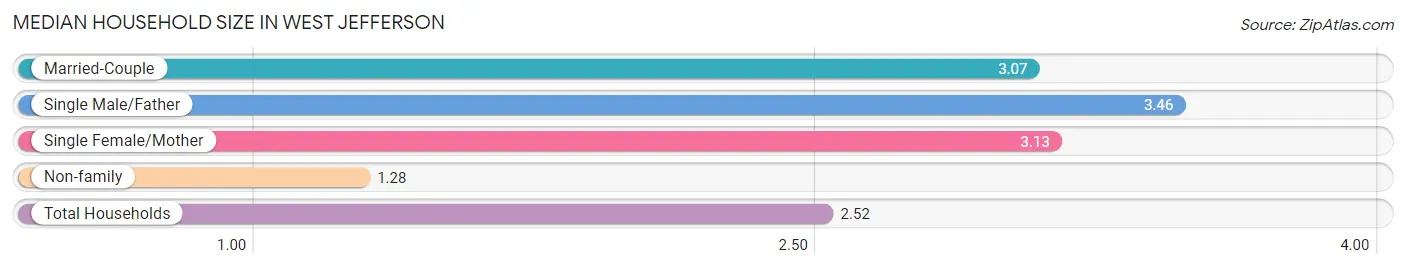
Median Household Size in West Jefferson
The median household size in West Jefferson is 2.52 persons per household, with single male/father households (57 | 3.5%) accounting for the largest median household size of 3.46 persons per household. non-family households (523 | 32.2%) represent the smallest median household size with 1.28 persons per household.
| Household Type | # Households | Household Size |
| Married-Couple | 847 (52.1%) | 3.07 |
| Single Male/Father | 57 (3.5%) | 3.46 |
| Single Female/Mother | 199 (12.2%) | 3.13 |
| Non-family | 523 (32.2%) | 1.28 |
| Total Households | 1,626 (100.0%) | 2.52 |
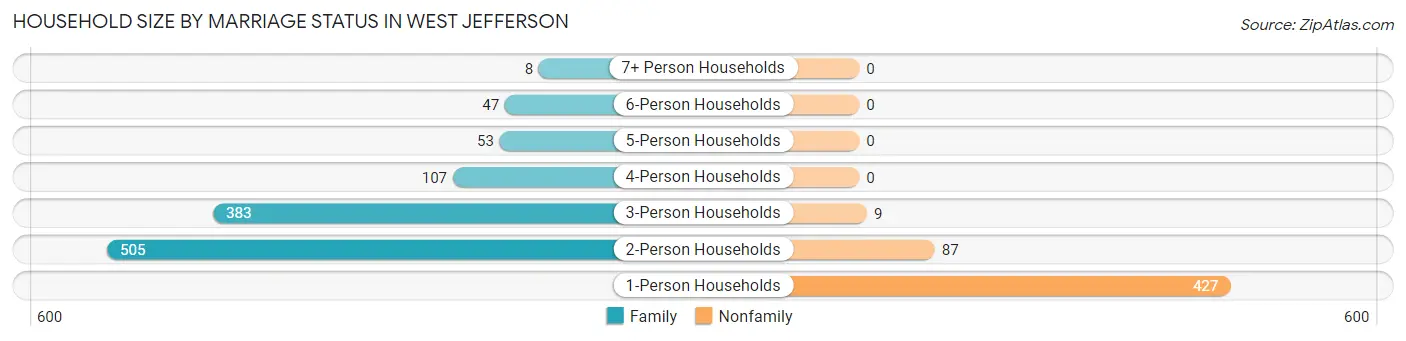
Household Size by Marriage Status in West Jefferson
Out of a total of 1,626 households in West Jefferson, 1,103 (67.8%) are family households, while 523 (32.2%) are nonfamily households. The most numerous type of family households are 2-person households, comprising 505, and the most common type of nonfamily households are 1-person households, comprising 427.
| Household Size | Family Households | Nonfamily Households |
| 1-Person Households | - | 427 (26.3%) |
| 2-Person Households | 505 (31.1%) | 87 (5.3%) |
| 3-Person Households | 383 (23.5%) | 9 (0.5%) |
| 4-Person Households | 107 (6.6%) | 0 (0.0%) |
| 5-Person Households | 53 (3.3%) | 0 (0.0%) |
| 6-Person Households | 47 (2.9%) | 0 (0.0%) |
| 7+ Person Households | 8 (0.5%) | 0 (0.0%) |
| Total | 1,103 (67.8%) | 523 (32.2%) |
Female Fertility in West Jefferson
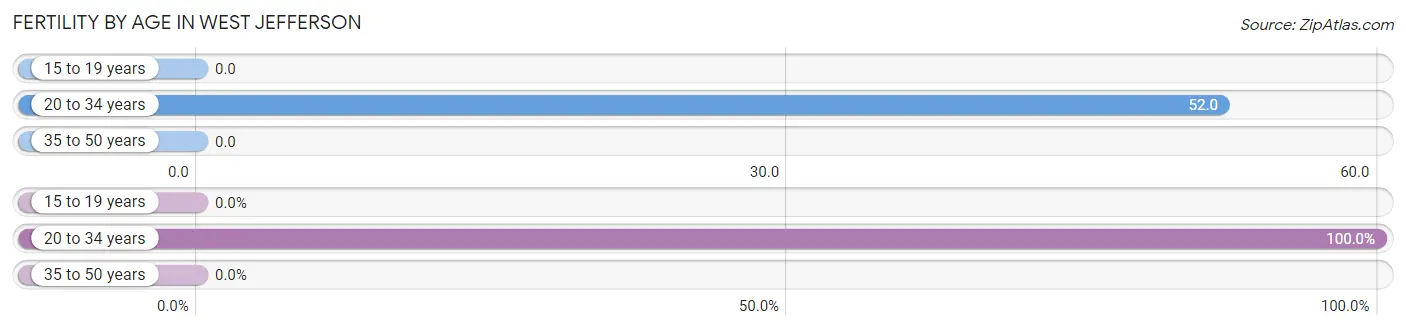
Fertility by Age in West Jefferson
Average fertility rate in West Jefferson is 30.0 births per 1,000 women. Women in the age bracket of 20 to 34 years have the highest fertility rate with 52.0 births per 1,000 women. Women in the age bracket of 20 to 34 years acount for 100.0% of all women with births.
| Age Bracket | Women with Births | Births / 1,000 Women |
| 15 to 19 years | 0 (0.0%) | 0.0 |
| 20 to 34 years | 33 (100.0%) | 52.0 |
| 35 to 50 years | 0 (0.0%) | 0.0 |
| Total | 33 (100.0%) | 30.0 |
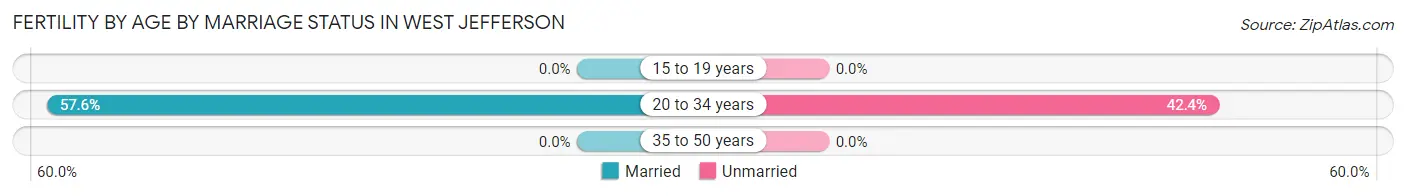
Fertility by Age by Marriage Status in West Jefferson
57.6% of women with births (33) in West Jefferson are married. The highest percentage of unmarried women with births falls into 20 to 34 years age bracket with 42.4% of them unmarried at the time of birth, while the lowest percentage of unmarried women with births belong to 20 to 34 years age bracket with 42.4% of them unmarried.
| Age Bracket | Married | Unmarried |
| 15 to 19 years | 0 (0.0%) | 0 (0.0%) |
| 20 to 34 years | 19 (57.6%) | 14 (42.4%) |
| 35 to 50 years | 0 (0.0%) | 0 (0.0%) |
| Total | 19 (57.6%) | 14 (42.4%) |
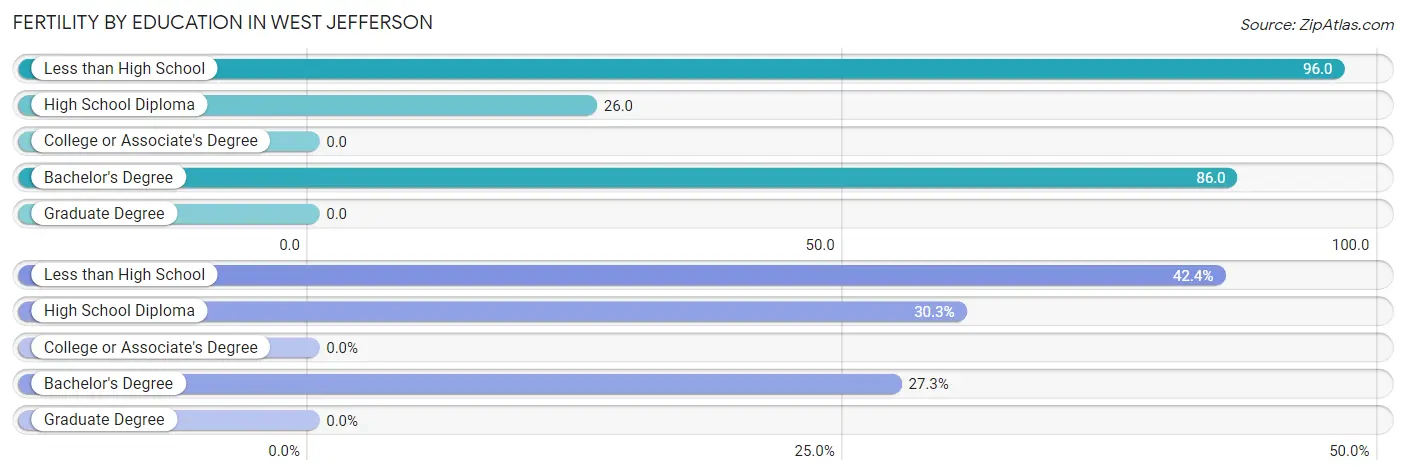
Fertility by Education in West Jefferson
| Educational Attainment | Women with Births | Births / 1,000 Women |
| Less than High School | 14 (42.4%) | 96.0 |
| High School Diploma | 10 (30.3%) | 26.0 |
| College or Associate's Degree | 0 (0.0%) | 0.0 |
| Bachelor's Degree | 9 (27.3%) | 86.0 |
| Graduate Degree | 0 (0.0%) | 0.0 |
| Total | 33 (100.0%) | 30.0 |
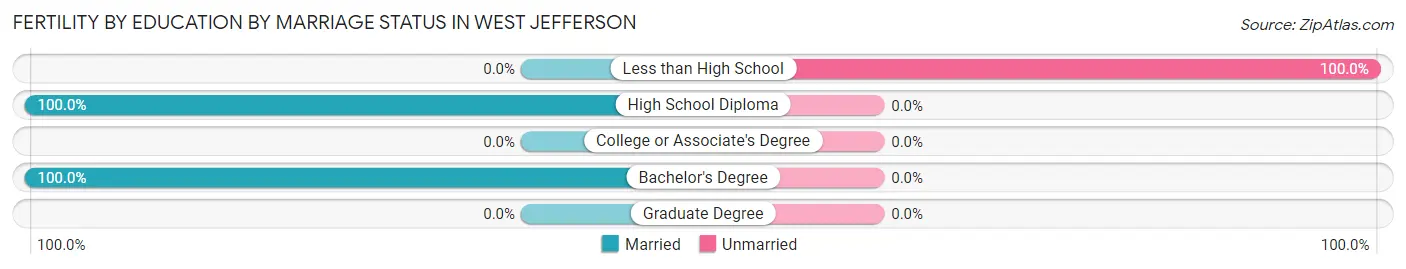
Fertility by Education by Marriage Status in West Jefferson
42.4% of women with births in West Jefferson are unmarried. Women with the educational attainment of high school diploma are most likely to be married with 100.0% of them married at childbirth, while women with the educational attainment of less than high school are least likely to be married with 100.0% of them unmarried at childbirth.
| Educational Attainment | Married | Unmarried |
| Less than High School | 0 (0.0%) | 14 (100.0%) |
| High School Diploma | 10 (100.0%) | 0 (0.0%) |
| College or Associate's Degree | 0 (0.0%) | 0 (0.0%) |
| Bachelor's Degree | 9 (100.0%) | 0 (0.0%) |
| Graduate Degree | 0 (0.0%) | 0 (0.0%) |
| Total | 19 (57.6%) | 14 (42.4%) |
Income in West Jefferson
Income Overview in West Jefferson
Per Capita Income in West Jefferson is $31,577, while median incomes of families and households are $77,591 and $63,750 respectively.
| Characteristic | Number | Measure |
| Per Capita Income | 4,186 | $31,577 |
| Median Family Income | 1,103 | $77,591 |
| Mean Family Income | 1,103 | $85,448 |
| Median Household Income | 1,626 | $63,750 |
| Mean Household Income | 1,626 | $76,229 |
| Income Deficit | 1,103 | $0 |
| Wage / Income Gap (%) | 4,186 | 30.56% |
| Wage / Income Gap ($) | 4,186 | 69.44¢ per $1 |
| Gini / Inequality Index | 4,186 | 0.37 |
Earnings by Sex in West Jefferson
Average Earnings in West Jefferson are $37,772, $44,393 for men and $30,825 for women, a difference of 30.6%.
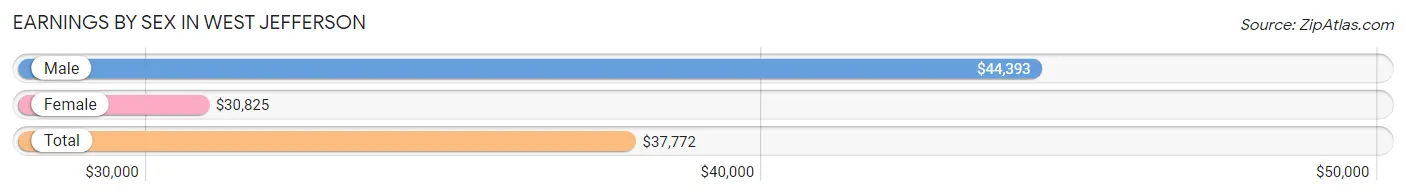
| Sex | Number | Average Earnings |
| Male | 1,171 (47.7%) | $44,393 |
| Female | 1,284 (52.3%) | $30,825 |
| Total | 2,455 (100.0%) | $37,772 |
Earnings by Sex by Income Bracket in West Jefferson
The most common earnings brackets in West Jefferson are $55,000 to $64,999 for men (193 | 16.5%) and $22,500 to $24,999 for women (133 | 10.4%).
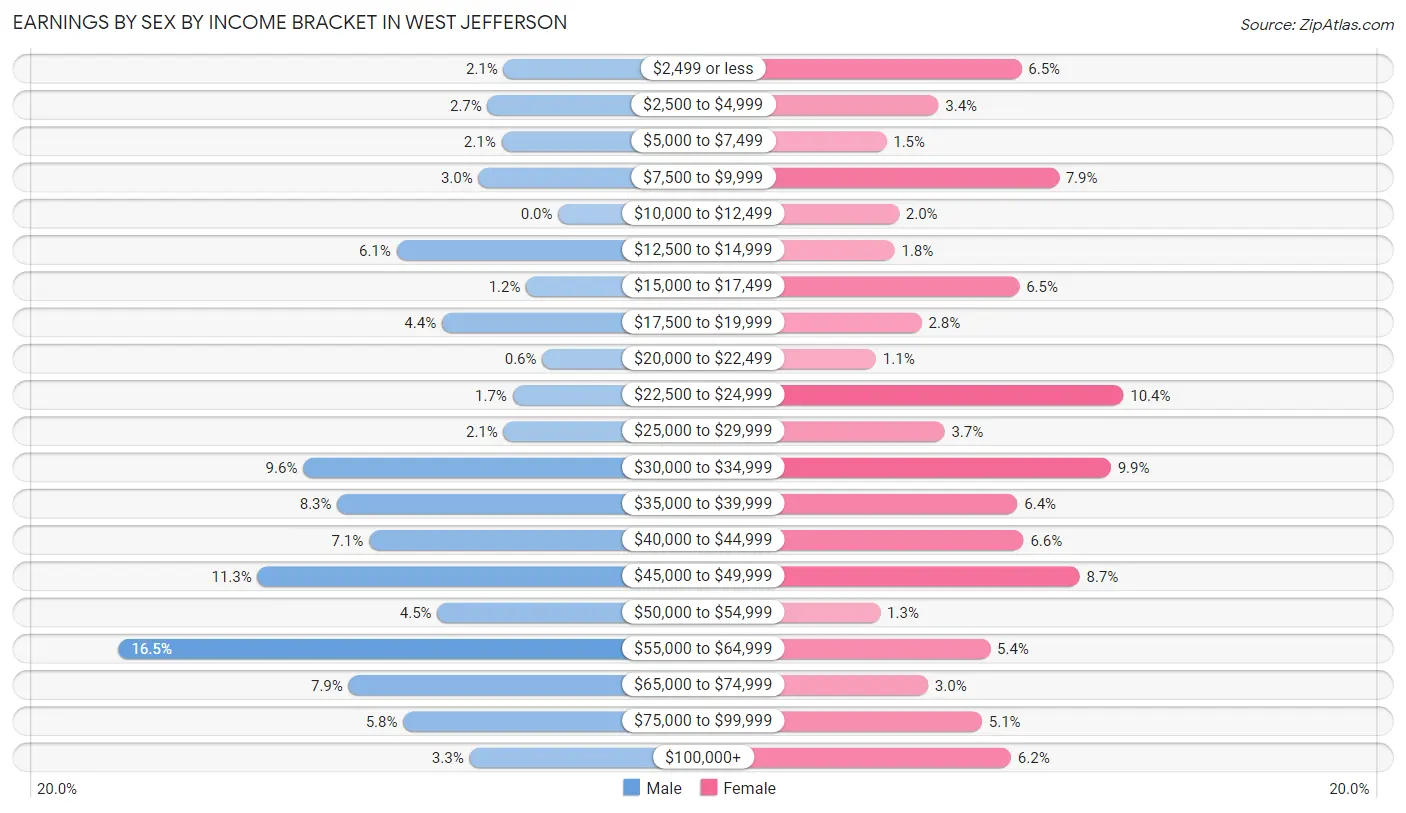
| Income | Male | Female |
| $2,499 or less | 24 (2.1%) | 84 (6.5%) |
| $2,500 to $4,999 | 31 (2.6%) | 44 (3.4%) |
| $5,000 to $7,499 | 25 (2.1%) | 19 (1.5%) |
| $7,500 to $9,999 | 35 (3.0%) | 102 (7.9%) |
| $10,000 to $12,499 | 0 (0.0%) | 25 (1.9%) |
| $12,500 to $14,999 | 71 (6.1%) | 23 (1.8%) |
| $15,000 to $17,499 | 14 (1.2%) | 83 (6.5%) |
| $17,500 to $19,999 | 51 (4.4%) | 36 (2.8%) |
| $20,000 to $22,499 | 7 (0.6%) | 14 (1.1%) |
| $22,500 to $24,999 | 20 (1.7%) | 133 (10.4%) |
| $25,000 to $29,999 | 24 (2.1%) | 47 (3.7%) |
| $30,000 to $34,999 | 112 (9.6%) | 127 (9.9%) |
| $35,000 to $39,999 | 97 (8.3%) | 82 (6.4%) |
| $40,000 to $44,999 | 83 (7.1%) | 85 (6.6%) |
| $45,000 to $49,999 | 132 (11.3%) | 112 (8.7%) |
| $50,000 to $54,999 | 53 (4.5%) | 16 (1.3%) |
| $55,000 to $64,999 | 193 (16.5%) | 69 (5.4%) |
| $65,000 to $74,999 | 92 (7.9%) | 39 (3.0%) |
| $75,000 to $99,999 | 68 (5.8%) | 65 (5.1%) |
| $100,000+ | 39 (3.3%) | 79 (6.1%) |
| Total | 1,171 (100.0%) | 1,284 (100.0%) |
Earnings by Sex by Educational Attainment in West Jefferson
Average earnings in West Jefferson are $46,919 for men and $37,567 for women, a difference of 19.9%. Men with an educational attainment of high school diploma enjoy the highest average annual earnings of $49,340, while those with graduate degree education earn the least with $18,324. Women with an educational attainment of bachelor's degree earn the most with the average annual earnings of $63,393, while those with less than high school education have the smallest earnings of $16,175.
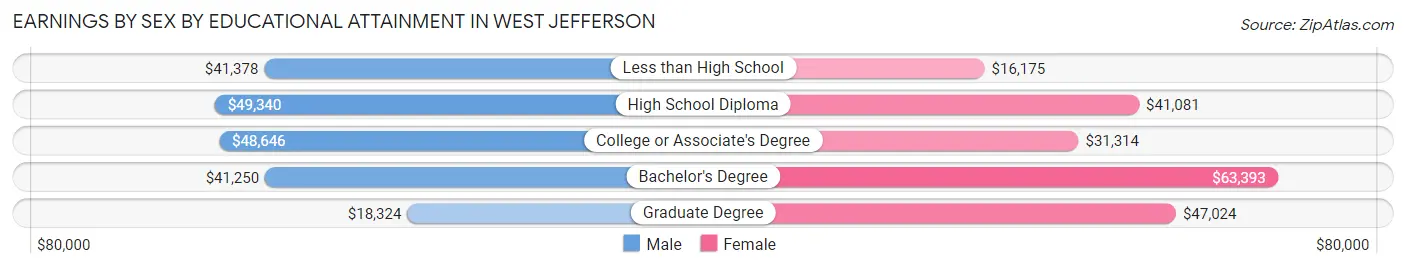
| Educational Attainment | Male Income | Female Income |
| Less than High School | $41,378 | $16,175 |
| High School Diploma | $49,340 | $41,081 |
| College or Associate's Degree | $48,646 | $31,314 |
| Bachelor's Degree | $41,250 | $63,393 |
| Graduate Degree | $18,324 | $47,024 |
| Total | $46,919 | $37,567 |
Family Income in West Jefferson
Family Income Brackets in West Jefferson
According to the West Jefferson family income data, there are 251 families falling into the $100,000 to $149,999 income range, which is the most common income bracket and makes up 22.8% of all families. Conversely, the $10,000 to $14,999 income bracket is the least frequent group with only 21 families (1.9%) belonging to this category.
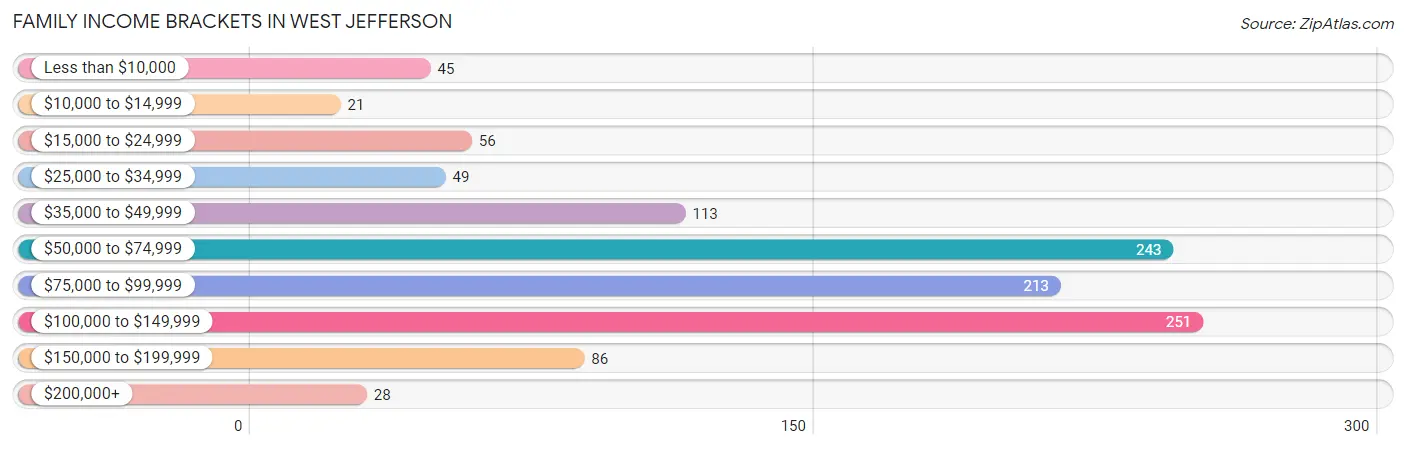
| Income Bracket | # Families | % Families |
| Less than $10,000 | 45 | 4.1% |
| $10,000 to $14,999 | 21 | 1.9% |
| $15,000 to $24,999 | 56 | 5.1% |
| $25,000 to $34,999 | 49 | 4.4% |
| $35,000 to $49,999 | 113 | 10.2% |
| $50,000 to $74,999 | 243 | 22.0% |
| $75,000 to $99,999 | 213 | 19.3% |
| $100,000 to $149,999 | 251 | 22.8% |
| $150,000 to $199,999 | 86 | 7.8% |
| $200,000+ | 28 | 2.5% |
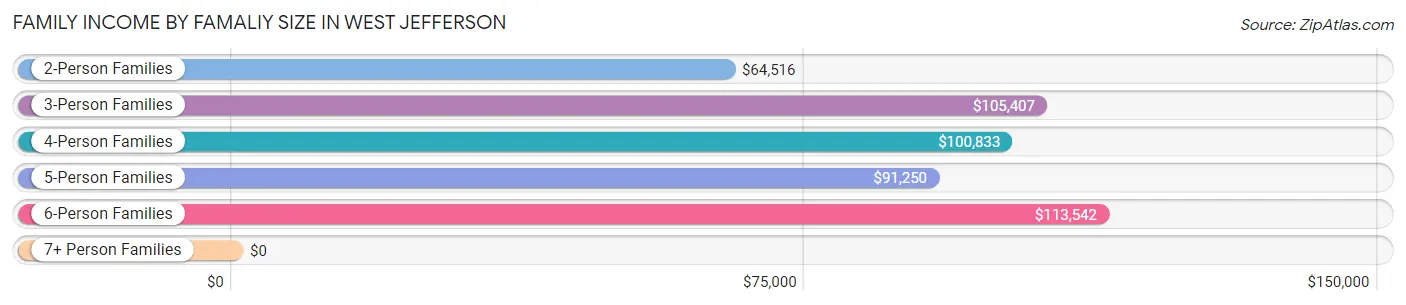
Family Income by Famaliy Size in West Jefferson
6-person families (47 | 4.3%) account for the highest median family income in West Jefferson with $113,542 per family, while 3-person families (310 | 28.1%) have the highest median income of $35,136 per family member.
| Income Bracket | # Families | Median Income |
| 2-Person Families | 602 (54.6%) | $64,516 |
| 3-Person Families | 310 (28.1%) | $105,407 |
| 4-Person Families | 100 (9.1%) | $100,833 |
| 5-Person Families | 36 (3.3%) | $91,250 |
| 6-Person Families | 47 (4.3%) | $113,542 |
| 7+ Person Families | 8 (0.7%) | $0 |
| Total | 1,103 (100.0%) | $77,591 |
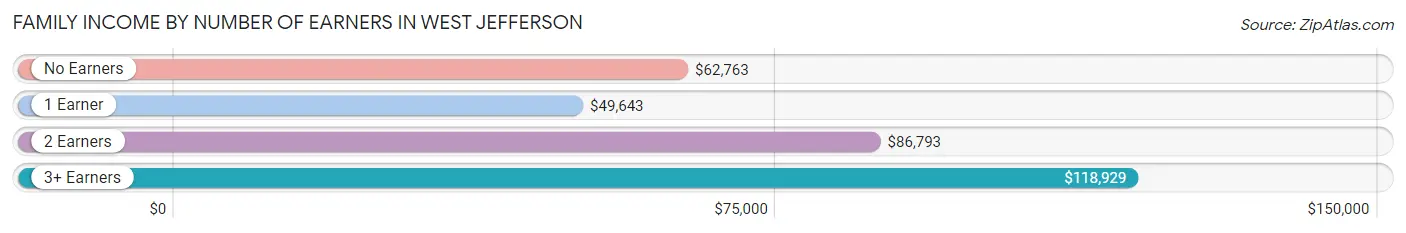
Family Income by Number of Earners in West Jefferson
The median family income in West Jefferson is $77,591, with families comprising 3+ earners (178) having the highest median family income of $118,929, while families with 1 earner (280) have the lowest median family income of $49,643, accounting for 16.1% and 25.4% of families, respectively.
| Number of Earners | # Families | Median Income |
| No Earners | 180 (16.3%) | $62,763 |
| 1 Earner | 280 (25.4%) | $49,643 |
| 2 Earners | 465 (42.2%) | $86,793 |
| 3+ Earners | 178 (16.1%) | $118,929 |
| Total | 1,103 (100.0%) | $77,591 |
Household Income in West Jefferson
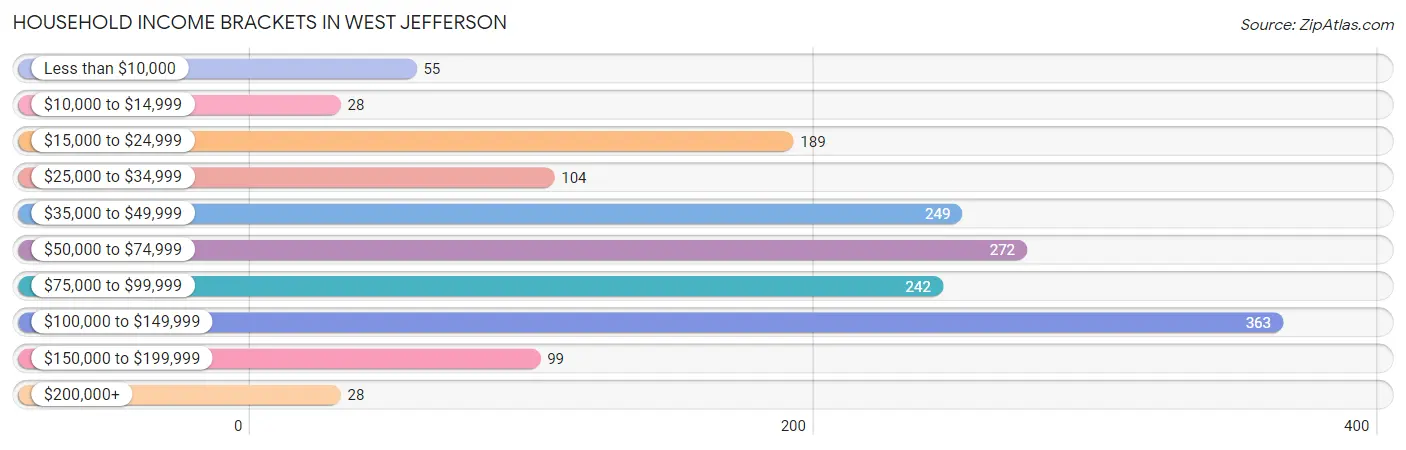
Household Income Brackets in West Jefferson
With 363 households falling in the category, the $100,000 to $149,999 income range is the most frequent in West Jefferson, accounting for 22.3% of all households. In contrast, only 28 households (1.7%) fall into the $10,000 to $14,999 income bracket, making it the least populous group.
| Income Bracket | # Households | % Households |
| Less than $10,000 | 55 | 3.4% |
| $10,000 to $14,999 | 28 | 1.7% |
| $15,000 to $24,999 | 189 | 11.6% |
| $25,000 to $34,999 | 104 | 6.4% |
| $35,000 to $49,999 | 249 | 15.3% |
| $50,000 to $74,999 | 272 | 16.7% |
| $75,000 to $99,999 | 242 | 14.9% |
| $100,000 to $149,999 | 363 | 22.3% |
| $150,000 to $199,999 | 99 | 6.1% |
| $200,000+ | 28 | 1.7% |
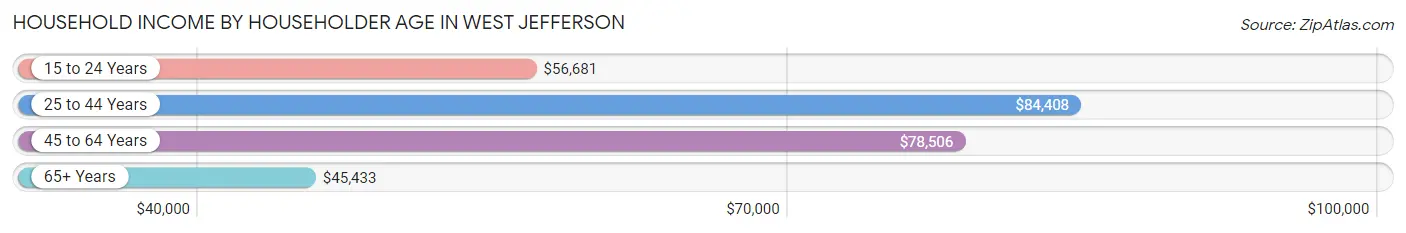
Household Income by Householder Age in West Jefferson
The median household income in West Jefferson is $63,750, with the highest median household income of $84,408 found in the 25 to 44 years age bracket for the primary householder. A total of 381 households (23.4%) fall into this category. Meanwhile, the 65+ years age bracket for the primary householder has the lowest median household income of $45,433, with 519 households (31.9%) in this group.
| Income Bracket | # Households | Median Income |
| 15 to 24 Years | 39 (2.4%) | $56,681 |
| 25 to 44 Years | 381 (23.4%) | $84,408 |
| 45 to 64 Years | 687 (42.2%) | $78,506 |
| 65+ Years | 519 (31.9%) | $45,433 |
| Total | 1,626 (100.0%) | $63,750 |
Poverty in West Jefferson
Income Below Poverty by Sex and Age in West Jefferson
With 10.7% poverty level for males and 11.5% for females among the residents of West Jefferson, 5 year old males and 25 to 34 year old females are the most vulnerable to poverty, with 26 males (100.0%) and 92 females (24.7%) in their respective age groups living below the poverty level.
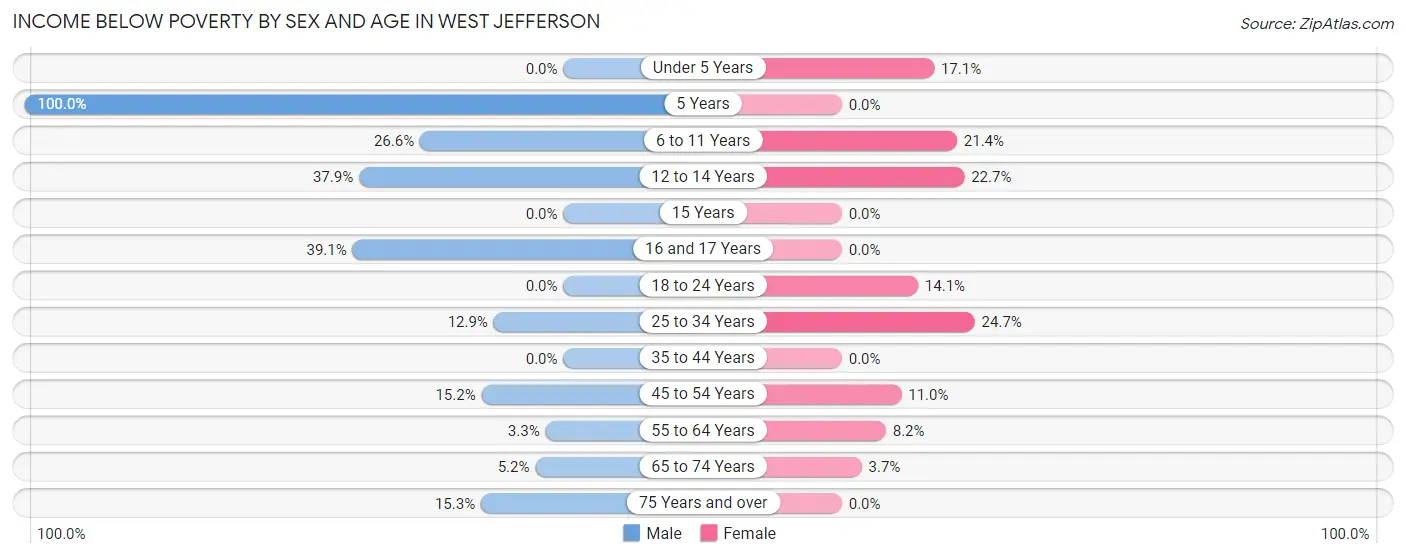
| Age Bracket | Male | Female |
| Under 5 Years | 0 (0.0%) | 13 (17.1%) |
| 5 Years | 26 (100.0%) | 0 (0.0%) |
| 6 to 11 Years | 29 (26.6%) | 22 (21.4%) |
| 12 to 14 Years | 11 (37.9%) | 10 (22.7%) |
| 15 Years | 0 (0.0%) | 0 (0.0%) |
| 16 and 17 Years | 9 (39.1%) | 0 (0.0%) |
| 18 to 24 Years | 0 (0.0%) | 40 (14.1%) |
| 25 to 34 Years | 49 (12.9%) | 92 (24.7%) |
| 35 to 44 Years | 0 (0.0%) | 0 (0.0%) |
| 45 to 54 Years | 41 (15.2%) | 35 (11.0%) |
| 55 to 64 Years | 10 (3.3%) | 29 (8.2%) |
| 65 to 74 Years | 15 (5.2%) | 9 (3.7%) |
| 75 Years and over | 13 (15.3%) | 0 (0.0%) |
| Total | 203 (10.7%) | 250 (11.5%) |
Income Above Poverty by Sex and Age in West Jefferson
According to the poverty statistics in West Jefferson, males aged under 5 years and females aged 5 years are the age groups that are most secure financially, with 100.0% of males and 100.0% of females in these age groups living above the poverty line.
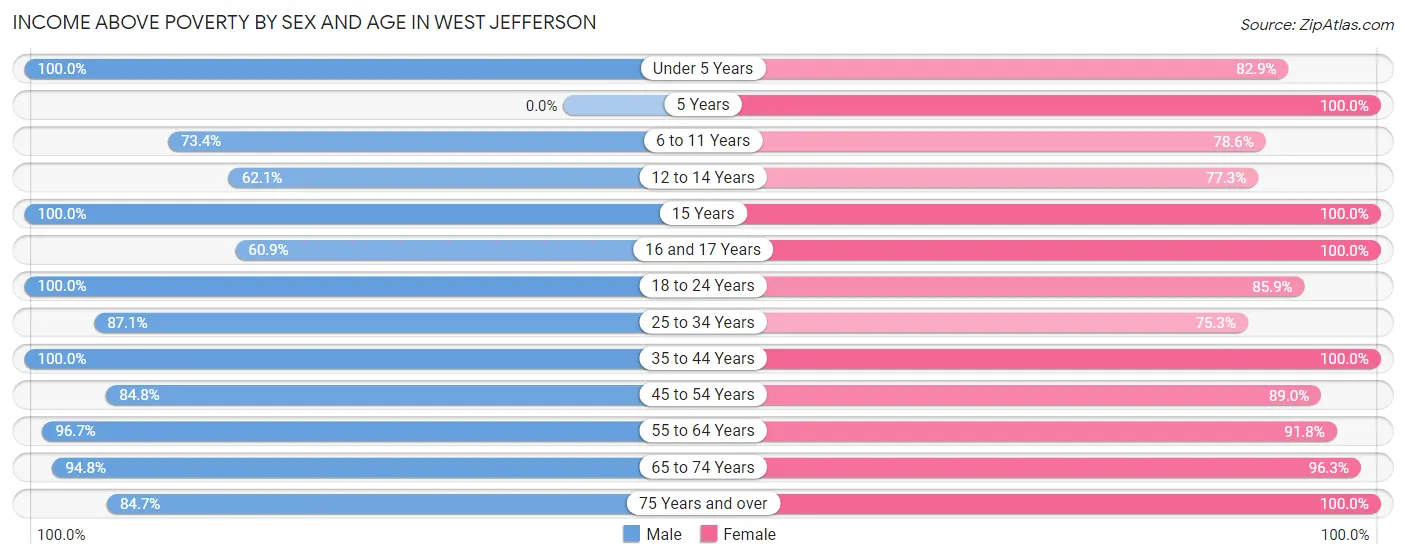
| Age Bracket | Male | Female |
| Under 5 Years | 102 (100.0%) | 63 (82.9%) |
| 5 Years | 0 (0.0%) | 16 (100.0%) |
| 6 to 11 Years | 80 (73.4%) | 81 (78.6%) |
| 12 to 14 Years | 18 (62.1%) | 34 (77.3%) |
| 15 Years | 26 (100.0%) | 21 (100.0%) |
| 16 and 17 Years | 14 (60.9%) | 52 (100.0%) |
| 18 to 24 Years | 104 (100.0%) | 243 (85.9%) |
| 25 to 34 Years | 330 (87.1%) | 281 (75.3%) |
| 35 to 44 Years | 152 (100.0%) | 141 (100.0%) |
| 45 to 54 Years | 229 (84.8%) | 282 (89.0%) |
| 55 to 64 Years | 291 (96.7%) | 326 (91.8%) |
| 65 to 74 Years | 273 (94.8%) | 236 (96.3%) |
| 75 Years and over | 72 (84.7%) | 152 (100.0%) |
| Total | 1,691 (89.3%) | 1,928 (88.5%) |
Income Below Poverty Among Married-Couple Families in West Jefferson
The poverty statistics for married-couple families in West Jefferson show that 5.6% or 47 of the total 847 families live below the poverty line. Families with 3 or 4 children have the highest poverty rate of 18.0%, comprising of 9 families. On the other hand, families with no children have the lowest poverty rate of 1.3%, which includes 8 families.
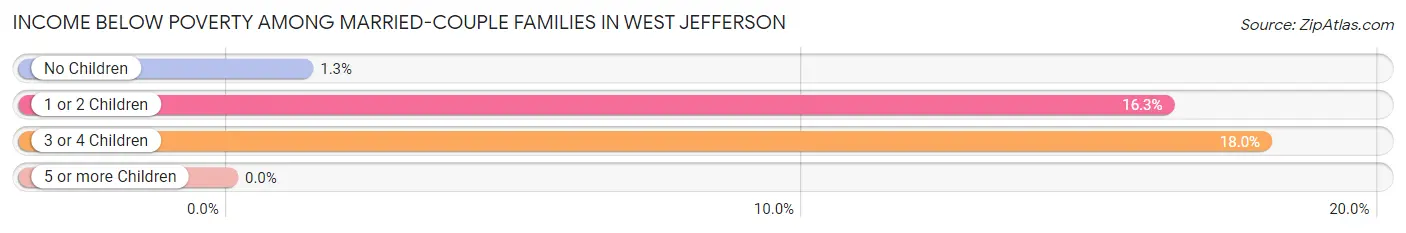
| Children | Above Poverty | Below Poverty |
| No Children | 605 (98.7%) | 8 (1.3%) |
| 1 or 2 Children | 154 (83.7%) | 30 (16.3%) |
| 3 or 4 Children | 41 (82.0%) | 9 (18.0%) |
| 5 or more Children | 0 (0.0%) | 0 (0.0%) |
| Total | 800 (94.5%) | 47 (5.6%) |
Income Below Poverty Among Single-Parent Households in West Jefferson
According to the poverty data in West Jefferson, 15.8% or 9 single-father households and 24.6% or 49 single-mother households are living below the poverty line. Among single-father households, those with 1 or 2 children have the highest poverty rate, with 9 households (21.4%) experiencing poverty. Likewise, among single-mother households, those with 3 or 4 children have the highest poverty rate, with 10 households (55.6%) falling below the poverty line.
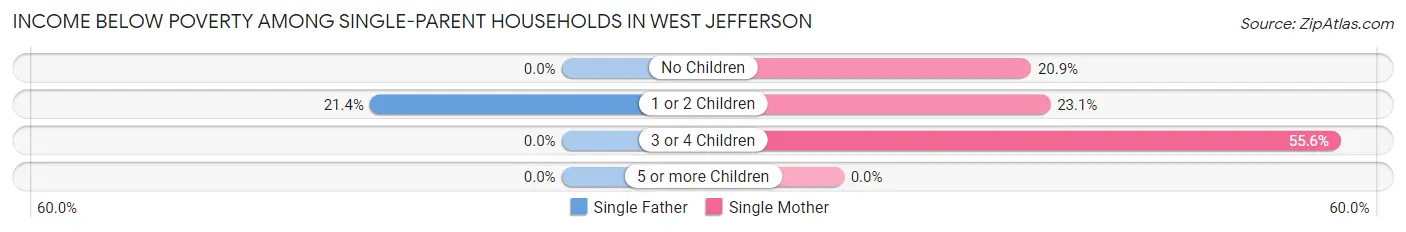
| Children | Single Father | Single Mother |
| No Children | 0 (0.0%) | 27 (20.9%) |
| 1 or 2 Children | 9 (21.4%) | 12 (23.1%) |
| 3 or 4 Children | 0 (0.0%) | 10 (55.6%) |
| 5 or more Children | 0 (0.0%) | 0 (0.0%) |
| Total | 9 (15.8%) | 49 (24.6%) |
Income Below Poverty Among Married-Couple vs Single-Parent Households in West Jefferson
The poverty data for West Jefferson shows that 47 of the married-couple family households (5.6%) and 58 of the single-parent households (22.7%) are living below the poverty level. Within the married-couple family households, those with 3 or 4 children have the highest poverty rate, with 9 households (18.0%) falling below the poverty line. Among the single-parent households, those with 3 or 4 children have the highest poverty rate, with 10 household (55.6%) living below poverty.
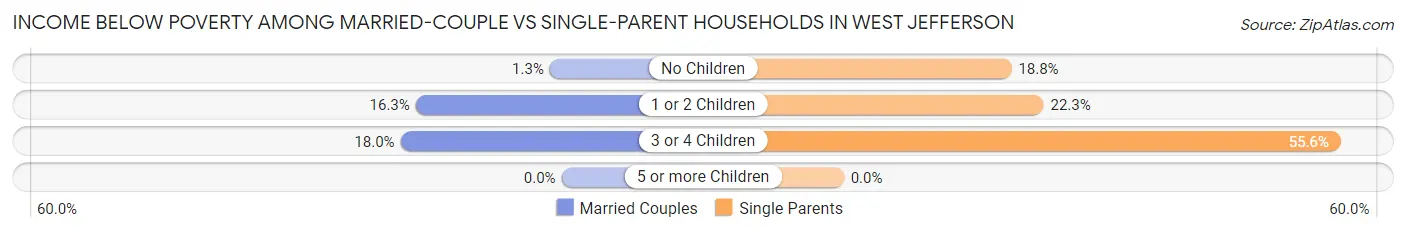
| Children | Married-Couple Families | Single-Parent Households |
| No Children | 8 (1.3%) | 27 (18.8%) |
| 1 or 2 Children | 30 (16.3%) | 21 (22.3%) |
| 3 or 4 Children | 9 (18.0%) | 10 (55.6%) |
| 5 or more Children | 0 (0.0%) | 0 (0.0%) |
| Total | 47 (5.6%) | 58 (22.7%) |
Employment Characteristics in West Jefferson
Employment by Class of Employer in West Jefferson
Among the 2,238 employed individuals in West Jefferson, private company employees (1,808 | 80.8%), local government employees (142 | 6.3%), and not-for-profit organizations (120 | 5.4%) make up the most common classes of employment.
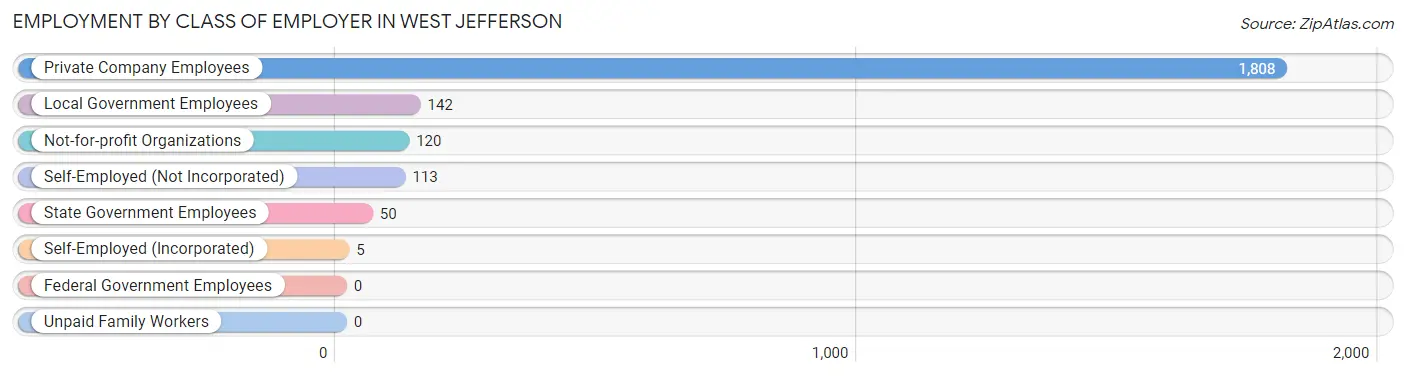
| Employer Class | # Employees | % Employees |
| Private Company Employees | 1,808 | 80.8% |
| Self-Employed (Incorporated) | 5 | 0.2% |
| Self-Employed (Not Incorporated) | 113 | 5.1% |
| Not-for-profit Organizations | 120 | 5.4% |
| Local Government Employees | 142 | 6.3% |
| State Government Employees | 50 | 2.2% |
| Federal Government Employees | 0 | 0.0% |
| Unpaid Family Workers | 0 | 0.0% |
| Total | 2,238 | 100.0% |
Employment Status by Age in West Jefferson
According to the labor force statistics for West Jefferson, out of the total population over 16 years of age (3,614), 65.2% or 2,356 individuals are in the labor force, with 2.2% or 52 of them unemployed. The age group with the highest labor force participation rate is 35 to 44 years, with 94.5% or 277 individuals in the labor force. Within the labor force, the 16 to 19 years age range has the highest percentage of unemployed individuals, with 24.5% or 13 of them being unemployed.
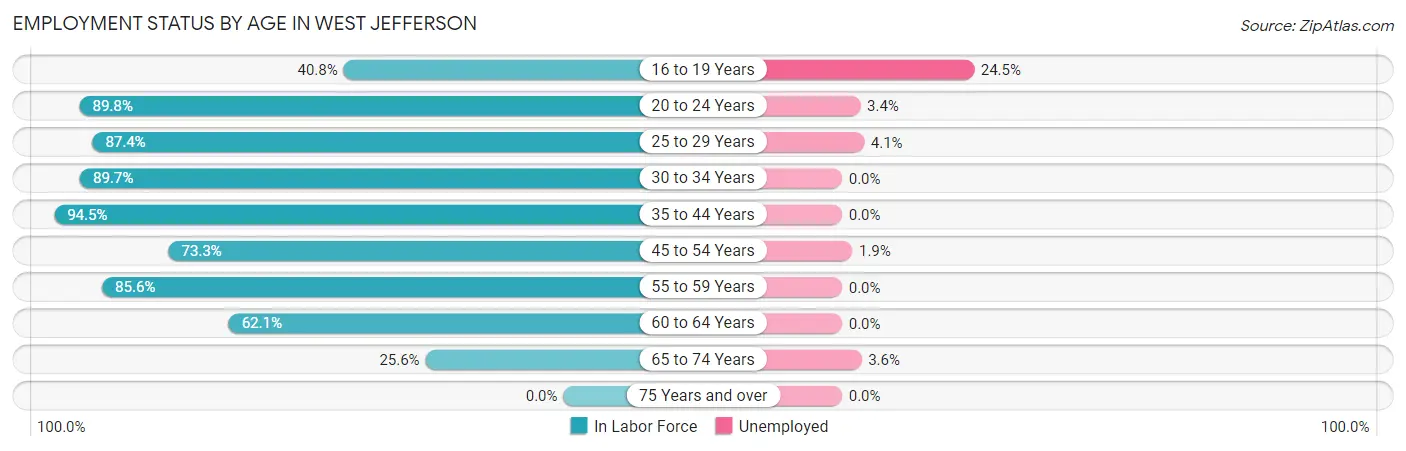
| Age Bracket | In Labor Force | Unemployed |
| 16 to 19 Years | 53 (40.8%) | 13 (24.5%) |
| 20 to 24 Years | 298 (89.8%) | 10 (3.4%) |
| 25 to 29 Years | 395 (87.4%) | 16 (4.1%) |
| 30 to 34 Years | 269 (89.7%) | 0 (0.0%) |
| 35 to 44 Years | 277 (94.5%) | 0 (0.0%) |
| 45 to 54 Years | 430 (73.3%) | 8 (1.9%) |
| 55 to 59 Years | 304 (85.6%) | 0 (0.0%) |
| 60 to 64 Years | 192 (62.1%) | 0 (0.0%) |
| 65 to 74 Years | 139 (25.6%) | 5 (3.6%) |
| 75 Years and over | 0 (0.0%) | 0 (0.0%) |
| Total | 2,356 (65.2%) | 52 (2.2%) |
Employment Status by Educational Attainment in West Jefferson
According to labor force statistics for West Jefferson, 81.3% of individuals (1,867) out of the total population between 25 and 64 years of age (2,296) are in the labor force, with 1.3% or 24 of them being unemployed. The group with the highest labor force participation rate are those with the educational attainment of bachelor's degree or higher, with 97.3% or 328 individuals in the labor force. Within the labor force, individuals with high school diploma education have the highest percentage of unemployment, with 3.1% or 24 of them being unemployed.
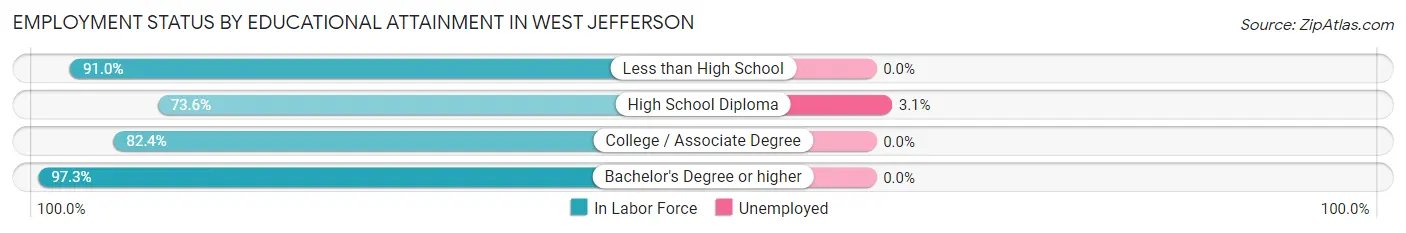
| Educational Attainment | In Labor Force | Unemployed |
| Less than High School | 201 (91.0%) | 0 (0.0%) |
| High School Diploma | 782 (73.6%) | 33 (3.1%) |
| College / Associate Degree | 556 (82.4%) | 0 (0.0%) |
| Bachelor's Degree or higher | 328 (97.3%) | 0 (0.0%) |
| Total | 1,867 (81.3%) | 30 (1.3%) |
Employment Occupations by Sex in West Jefferson
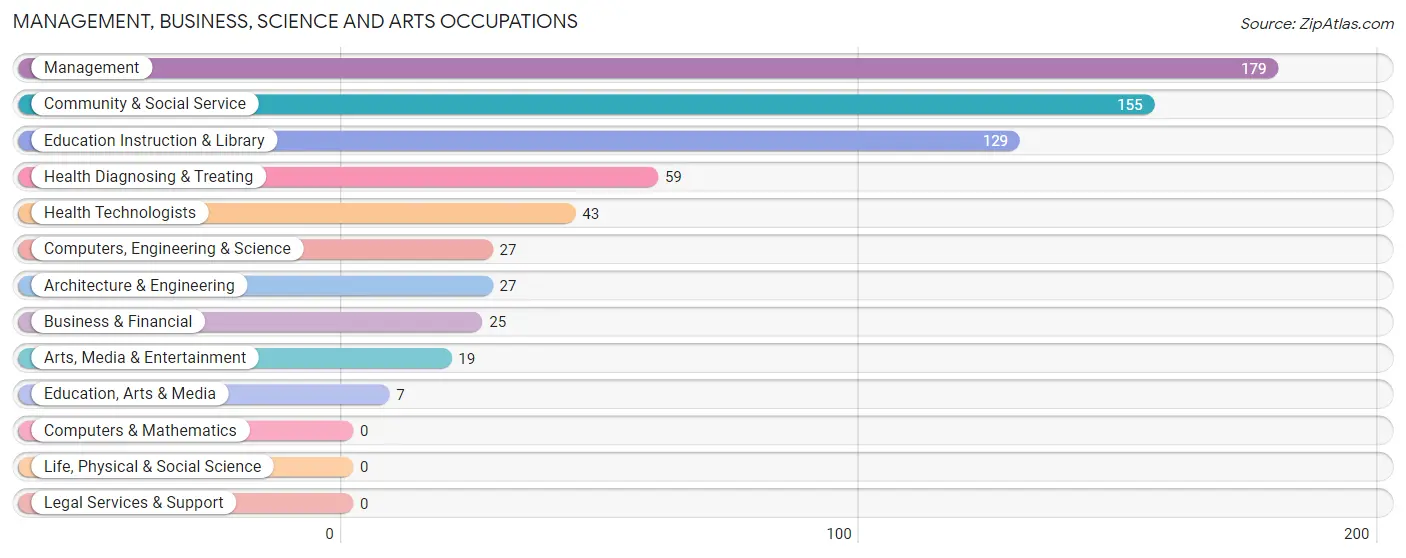
Management, Business, Science and Arts Occupations
The most common Management, Business, Science and Arts occupations in West Jefferson are Management (179 | 7.8%), Community & Social Service (155 | 6.7%), Education Instruction & Library (129 | 5.6%), Health Diagnosing & Treating (59 | 2.6%), and Health Technologists (43 | 1.9%).
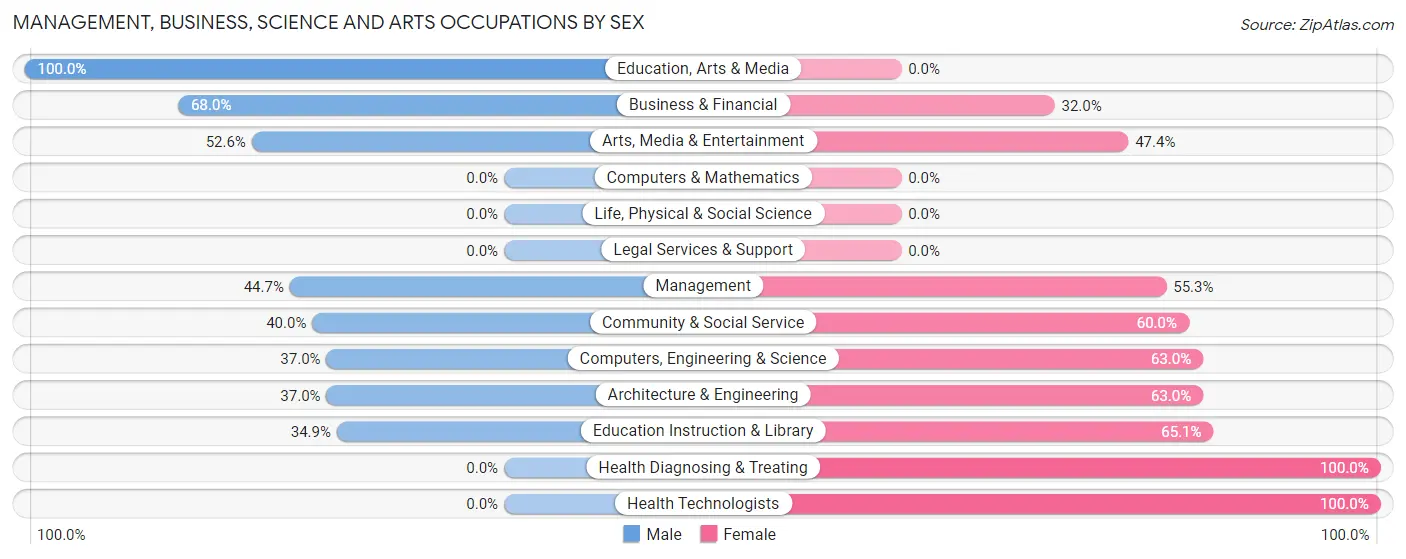
Management, Business, Science and Arts Occupations by Sex
Within the Management, Business, Science and Arts occupations in West Jefferson, the most male-oriented occupations are Education, Arts & Media (100.0%), Business & Financial (68.0%), and Arts, Media & Entertainment (52.6%), while the most female-oriented occupations are Health Diagnosing & Treating (100.0%), Health Technologists (100.0%), and Education Instruction & Library (65.1%).
| Occupation | Male | Female |
| Management | 80 (44.7%) | 99 (55.3%) |
| Business & Financial | 17 (68.0%) | 8 (32.0%) |
| Computers, Engineering & Science | 10 (37.0%) | 17 (63.0%) |
| Computers & Mathematics | 0 (0.0%) | 0 (0.0%) |
| Architecture & Engineering | 10 (37.0%) | 17 (63.0%) |
| Life, Physical & Social Science | 0 (0.0%) | 0 (0.0%) |
| Community & Social Service | 62 (40.0%) | 93 (60.0%) |
| Education, Arts & Media | 7 (100.0%) | 0 (0.0%) |
| Legal Services & Support | 0 (0.0%) | 0 (0.0%) |
| Education Instruction & Library | 45 (34.9%) | 84 (65.1%) |
| Arts, Media & Entertainment | 10 (52.6%) | 9 (47.4%) |
| Health Diagnosing & Treating | 0 (0.0%) | 59 (100.0%) |
| Health Technologists | 0 (0.0%) | 43 (100.0%) |
| Total (Category) | 169 (38.0%) | 276 (62.0%) |
| Total (Overall) | 1,133 (49.1%) | 1,172 (50.8%) |
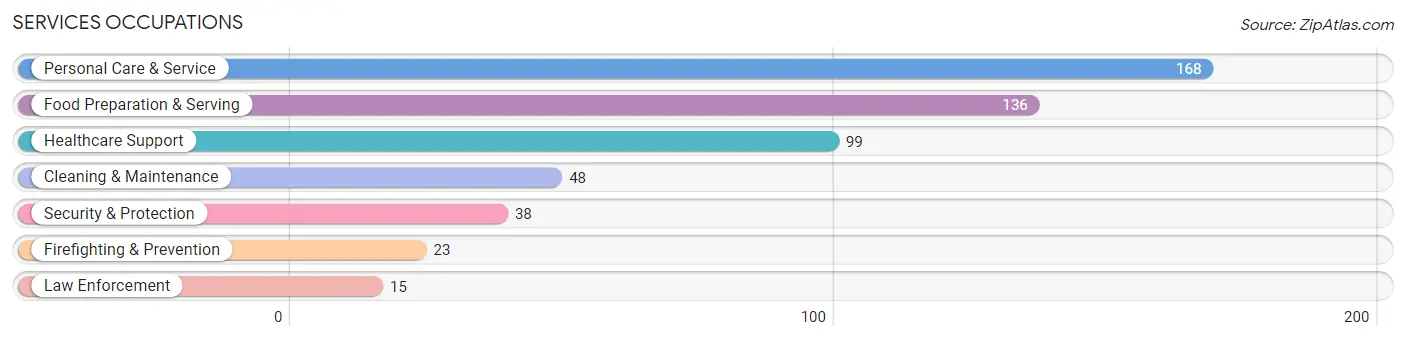
Services Occupations
The most common Services occupations in West Jefferson are Personal Care & Service (168 | 7.3%), Food Preparation & Serving (136 | 5.9%), Healthcare Support (99 | 4.3%), Cleaning & Maintenance (48 | 2.1%), and Security & Protection (38 | 1.7%).
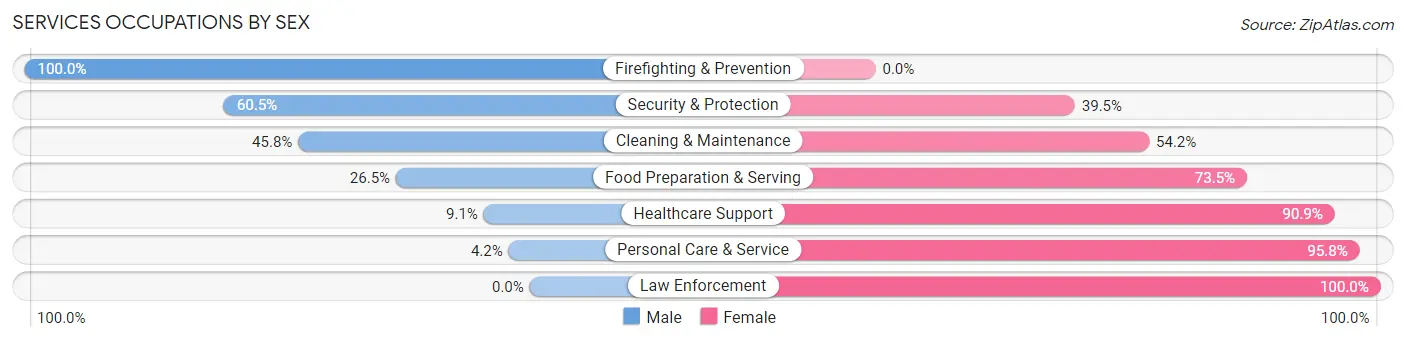
Services Occupations by Sex
Within the Services occupations in West Jefferson, the most male-oriented occupations are Firefighting & Prevention (100.0%), Security & Protection (60.5%), and Cleaning & Maintenance (45.8%), while the most female-oriented occupations are Law Enforcement (100.0%), Personal Care & Service (95.8%), and Healthcare Support (90.9%).
| Occupation | Male | Female |
| Healthcare Support | 9 (9.1%) | 90 (90.9%) |
| Security & Protection | 23 (60.5%) | 15 (39.5%) |
| Firefighting & Prevention | 23 (100.0%) | 0 (0.0%) |
| Law Enforcement | 0 (0.0%) | 15 (100.0%) |
| Food Preparation & Serving | 36 (26.5%) | 100 (73.5%) |
| Cleaning & Maintenance | 22 (45.8%) | 26 (54.2%) |
| Personal Care & Service | 7 (4.2%) | 161 (95.8%) |
| Total (Category) | 97 (19.8%) | 392 (80.2%) |
| Total (Overall) | 1,133 (49.1%) | 1,172 (50.8%) |
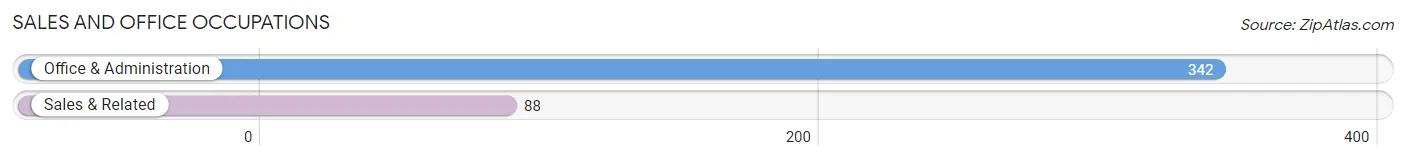
Sales and Office Occupations
The most common Sales and Office occupations in West Jefferson are Office & Administration (342 | 14.8%), and Sales & Related (88 | 3.8%).
Sales and Office Occupations by Sex
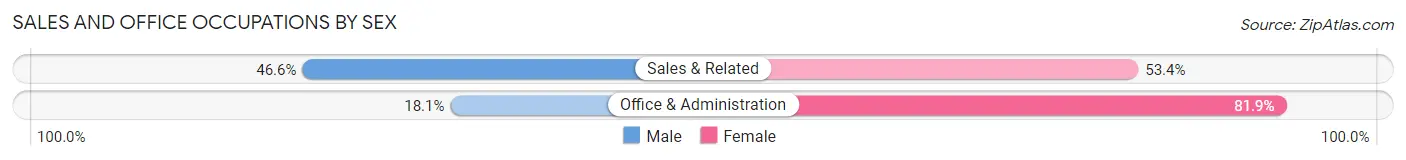
| Occupation | Male | Female |
| Sales & Related | 41 (46.6%) | 47 (53.4%) |
| Office & Administration | 62 (18.1%) | 280 (81.9%) |
| Total (Category) | 103 (23.9%) | 327 (76.0%) |
| Total (Overall) | 1,133 (49.1%) | 1,172 (50.8%) |
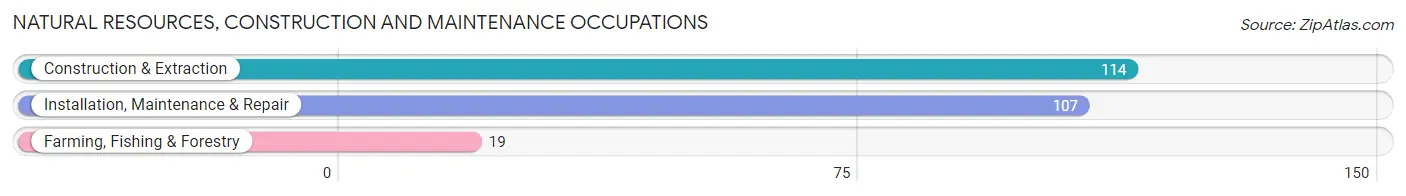
Natural Resources, Construction and Maintenance Occupations
The most common Natural Resources, Construction and Maintenance occupations in West Jefferson are Construction & Extraction (114 | 5.0%), Installation, Maintenance & Repair (107 | 4.6%), and Farming, Fishing & Forestry (19 | 0.8%).
Natural Resources, Construction and Maintenance Occupations by Sex
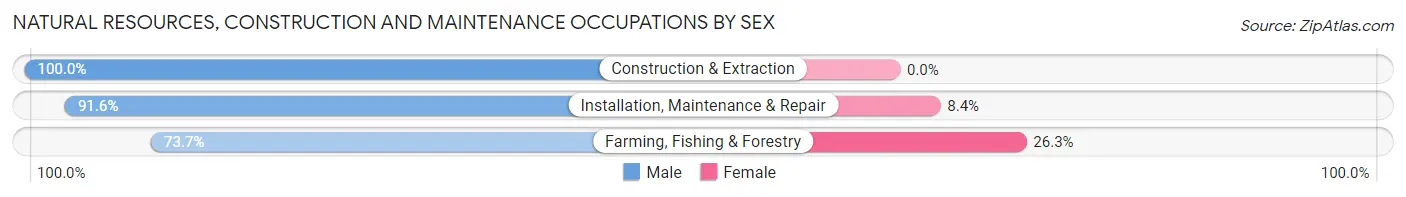
| Occupation | Male | Female |
| Farming, Fishing & Forestry | 14 (73.7%) | 5 (26.3%) |
| Construction & Extraction | 114 (100.0%) | 0 (0.0%) |
| Installation, Maintenance & Repair | 98 (91.6%) | 9 (8.4%) |
| Total (Category) | 226 (94.2%) | 14 (5.8%) |
| Total (Overall) | 1,133 (49.1%) | 1,172 (50.8%) |
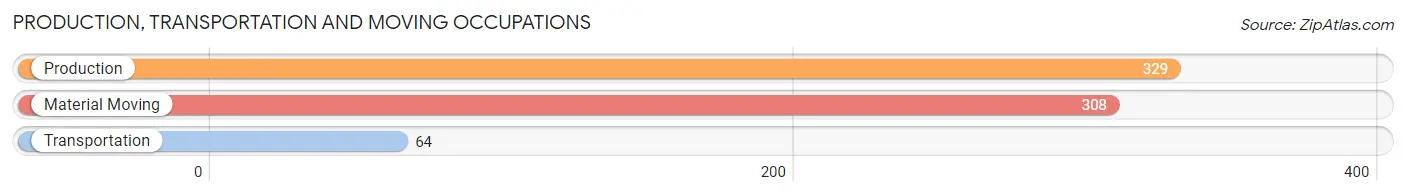
Production, Transportation and Moving Occupations
The most common Production, Transportation and Moving occupations in West Jefferson are Production (329 | 14.3%), Material Moving (308 | 13.4%), and Transportation (64 | 2.8%).
Production, Transportation and Moving Occupations by Sex
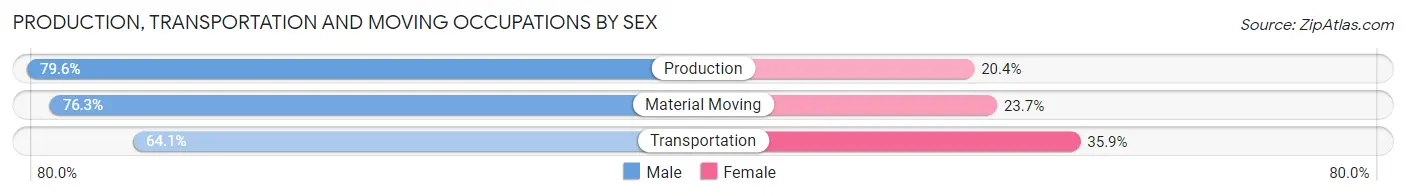
| Occupation | Male | Female |
| Production | 262 (79.6%) | 67 (20.4%) |
| Transportation | 41 (64.1%) | 23 (35.9%) |
| Material Moving | 235 (76.3%) | 73 (23.7%) |
| Total (Category) | 538 (76.7%) | 163 (23.3%) |
| Total (Overall) | 1,133 (49.1%) | 1,172 (50.8%) |
Employment Industries by Sex in West Jefferson
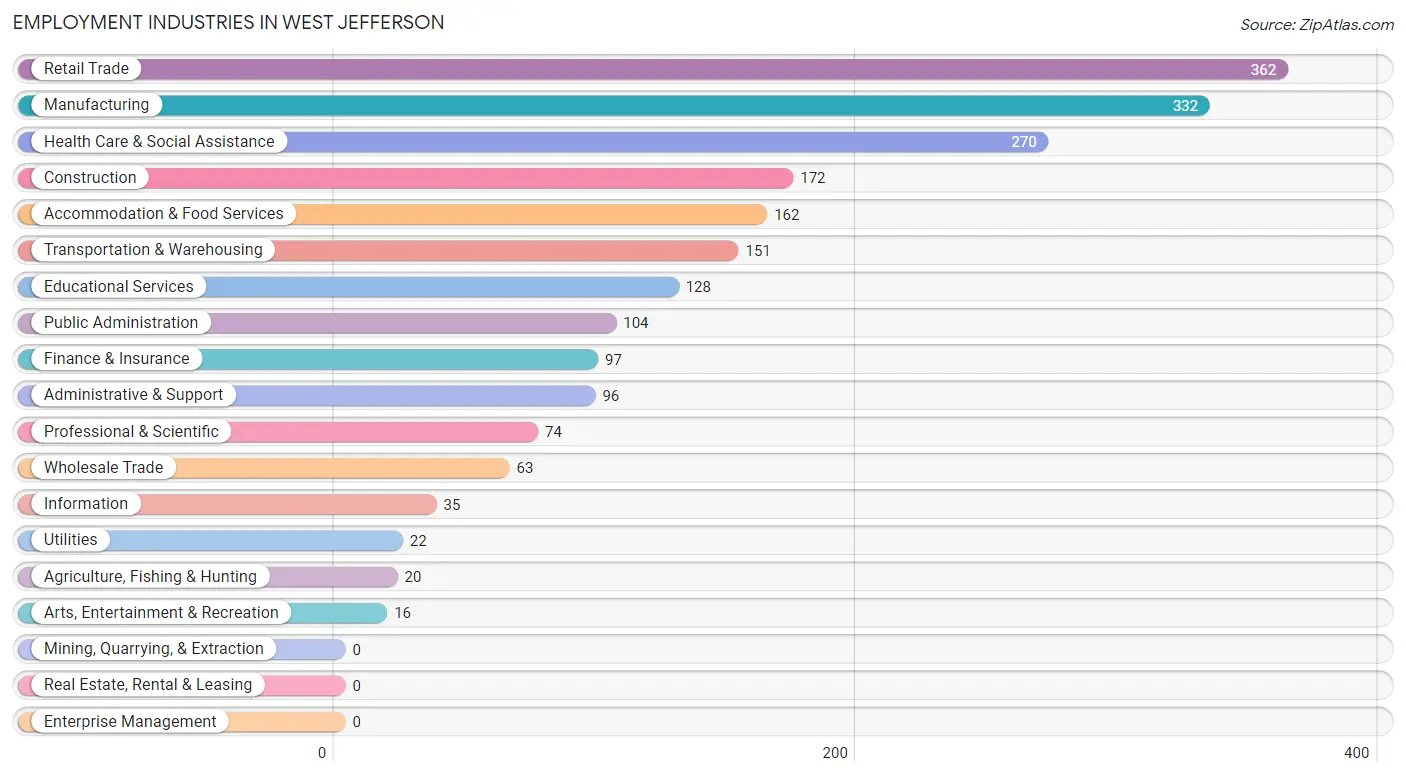
Employment Industries in West Jefferson
The major employment industries in West Jefferson include Retail Trade (362 | 15.7%), Manufacturing (332 | 14.4%), Health Care & Social Assistance (270 | 11.7%), Construction (172 | 7.5%), and Accommodation & Food Services (162 | 7.0%).
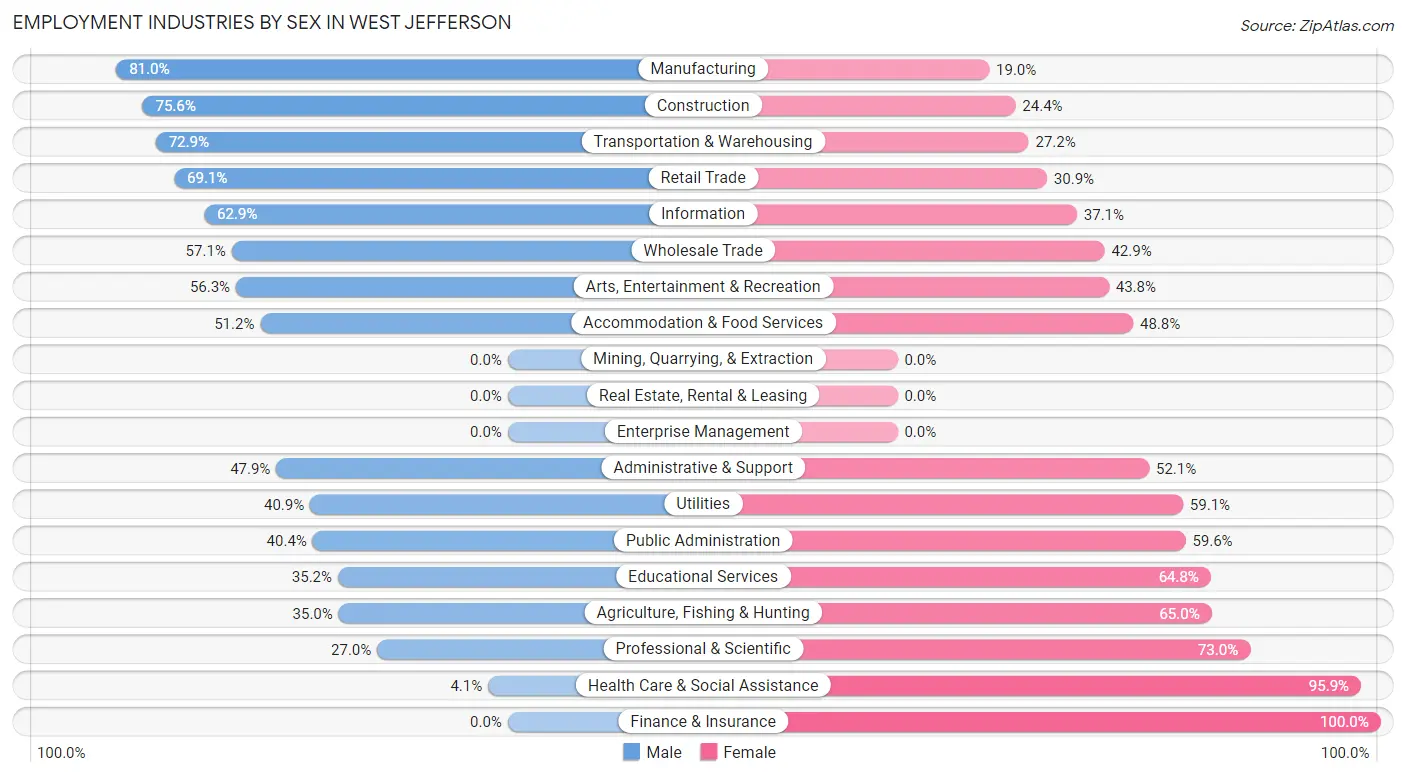
Employment Industries by Sex in West Jefferson
The West Jefferson industries that see more men than women are Manufacturing (81.0%), Construction (75.6%), and Transportation & Warehousing (72.9%), whereas the industries that tend to have a higher number of women are Finance & Insurance (100.0%), Health Care & Social Assistance (95.9%), and Professional & Scientific (73.0%).
| Industry | Male | Female |
| Agriculture, Fishing & Hunting | 7 (35.0%) | 13 (65.0%) |
| Mining, Quarrying, & Extraction | 0 (0.0%) | 0 (0.0%) |
| Construction | 130 (75.6%) | 42 (24.4%) |
| Manufacturing | 269 (81.0%) | 63 (19.0%) |
| Wholesale Trade | 36 (57.1%) | 27 (42.9%) |
| Retail Trade | 250 (69.1%) | 112 (30.9%) |
| Transportation & Warehousing | 110 (72.9%) | 41 (27.2%) |
| Utilities | 9 (40.9%) | 13 (59.1%) |
| Information | 22 (62.9%) | 13 (37.1%) |
| Finance & Insurance | 0 (0.0%) | 97 (100.0%) |
| Real Estate, Rental & Leasing | 0 (0.0%) | 0 (0.0%) |
| Professional & Scientific | 20 (27.0%) | 54 (73.0%) |
| Enterprise Management | 0 (0.0%) | 0 (0.0%) |
| Administrative & Support | 46 (47.9%) | 50 (52.1%) |
| Educational Services | 45 (35.2%) | 83 (64.8%) |
| Health Care & Social Assistance | 11 (4.1%) | 259 (95.9%) |
| Arts, Entertainment & Recreation | 9 (56.2%) | 7 (43.8%) |
| Accommodation & Food Services | 83 (51.2%) | 79 (48.8%) |
| Public Administration | 42 (40.4%) | 62 (59.6%) |
| Total | 1,133 (49.1%) | 1,172 (50.8%) |
Education in West Jefferson
School Enrollment in West Jefferson
The most common levels of schooling among the 652 students in West Jefferson are elementary school (158 | 24.2%), high school (153 | 23.5%), and middle school (121 | 18.6%).
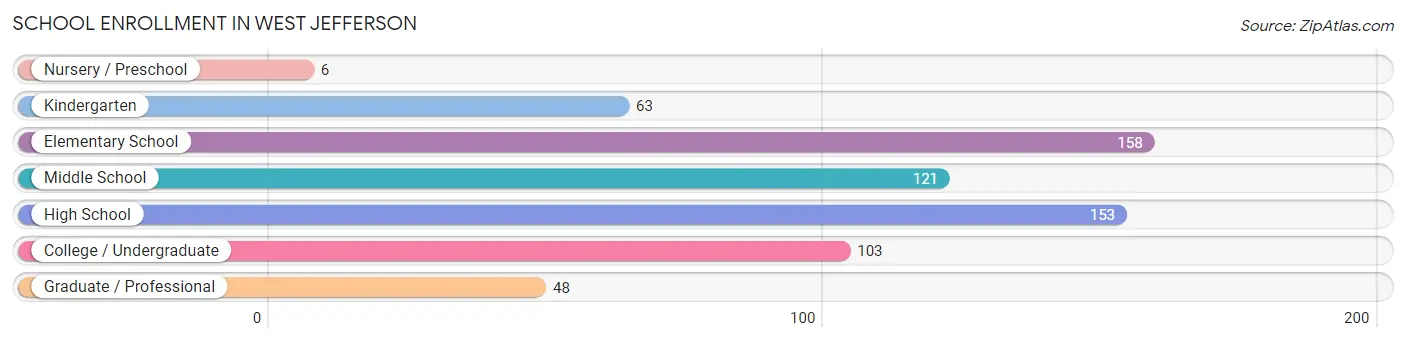
| School Level | # Students | % Students |
| Nursery / Preschool | 6 | 0.9% |
| Kindergarten | 63 | 9.7% |
| Elementary School | 158 | 24.2% |
| Middle School | 121 | 18.6% |
| High School | 153 | 23.5% |
| College / Undergraduate | 103 | 15.8% |
| Graduate / Professional | 48 | 7.4% |
| Total | 652 | 100.0% |
School Enrollment by Age by Funding Source in West Jefferson
Out of a total of 652 students who are enrolled in schools in West Jefferson, 141 (21.6%) attend a private institution, while the remaining 511 (78.4%) are enrolled in public schools. The age group of 35 years and over has the highest likelihood of being enrolled in private schools, with 25 (51.0% in the age bracket) enrolled. Conversely, the age group of 3 to 4 year olds has the lowest likelihood of being enrolled in a private school, with 6 (100.0% in the age bracket) attending a public institution.
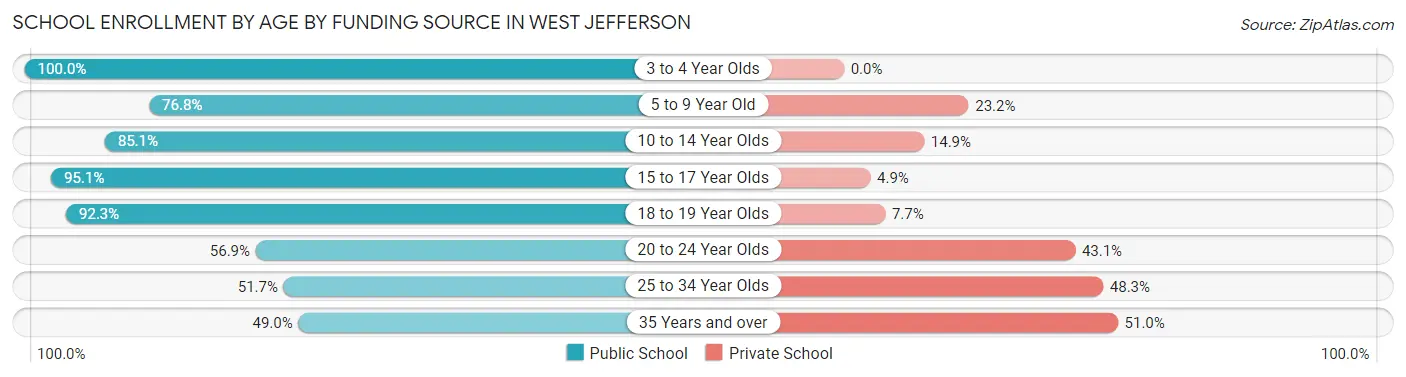
| Age Bracket | Public School | Private School |
| 3 to 4 Year Olds | 6 (100.0%) | 0 (0.0%) |
| 5 to 9 Year Old | 129 (76.8%) | 39 (23.2%) |
| 10 to 14 Year Olds | 148 (85.1%) | 26 (14.9%) |
| 15 to 17 Year Olds | 116 (95.1%) | 6 (4.9%) |
| 18 to 19 Year Olds | 36 (92.3%) | 3 (7.7%) |
| 20 to 24 Year Olds | 37 (56.9%) | 28 (43.1%) |
| 25 to 34 Year Olds | 15 (51.7%) | 14 (48.3%) |
| 35 Years and over | 24 (49.0%) | 25 (51.0%) |
| Total | 511 (78.4%) | 141 (21.6%) |
Educational Attainment by Field of Study in West Jefferson
Education (162 | 35.3%), communications (61 | 13.3%), business (56 | 12.2%), science & technology (53 | 11.6%), and engineering (45 | 9.8%) are the most common fields of study among 459 individuals in West Jefferson who have obtained a bachelor's degree or higher.
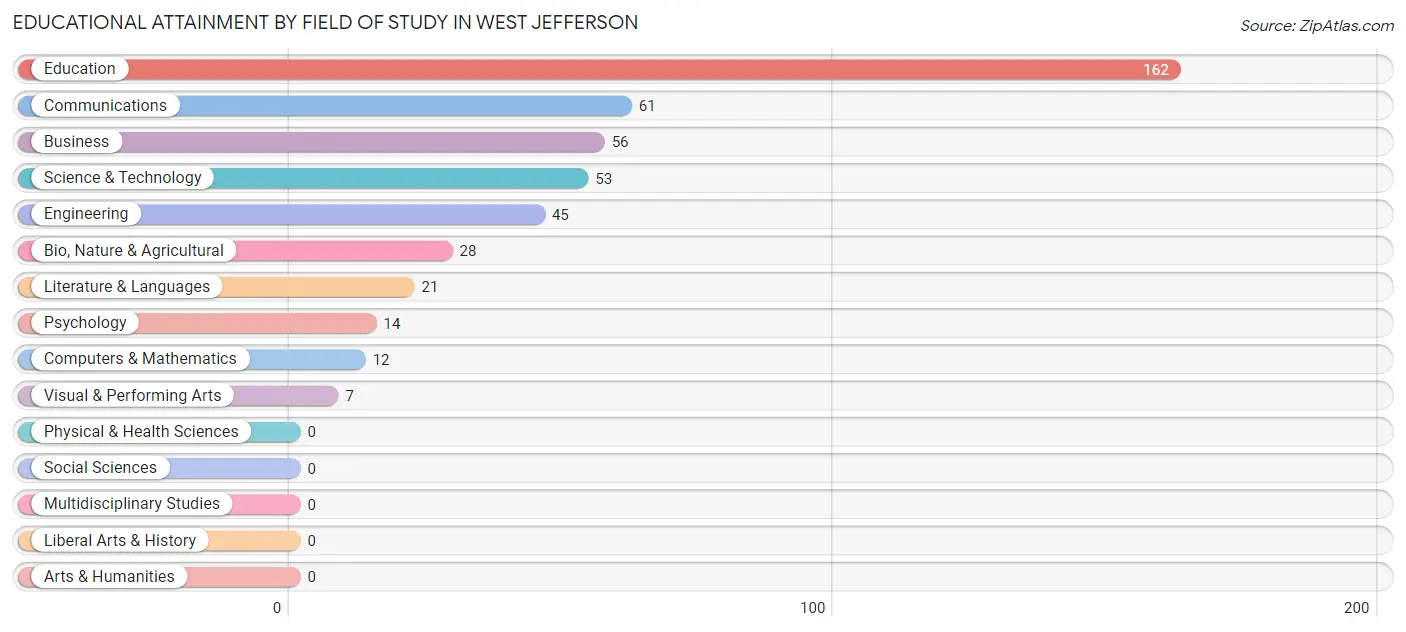
| Field of Study | # Graduates | % Graduates |
| Computers & Mathematics | 12 | 2.6% |
| Bio, Nature & Agricultural | 28 | 6.1% |
| Physical & Health Sciences | 0 | 0.0% |
| Psychology | 14 | 3.0% |
| Social Sciences | 0 | 0.0% |
| Engineering | 45 | 9.8% |
| Multidisciplinary Studies | 0 | 0.0% |
| Science & Technology | 53 | 11.6% |
| Business | 56 | 12.2% |
| Education | 162 | 35.3% |
| Literature & Languages | 21 | 4.6% |
| Liberal Arts & History | 0 | 0.0% |
| Visual & Performing Arts | 7 | 1.5% |
| Communications | 61 | 13.3% |
| Arts & Humanities | 0 | 0.0% |
| Total | 459 | 100.0% |
Transportation & Commute in West Jefferson
Vehicle Availability by Sex in West Jefferson
The most prevalent vehicle ownership categories in West Jefferson are males with 2 vehicles (546, accounting for 48.8%) and females with 2 vehicles (461, making up 48.7%).
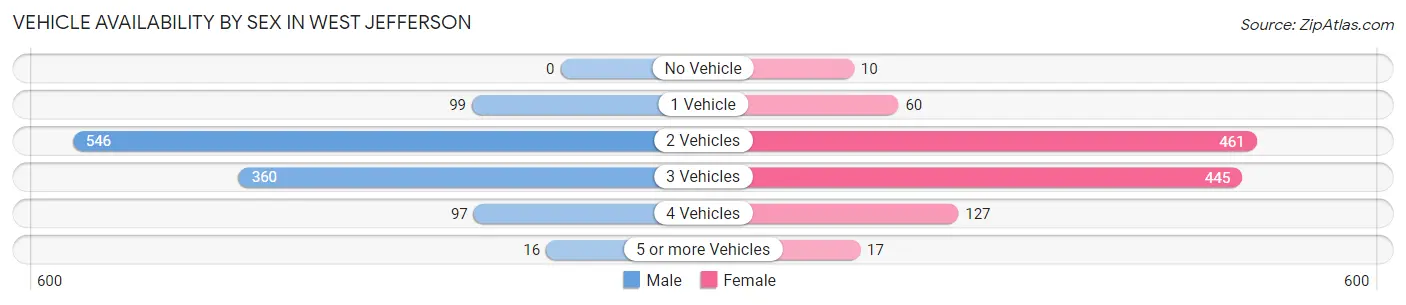
| Vehicles Available | Male | Female |
| No Vehicle | 0 (0.0%) | 10 (0.9%) |
| 1 Vehicle | 99 (8.9%) | 60 (5.4%) |
| 2 Vehicles | 546 (48.8%) | 461 (41.2%) |
| 3 Vehicles | 360 (32.2%) | 445 (39.7%) |
| 4 Vehicles | 97 (8.7%) | 127 (11.3%) |
| 5 or more Vehicles | 16 (1.4%) | 17 (1.5%) |
| Total | 1,118 (100.0%) | 1,120 (100.0%) |
Commute Time in West Jefferson
The most frequently occuring commute durations in West Jefferson are 30 to 34 minutes (526 commuters, 25.2%), 20 to 24 minutes (367 commuters, 17.6%), and 25 to 29 minutes (269 commuters, 12.9%).
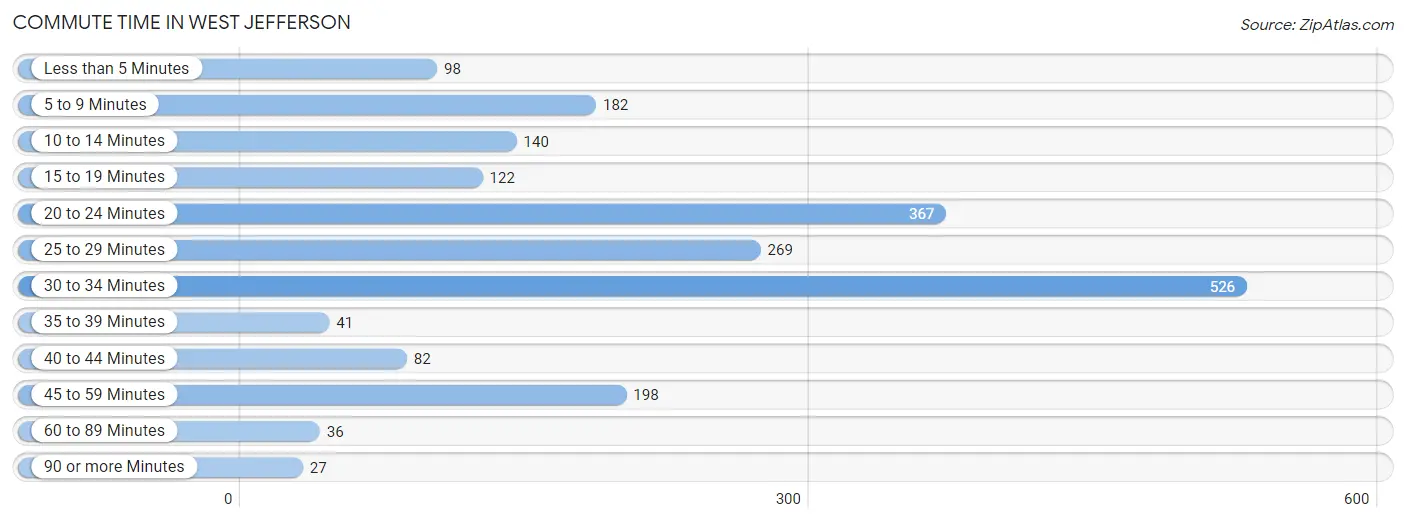
| Commute Time | # Commuters | % Commuters |
| Less than 5 Minutes | 98 | 4.7% |
| 5 to 9 Minutes | 182 | 8.7% |
| 10 to 14 Minutes | 140 | 6.7% |
| 15 to 19 Minutes | 122 | 5.8% |
| 20 to 24 Minutes | 367 | 17.6% |
| 25 to 29 Minutes | 269 | 12.9% |
| 30 to 34 Minutes | 526 | 25.2% |
| 35 to 39 Minutes | 41 | 2.0% |
| 40 to 44 Minutes | 82 | 3.9% |
| 45 to 59 Minutes | 198 | 9.5% |
| 60 to 89 Minutes | 36 | 1.7% |
| 90 or more Minutes | 27 | 1.3% |
Commute Time by Sex in West Jefferson
The most common commute times in West Jefferson are 30 to 34 minutes (231 commuters, 20.8%) for males and 30 to 34 minutes (295 commuters, 30.1%) for females.
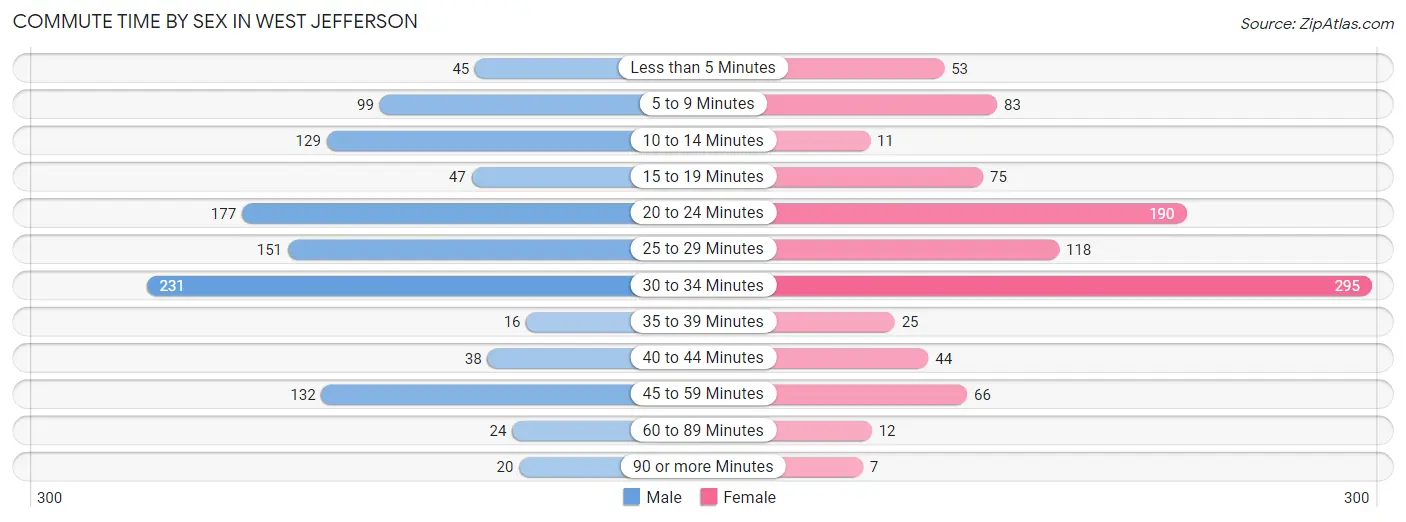
| Commute Time | Male | Female |
| Less than 5 Minutes | 45 (4.1%) | 53 (5.4%) |
| 5 to 9 Minutes | 99 (8.9%) | 83 (8.5%) |
| 10 to 14 Minutes | 129 (11.6%) | 11 (1.1%) |
| 15 to 19 Minutes | 47 (4.2%) | 75 (7.7%) |
| 20 to 24 Minutes | 177 (16.0%) | 190 (19.4%) |
| 25 to 29 Minutes | 151 (13.6%) | 118 (12.0%) |
| 30 to 34 Minutes | 231 (20.8%) | 295 (30.1%) |
| 35 to 39 Minutes | 16 (1.4%) | 25 (2.5%) |
| 40 to 44 Minutes | 38 (3.4%) | 44 (4.5%) |
| 45 to 59 Minutes | 132 (11.9%) | 66 (6.7%) |
| 60 to 89 Minutes | 24 (2.2%) | 12 (1.2%) |
| 90 or more Minutes | 20 (1.8%) | 7 (0.7%) |
Time of Departure to Work by Sex in West Jefferson
The most frequent times of departure to work in West Jefferson are 6:00 AM to 6:29 AM (142, 12.8%) for males and 6:30 AM to 6:59 AM (232, 23.7%) for females.
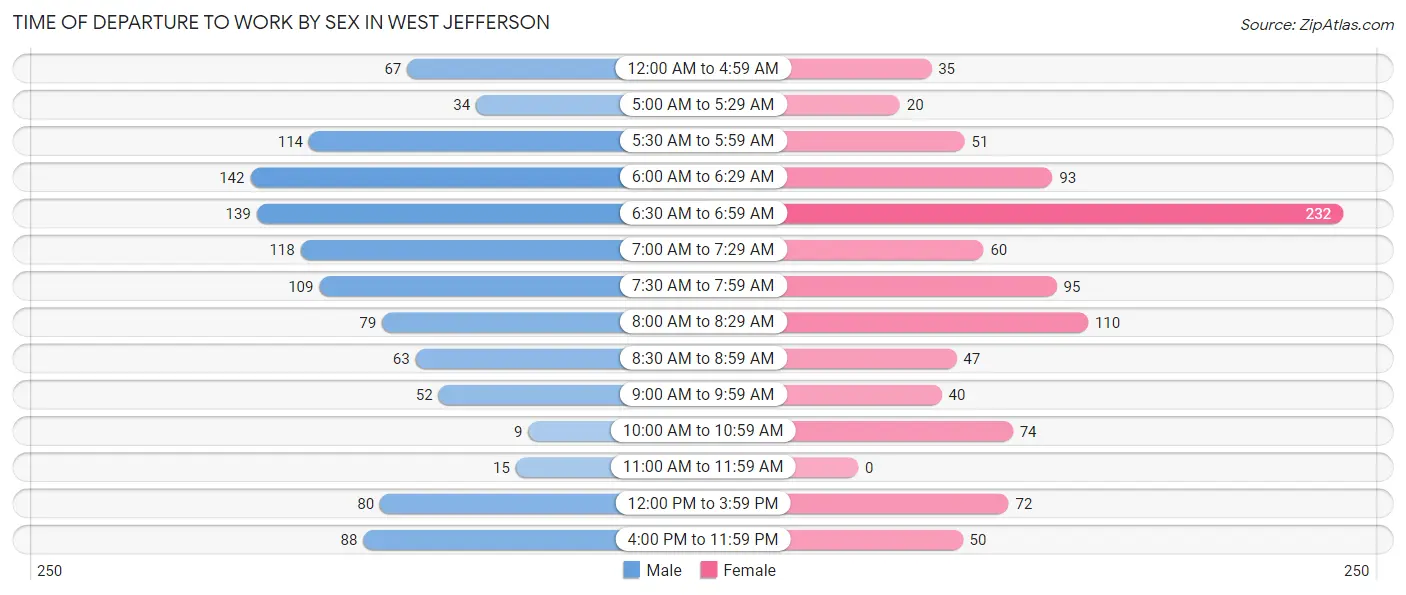
| Time of Departure | Male | Female |
| 12:00 AM to 4:59 AM | 67 (6.0%) | 35 (3.6%) |
| 5:00 AM to 5:29 AM | 34 (3.1%) | 20 (2.0%) |
| 5:30 AM to 5:59 AM | 114 (10.3%) | 51 (5.2%) |
| 6:00 AM to 6:29 AM | 142 (12.8%) | 93 (9.5%) |
| 6:30 AM to 6:59 AM | 139 (12.5%) | 232 (23.7%) |
| 7:00 AM to 7:29 AM | 118 (10.6%) | 60 (6.1%) |
| 7:30 AM to 7:59 AM | 109 (9.8%) | 95 (9.7%) |
| 8:00 AM to 8:29 AM | 79 (7.1%) | 110 (11.2%) |
| 8:30 AM to 8:59 AM | 63 (5.7%) | 47 (4.8%) |
| 9:00 AM to 9:59 AM | 52 (4.7%) | 40 (4.1%) |
| 10:00 AM to 10:59 AM | 9 (0.8%) | 74 (7.6%) |
| 11:00 AM to 11:59 AM | 15 (1.3%) | 0 (0.0%) |
| 12:00 PM to 3:59 PM | 80 (7.2%) | 72 (7.3%) |
| 4:00 PM to 11:59 PM | 88 (7.9%) | 50 (5.1%) |
| Total | 1,109 (100.0%) | 979 (100.0%) |
Housing Occupancy in West Jefferson
Occupancy by Ownership in West Jefferson
Of the total 1,626 dwellings in West Jefferson, owner-occupied units account for 1,217 (74.9%), while renter-occupied units make up 409 (25.2%).
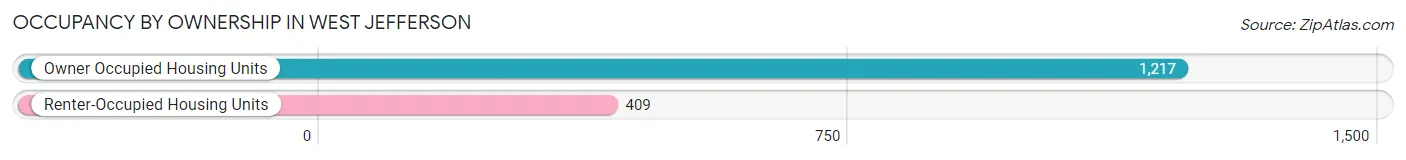
| Occupancy | # Housing Units | % Housing Units |
| Owner Occupied Housing Units | 1,217 | 74.9% |
| Renter-Occupied Housing Units | 409 | 25.2% |
| Total Occupied Housing Units | 1,626 | 100.0% |
Occupancy by Household Size in West Jefferson
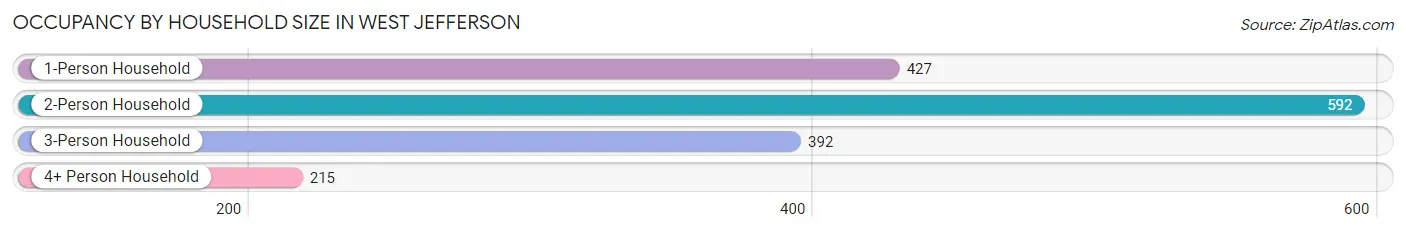
| Household Size | # Housing Units | % Housing Units |
| 1-Person Household | 427 | 26.3% |
| 2-Person Household | 592 | 36.4% |
| 3-Person Household | 392 | 24.1% |
| 4+ Person Household | 215 | 13.2% |
| Total Housing Units | 1,626 | 100.0% |
Occupancy by Ownership by Household Size in West Jefferson
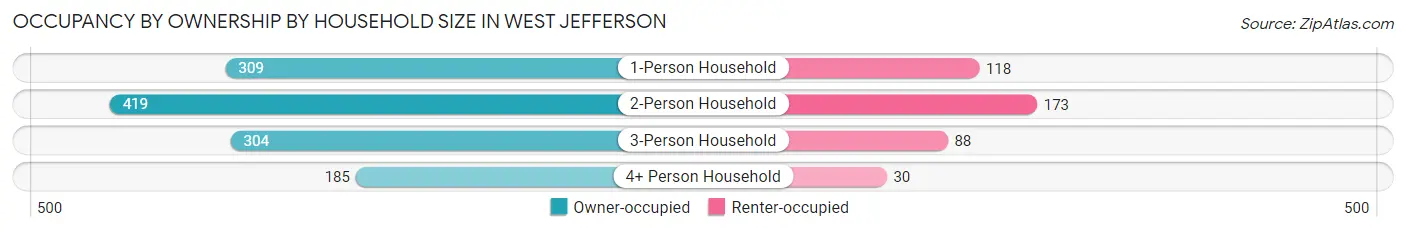
| Household Size | Owner-occupied | Renter-occupied |
| 1-Person Household | 309 (72.4%) | 118 (27.6%) |
| 2-Person Household | 419 (70.8%) | 173 (29.2%) |
| 3-Person Household | 304 (77.5%) | 88 (22.5%) |
| 4+ Person Household | 185 (86.1%) | 30 (14.0%) |
| Total Housing Units | 1,217 (74.9%) | 409 (25.2%) |
Occupancy by Educational Attainment in West Jefferson
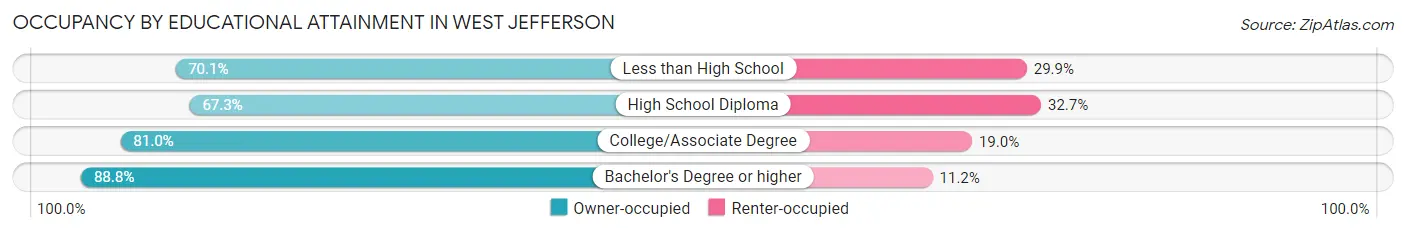
| Household Size | Owner-occupied | Renter-occupied |
| Less than High School | 54 (70.1%) | 23 (29.9%) |
| High School Diploma | 554 (67.3%) | 269 (32.7%) |
| College/Associate Degree | 371 (81.0%) | 87 (19.0%) |
| Bachelor's Degree or higher | 238 (88.8%) | 30 (11.2%) |
Occupancy by Age of Householder in West Jefferson
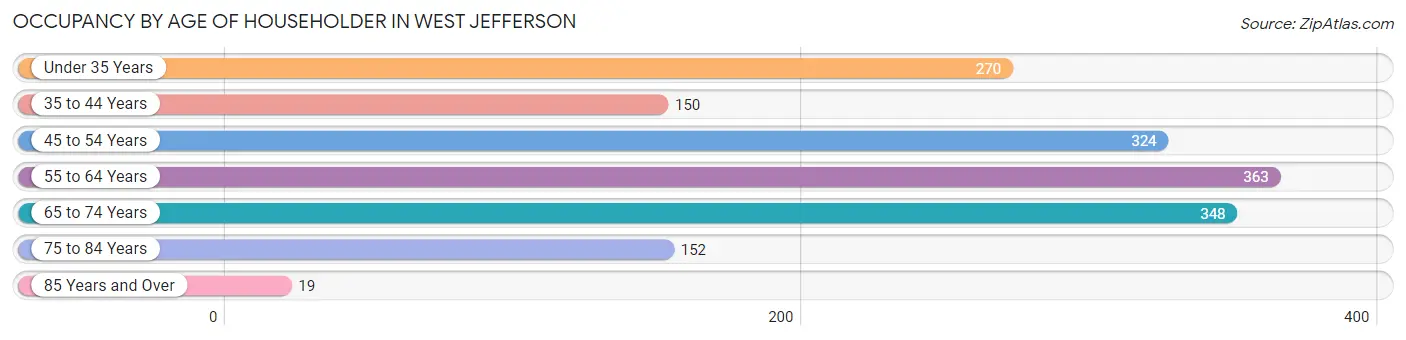
| Age Bracket | # Households | % Households |
| Under 35 Years | 270 | 16.6% |
| 35 to 44 Years | 150 | 9.2% |
| 45 to 54 Years | 324 | 19.9% |
| 55 to 64 Years | 363 | 22.3% |
| 65 to 74 Years | 348 | 21.4% |
| 75 to 84 Years | 152 | 9.3% |
| 85 Years and Over | 19 | 1.2% |
| Total | 1,626 | 100.0% |
Housing Finances in West Jefferson
Median Income by Occupancy in West Jefferson
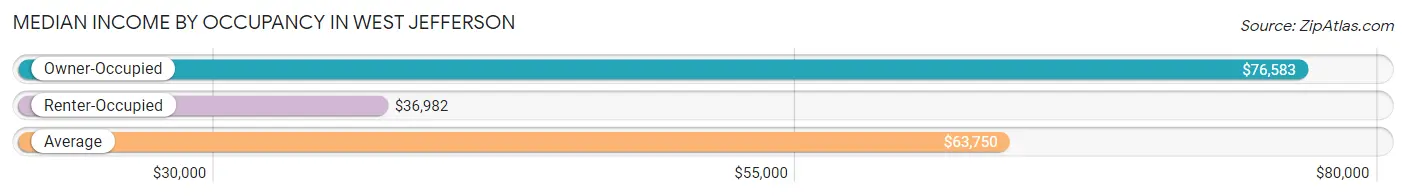
| Occupancy Type | # Households | Median Income |
| Owner-Occupied | 1,217 (74.9%) | $76,583 |
| Renter-Occupied | 409 (25.2%) | $36,982 |
| Average | 1,626 (100.0%) | $63,750 |
Occupancy by Householder Income Bracket in West Jefferson
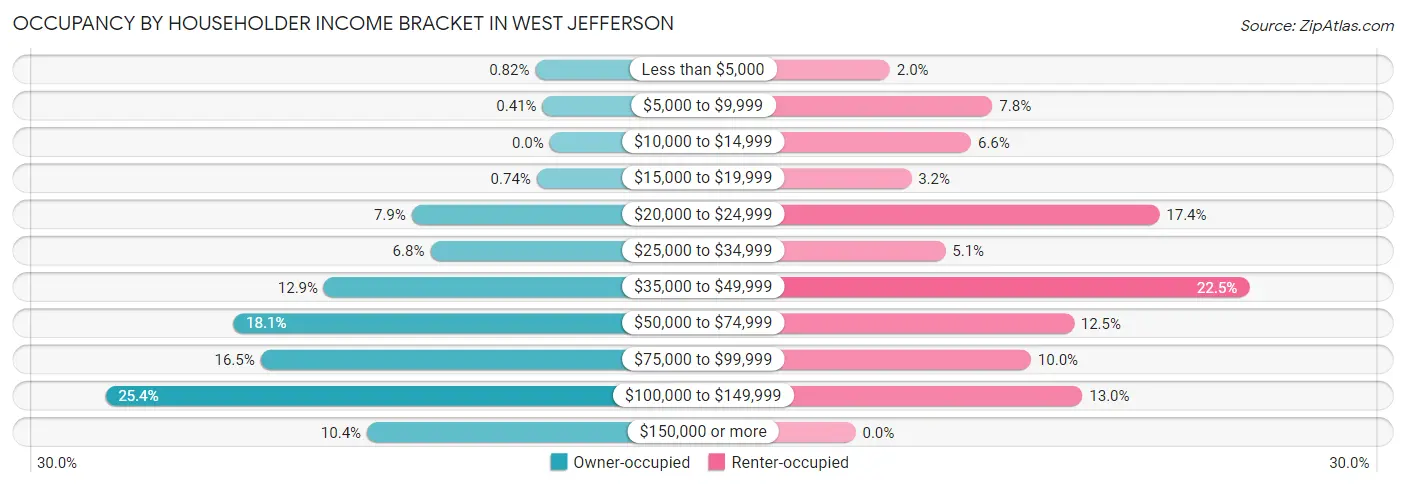
| Income Bracket | Owner-occupied | Renter-occupied |
| Less than $5,000 | 10 (0.8%) | 8 (2.0%) |
| $5,000 to $9,999 | 5 (0.4%) | 32 (7.8%) |
| $10,000 to $14,999 | 0 (0.0%) | 27 (6.6%) |
| $15,000 to $19,999 | 9 (0.7%) | 13 (3.2%) |
| $20,000 to $24,999 | 96 (7.9%) | 71 (17.4%) |
| $25,000 to $34,999 | 83 (6.8%) | 21 (5.1%) |
| $35,000 to $49,999 | 157 (12.9%) | 92 (22.5%) |
| $50,000 to $74,999 | 220 (18.1%) | 51 (12.5%) |
| $75,000 to $99,999 | 201 (16.5%) | 41 (10.0%) |
| $100,000 to $149,999 | 309 (25.4%) | 53 (13.0%) |
| $150,000 or more | 127 (10.4%) | 0 (0.0%) |
| Total | 1,217 (100.0%) | 409 (100.0%) |
Monthly Housing Cost Tiers in West Jefferson
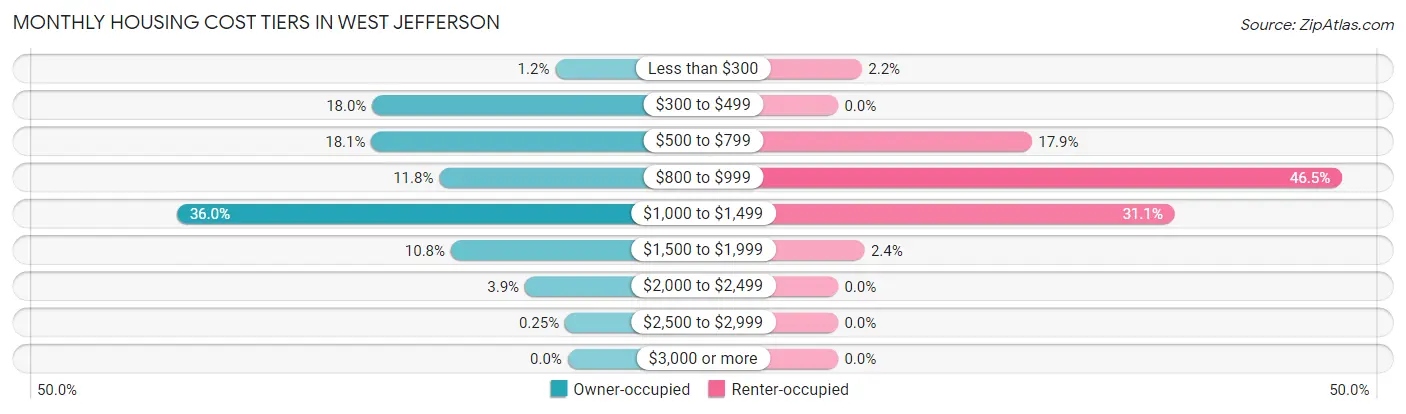
| Monthly Cost | Owner-occupied | Renter-occupied |
| Less than $300 | 14 (1.1%) | 9 (2.2%) |
| $300 to $499 | 219 (18.0%) | 0 (0.0%) |
| $500 to $799 | 220 (18.1%) | 73 (17.8%) |
| $800 to $999 | 144 (11.8%) | 190 (46.5%) |
| $1,000 to $1,499 | 438 (36.0%) | 127 (31.0%) |
| $1,500 to $1,999 | 131 (10.8%) | 10 (2.4%) |
| $2,000 to $2,499 | 48 (3.9%) | 0 (0.0%) |
| $2,500 to $2,999 | 3 (0.3%) | 0 (0.0%) |
| $3,000 or more | 0 (0.0%) | 0 (0.0%) |
| Total | 1,217 (100.0%) | 409 (100.0%) |
Physical Housing Characteristics in West Jefferson
Housing Structures in West Jefferson
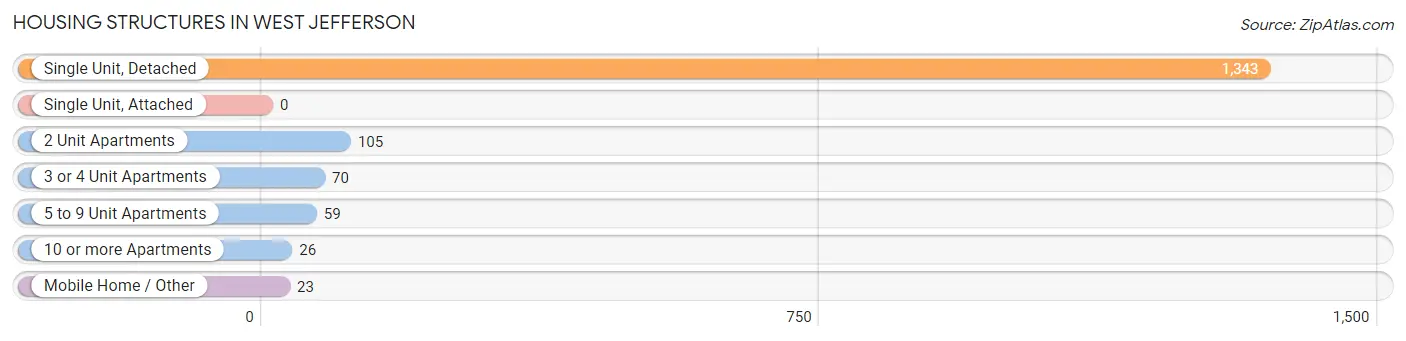
| Structure Type | # Housing Units | % Housing Units |
| Single Unit, Detached | 1,343 | 82.6% |
| Single Unit, Attached | 0 | 0.0% |
| 2 Unit Apartments | 105 | 6.5% |
| 3 or 4 Unit Apartments | 70 | 4.3% |
| 5 to 9 Unit Apartments | 59 | 3.6% |
| 10 or more Apartments | 26 | 1.6% |
| Mobile Home / Other | 23 | 1.4% |
| Total | 1,626 | 100.0% |
Housing Structures by Occupancy in West Jefferson
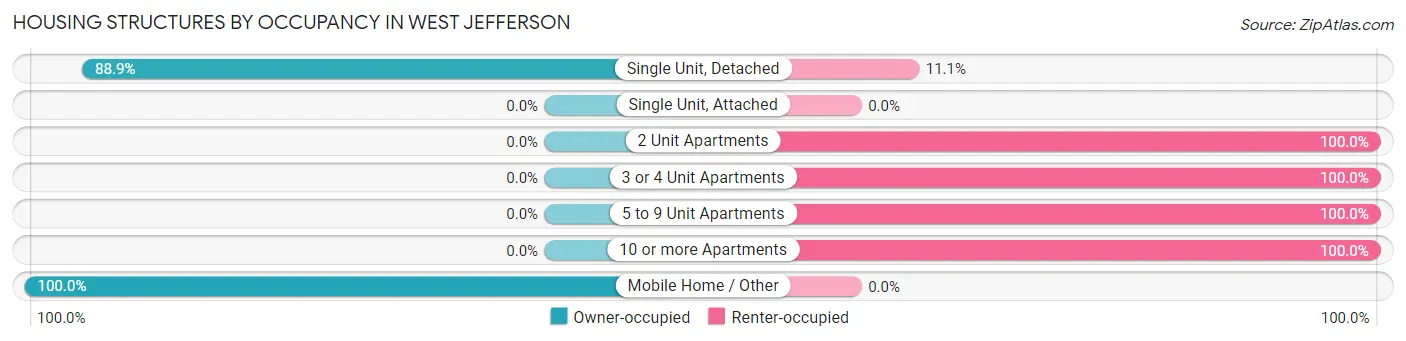
| Structure Type | Owner-occupied | Renter-occupied |
| Single Unit, Detached | 1,194 (88.9%) | 149 (11.1%) |
| Single Unit, Attached | 0 (0.0%) | 0 (0.0%) |
| 2 Unit Apartments | 0 (0.0%) | 105 (100.0%) |
| 3 or 4 Unit Apartments | 0 (0.0%) | 70 (100.0%) |
| 5 to 9 Unit Apartments | 0 (0.0%) | 59 (100.0%) |
| 10 or more Apartments | 0 (0.0%) | 26 (100.0%) |
| Mobile Home / Other | 23 (100.0%) | 0 (0.0%) |
| Total | 1,217 (74.9%) | 409 (25.2%) |
Housing Structures by Number of Rooms in West Jefferson
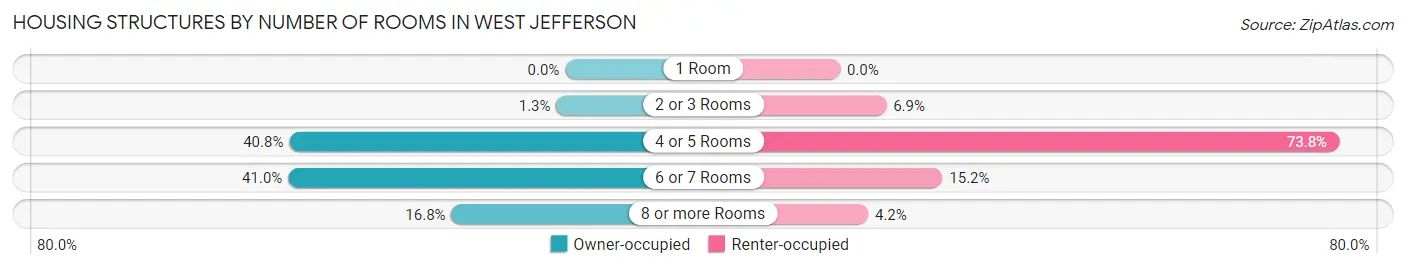
| Number of Rooms | Owner-occupied | Renter-occupied |
| 1 Room | 0 (0.0%) | 0 (0.0%) |
| 2 or 3 Rooms | 16 (1.3%) | 28 (6.9%) |
| 4 or 5 Rooms | 497 (40.8%) | 302 (73.8%) |
| 6 or 7 Rooms | 499 (41.0%) | 62 (15.2%) |
| 8 or more Rooms | 205 (16.8%) | 17 (4.2%) |
| Total | 1,217 (100.0%) | 409 (100.0%) |
Housing Structure by Heating Type in West Jefferson
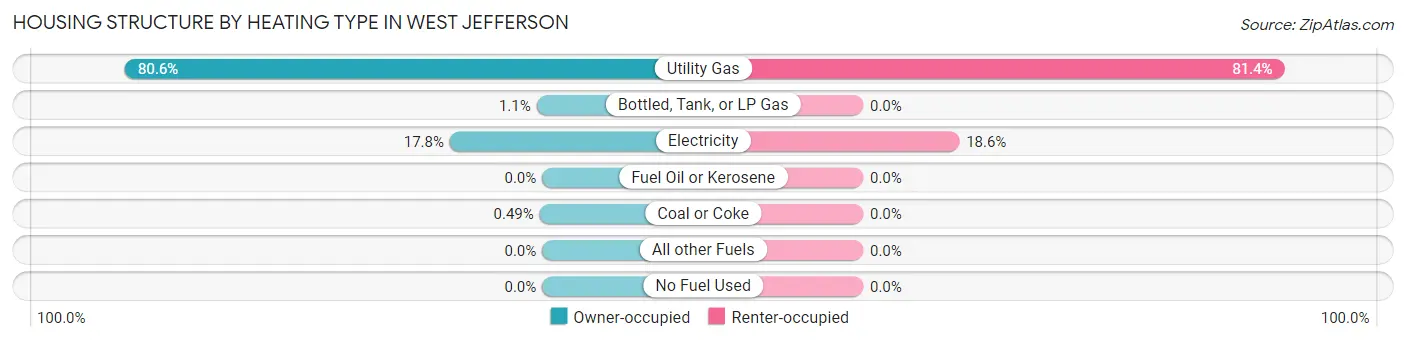
| Heating Type | Owner-occupied | Renter-occupied |
| Utility Gas | 981 (80.6%) | 333 (81.4%) |
| Bottled, Tank, or LP Gas | 13 (1.1%) | 0 (0.0%) |
| Electricity | 217 (17.8%) | 76 (18.6%) |
| Fuel Oil or Kerosene | 0 (0.0%) | 0 (0.0%) |
| Coal or Coke | 6 (0.5%) | 0 (0.0%) |
| All other Fuels | 0 (0.0%) | 0 (0.0%) |
| No Fuel Used | 0 (0.0%) | 0 (0.0%) |
| Total | 1,217 (100.0%) | 409 (100.0%) |
Household Vehicle Usage in West Jefferson
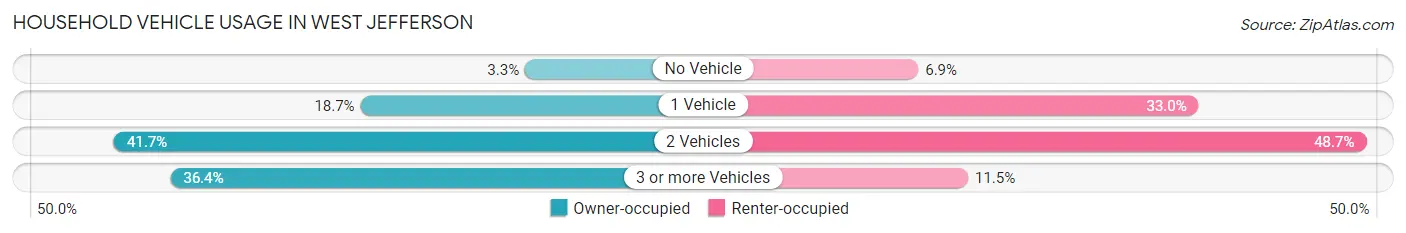
| Vehicles per Household | Owner-occupied | Renter-occupied |
| No Vehicle | 40 (3.3%) | 28 (6.9%) |
| 1 Vehicle | 227 (18.6%) | 135 (33.0%) |
| 2 Vehicles | 507 (41.7%) | 199 (48.7%) |
| 3 or more Vehicles | 443 (36.4%) | 47 (11.5%) |
| Total | 1,217 (100.0%) | 409 (100.0%) |
Real Estate & Mortgages in West Jefferson
Real Estate and Mortgage Overview in West Jefferson
| Characteristic | Without Mortgage | With Mortgage |
| Housing Units | 371 | 846 |
| Median Property Value | $124,900 | $165,000 |
| Median Household Income | $56,518 | $105 |
| Monthly Housing Costs | $472 | $0 |
| Real Estate Taxes | $1,994 | $17 |
Property Value by Mortgage Status in West Jefferson
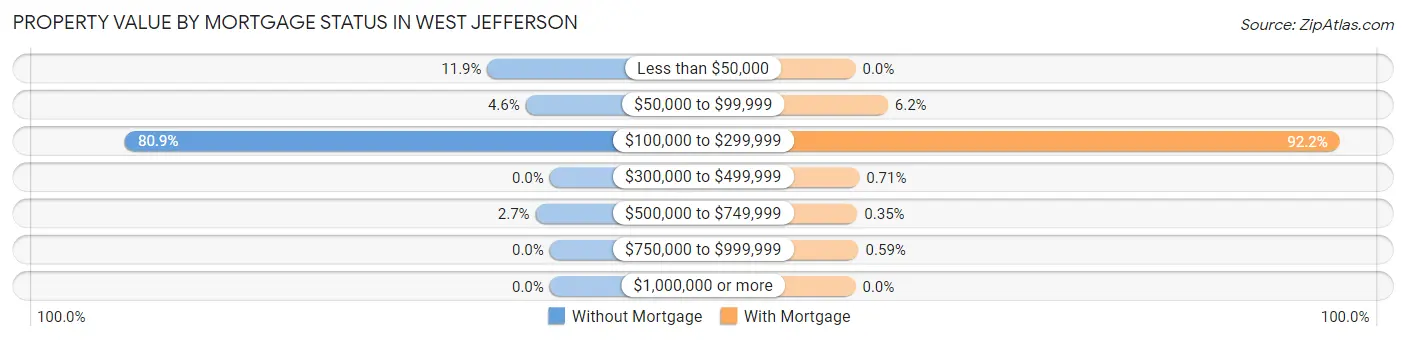
| Property Value | Without Mortgage | With Mortgage |
| Less than $50,000 | 44 (11.9%) | 0 (0.0%) |
| $50,000 to $99,999 | 17 (4.6%) | 52 (6.1%) |
| $100,000 to $299,999 | 300 (80.9%) | 780 (92.2%) |
| $300,000 to $499,999 | 0 (0.0%) | 6 (0.7%) |
| $500,000 to $749,999 | 10 (2.7%) | 3 (0.4%) |
| $750,000 to $999,999 | 0 (0.0%) | 5 (0.6%) |
| $1,000,000 or more | 0 (0.0%) | 0 (0.0%) |
| Total | 371 (100.0%) | 846 (100.0%) |
Household Income by Mortgage Status in West Jefferson
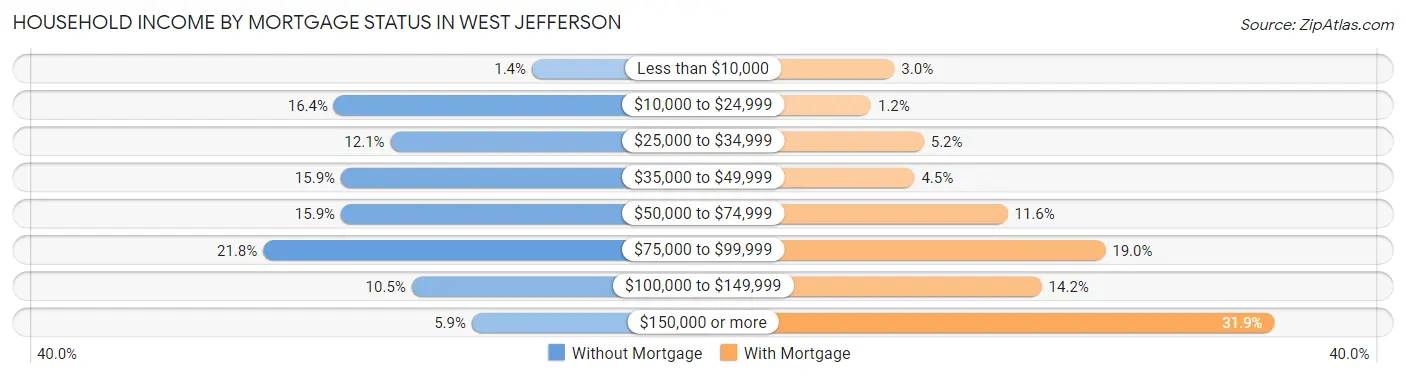
| Household Income | Without Mortgage | With Mortgage |
| Less than $10,000 | 5 (1.3%) | 25 (3.0%) |
| $10,000 to $24,999 | 61 (16.4%) | 10 (1.2%) |
| $25,000 to $34,999 | 45 (12.1%) | 44 (5.2%) |
| $35,000 to $49,999 | 59 (15.9%) | 38 (4.5%) |
| $50,000 to $74,999 | 59 (15.9%) | 98 (11.6%) |
| $75,000 to $99,999 | 81 (21.8%) | 161 (19.0%) |
| $100,000 to $149,999 | 39 (10.5%) | 120 (14.2%) |
| $150,000 or more | 22 (5.9%) | 270 (31.9%) |
| Total | 371 (100.0%) | 846 (100.0%) |
Property Value to Household Income Ratio in West Jefferson
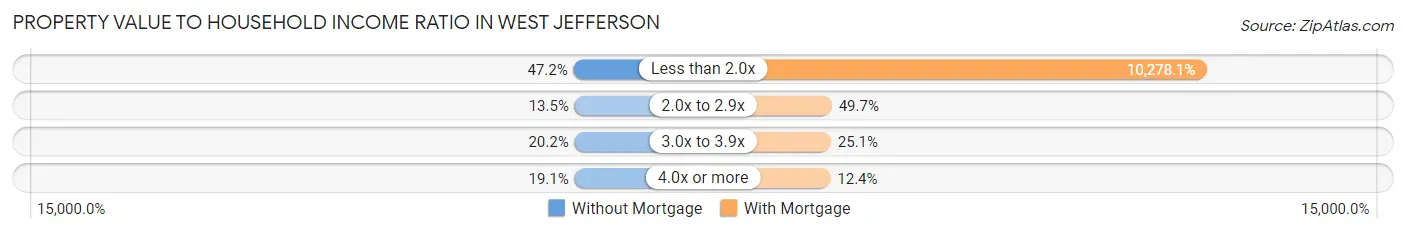
| Value-to-Income Ratio | Without Mortgage | With Mortgage |
| Less than 2.0x | 175 (47.2%) | 86,953 (10,278.1%) |
| 2.0x to 2.9x | 50 (13.5%) | 420 (49.6%) |
| 3.0x to 3.9x | 75 (20.2%) | 212 (25.1%) |
| 4.0x or more | 71 (19.1%) | 105 (12.4%) |
| Total | 371 (100.0%) | 846 (100.0%) |
Real Estate Taxes by Mortgage Status in West Jefferson
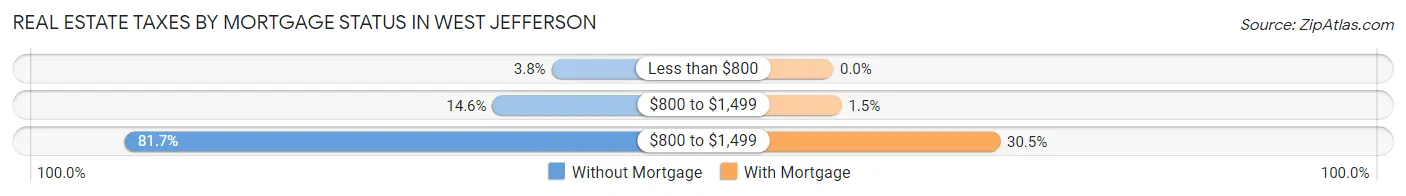
| Property Taxes | Without Mortgage | With Mortgage |
| Less than $800 | 14 (3.8%) | 0 (0.0%) |
| $800 to $1,499 | 54 (14.6%) | 13 (1.5%) |
| $800 to $1,499 | 303 (81.7%) | 258 (30.5%) |
| Total | 371 (100.0%) | 846 (100.0%) |
Health & Disability in West Jefferson
Health Insurance Coverage by Age in West Jefferson
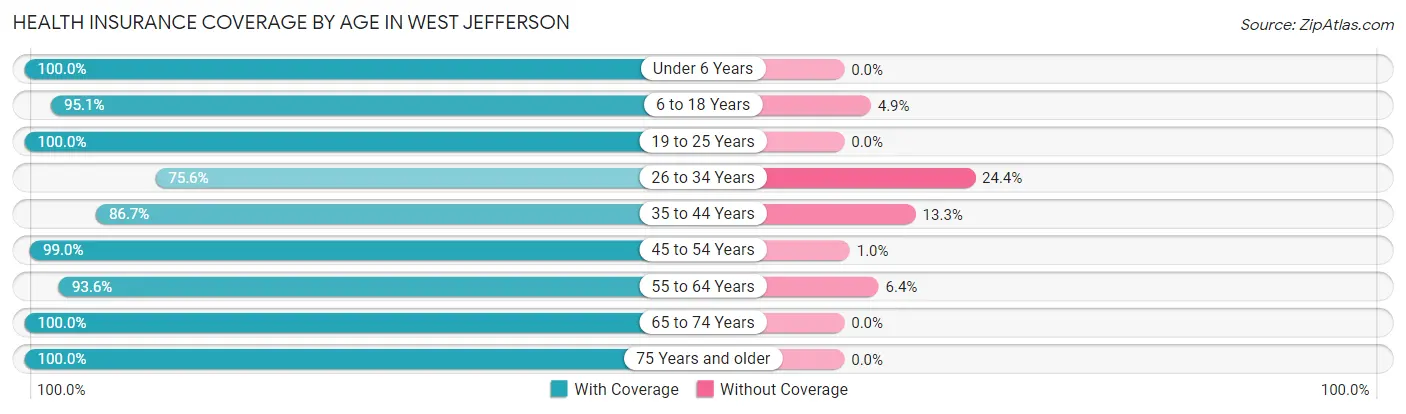
| Age Bracket | With Coverage | Without Coverage |
| Under 6 Years | 220 (100.0%) | 0 (0.0%) |
| 6 to 18 Years | 443 (95.1%) | 23 (4.9%) |
| 19 to 25 Years | 403 (100.0%) | 0 (0.0%) |
| 26 to 34 Years | 527 (75.6%) | 170 (24.4%) |
| 35 to 44 Years | 254 (86.7%) | 39 (13.3%) |
| 45 to 54 Years | 581 (99.0%) | 6 (1.0%) |
| 55 to 64 Years | 614 (93.6%) | 42 (6.4%) |
| 65 to 74 Years | 533 (100.0%) | 0 (0.0%) |
| 75 Years and older | 237 (100.0%) | 0 (0.0%) |
| Total | 3,812 (93.2%) | 280 (6.8%) |
Health Insurance Coverage by Citizenship Status in West Jefferson
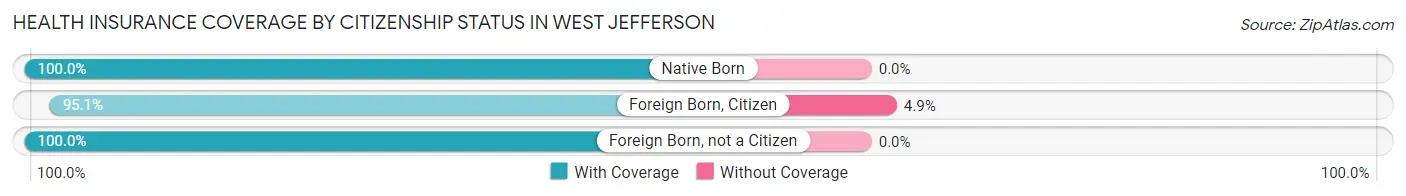
| Citizenship Status | With Coverage | Without Coverage |
| Native Born | 220 (100.0%) | 0 (0.0%) |
| Foreign Born, Citizen | 443 (95.1%) | 23 (4.9%) |
| Foreign Born, not a Citizen | 403 (100.0%) | 0 (0.0%) |
Health Insurance Coverage by Household Income in West Jefferson
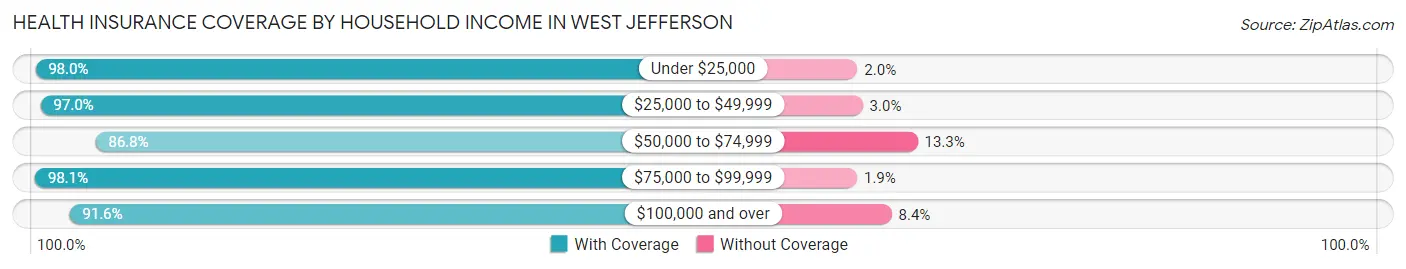
| Household Income | With Coverage | Without Coverage |
| Under $25,000 | 493 (98.0%) | 10 (2.0%) |
| $25,000 to $49,999 | 556 (97.0%) | 17 (3.0%) |
| $50,000 to $74,999 | 661 (86.8%) | 101 (13.3%) |
| $75,000 to $99,999 | 562 (98.1%) | 11 (1.9%) |
| $100,000 and over | 1,540 (91.6%) | 141 (8.4%) |
Public vs Private Health Insurance Coverage by Age in West Jefferson
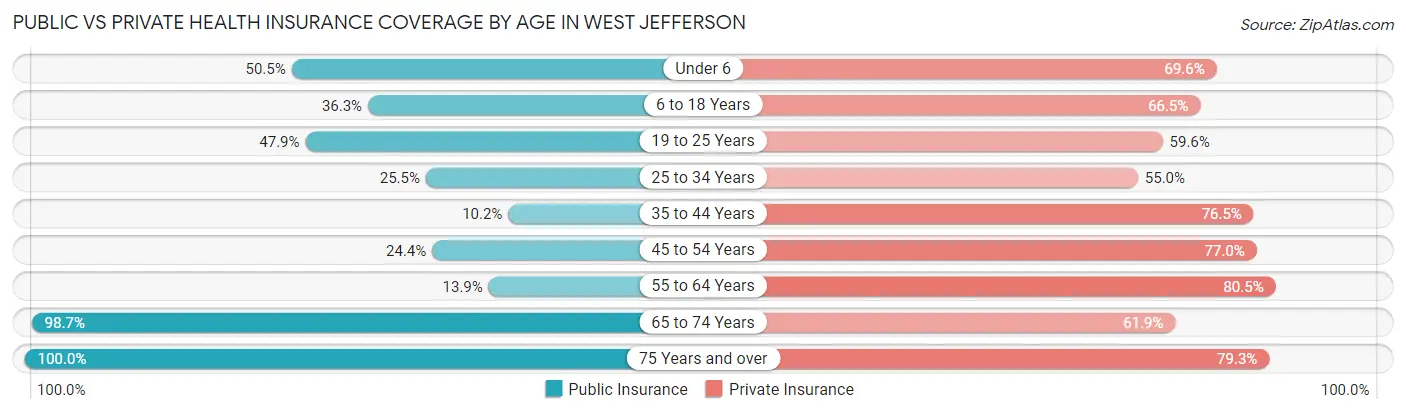
| Age Bracket | Public Insurance | Private Insurance |
| Under 6 | 111 (50.4%) | 153 (69.6%) |
| 6 to 18 Years | 169 (36.3%) | 310 (66.5%) |
| 19 to 25 Years | 193 (47.9%) | 240 (59.6%) |
| 25 to 34 Years | 178 (25.5%) | 383 (54.9%) |
| 35 to 44 Years | 30 (10.2%) | 224 (76.4%) |
| 45 to 54 Years | 143 (24.4%) | 452 (77.0%) |
| 55 to 64 Years | 91 (13.9%) | 528 (80.5%) |
| 65 to 74 Years | 526 (98.7%) | 330 (61.9%) |
| 75 Years and over | 237 (100.0%) | 188 (79.3%) |
| Total | 1,678 (41.0%) | 2,808 (68.6%) |
Disability Status by Sex by Age in West Jefferson

| Age Bracket | Male | Female |
| Under 5 Years | 0 (0.0%) | 0 (0.0%) |
| 5 to 17 Years | 0 (0.0%) | 0 (0.0%) |
| 18 to 34 Years | 8 (1.7%) | 48 (7.3%) |
| 35 to 64 Years | 72 (10.0%) | 226 (27.8%) |
| 65 to 74 Years | 50 (17.4%) | 57 (23.3%) |
| 75 Years and over | 33 (38.8%) | 57 (37.5%) |
Disability Class by Sex by Age in West Jefferson
Disability Class: Hearing Difficulty
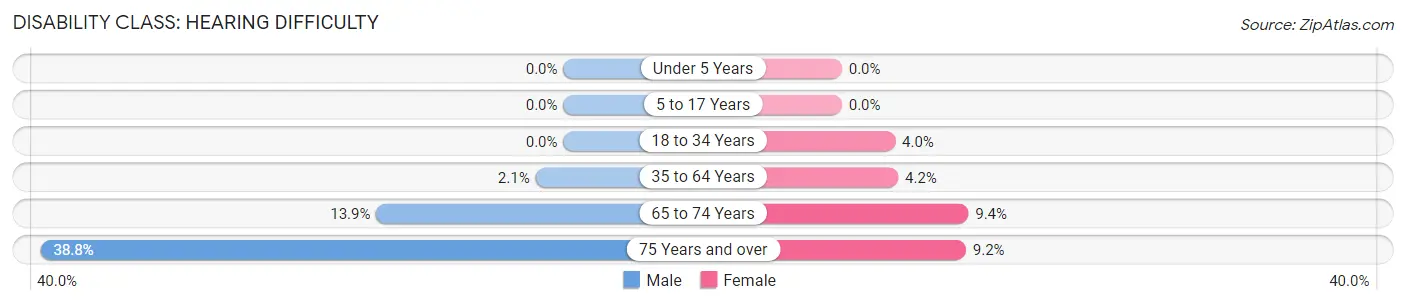
| Age Bracket | Male | Female |
| Under 5 Years | 0 (0.0%) | 0 (0.0%) |
| 5 to 17 Years | 0 (0.0%) | 0 (0.0%) |
| 18 to 34 Years | 0 (0.0%) | 26 (4.0%) |
| 35 to 64 Years | 15 (2.1%) | 34 (4.2%) |
| 65 to 74 Years | 40 (13.9%) | 23 (9.4%) |
| 75 Years and over | 33 (38.8%) | 14 (9.2%) |
Disability Class: Vision Difficulty
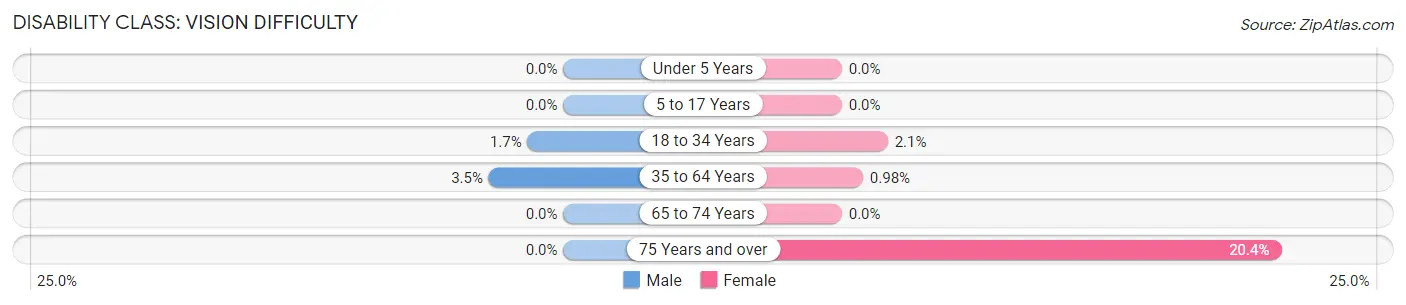
| Age Bracket | Male | Female |
| Under 5 Years | 0 (0.0%) | 0 (0.0%) |
| 5 to 17 Years | 0 (0.0%) | 0 (0.0%) |
| 18 to 34 Years | 8 (1.7%) | 14 (2.1%) |
| 35 to 64 Years | 25 (3.5%) | 8 (1.0%) |
| 65 to 74 Years | 0 (0.0%) | 0 (0.0%) |
| 75 Years and over | 0 (0.0%) | 31 (20.4%) |
Disability Class: Cognitive Difficulty
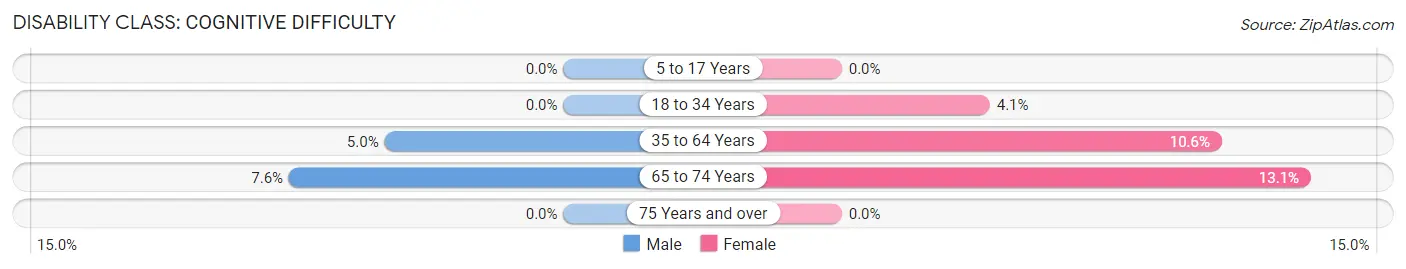
| Age Bracket | Male | Female |
| 5 to 17 Years | 0 (0.0%) | 0 (0.0%) |
| 18 to 34 Years | 0 (0.0%) | 27 (4.1%) |
| 35 to 64 Years | 36 (5.0%) | 86 (10.6%) |
| 65 to 74 Years | 22 (7.6%) | 32 (13.1%) |
| 75 Years and over | 0 (0.0%) | 0 (0.0%) |
Disability Class: Ambulatory Difficulty
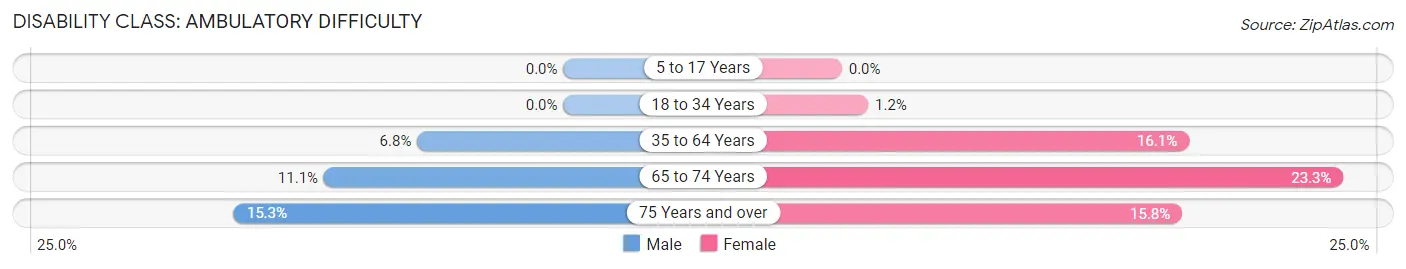
| Age Bracket | Male | Female |
| 5 to 17 Years | 0 (0.0%) | 0 (0.0%) |
| 18 to 34 Years | 0 (0.0%) | 8 (1.2%) |
| 35 to 64 Years | 49 (6.8%) | 131 (16.1%) |
| 65 to 74 Years | 32 (11.1%) | 57 (23.3%) |
| 75 Years and over | 13 (15.3%) | 24 (15.8%) |
Disability Class: Self-Care Difficulty
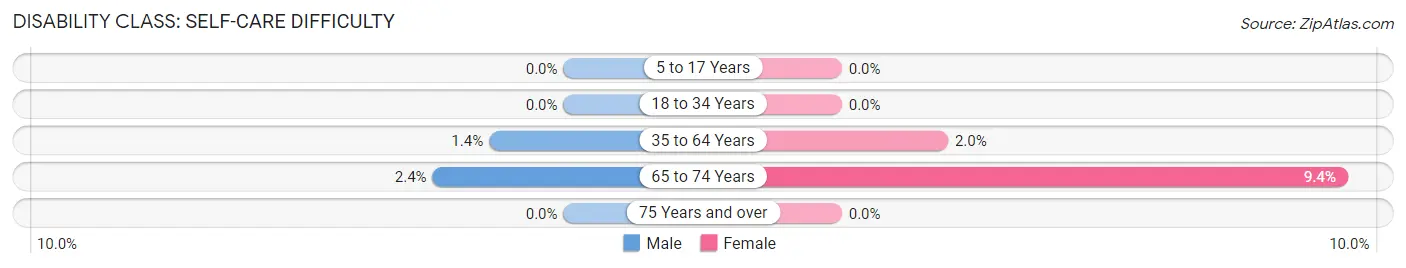
| Age Bracket | Male | Female |
| 5 to 17 Years | 0 (0.0%) | 0 (0.0%) |
| 18 to 34 Years | 0 (0.0%) | 0 (0.0%) |
| 35 to 64 Years | 10 (1.4%) | 16 (2.0%) |
| 65 to 74 Years | 7 (2.4%) | 23 (9.4%) |
| 75 Years and over | 0 (0.0%) | 0 (0.0%) |
Technology Access in West Jefferson
Computing Device Access in West Jefferson
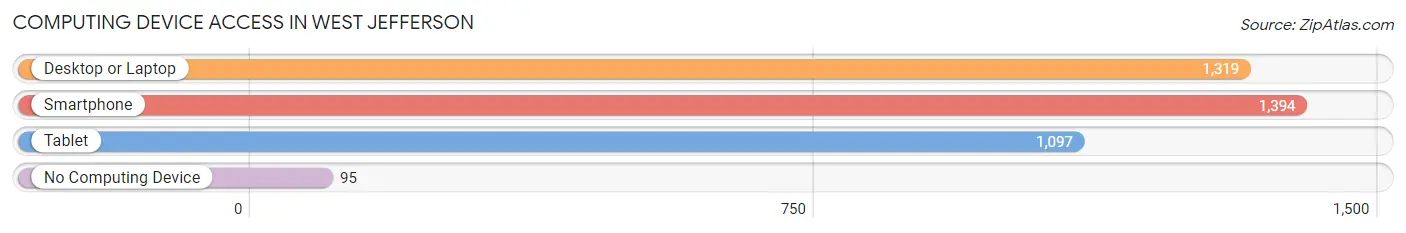
| Device Type | # Households | % Households |
| Desktop or Laptop | 1,319 | 81.1% |
| Smartphone | 1,394 | 85.7% |
| Tablet | 1,097 | 67.5% |
| No Computing Device | 95 | 5.8% |
| Total | 1,626 | 100.0% |
Internet Access in West Jefferson
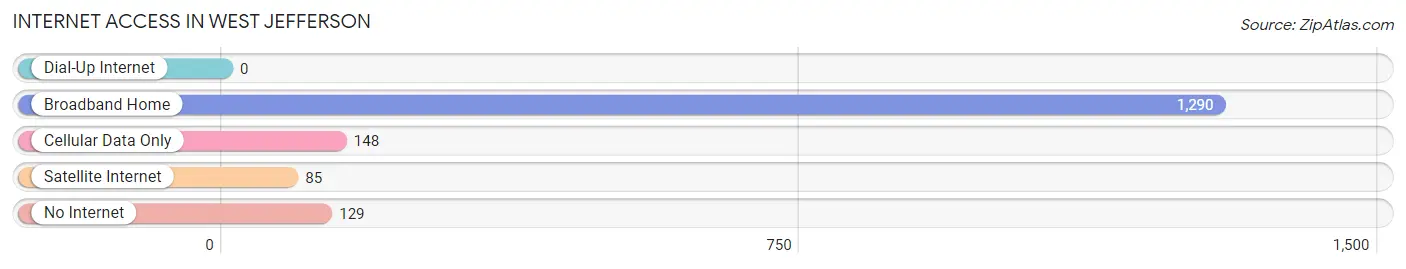
| Internet Type | # Households | % Households |
| Dial-Up Internet | 0 | 0.0% |
| Broadband Home | 1,290 | 79.3% |
| Cellular Data Only | 148 | 9.1% |
| Satellite Internet | 85 | 5.2% |
| No Internet | 129 | 7.9% |
| Total | 1,626 | 100.0% |
West Jefferson Summary
History
West Jefferson, Ohio is a small village located in Madison County, Ohio. It is situated approximately 20 miles west of Columbus, Ohio. The village was founded in 1810 by a group of settlers from Virginia and North Carolina. The village was originally known as Jeffersonville, but the name was changed to West Jefferson in 1817.
The village was an important stop on the Underground Railroad, with many of the local residents helping to hide and transport escaped slaves. The village was also home to a number of prominent abolitionists, including John Rankin and Levi Coffin.
The village was incorporated in 1837 and has since grown to a population of approximately 4,000 people. The village is home to a number of historic buildings, including the West Jefferson Opera House, which was built in 1883.
Geography
West Jefferson is located in Madison County, Ohio, approximately 20 miles west of Columbus. The village is situated in the Scioto River Valley, with the Scioto River running through the village. The village is surrounded by rolling hills and farmland.
The village has a total area of 2.2 square miles, with 0.2 square miles of water. The village is located at an elevation of 890 feet above sea level.
Economy
West Jefferson is a small village with a population of approximately 4,000 people. The village is home to a number of small businesses, including restaurants, retail stores, and professional services. The village is also home to a number of manufacturing companies, including a plastics manufacturer and a metal fabrication company.
The village is home to a number of agricultural businesses, including a dairy farm, a vegetable farm, and a winery. The village is also home to a number of tourist attractions, including the West Jefferson Opera House and the Madison County Historical Society.
Demographics
As of the 2010 census, the population of West Jefferson was 4,072. The racial makeup of the village was 97.2% White, 0.7% African American, 0.2% Native American, 0.3% Asian, 0.1% Pacific Islander, 0.4% from other races, and 1.1% from two or more races. Hispanic or Latino of any race were 1.2% of the population.
The median income for a household in the village was $45,938, and the median income for a family was $51,938. The per capita income for the village was $20,938. About 8.2% of families and 10.2% of the population were below the poverty line, including 14.2% of those under age 18 and 6.2% of those age 65 or over.
Common Questions
What is the Total Population of West Jefferson?
Total Population of West Jefferson is 4,186.
What is the Total Male Population of West Jefferson?
Total Male Population of West Jefferson is 1,937.
What is the Total Female Population of West Jefferson?
Total Female Population of West Jefferson is 2,249.
What is the Ratio of Males per 100 Females in West Jefferson?
There are 86.13 Males per 100 Females in West Jefferson.
What is the Ratio of Females per 100 Males in West Jefferson?
There are 116.11 Females per 100 Males in West Jefferson.
What is the Median Population Age in West Jefferson?
Median Population Age in West Jefferson is 46.6 Years.
What is the Average Family Size in West Jefferson
Average Family Size in West Jefferson is 3.0 People.
What is the Average Household Size in West Jefferson
Average Household Size in West Jefferson is 2.5 People.
What is Per Capita Income in West Jefferson?
Per Capita income in West Jefferson is $31,577.
What is the Median Family Income in West Jefferson?
Median Family Income in West Jefferson is $77,591.
What is the Median Household income in West Jefferson?
Median Household Income in West Jefferson is $63,750.
What is Income or Wage Gap in West Jefferson?
Income or Wage Gap in West Jefferson is 30.6%.
Women in West Jefferson earn 69.4 cents for every dollar earned by a man.
What is Inequality or Gini Index in West Jefferson?
Inequality or Gini Index in West Jefferson is 0.37.
How Large is the Labor Force in West Jefferson?
There are 2,356 People in the Labor Forcein in West Jefferson.
What is the Percentage of People in the Labor Force in West Jefferson?
65.2% of People are in the Labor Force in West Jefferson.
What is the Unemployment Rate in West Jefferson?
Unemployment Rate in West Jefferson is 2.2%.