Cities with the Highest Percentage of Self-Employed / Not Incorporated in Kentucky
RELATED REPORTS & OPTIONS
Self-Employed / Not Incorporated
Kentucky
Compare Cities
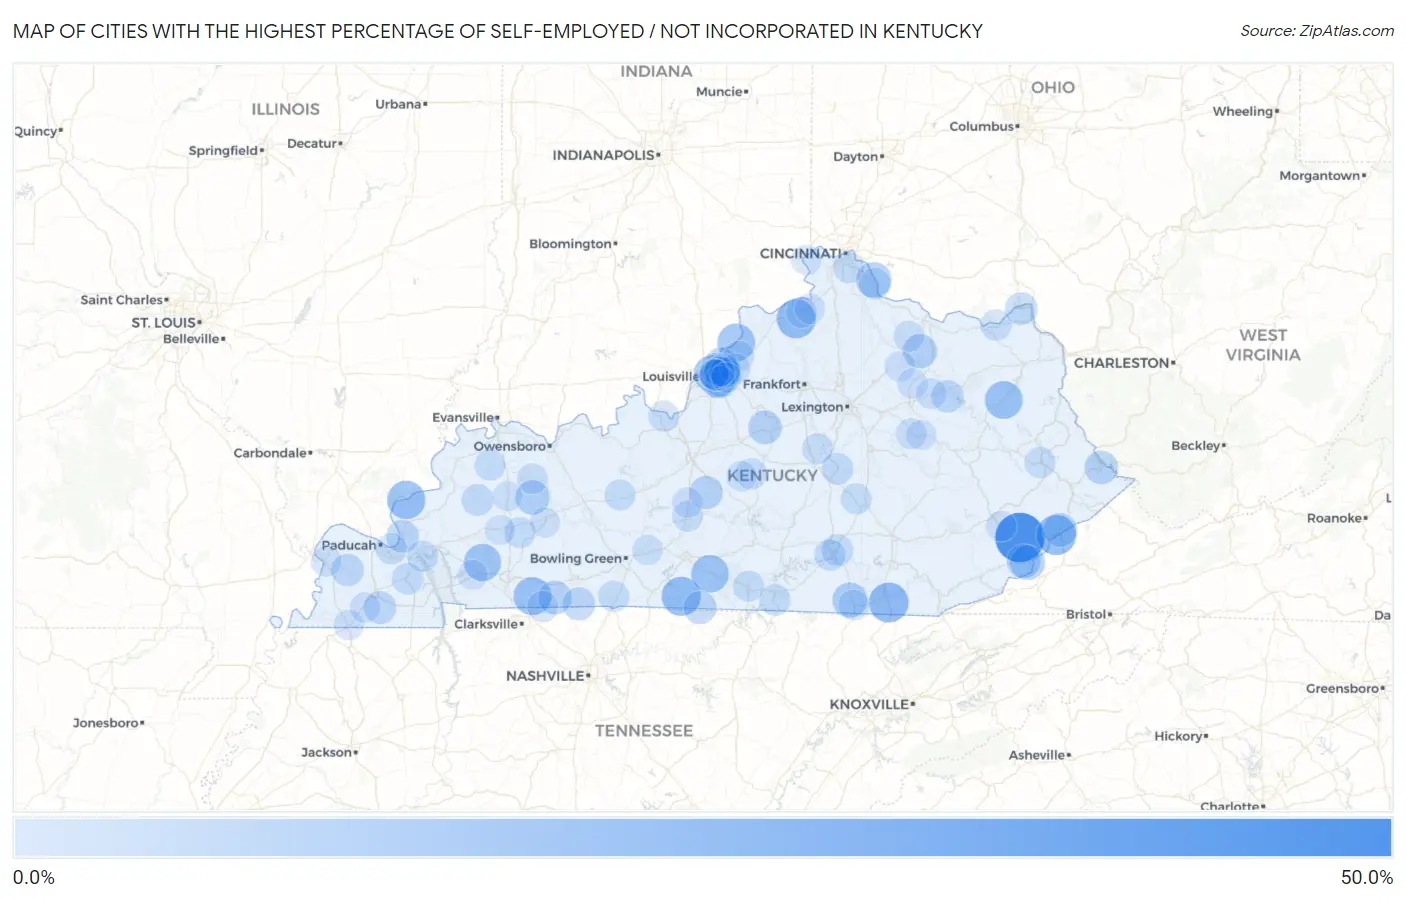
Map of Cities with the Highest Percentage of Self-Employed / Not Incorporated in Kentucky
0.0%
50.0%
Cities with the Highest Percentage of Self-Employed / Not Incorporated in Kentucky
| City | % Self-Employed / Not Incorporated | vs State | vs National | |
| 1. | Blackey | 50.0% | 5.1%(+44.9)#1 | 5.8%(+44.2)#226 |
| 2. | Payne Gap | 28.8% | 5.1%(+23.6)#2 | 5.8%(+23.0)#706 |
| 3. | Moseleyville | 28.6% | 5.1%(+23.4)#3 | 5.8%(+22.8)#714 |
| 4. | Pleasant View | 28.2% | 5.1%(+23.1)#4 | 5.8%(+22.4)#740 |
| 5. | Fountain Run | 26.8% | 5.1%(+21.7)#5 | 5.8%(+21.0)#823 |
| 6. | Sanders | 26.8% | 5.1%(+21.7)#6 | 5.8%(+21.0)#824 |
| 7. | Carrsville | 25.0% | 5.1%(+19.9)#7 | 5.8%(+19.2)#955 |
| 8. | Trenton | 24.2% | 5.1%(+19.1)#8 | 5.8%(+18.4)#1,017 |
| 9. | Sandy Hook | 23.9% | 5.1%(+18.8)#9 | 5.8%(+18.1)#1,047 |
| 10. | Summer Shade | 23.4% | 5.1%(+18.3)#10 | 5.8%(+17.6)#1,086 |
| 11. | Westport | 23.3% | 5.1%(+18.2)#11 | 5.8%(+17.5)#1,099 |
| 12. | Cerulean | 22.6% | 5.1%(+17.5)#12 | 5.8%(+16.8)#1,178 |
| 13. | Mockingbird Valley | 22.4% | 5.1%(+17.3)#13 | 5.8%(+16.6)#1,193 |
| 14. | California | 18.4% | 5.1%(+13.3)#14 | 5.8%(+12.6)#1,778 |
| 15. | Stearns | 18.2% | 5.1%(+13.0)#15 | 5.8%(+12.3)#1,832 |
| 16. | Lynch | 17.5% | 5.1%(+12.4)#16 | 5.8%(+11.7)#1,955 |
| 17. | Sacramento | 16.5% | 5.1%(+11.4)#17 | 5.8%(+10.7)#2,197 |
| 18. | Lincolnshire | 16.0% | 5.1%(+10.9)#18 | 5.8%(+10.2)#2,333 |
| 19. | Ewing | 15.8% | 5.1%(+10.7)#19 | 5.8%(+10.0)#2,384 |
| 20. | Benham | 15.5% | 5.1%(+10.3)#20 | 5.8%(+9.65)#2,484 |
| 21. | Jenkins | 15.4% | 5.1%(+10.3)#21 | 5.8%(+9.59)#2,500 |
| 22. | Allensville | 15.1% | 5.1%(+9.93)#22 | 5.8%(+9.25)#2,616 |
| 23. | Chaplin | 14.8% | 5.1%(+9.70)#23 | 5.8%(+9.03)#2,694 |
| 24. | Belfry | 14.7% | 5.1%(+9.53)#24 | 5.8%(+8.85)#2,754 |
| 25. | Magnolia | 14.4% | 5.1%(+9.23)#25 | 5.8%(+8.55)#2,842 |
| 26. | Glenview Manor | 14.1% | 5.1%(+9.00)#26 | 5.8%(+8.33)#2,937 |
| 27. | Meadowview Estates | 14.0% | 5.1%(+8.90)#27 | 5.8%(+8.22)#2,978 |
| 28. | Meadowbrook Farm | 14.0% | 5.1%(+8.86)#28 | 5.8%(+8.18)#2,995 |
| 29. | Adairville | 13.5% | 5.1%(+8.39)#29 | 5.8%(+7.72)#3,206 |
| 30. | Gamaliel | 13.5% | 5.1%(+8.37)#30 | 5.8%(+7.70)#3,216 |
| 31. | Ten Broeck | 13.3% | 5.1%(+8.19)#31 | 5.8%(+7.52)#3,300 |
| 32. | Smithland | 13.0% | 5.1%(+7.90)#32 | 5.8%(+7.23)#3,429 |
| 33. | Sedalia | 12.9% | 5.1%(+7.72)#33 | 5.8%(+7.04)#3,525 |
| 34. | South Shore | 12.7% | 5.1%(+7.61)#34 | 5.8%(+6.93)#3,575 |
| 35. | Salt Lick | 12.6% | 5.1%(+7.49)#35 | 5.8%(+6.82)#3,635 |
| 36. | Prospect | 12.5% | 5.1%(+7.36)#36 | 5.8%(+6.68)#3,689 |
| 37. | Cunningham | 12.4% | 5.1%(+7.24)#37 | 5.8%(+6.57)#3,793 |
| 38. | Brownsboro Village | 11.9% | 5.1%(+6.77)#38 | 5.8%(+6.09)#4,075 |
| 39. | Thornhill | 11.7% | 5.1%(+6.56)#39 | 5.8%(+5.89)#4,205 |
| 40. | Woodlawn Park | 11.6% | 5.1%(+6.44)#40 | 5.8%(+5.76)#4,280 |
| 41. | Glenview | 11.2% | 5.1%(+6.09)#41 | 5.8%(+5.41)#4,521 |
| 42. | Providence | 11.2% | 5.1%(+6.04)#42 | 5.8%(+5.36)#4,545 |
| 43. | Broeck Pointe | 11.0% | 5.1%(+5.88)#43 | 5.8%(+5.21)#4,681 |
| 44. | Lancaster | 10.8% | 5.1%(+5.71)#44 | 5.8%(+5.03)#4,810 |
| 45. | Ferguson | 10.7% | 5.1%(+5.52)#45 | 5.8%(+4.85)#4,958 |
| 46. | Benton | 10.6% | 5.1%(+5.44)#46 | 5.8%(+4.77)#5,013 |
| 47. | Creekside | 10.5% | 5.1%(+5.33)#47 | 5.8%(+4.66)#5,118 |
| 48. | Albany | 10.2% | 5.1%(+5.10)#48 | 5.8%(+4.42)#5,324 |
| 49. | Burnside | 10.1% | 5.1%(+4.99)#49 | 5.8%(+4.32)#5,407 |
| 50. | Ledbetter | 10.0% | 5.1%(+4.87)#50 | 5.8%(+4.20)#5,498 |
| 51. | Fairview | 10.0% | 5.1%(+4.86)#51 | 5.8%(+4.18)#5,534 |
| 52. | Mentor | 9.9% | 5.1%(+4.78)#52 | 5.8%(+4.10)#5,634 |
| 53. | Grand Rivers | 9.8% | 5.1%(+4.63)#53 | 5.8%(+3.95)#5,777 |
| 54. | Prestonsburg | 9.8% | 5.1%(+4.63)#54 | 5.8%(+3.95)#5,780 |
| 55. | Franklin | 9.7% | 5.1%(+4.61)#55 | 5.8%(+3.93)#5,815 |
| 56. | Garrison | 9.7% | 5.1%(+4.56)#56 | 5.8%(+3.88)#5,881 |
| 57. | Druid Hills | 9.7% | 5.1%(+4.56)#57 | 5.8%(+3.88)#5,883 |
| 58. | White Plains | 9.7% | 5.1%(+4.55)#58 | 5.8%(+3.87)#5,892 |
| 59. | Maryhill Estates | 9.7% | 5.1%(+4.54)#59 | 5.8%(+3.86)#5,908 |
| 60. | Brodhead | 9.6% | 5.1%(+4.47)#60 | 5.8%(+3.79)#5,970 |
| 61. | Caneyville | 9.5% | 5.1%(+4.38)#61 | 5.8%(+3.71)#6,055 |
| 62. | Poole | 9.5% | 5.1%(+4.33)#62 | 5.8%(+3.66)#6,117 |
| 63. | St Mary | 9.5% | 5.1%(+4.32)#63 | 5.8%(+3.64)#6,134 |
| 64. | Burkesville | 9.4% | 5.1%(+4.30)#64 | 5.8%(+3.62)#6,154 |
| 65. | Burgin | 9.4% | 5.1%(+4.22)#65 | 5.8%(+3.55)#6,212 |
| 66. | Clay City | 9.3% | 5.1%(+4.21)#66 | 5.8%(+3.53)#6,225 |
| 67. | Doe Valley | 9.3% | 5.1%(+4.13)#67 | 5.8%(+3.45)#6,318 |
| 68. | Guthrie | 9.2% | 5.1%(+4.10)#68 | 5.8%(+3.42)#6,346 |
| 69. | Sardis | 9.1% | 5.1%(+3.95)#69 | 5.8%(+3.28)#6,526 |
| 70. | Munfordville | 9.0% | 5.1%(+3.86)#70 | 5.8%(+3.18)#6,626 |
| 71. | Bellewood | 8.9% | 5.1%(+3.80)#71 | 5.8%(+3.13)#6,686 |
| 72. | Crossgate | 8.9% | 5.1%(+3.77)#72 | 5.8%(+3.10)#6,734 |
| 73. | Pine Knot | 8.8% | 5.1%(+3.66)#73 | 5.8%(+2.98)#6,844 |
| 74. | Calhoun | 8.8% | 5.1%(+3.64)#74 | 5.8%(+2.97)#6,859 |
| 75. | Sparta | 8.8% | 5.1%(+3.63)#75 | 5.8%(+2.96)#6,877 |
| 76. | Carlisle | 8.7% | 5.1%(+3.56)#76 | 5.8%(+2.88)#6,971 |
| 77. | Bonnieville | 8.7% | 5.1%(+3.56)#77 | 5.8%(+2.88)#6,985 |
| 78. | Buckner | 8.7% | 5.1%(+3.51)#78 | 5.8%(+2.83)#7,040 |
| 79. | Jeff | 8.6% | 5.1%(+3.48)#79 | 5.8%(+2.81)#7,085 |
| 80. | Sharpsburg | 8.6% | 5.1%(+3.47)#80 | 5.8%(+2.79)#7,095 |
| 81. | Owingsville | 8.6% | 5.1%(+3.46)#81 | 5.8%(+2.78)#7,113 |
| 82. | Wickliffe | 8.6% | 5.1%(+3.43)#82 | 5.8%(+2.76)#7,144 |
| 83. | Glencoe | 8.4% | 5.1%(+3.26)#83 | 5.8%(+2.59)#7,381 |
| 84. | Pewee Valley | 8.4% | 5.1%(+3.26)#84 | 5.8%(+2.58)#7,386 |
| 85. | Oakland | 8.3% | 5.1%(+3.19)#85 | 5.8%(+2.52)#7,495 |
| 86. | Cambridge | 8.3% | 5.1%(+3.19)#86 | 5.8%(+2.52)#7,502 |
| 87. | Meadow Vale | 8.3% | 5.1%(+3.15)#87 | 5.8%(+2.47)#7,568 |
| 88. | Raywick | 8.2% | 5.1%(+3.06)#88 | 5.8%(+2.38)#7,695 |
| 89. | Fulton | 8.2% | 5.1%(+3.05)#89 | 5.8%(+2.37)#7,704 |
| 90. | Wingo | 8.2% | 5.1%(+3.04)#90 | 5.8%(+2.36)#7,716 |
| 91. | Stanley | 8.1% | 5.1%(+2.97)#91 | 5.8%(+2.29)#7,818 |
| 92. | Cadiz | 8.0% | 5.1%(+2.85)#92 | 5.8%(+2.17)#8,005 |
| 93. | St Charles | 7.8% | 5.1%(+2.70)#93 | 5.8%(+2.03)#8,231 |
| 94. | Old Brownsboro Place | 7.8% | 5.1%(+2.65)#94 | 5.8%(+1.97)#8,318 |
| 95. | Hanson | 7.8% | 5.1%(+2.62)#95 | 5.8%(+1.94)#8,362 |
| 96. | Stanton | 7.7% | 5.1%(+2.57)#96 | 5.8%(+1.89)#8,426 |
| 97. | Powderly | 7.7% | 5.1%(+2.55)#97 | 5.8%(+1.88)#8,440 |
| 98. | Petersburg | 7.7% | 5.1%(+2.55)#98 | 5.8%(+1.88)#8,444 |
| 99. | Rolling Fields | 7.7% | 5.1%(+2.55)#99 | 5.8%(+1.88)#8,446 |
| 100. | Blue Ridge Manor | 7.7% | 5.1%(+2.52)#100 | 5.8%(+1.85)#8,516 |
Common Questions
What are the Top 10 Cities with the Highest Percentage of Self-Employed / Not Incorporated in Kentucky?
Top 10 Cities with the Highest Percentage of Self-Employed / Not Incorporated in Kentucky are:
#1
50.0%
#2
28.8%
#3
28.2%
#4
26.8%
#5
26.8%
#6
25.0%
#7
24.2%
#8
23.9%
#9
23.4%
#10
23.3%
What city has the Highest Percentage of Self-Employed / Not Incorporated in Kentucky?
Blackey has the Highest Percentage of Self-Employed / Not Incorporated in Kentucky with 50.0%.
What is the Percentage of Self-Employed / Not Incorporated in the State of Kentucky?
Percentage of Self-Employed / Not Incorporated in Kentucky is 5.1%.
What is the Percentage of Self-Employed / Not Incorporated in the United States?
Percentage of Self-Employed / Not Incorporated in the United States is 5.8%.