Cities with the Highest Percentage of Births to Unmarried Women in Kentucky
RELATED REPORTS & OPTIONS
Highest Illegitimacy | All Women
Kentucky
Compare Cities
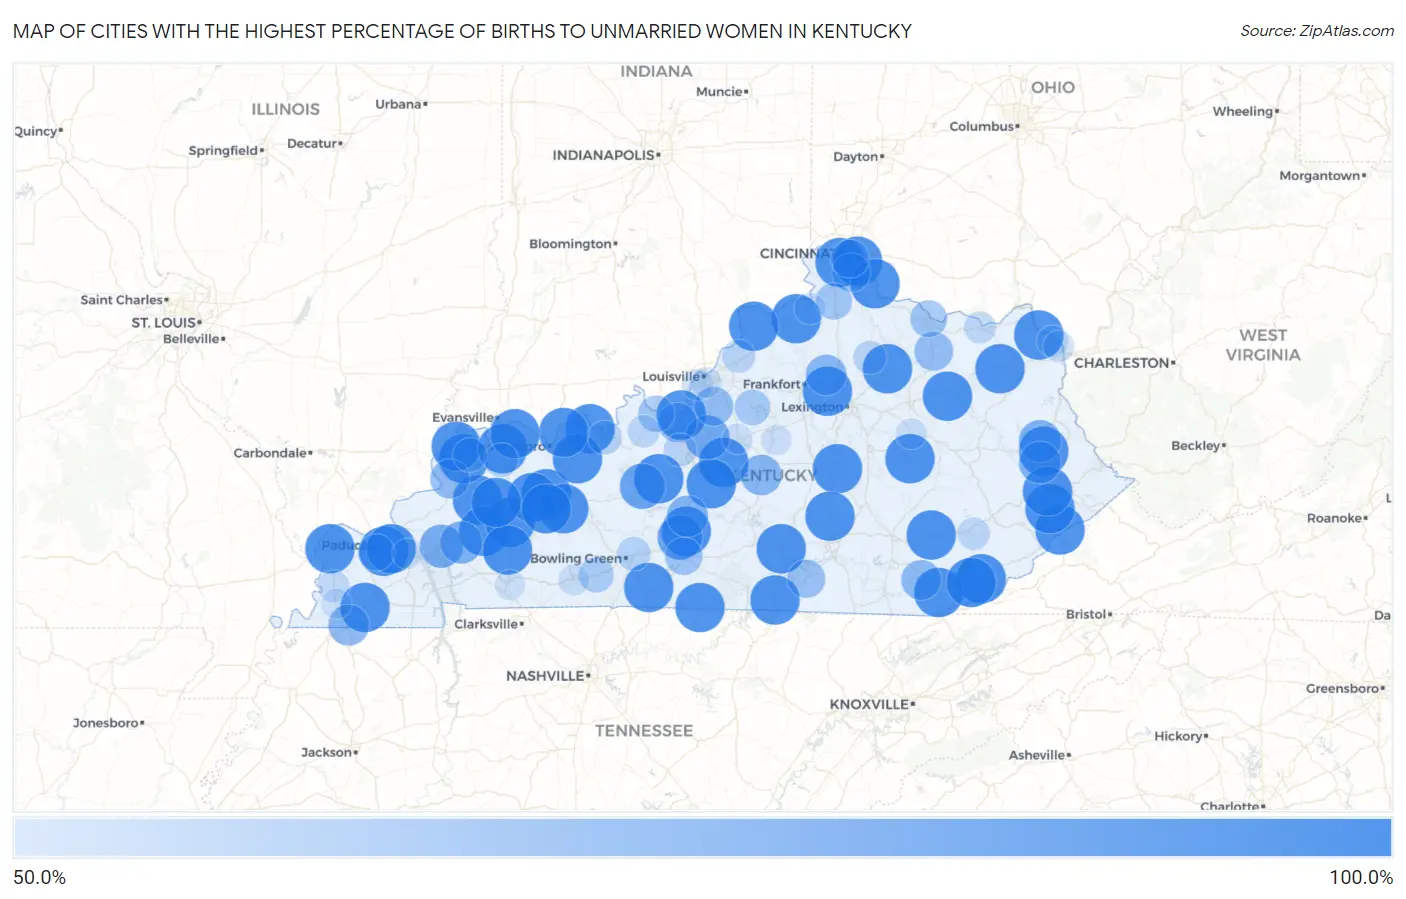
Map of Cities with the Highest Percentage of Births to Unmarried Women in Kentucky
0.0%
100.0%
Cities with the Highest Percentage of Births to Unmarried Women in Kentucky
| City | % Unmarried | vs State | vs National | |
| 1. | Farley | 100.0% | 33.8%(+66.2)#1 | 32.1%(+67.9)#214 |
| 2. | Scottsville | 100.0% | 33.8%(+66.2)#2 | 32.1%(+67.9)#241 |
| 3. | Lancaster | 100.0% | 33.8%(+66.2)#3 | 32.1%(+67.9)#289 |
| 4. | Providence | 100.0% | 33.8%(+66.2)#4 | 32.1%(+67.9)#437 |
| 5. | Lakeside Park | 100.0% | 33.8%(+66.2)#5 | 32.1%(+67.9)#454 |
| 6. | Russell Springs | 100.0% | 33.8%(+66.2)#6 | 32.1%(+67.9)#487 |
| 7. | Thruston | 100.0% | 33.8%(+66.2)#7 | 32.1%(+67.9)#561 |
| 8. | Horse Cave | 100.0% | 33.8%(+66.2)#8 | 32.1%(+67.9)#568 |
| 9. | Albany | 100.0% | 33.8%(+66.2)#9 | 32.1%(+67.9)#593 |
| 10. | Manchester | 100.0% | 33.8%(+66.2)#10 | 32.1%(+67.9)#609 |
| 11. | Dawson Springs | 100.0% | 33.8%(+66.2)#11 | 32.1%(+67.9)#663 |
| 12. | Harlan | 100.0% | 33.8%(+66.2)#12 | 32.1%(+67.9)#702 |
| 13. | Jenkins | 100.0% | 33.8%(+66.2)#13 | 32.1%(+67.9)#714 |
| 14. | Ledbetter | 100.0% | 33.8%(+66.2)#14 | 32.1%(+67.9)#732 |
| 15. | Pineville | 100.0% | 33.8%(+66.2)#15 | 32.1%(+67.9)#738 |
| 16. | Breckinridge Center | 100.0% | 33.8%(+66.2)#16 | 32.1%(+67.9)#749 |
| 17. | Midway | 100.0% | 33.8%(+66.2)#17 | 32.1%(+67.9)#764 |
| 18. | Olive Hill | 100.0% | 33.8%(+66.2)#18 | 32.1%(+67.9)#842 |
| 19. | Silver Grove | 100.0% | 33.8%(+66.2)#19 | 32.1%(+67.9)#940 |
| 20. | West Point | 100.0% | 33.8%(+66.2)#20 | 32.1%(+67.9)#1,110 |
| 21. | Greenup | 100.0% | 33.8%(+66.2)#21 | 32.1%(+67.9)#1,115 |
| 22. | Hawesville | 100.0% | 33.8%(+66.2)#22 | 32.1%(+67.9)#1,136 |
| 23. | South Wallins | 100.0% | 33.8%(+66.2)#23 | 32.1%(+67.9)#1,190 |
| 24. | Auxier | 100.0% | 33.8%(+66.2)#24 | 32.1%(+67.9)#1,299 |
| 25. | Wheelwright | 100.0% | 33.8%(+66.2)#25 | 32.1%(+67.9)#1,308 |
| 26. | Mortons Gap | 100.0% | 33.8%(+66.2)#26 | 32.1%(+67.9)#1,320 |
| 27. | Millersburg | 100.0% | 33.8%(+66.2)#27 | 32.1%(+67.9)#1,355 |
| 28. | New Haven | 100.0% | 33.8%(+66.2)#28 | 32.1%(+67.9)#1,375 |
| 29. | Uniontown | 100.0% | 33.8%(+66.2)#29 | 32.1%(+67.9)#1,443 |
| 30. | Wingo | 100.0% | 33.8%(+66.2)#30 | 32.1%(+67.9)#1,464 |
| 31. | Ravenna | 100.0% | 33.8%(+66.2)#31 | 32.1%(+67.9)#1,551 |
| 32. | Island | 100.0% | 33.8%(+66.2)#32 | 32.1%(+67.9)#1,595 |
| 33. | Whitesville | 100.0% | 33.8%(+66.2)#33 | 32.1%(+67.9)#1,659 |
| 34. | Buffalo | 100.0% | 33.8%(+66.2)#34 | 32.1%(+67.9)#1,671 |
| 35. | Maceo | 100.0% | 33.8%(+66.2)#35 | 32.1%(+67.9)#1,685 |
| 36. | Barlow | 100.0% | 33.8%(+66.2)#36 | 32.1%(+67.9)#1,702 |
| 37. | Crofton | 100.0% | 33.8%(+66.2)#37 | 32.1%(+67.9)#1,720 |
| 38. | Mcdowell | 100.0% | 33.8%(+66.2)#38 | 32.1%(+67.9)#1,750 |
| 39. | Eubank | 100.0% | 33.8%(+66.2)#39 | 32.1%(+67.9)#1,816 |
| 40. | Gamaliel | 100.0% | 33.8%(+66.2)#40 | 32.1%(+67.9)#1,877 |
| 41. | Sacramento | 100.0% | 33.8%(+66.2)#41 | 32.1%(+67.9)#1,906 |
| 42. | Sanders | 100.0% | 33.8%(+66.2)#42 | 32.1%(+67.9)#1,969 |
| 43. | Salt Lick | 100.0% | 33.8%(+66.2)#43 | 32.1%(+67.9)#1,991 |
| 44. | Bedford | 100.0% | 33.8%(+66.2)#44 | 32.1%(+67.9)#2,141 |
| 45. | Anthoston | 100.0% | 33.8%(+66.2)#45 | 32.1%(+67.9)#2,145 |
| 46. | Rockport | 100.0% | 33.8%(+66.2)#46 | 32.1%(+67.9)#2,306 |
| 47. | Big Clifty | 100.0% | 33.8%(+66.2)#47 | 32.1%(+67.9)#2,330 |
| 48. | Mentor | 100.0% | 33.8%(+66.2)#48 | 32.1%(+67.9)#2,380 |
| 49. | Spottsville | 100.0% | 33.8%(+66.2)#49 | 32.1%(+67.9)#2,410 |
| 50. | Manitou | 100.0% | 33.8%(+66.2)#50 | 32.1%(+67.9)#2,437 |
| 51. | South Carrollton | 100.0% | 33.8%(+66.2)#51 | 32.1%(+67.9)#2,523 |
| 52. | Leitchfield | 91.2% | 33.8%(+57.4)#52 | 32.1%(+59.1)#2,859 |
| 53. | Cave City | 90.2% | 33.8%(+56.4)#53 | 32.1%(+58.1)#2,895 |
| 54. | Lebanon Junction | 88.5% | 33.8%(+54.7)#54 | 32.1%(+56.4)#2,958 |
| 55. | Eddyville | 86.7% | 33.8%(+52.9)#55 | 32.1%(+54.6)#3,022 |
| 56. | Paintsville | 84.7% | 33.8%(+50.9)#56 | 32.1%(+52.6)#3,130 |
| 57. | Princeton | 84.6% | 33.8%(+50.8)#57 | 32.1%(+52.5)#3,132 |
| 58. | Prestonsburg | 84.0% | 33.8%(+50.2)#58 | 32.1%(+51.9)#3,158 |
| 59. | Munfordville | 82.4% | 33.8%(+48.6)#59 | 32.1%(+50.3)#3,263 |
| 60. | Fulton | 81.8% | 33.8%(+48.0)#60 | 32.1%(+49.7)#3,287 |
| 61. | Stamping Ground | 81.3% | 33.8%(+47.5)#61 | 32.1%(+49.2)#3,321 |
| 62. | Lebanon | 81.0% | 33.8%(+47.2)#62 | 32.1%(+48.9)#3,330 |
| 63. | Artemus | 79.5% | 33.8%(+45.7)#63 | 32.1%(+47.4)#3,440 |
| 64. | Muldraugh | 78.6% | 33.8%(+44.8)#64 | 32.1%(+46.5)#3,482 |
| 65. | Sturgis | 78.0% | 33.8%(+44.2)#65 | 32.1%(+45.9)#3,519 |
| 66. | Hebron Estates | 77.8% | 33.8%(+44.0)#66 | 32.1%(+45.7)#3,536 |
| 67. | Flemingsburg | 77.1% | 33.8%(+43.3)#67 | 32.1%(+45.0)#3,592 |
| 68. | Ryland Heights | 76.5% | 33.8%(+42.7)#68 | 32.1%(+44.4)#3,636 |
| 69. | Monticello | 75.7% | 33.8%(+41.9)#69 | 32.1%(+43.6)#3,670 |
| 70. | Southgate | 75.7% | 33.8%(+41.9)#70 | 32.1%(+43.6)#3,671 |
| 71. | Glasgow | 74.4% | 33.8%(+40.6)#71 | 32.1%(+42.3)#3,799 |
| 72. | Maysville | 73.3% | 33.8%(+39.5)#72 | 32.1%(+41.2)#3,857 |
| 73. | Crittenden | 72.6% | 33.8%(+38.8)#73 | 32.1%(+40.5)#3,916 |
| 74. | Hendron | 72.4% | 33.8%(+38.6)#74 | 32.1%(+40.3)#3,926 |
| 75. | Brandenburg | 72.2% | 33.8%(+38.4)#75 | 32.1%(+40.1)#3,941 |
| 76. | Taylorsville | 70.6% | 33.8%(+36.8)#76 | 32.1%(+38.5)#4,070 |
| 77. | Auburn | 69.6% | 33.8%(+35.8)#77 | 32.1%(+37.5)#4,152 |
| 78. | Cloverport | 66.7% | 33.8%(+32.9)#78 | 32.1%(+34.6)#4,377 |
| 79. | Robards | 66.7% | 33.8%(+32.9)#79 | 32.1%(+34.6)#4,403 |
| 80. | Plum Springs | 66.7% | 33.8%(+32.9)#80 | 32.1%(+34.6)#4,412 |
| 81. | Waverly | 66.7% | 33.8%(+32.9)#81 | 32.1%(+34.6)#4,434 |
| 82. | Cynthiana | 65.7% | 33.8%(+31.9)#82 | 32.1%(+33.6)#4,511 |
| 83. | Buckner | 65.4% | 33.8%(+31.6)#83 | 32.1%(+33.3)#4,534 |
| 84. | Rineyville | 65.0% | 33.8%(+31.2)#84 | 32.1%(+32.9)#4,570 |
| 85. | Hyden | 64.1% | 33.8%(+30.3)#85 | 32.1%(+32.0)#4,661 |
| 86. | Irvington | 63.8% | 33.8%(+30.0)#86 | 32.1%(+31.7)#4,682 |
| 87. | Vanceburg | 63.3% | 33.8%(+29.5)#87 | 32.1%(+31.2)#4,721 |
| 88. | Arlington | 62.5% | 33.8%(+28.7)#88 | 32.1%(+30.4)#4,809 |
| 89. | Bellefonte | 61.5% | 33.8%(+27.7)#89 | 32.1%(+29.4)#4,871 |
| 90. | Glencoe | 61.5% | 33.8%(+27.7)#90 | 32.1%(+29.4)#4,880 |
| 91. | Ashland | 61.4% | 33.8%(+27.6)#91 | 32.1%(+29.3)#4,884 |
| 92. | Shively | 61.3% | 33.8%(+27.5)#92 | 32.1%(+29.2)#4,891 |
| 93. | Russellville | 60.9% | 33.8%(+27.1)#93 | 32.1%(+28.8)#4,935 |
| 94. | Clay City | 60.7% | 33.8%(+26.9)#94 | 32.1%(+28.6)#4,954 |
| 95. | Parkway Village | 60.0% | 33.8%(+26.2)#95 | 32.1%(+27.9)#5,046 |
| 96. | Willisburg | 60.0% | 33.8%(+26.2)#96 | 32.1%(+27.9)#5,062 |
| 97. | Bardstown | 59.7% | 33.8%(+25.9)#97 | 32.1%(+27.6)#5,104 |
| 98. | Hopkinsville | 59.5% | 33.8%(+25.7)#98 | 32.1%(+27.4)#5,117 |
| 99. | Calvert City | 59.3% | 33.8%(+25.5)#99 | 32.1%(+27.2)#5,147 |
| 100. | Clinton | 59.3% | 33.8%(+25.5)#100 | 32.1%(+27.2)#5,150 |
Common Questions
What are the Top 10 Cities with the Highest Percentage of Births to Unmarried Women in Kentucky?
Top 10 Cities with the Highest Percentage of Births to Unmarried Women in Kentucky are:
#1
100.0%
#2
100.0%
#3
100.0%
#4
100.0%
#5
100.0%
#6
100.0%
#7
100.0%
#8
100.0%
#9
100.0%
#10
100.0%
What city has the Highest Percentage of Births to Unmarried Women in Kentucky?
Farley has the Highest Percentage of Births to Unmarried Women in Kentucky with 100.0%.
What is the Percentage of Births to Unmarried Women in the State of Kentucky?
Percentage of Births to Unmarried Women in Kentucky is 33.8%.
What is the Percentage of Births to Unmarried Women in the United States?
Percentage of Births to Unmarried Women in the United States is 32.1%.