Cities with the Fewest Births per 1,000 Women Over the Age of 35 in Kentucky
RELATED REPORTS & OPTIONS
Lowest Birth Rate | Women 35+
Kentucky
Compare Cities
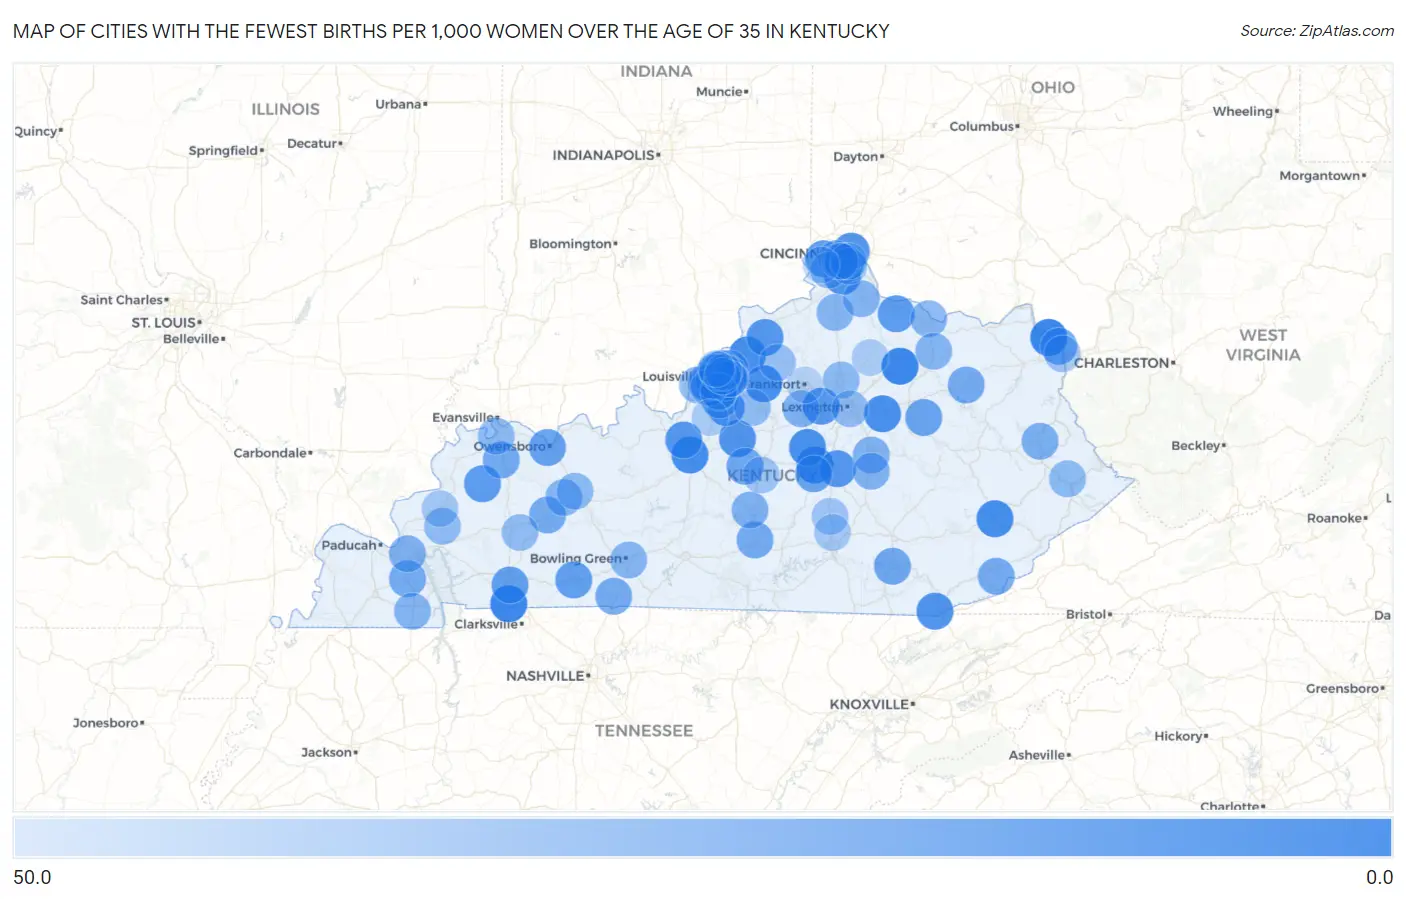
Map of Cities with the Fewest Births per 1,000 Women Over the Age of 35 in Kentucky
50.0
0.0
Cities with the Fewest Births per 1,000 Women Over the Age of 35 in Kentucky
| City | Births / 1,000 Women | vs State | vs National | |
| 1. | Flatwoods | 2.0 | 22.0(-20.0)#1 | 32.0(-30.0)#23 |
| 2. | Fort Campbell North | 3.0 | 22.0(-19.0)#2 | 32.0(-29.0)#54 |
| 3. | Carlisle | 3.0 | 22.0(-19.0)#3 | 32.0(-29.0)#76 |
| 4. | Covington | 6.0 | 22.0(-16.0)#4 | 32.0(-26.0)#178 |
| 5. | Elizabethtown | 6.0 | 22.0(-16.0)#5 | 32.0(-26.0)#180 |
| 6. | La Grange | 6.0 | 22.0(-16.0)#6 | 32.0(-26.0)#221 |
| 7. | Hazard | 6.0 | 22.0(-16.0)#7 | 32.0(-26.0)#231 |
| 8. | Winchester | 7.0 | 22.0(-15.0)#8 | 32.0(-25.0)#258 |
| 9. | Shelbyville | 7.0 | 22.0(-15.0)#9 | 32.0(-25.0)#264 |
| 10. | Danville | 8.0 | 22.0(-14.0)#10 | 32.0(-24.0)#369 |
| 11. | Harrodsburg | 8.0 | 22.0(-14.0)#11 | 32.0(-24.0)#387 |
| 12. | Independence | 9.0 | 22.0(-13.0)#12 | 32.0(-23.0)#432 |
| 13. | Bardstown | 9.0 | 22.0(-13.0)#13 | 32.0(-23.0)#459 |
| 14. | Middlesborough | 9.0 | 22.0(-13.0)#14 | 32.0(-23.0)#478 |
| 15. | Dayton | 9.0 | 22.0(-13.0)#15 | 32.0(-23.0)#497 |
| 16. | Radcliff | 11.0 | 22.0(-11.0)#16 | 32.0(-21.0)#675 |
| 17. | Mount Washington | 11.0 | 22.0(-11.0)#17 | 32.0(-21.0)#681 |
| 18. | Versailles | 11.0 | 22.0(-11.0)#18 | 32.0(-21.0)#712 |
| 19. | Lancaster | 11.0 | 22.0(-11.0)#19 | 32.0(-21.0)#755 |
| 20. | Campbellsburg | 11.0 | 22.0(-11.0)#20 | 32.0(-21.0)#779 |
| 21. | Lyndon | 13.0 | 22.0(-9.00)#21 | 32.0(-19.0)#978 |
| 22. | Dixon | 13.0 | 22.0(-9.00)#22 | 32.0(-19.0)#1,034 |
| 23. | Brooksville | 13.0 | 22.0(-9.00)#23 | 32.0(-19.0)#1,038 |
| 24. | Hebron | 14.0 | 22.0(-8.00)#24 | 32.0(-18.0)#1,130 |
| 25. | Hopkinsville | 15.0 | 22.0(-7.00)#25 | 32.0(-17.0)#1,200 |
| 26. | Russellville | 15.0 | 22.0(-7.00)#26 | 32.0(-17.0)#1,247 |
| 27. | Heritage Creek | 15.0 | 22.0(-7.00)#27 | 32.0(-17.0)#1,299 |
| 28. | Owensboro | 16.0 | 22.0(-6.00)#28 | 32.0(-16.0)#1,321 |
| 29. | Junction City | 17.0 | 22.0(-5.00)#29 | 32.0(-15.0)#1,588 |
| 30. | Worthington Hills | 17.0 | 22.0(-5.00)#30 | 32.0(-15.0)#1,592 |
| 31. | Jeffersonville | 17.0 | 22.0(-5.00)#31 | 32.0(-15.0)#1,595 |
| 32. | Riverwood | 18.0 | 22.0(-4.00)#32 | 32.0(-14.0)#1,797 |
| 33. | Ashland | 19.0 | 22.0(-3.00)#33 | 32.0(-13.0)#1,845 |
| 34. | Corbin | 19.0 | 22.0(-3.00)#34 | 32.0(-13.0)#1,886 |
| 35. | Loretto | 19.0 | 22.0(-3.00)#35 | 32.0(-13.0)#1,967 |
| 36. | Brownsboro Farm | 19.0 | 22.0(-3.00)#36 | 32.0(-13.0)#1,969 |
| 37. | Robards | 20.0 | 22.0(-2.00)#37 | 32.0(-12.0)#2,132 |
| 38. | Franklin | 21.0 | 22.0(-1.000)#38 | 32.0(-11.0)#2,219 |
| 39. | Morehead | 21.0 | 22.0(-1.000)#39 | 32.0(-11.0)#2,232 |
| 40. | Central City | 21.0 | 22.0(-1.000)#40 | 32.0(-11.0)#2,241 |
| 41. | Columbia | 21.0 | 22.0(-1.000)#41 | 32.0(-11.0)#2,248 |
| 42. | Benton | 21.0 | 22.0(-1.000)#42 | 32.0(-11.0)#2,250 |
| 43. | Evarts | 21.0 | 22.0(-1.000)#43 | 32.0(-11.0)#2,297 |
| 44. | St Regis Park | 22.0 | 22.0(=0.000)#44 | 32.0(-10.00)#2,453 |
| 45. | Paintsville | 23.0 | 22.0(+1.000)#45 | 32.0(-9.00)#2,591 |
| 46. | Strathmoor Village | 23.0 | 22.0(+1.000)#46 | 32.0(-9.00)#2,665 |
| 47. | Spring Mill | 23.0 | 22.0(+1.000)#47 | 32.0(-9.00)#2,670 |
| 48. | Louisville | 24.0 | 22.0(+2.00)#48 | 32.0(-8.00)#2,672 |
| 49. | Lawrenceburg | 24.0 | 22.0(+2.00)#49 | 32.0(-8.00)#2,757 |
| 50. | Campbellsville | 24.0 | 22.0(+2.00)#50 | 32.0(-8.00)#2,759 |
| 51. | Calvert City | 24.0 | 22.0(+2.00)#51 | 32.0(-8.00)#2,805 |
| 52. | Parkway Village | 24.0 | 22.0(+2.00)#52 | 32.0(-8.00)#2,847 |
| 53. | Richmond | 25.0 | 22.0(+3.00)#53 | 32.0(-7.00)#2,894 |
| 54. | Berea | 25.0 | 22.0(+3.00)#54 | 32.0(-7.00)#2,927 |
| 55. | Villa Hills | 25.0 | 22.0(+3.00)#55 | 32.0(-7.00)#2,949 |
| 56. | Murray | 26.0 | 22.0(+4.00)#56 | 32.0(-6.00)#3,079 |
| 57. | Maysville | 26.0 | 22.0(+4.00)#57 | 32.0(-6.00)#3,104 |
| 58. | Flemingsburg | 26.0 | 22.0(+4.00)#58 | 32.0(-6.00)#3,145 |
| 59. | Anchorage | 26.0 | 22.0(+4.00)#59 | 32.0(-6.00)#3,149 |
| 60. | Dry Ridge | 26.0 | 22.0(+4.00)#60 | 32.0(-6.00)#3,155 |
| 61. | Butler | 26.0 | 22.0(+4.00)#61 | 32.0(-6.00)#3,194 |
| 62. | Bowling Green | 27.0 | 22.0(+5.00)#62 | 32.0(-5.00)#3,207 |
| 63. | Woodland Hills | 27.0 | 22.0(+5.00)#63 | 32.0(-5.00)#3,373 |
| 64. | Centertown | 27.0 | 22.0(+5.00)#64 | 32.0(-5.00)#3,377 |
| 65. | Georgetown | 28.0 | 22.0(+6.00)#65 | 32.0(-4.00)#3,411 |
| 66. | Henderson | 28.0 | 22.0(+6.00)#66 | 32.0(-4.00)#3,416 |
| 67. | Shively | 28.0 | 22.0(+6.00)#67 | 32.0(-4.00)#3,449 |
| 68. | Hartford | 28.0 | 22.0(+6.00)#68 | 32.0(-4.00)#3,505 |
| 69. | Coal Run Village | 28.0 | 22.0(+6.00)#69 | 32.0(-4.00)#3,525 |
| 70. | Lexington | 29.0 | 22.0(+7.00)#70 | 32.0(-3.00)#3,559 |
| 71. | Florence | 29.0 | 22.0(+7.00)#71 | 32.0(-3.00)#3,594 |
| 72. | Fredonia | 29.0 | 22.0(+7.00)#72 | 32.0(-3.00)#3,728 |
| 73. | Taylorsville | 30.0 | 22.0(+8.00)#73 | 32.0(-2.00)#3,902 |
| 74. | White Plains | 30.0 | 22.0(+8.00)#74 | 32.0(-2.00)#3,916 |
| 75. | Jeffersontown | 31.0 | 22.0(+9.00)#75 | 32.0(-1.000)#3,988 |
| 76. | Pleasureville | 31.0 | 22.0(+9.00)#76 | 32.0(-1.000)#4,088 |
| 77. | Middletown | 32.0 | 22.0(+10.00)#77 | 32.0(=0.000)#4,195 |
| 78. | Langdon Place | 32.0 | 22.0(+10.00)#78 | 32.0(=0.000)#4,262 |
| 79. | Kingsley | 32.0 | 22.0(+10.00)#79 | 32.0(=0.000)#4,271 |
| 80. | Lebanon | 33.0 | 22.0(+11.0)#80 | 32.0(+1.000)#4,375 |
| 81. | Glenview Hills | 33.0 | 22.0(+11.0)#81 | 32.0(+1.000)#4,461 |
| 82. | Douglass Hills | 34.0 | 22.0(+12.0)#82 | 32.0(+2.00)#4,569 |
| 83. | Catlettsburg | 34.0 | 22.0(+12.0)#83 | 32.0(+2.00)#4,595 |
| 84. | Eubank | 34.0 | 22.0(+12.0)#84 | 32.0(+2.00)#4,625 |
| 85. | Marion | 35.0 | 22.0(+13.0)#85 | 32.0(+3.00)#4,725 |
| 86. | Lynnview | 35.0 | 22.0(+13.0)#86 | 32.0(+3.00)#4,760 |
| 87. | Taylor Mill | 36.0 | 22.0(+14.0)#87 | 32.0(+4.00)#4,855 |
| 88. | Fort Wright | 36.0 | 22.0(+14.0)#88 | 32.0(+4.00)#4,860 |
| 89. | Wilder | 36.0 | 22.0(+14.0)#89 | 32.0(+4.00)#4,883 |
| 90. | Northfield | 36.0 | 22.0(+14.0)#90 | 32.0(+4.00)#4,915 |
| 91. | Science Hill | 36.0 | 22.0(+14.0)#91 | 32.0(+4.00)#4,921 |
| 92. | Hollow Creek | 36.0 | 22.0(+14.0)#92 | 32.0(+4.00)#4,922 |
| 93. | Westwood | 37.0 | 22.0(+15.0)#93 | 32.0(+5.00)#5,095 |
| 94. | Shepherdsville | 38.0 | 22.0(+16.0)#94 | 32.0(+6.00)#5,166 |
| 95. | Cynthiana | 38.0 | 22.0(+16.0)#95 | 32.0(+6.00)#5,204 |
| 96. | Bellemeade | 38.0 | 22.0(+16.0)#96 | 32.0(+6.00)#5,256 |
| 97. | Glenview | 38.0 | 22.0(+16.0)#97 | 32.0(+6.00)#5,268 |
| 98. | Fort Mitchell | 40.0 | 22.0(+18.0)#98 | 32.0(+8.00)#5,494 |
| 99. | Frankfort | 41.0 | 22.0(+19.0)#99 | 32.0(+9.00)#5,585 |
| 100. | Burlington | 41.0 | 22.0(+19.0)#100 | 32.0(+9.00)#5,601 |
Common Questions
What are the Top 10 Cities with the Fewest Births per 1,000 Women Over the Age of 35 in Kentucky?
Top 10 Cities with the Fewest Births per 1,000 Women Over the Age of 35 in Kentucky are:
#1
2.0
#2
3.0
#3
3.0
#4
6.0
#5
6.0
#6
6.0
#7
6.0
#8
7.0
#9
7.0
#10
8.0
What city has the Fewest Births per 1,000 Women Over the Age of 35 in Kentucky?
Flatwoods has the Fewest Births per 1,000 Women Over the Age of 35 in Kentucky with 2.0.
What is the Number of Births per 1,000 Women Over the Age of 35 in the State of Kentucky?
Number of Births per 1,000 Women Over the Age of 35 in Kentucky is 22.0.
What is the Number of Births per 1,000 Women Over the Age of 35 in the United States?
Number of Births per 1,000 Women Over the Age of 35 in the United States is 32.0.