Cities with the Most Immigrants from Guatemala in Kentucky
RELATED REPORTS & OPTIONS
Guatemala
Kentucky
Compare Cities
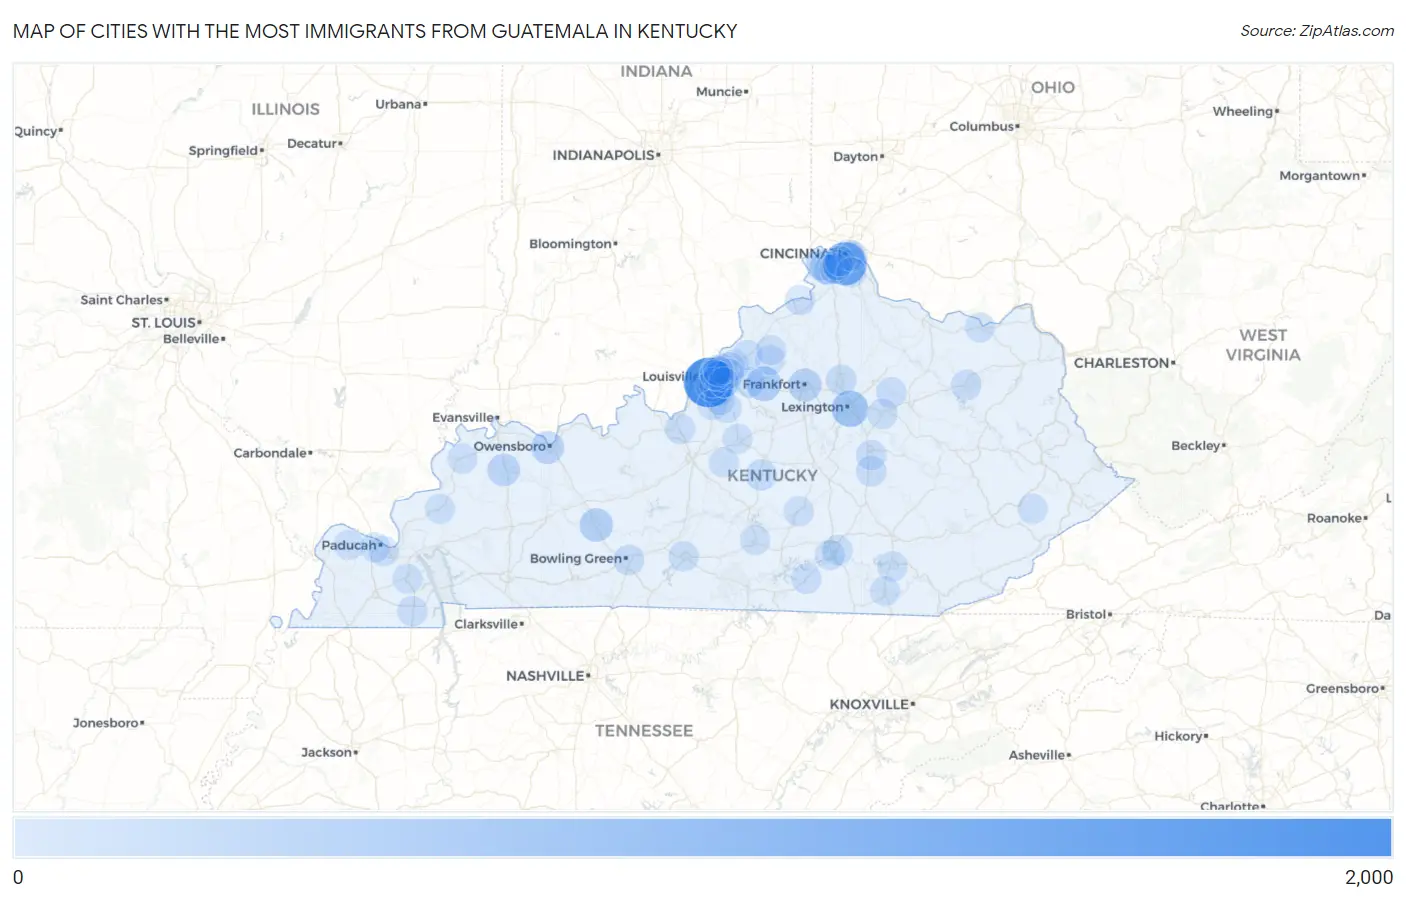
Map of Cities with the Most Immigrants from Guatemala in Kentucky
0
2,000
Cities with the Most Immigrants from Guatemala in Kentucky
| City | Guatemala | vs State | vs National | |
| 1. | Louisville | 1,530 | 6,894(22.19%)#1 | 1,051,999(0.15%)#93 |
| 2. | Covington | 1,008 | 6,894(14.62%)#2 | 1,051,999(0.10%)#164 |
| 3. | Lexington | 485 | 6,894(7.04%)#3 | 1,051,999(0.05%)#354 |
| 4. | Shelbyville | 338 | 6,894(4.90%)#4 | 1,051,999(0.03%)#463 |
| 5. | Morgantown | 243 | 6,894(3.52%)#5 | 1,051,999(0.02%)#606 |
| 6. | Frankfort | 231 | 6,894(3.35%)#6 | 1,051,999(0.02%)#637 |
| 7. | Owensboro | 207 | 6,894(3.00%)#7 | 1,051,999(0.02%)#693 |
| 8. | Oakbrook | 198 | 6,894(2.87%)#8 | 1,051,999(0.02%)#721 |
| 9. | Sebree | 188 | 6,894(2.73%)#9 | 1,051,999(0.02%)#761 |
| 10. | Lebanon | 74 | 6,894(1.07%)#10 | 1,051,999(0.01%)#1,458 |
| 11. | Bowling Green | 55 | 6,894(0.80%)#11 | 1,051,999(0.01%)#1,720 |
| 12. | Newport | 47 | 6,894(0.68%)#12 | 1,051,999(0.00%)#1,870 |
| 13. | Georgetown | 41 | 6,894(0.59%)#13 | 1,051,999(0.00%)#1,981 |
| 14. | Burlington | 41 | 6,894(0.59%)#14 | 1,051,999(0.00%)#1,990 |
| 15. | Mount Washington | 41 | 6,894(0.59%)#15 | 1,051,999(0.00%)#1,991 |
| 16. | Jeffersontown | 36 | 6,894(0.52%)#16 | 1,051,999(0.00%)#2,139 |
| 17. | Berea | 36 | 6,894(0.52%)#17 | 1,051,999(0.00%)#2,148 |
| 18. | Florence | 34 | 6,894(0.49%)#18 | 1,051,999(0.00%)#2,203 |
| 19. | North Middletown | 34 | 6,894(0.49%)#19 | 1,051,999(0.00%)#2,224 |
| 20. | Richmond | 33 | 6,894(0.48%)#20 | 1,051,999(0.00%)#2,232 |
| 21. | Fort Knox | 33 | 6,894(0.48%)#21 | 1,051,999(0.00%)#2,246 |
| 22. | Morehead | 31 | 6,894(0.45%)#22 | 1,051,999(0.00%)#2,307 |
| 23. | Elsmere | 30 | 6,894(0.44%)#23 | 1,051,999(0.00%)#2,331 |
| 24. | Murray | 29 | 6,894(0.42%)#24 | 1,051,999(0.00%)#2,365 |
| 25. | Crestwood | 27 | 6,894(0.39%)#25 | 1,051,999(0.00%)#2,439 |
| 26. | Simpsonville | 27 | 6,894(0.39%)#26 | 1,051,999(0.00%)#2,447 |
| 27. | Ferguson | 26 | 6,894(0.38%)#27 | 1,051,999(0.00%)#2,486 |
| 28. | Monticello | 21 | 6,894(0.30%)#28 | 1,051,999(0.00%)#2,696 |
| 29. | Glasgow | 20 | 6,894(0.29%)#29 | 1,051,999(0.00%)#2,735 |
| 30. | Winchester | 16 | 6,894(0.23%)#30 | 1,051,999(0.00%)#2,944 |
| 31. | Watterson Park | 15 | 6,894(0.22%)#31 | 1,051,999(0.00%)#3,047 |
| 32. | Corbin | 14 | 6,894(0.20%)#32 | 1,051,999(0.00%)#3,086 |
| 33. | Warsaw | 14 | 6,894(0.20%)#33 | 1,051,999(0.00%)#3,107 |
| 34. | Farley | 13 | 6,894(0.19%)#34 | 1,051,999(0.00%)#3,168 |
| 35. | Fort Thomas | 12 | 6,894(0.17%)#35 | 1,051,999(0.00%)#3,212 |
| 36. | Bardstown | 12 | 6,894(0.17%)#36 | 1,051,999(0.00%)#3,215 |
| 37. | Erlanger | 11 | 6,894(0.16%)#37 | 1,051,999(0.00%)#3,289 |
| 38. | Columbia | 11 | 6,894(0.16%)#38 | 1,051,999(0.00%)#3,327 |
| 39. | Morganfield | 11 | 6,894(0.16%)#39 | 1,051,999(0.00%)#3,332 |
| 40. | Indian Hills | 11 | 6,894(0.16%)#40 | 1,051,999(0.00%)#3,334 |
| 41. | Hollow Creek | 11 | 6,894(0.16%)#41 | 1,051,999(0.00%)#3,350 |
| 42. | Kevil | 11 | 6,894(0.16%)#42 | 1,051,999(0.00%)#3,354 |
| 43. | Hillview | 10 | 6,894(0.15%)#43 | 1,051,999(0.00%)#3,400 |
| 44. | La Grange | 9 | 6,894(0.13%)#44 | 1,051,999(0.00%)#3,491 |
| 45. | Burnside | 9 | 6,894(0.13%)#45 | 1,051,999(0.00%)#3,536 |
| 46. | Benton | 8 | 6,894(0.12%)#46 | 1,051,999(0.00%)#3,601 |
| 47. | Liberty | 8 | 6,894(0.12%)#47 | 1,051,999(0.00%)#3,620 |
| 48. | Eminence | 7 | 6,894(0.10%)#48 | 1,051,999(0.00%)#3,700 |
| 49. | Pippa Passes | 7 | 6,894(0.10%)#49 | 1,051,999(0.00%)#3,734 |
| 50. | Williamsburg | 6 | 6,894(0.09%)#50 | 1,051,999(0.00%)#3,787 |
| 51. | Thruston | 6 | 6,894(0.09%)#51 | 1,051,999(0.00%)#3,805 |
| 52. | New Haven | 6 | 6,894(0.09%)#52 | 1,051,999(0.00%)#3,832 |
| 53. | Paducah | 5 | 6,894(0.07%)#53 | 1,051,999(0.00%)#3,864 |
| 54. | Coldstream | 5 | 6,894(0.07%)#54 | 1,051,999(0.00%)#3,925 |
| 55. | Marion | 4 | 6,894(0.06%)#55 | 1,051,999(0.00%)#3,989 |
| 56. | Vanceburg | 4 | 6,894(0.06%)#56 | 1,051,999(0.00%)#4,024 |
| 57. | Ryland Heights | 3 | 6,894(0.04%)#57 | 1,051,999(0.00%)#4,130 |
| 58. | New Castle | 3 | 6,894(0.04%)#58 | 1,051,999(0.00%)#4,131 |
| 59. | Glenview Hills | 3 | 6,894(0.04%)#59 | 1,051,999(0.00%)#4,149 |
| 60. | Heritage Creek | 2 | 6,894(0.03%)#60 | 1,051,999(0.00%)#4,219 |
| 61. | Brownsboro Farm | 2 | 6,894(0.03%)#61 | 1,051,999(0.00%)#4,244 |
| 62. | Wellington | 2 | 6,894(0.03%)#62 | 1,051,999(0.00%)#4,251 |
| 63. | Fort Mitchell | 1 | 6,894(0.01%)#63 | 1,051,999(0.00%)#4,304 |
| 64. | Anchorage | 1 | 6,894(0.01%)#64 | 1,051,999(0.00%)#4,335 |
| 65. | Beechwood Village | 1 | 6,894(0.01%)#65 | 1,051,999(0.00%)#4,348 |
| 66. | Forest Hills | 1 | 6,894(0.01%)#66 | 1,051,999(0.00%)#4,382 |
| 67. | Bellewood | 1 | 6,894(0.01%)#67 | 1,051,999(0.00%)#4,398 |
| 68. | Thornhill | 1 | 6,894(0.01%)#68 | 1,051,999(0.00%)#4,402 |
Common Questions
What are the Top 10 Cities with the Most Immigrants from Guatemala in Kentucky?
Top 10 Cities with the Most Immigrants from Guatemala in Kentucky are:
#1
1,530
#2
1,008
#3
485
#4
338
#5
243
#6
231
#7
207
#8
198
#9
188
#10
74
What city has the Most Immigrants from Guatemala in Kentucky?
Louisville has the Most Immigrants from Guatemala in Kentucky with 1,530.
What is the Total Immigrants from Guatemala in the State of Kentucky?
Total Immigrants from Guatemala in Kentucky is 6,894.
What is the Total Immigrants from Guatemala in the United States?
Total Immigrants from Guatemala in the United States is 1,051,999.