Cities with the Lowest Percentage of Births to Unmarried Women under the Age of under 20 in Kentucky

RELATED REPORTS & OPTIONS

Lowest Illegitimacy | Women 15-19
Population
Families and Households
Female Fertility
Female Fertility (Unmarried)
Race (Community Size)
Race (Percentage)
Ancestry (Community Size)
AfghanAfricanAlaska NativeAlaskan AthabascanAlbanianAleutAlsatianAmericanApacheArabArapahoArgentineanArmenianAssyrian / Chaldean / SyriacAustralianAustrianBahamianBangladeshiBarbadianBasqueBelgianBelizeanBermudanBhutaneseBlackfeetBolivianBrazilianBritishBritish West IndianBulgarianBurmeseCajunCambodianCanadianCape VerdeanCarpatho RusynCelticCentral AmericanCentral American IndianCherokeeCheyenneChickasawChileanChineseChippewaChoctawColombianColvilleComancheCosta RicanCreeCreekCroatianCrowCubanCypriotCzechCzechoslovakianDanishDelawareDominicanDutchDutch West IndianEastern EuropeanEcuadorianEgyptianEnglishEstonianEthiopianEuropeanFijianFilipinoFinnishFrenchFrench American IndianFrench CanadianGermanGerman RussianGhanaianGreekGuamanian / ChamorroGuatemalanGuyaneseHaitianHmongHonduranHopiHoumaHungarianIcelanderIndian (Asian)IndonesianInupiatIranianIraqiIrishIroquoisIsraeliItalianJamaicanJapaneseJordanianKenyanKiowaKoreanLaotianLatvianLebaneseLiberianLithuanianLumbeeLuxembourgerMacedonianMalaysianMalteseMarshalleseMenomineeMexicanMexican American IndianMongolianMoroccanNative HawaiianNavajoNepaleseNew ZealanderNicaraguanNigerianNorthern EuropeanNorwegianOkinawanOsageOttawaPaiutePakistaniPalestinianPanamanianParaguayanPennsylvania GermanPeruvianPimaPolishPortuguesePotawatomiPuebloPuerto RicanPuget Sound SalishRomanianRussianSalvadoranSamoanScandinavianScotch-IrishScottishSeminoleSenegaleseSerbianShoshoneSierra LeoneanSiouxSlavicSlovakSloveneSomaliSouth AfricanSouth AmericanSouth American IndianSoviet UnionSpaniardSpanishSpanish AmericanSpanish American IndianSri LankanSubsaharan AfricanSudaneseSwedishSwissSyrianTaiwaneseThaiTlingit-HaidaTohono O'OdhamTonganTrinidadian and TobagonianTsimshianTurkishU.S. Virgin IslanderUgandanUkrainianUruguayanUteVenezuelanVietnameseWelshWest IndianYakamaYaquiYugoslavianYumanYup'ikZimbabwean
Ancestry (Percentage)
AfghanAfricanAlaska NativeAlaskan AthabascanAlbanianAleutAlsatianAmericanApacheArabArapahoArgentineanArmenianAssyrian / Chaldean / SyriacAustralianAustrianBahamianBangladeshiBarbadianBasqueBelgianBelizeanBermudanBhutaneseBlackfeetBolivianBrazilianBritishBritish West IndianBulgarianBurmeseCajunCambodianCanadianCape VerdeanCarpatho RusynCelticCentral AmericanCentral American IndianCherokeeCheyenneChickasawChileanChineseChippewaChoctawColombianColvilleComancheCosta RicanCreeCreekCroatianCrowCubanCypriotCzechCzechoslovakianDanishDelawareDominicanDutchDutch West IndianEastern EuropeanEcuadorianEgyptianEnglishEstonianEthiopianEuropeanFijianFilipinoFinnishFrenchFrench American IndianFrench CanadianGermanGerman RussianGhanaianGreekGuamanian / ChamorroGuatemalanGuyaneseHaitianHmongHonduranHopiHoumaHungarianIcelanderIndian (Asian)IndonesianInupiatIranianIraqiIrishIroquoisIsraeliItalianJamaicanJapaneseJordanianKenyanKiowaKoreanLaotianLatvianLebaneseLiberianLithuanianLumbeeLuxembourgerMacedonianMalaysianMalteseMarshalleseMenomineeMexicanMexican American IndianMongolianMoroccanNative HawaiianNavajoNepaleseNew ZealanderNicaraguanNigerianNorthern EuropeanNorwegianOkinawanOsageOttawaPaiutePakistaniPalestinianPanamanianParaguayanPennsylvania GermanPeruvianPimaPolishPortuguesePotawatomiPuebloPuerto RicanPuget Sound SalishRomanianRussianSalvadoranSamoanScandinavianScotch-IrishScottishSeminoleSenegaleseSerbianShoshoneSierra LeoneanSiouxSlavicSlovakSloveneSomaliSouth AfricanSouth AmericanSouth American IndianSoviet UnionSpaniardSpanishSpanish AmericanSpanish American IndianSri LankanSubsaharan AfricanSudaneseSwedishSwissSyrianTaiwaneseThaiTlingit-HaidaTohono O'OdhamTonganTrinidadian and TobagonianTsimshianTurkishU.S. Virgin IslanderUgandanUkrainianUruguayanUteVenezuelanVietnameseWelshWest IndianYakamaYaquiYugoslavianYumanYup'ikZimbabwean
Immigrant Origin (Total)
AfghanistanAfricaAlbaniaArgentinaArmeniaAsiaAustraliaAustriaAzoresBahamasBangladeshBarbadosBelarusBelgiumBelizeBoliviaBosnia and HerzegovinaBrazilBulgariaBurma / MyanmarCabo VerdeCambodiaCameroonCanadaCaribbeanCentral AmericaChileChinaColombiaCongoCosta RicaCroatiaCubaCzechoslovakiaDenmarkDominicaDominican RepublicEastern AfricaEastern AsiaEastern EuropeEcuadorEgyptEl SalvadorEnglandEritreaEthiopiaEuropeFijiFranceGermanyGhanaGreeceGrenadaGuatemalaGuyanaHaitiHondurasHong KongHungaryIndiaIndonesiaIranIraqIrelandIsraelItalyJamaicaJapanJordanKazakhstanKenyaKoreaKuwaitLaosLatin AmericaLatviaLebanonLiberiaLithuaniaMalaysiaMexicoMicronesiaMiddle AfricaMoldovaMoroccoNepalNetherlandsNicaraguaNigeriaNorth MacedoniaNorthern AfricaNorthern EuropeNorwayOceaniaPakistanPanamaPeruPhilippinesPolandPortugalRomaniaRussiaSaudi ArabiaScotlandSenegalSerbiaSierra LeoneSingaporeSomaliaSouth AfricaSouth AmericaSouth Central AsiaSouth Eastern AsiaSouthern EuropeSpainSri LankaSt. Vincent and the GrenadinesSudanSwedenSwitzerlandSyriaTaiwanThailandTrinidad and TobagoTurkeyUgandaUkraineUruguayUzbekistanVenezuelaVietnamWest IndiesWestern AfricaWestern AsiaWestern EuropeYemenZaireZimbabwe
Immigrant Origin (Percentage)
AfghanistanAfricaAlbaniaArgentinaArmeniaAsiaAustraliaAustriaAzoresBahamasBangladeshBarbadosBelarusBelgiumBelizeBoliviaBosnia and HerzegovinaBrazilBulgariaBurma / MyanmarCabo VerdeCambodiaCameroonCanadaCaribbeanCentral AmericaChileChinaColombiaCongoCosta RicaCroatiaCubaCzechoslovakiaDenmarkDominicaDominican RepublicEastern AfricaEastern AsiaEastern EuropeEcuadorEgyptEl SalvadorEnglandEritreaEthiopiaEuropeFijiFranceGermanyGhanaGreeceGrenadaGuatemalaGuyanaHaitiHondurasHong KongHungaryIndiaIndonesiaIranIraqIrelandIsraelItalyJamaicaJapanJordanKazakhstanKenyaKoreaKuwaitLaosLatin AmericaLatviaLebanonLiberiaLithuaniaMalaysiaMexicoMicronesiaMiddle AfricaMoldovaMoroccoNepalNetherlandsNicaraguaNigeriaNorth MacedoniaNorthern AfricaNorthern EuropeNorwayOceaniaPakistanPanamaPeruPhilippinesPolandPortugalRomaniaRussiaSaudi ArabiaScotlandSenegalSerbiaSierra LeoneSingaporeSomaliaSouth AfricaSouth AmericaSouth Central AsiaSouth Eastern AsiaSouthern EuropeSpainSri LankaSt. Vincent and the GrenadinesSudanSwedenSwitzerlandSyriaTaiwanThailandTrinidad and TobagoTurkeyUgandaUkraineUruguayUzbekistanVenezuelaVietnamWest IndiesWestern AfricaWestern AsiaWestern EuropeYemenZaireZimbabwe
Income
Income (Families)
Income (Households)
Poverty
Poverty (Families)
Unemployment
Employment Occupations
Employment Industries
Employer Class
Commute Time
Commute Means
School Enrollment
Education by Degree Field
Occupancy
Finances
Physical Characteristics
Kentucky
Compare Cities
Comparison Subject

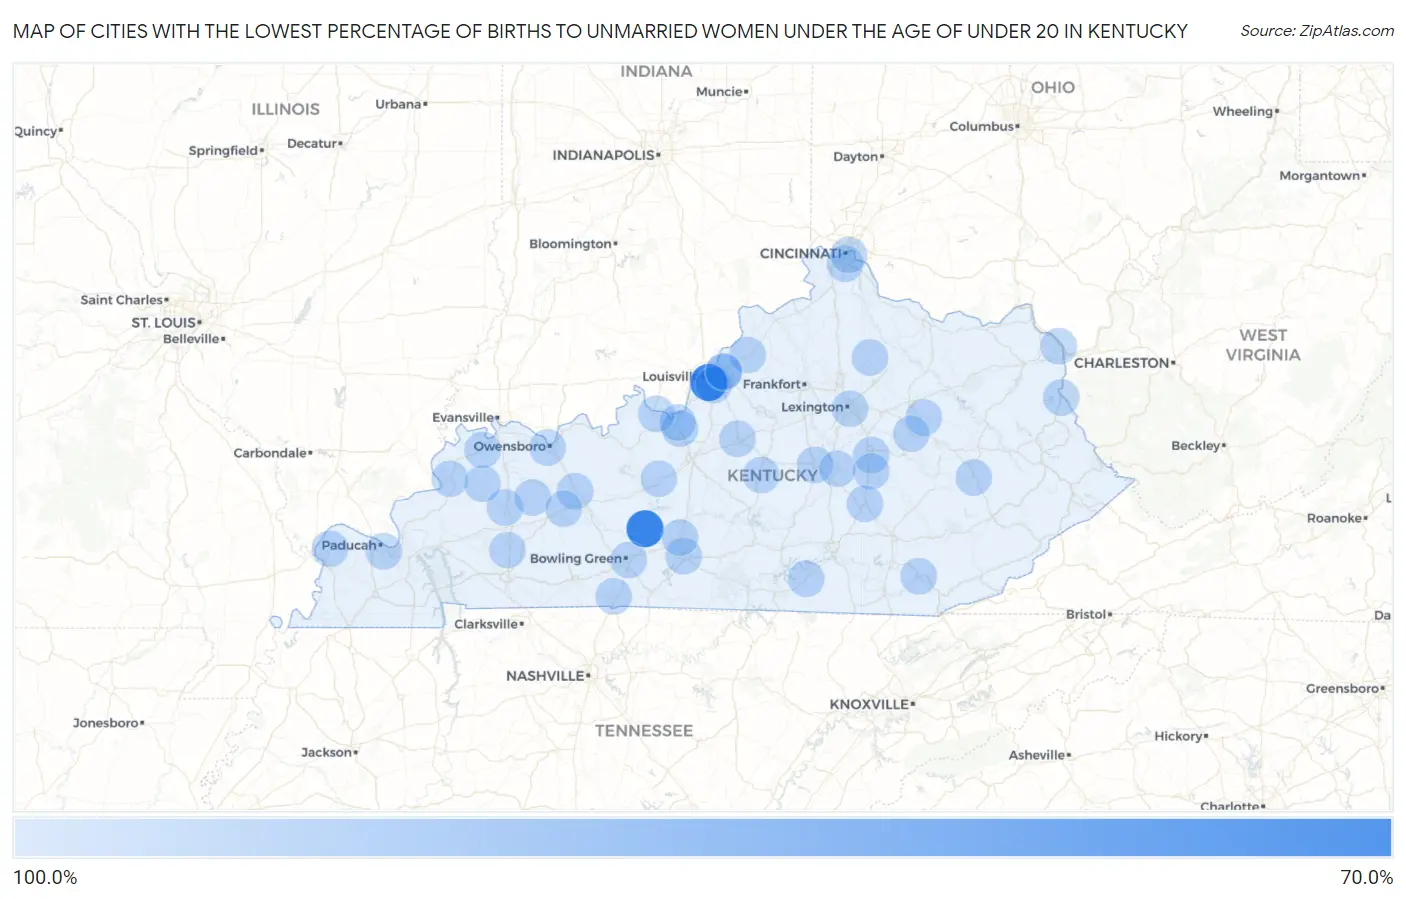
Map of Cities with the Lowest Percentage of Births to Unmarried Women under the Age of under 20 in Kentucky

100.0%
0.0%
Cities with the Lowest Percentage of Births to Unmarried Women under the Age of under 20 in Kentucky Map

Cities with the Lowest Percentage of Births to Unmarried Women under the Age of under 20 in Kentucky

City % Unmarried vs State vs National
1.Louisville79.9%80.6%(-0.700)#186.9%(-7.00)#129
2.Brownsville80.0%80.6%(-0.600)#286.9%(-6.90)#131
3.Lexington100.0%80.6%(+19.4)#386.9%(+13.1)#218
4.Bowling Green100.0%80.6%(+19.4)#486.9%(+13.1)#440
5.Owensboro100.0%80.6%(+19.4)#586.9%(+13.1)#497
6.Covington100.0%80.6%(+19.4)#686.9%(+13.1)#619
7.Richmond100.0%80.6%(+19.4)#786.9%(+13.1)#674
8.Ashland100.0%80.6%(+19.4)#886.9%(+13.1)#841
9.Madisonville100.0%80.6%(+19.4)#986.9%(+13.1)#885
10.Danville100.0%80.6%(+19.4)#1086.9%(+13.1)#920
11.Berea100.0%80.6%(+19.4)#1186.9%(+13.1)#974
12.Glasgow100.0%80.6%(+19.4)#1286.9%(+13.1)#985
13.Newport100.0%80.6%(+19.4)#1386.9%(+13.1)#1,014
14.Bardstown100.0%80.6%(+19.4)#1486.9%(+13.1)#1,032
15.Franklin100.0%80.6%(+19.4)#1586.9%(+13.1)#1,137
16.La Grange100.0%80.6%(+19.4)#1686.9%(+13.1)#1,140
17.Fort Knox100.0%80.6%(+19.4)#1786.9%(+13.1)#1,195
18.Cynthiana100.0%80.6%(+19.4)#1886.9%(+13.1)#1,276
19.Lebanon100.0%80.6%(+19.4)#1986.9%(+13.1)#1,281
20.Monticello100.0%80.6%(+19.4)#2086.9%(+13.1)#1,304
21.Farley100.0%80.6%(+19.4)#2186.9%(+13.1)#1,367
22.Lancaster100.0%80.6%(+19.4)#2286.9%(+13.1)#1,401
23.Barbourville100.0%80.6%(+19.4)#2386.9%(+13.1)#1,450
24.Brandenburg100.0%80.6%(+19.4)#2486.9%(+13.1)#1,477
25.Cave City100.0%80.6%(+19.4)#2586.9%(+13.1)#1,500
26.Hartford100.0%80.6%(+19.4)#2686.9%(+13.1)#1,504
27.Louisa100.0%80.6%(+19.4)#2786.9%(+13.1)#1,508
28.Mount Vernon100.0%80.6%(+19.4)#2886.9%(+13.1)#1,536
29.Jackson100.0%80.6%(+19.4)#2986.9%(+13.1)#1,546
30.West Buechel100.0%80.6%(+19.4)#3086.9%(+13.1)#1,609
31.Jeffersonville100.0%80.6%(+19.4)#3186.9%(+13.1)#1,628
32.Sturgis100.0%80.6%(+19.4)#3286.9%(+13.1)#1,654
33.Clay City100.0%80.6%(+19.4)#3386.9%(+13.1)#1,677
34.Muldraugh100.0%80.6%(+19.4)#3486.9%(+13.1)#1,758
35.Dixon100.0%80.6%(+19.4)#3586.9%(+13.1)#1,782
36.Rolling Hills100.0%80.6%(+19.4)#3686.9%(+13.1)#1,820
37.Langdon Place100.0%80.6%(+19.4)#3786.9%(+13.1)#1,839
38.Corydon100.0%80.6%(+19.4)#3886.9%(+13.1)#1,881
39.Barlow100.0%80.6%(+19.4)#3986.9%(+13.1)#1,966
40.Crofton100.0%80.6%(+19.4)#4086.9%(+13.1)#1,976
41.Sacramento100.0%80.6%(+19.4)#4186.9%(+13.1)#2,028
42.Rockport100.0%80.6%(+19.4)#4286.9%(+13.1)#2,101
43.Big Clifty100.0%80.6%(+19.4)#4386.9%(+13.1)#2,105

Common Questions

What are the Top 10 Cities with the Lowest Percentage of Births to Unmarried Women under the Age of under 20 in Kentucky?
Top 10 Cities with the Lowest Percentage of Births to Unmarried Women under the Age of under 20 in Kentucky are:
What city has the Lowest Percentage of Births to Unmarried Women under the Age of under 20 in Kentucky?
Louisville has the Lowest Percentage of Births to Unmarried Women under the Age of under 20 in Kentucky with 79.9%.
What is the Percentage of Births to Unmarried Women under the Age of under 20 in the State of Kentucky?
Percentage of Births to Unmarried Women under the Age of under 20 in Kentucky is 80.6%.
What is the Percentage of Births to Unmarried Women under the Age of under 20 in the United States?
Percentage of Births to Unmarried Women under the Age of under 20 in the United States is 86.9%.