Cities with the Lowest Poverty Level Among Single Females in Kentucky
RELATED REPORTS & OPTIONS
Lowest Poverty | Single Female
Kentucky
Compare Cities
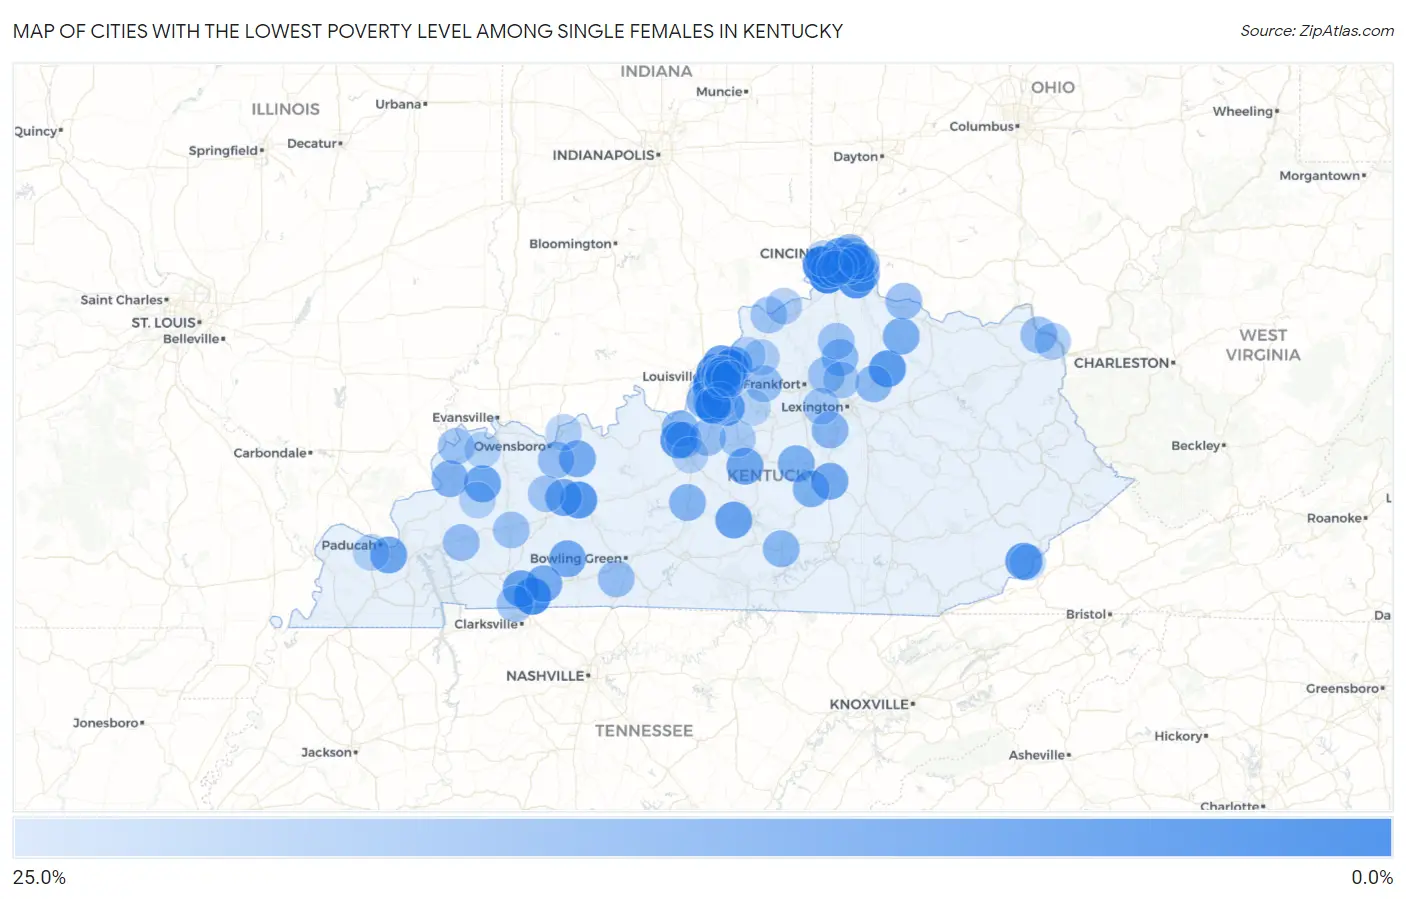
Map of Cities with the Lowest Poverty Level Among Single Females in Kentucky
25.0%
0.0%
Cities with the Lowest Poverty Level Among Single Females in Kentucky
| City | Single Female Poverty | vs State | vs National | |
| 1. | Oakbrook | 2.3% | 31.9%(-29.6)#1 | 24.1%(-21.8)#130 |
| 2. | Union | 2.8% | 31.9%(-29.1)#2 | 24.1%(-21.2)#199 |
| 3. | Strathmoor Village | 4.3% | 31.9%(-27.6)#3 | 24.1%(-19.7)#524 |
| 4. | Cold Spring | 4.7% | 31.9%(-27.2)#4 | 24.1%(-19.4)#619 |
| 5. | Trenton | 4.8% | 31.9%(-27.1)#5 | 24.1%(-19.3)#645 |
| 6. | Burlington | 4.8% | 31.9%(-27.1)#6 | 24.1%(-19.2)#664 |
| 7. | Claryville | 7.4% | 31.9%(-24.5)#7 | 24.1%(-16.6)#1,490 |
| 8. | Watterson Park | 7.5% | 31.9%(-24.4)#8 | 24.1%(-16.6)#1,509 |
| 9. | Vine Grove | 7.6% | 31.9%(-24.3)#9 | 24.1%(-16.5)#1,543 |
| 10. | Beaver Dam | 8.0% | 31.9%(-23.9)#10 | 24.1%(-16.0)#1,718 |
| 11. | Indian Hills | 8.6% | 31.9%(-23.3)#11 | 24.1%(-15.5)#1,914 |
| 12. | Millersburg | 8.7% | 31.9%(-23.2)#12 | 24.1%(-15.4)#1,937 |
| 13. | Houston Acres | 8.7% | 31.9%(-23.2)#13 | 24.1%(-15.4)#1,939 |
| 14. | Benham | 9.1% | 31.9%(-22.8)#14 | 24.1%(-15.0)#2,073 |
| 15. | Briarwood | 9.5% | 31.9%(-22.4)#15 | 24.1%(-14.6)#2,246 |
| 16. | Mount Washington | 9.8% | 31.9%(-22.1)#16 | 24.1%(-14.3)#2,355 |
| 17. | Prospect | 10.2% | 31.9%(-21.7)#17 | 24.1%(-13.9)#2,505 |
| 18. | Bromley | 10.2% | 31.9%(-21.7)#18 | 24.1%(-13.9)#2,512 |
| 19. | Greensburg | 10.4% | 31.9%(-21.5)#19 | 24.1%(-13.6)#2,597 |
| 20. | Bellemeade | 10.5% | 31.9%(-21.4)#20 | 24.1%(-13.6)#2,633 |
| 21. | Pembroke | 11.1% | 31.9%(-20.8)#21 | 24.1%(-13.0)#2,878 |
| 22. | Hunters Hollow | 11.1% | 31.9%(-20.8)#22 | 24.1%(-13.0)#2,900 |
| 23. | Sycamore | 11.1% | 31.9%(-20.8)#23 | 24.1%(-13.0)#2,921 |
| 24. | Dixon | 11.4% | 31.9%(-20.5)#24 | 24.1%(-12.7)#2,987 |
| 25. | Reidland | 11.7% | 31.9%(-20.2)#25 | 24.1%(-12.4)#3,095 |
| 26. | Worthington Hills | 11.8% | 31.9%(-20.1)#26 | 24.1%(-12.3)#3,119 |
| 27. | Loretto | 11.8% | 31.9%(-20.1)#27 | 24.1%(-12.3)#3,133 |
| 28. | Crestwood | 12.5% | 31.9%(-19.4)#28 | 24.1%(-11.6)#3,383 |
| 29. | Lewisburg | 12.5% | 31.9%(-19.4)#29 | 24.1%(-11.6)#3,398 |
| 30. | Centertown | 12.5% | 31.9%(-19.4)#30 | 24.1%(-11.6)#3,421 |
| 31. | Highland Heights | 12.6% | 31.9%(-19.3)#31 | 24.1%(-11.5)#3,477 |
| 32. | Stanford | 12.8% | 31.9%(-19.2)#32 | 24.1%(-11.3)#3,524 |
| 33. | Whitesville | 13.2% | 31.9%(-18.8)#33 | 24.1%(-10.9)#3,692 |
| 34. | Elkton | 13.3% | 31.9%(-18.6)#34 | 24.1%(-10.7)#3,751 |
| 35. | Alexandria | 13.5% | 31.9%(-18.5)#35 | 24.1%(-10.6)#3,827 |
| 36. | Florence | 13.8% | 31.9%(-18.1)#36 | 24.1%(-10.3)#3,940 |
| 37. | Pioneer Village | 14.2% | 31.9%(-17.7)#37 | 24.1%(-9.91)#4,070 |
| 38. | Perryville | 14.2% | 31.9%(-17.7)#38 | 24.1%(-9.90)#4,072 |
| 39. | Hustonville | 14.3% | 31.9%(-17.6)#39 | 24.1%(-9.79)#4,151 |
| 40. | Mount Olivet | 14.3% | 31.9%(-17.6)#40 | 24.1%(-9.79)#4,205 |
| 41. | Sturgis | 14.9% | 31.9%(-17.0)#41 | 24.1%(-9.21)#4,402 |
| 42. | Coldstream | 15.0% | 31.9%(-16.9)#42 | 24.1%(-9.08)#4,450 |
| 43. | Jeffersontown | 15.3% | 31.9%(-16.6)#43 | 24.1%(-8.79)#4,556 |
| 44. | Bonnieville | 15.8% | 31.9%(-16.1)#44 | 24.1%(-8.29)#4,796 |
| 45. | Wilmore | 16.2% | 31.9%(-15.7)#45 | 24.1%(-7.91)#4,930 |
| 46. | Fort Wright | 16.2% | 31.9%(-15.7)#46 | 24.1%(-7.83)#4,959 |
| 47. | Russell Springs | 16.3% | 31.9%(-15.6)#47 | 24.1%(-7.80)#4,969 |
| 48. | Paris | 16.6% | 31.9%(-15.3)#48 | 24.1%(-7.44)#5,069 |
| 49. | Melbourne | 16.7% | 31.9%(-15.2)#49 | 24.1%(-7.41)#5,135 |
| 50. | Norwood | 16.7% | 31.9%(-15.2)#50 | 24.1%(-7.41)#5,147 |
| 51. | Hollyvilla | 16.7% | 31.9%(-15.2)#51 | 24.1%(-7.41)#5,149 |
| 52. | Sadieville | 16.7% | 31.9%(-15.2)#52 | 24.1%(-7.41)#5,155 |
| 53. | Fort Knox | 16.9% | 31.9%(-15.0)#53 | 24.1%(-7.13)#5,282 |
| 54. | Graymoor Devondale | 17.0% | 31.9%(-14.9)#54 | 24.1%(-7.07)#5,301 |
| 55. | Erlanger | 17.1% | 31.9%(-14.8)#55 | 24.1%(-6.98)#5,337 |
| 56. | Fort Thomas | 17.6% | 31.9%(-14.3)#56 | 24.1%(-6.43)#5,557 |
| 57. | Masonville | 18.1% | 31.9%(-13.8)#57 | 24.1%(-5.97)#5,754 |
| 58. | Woodburn | 18.2% | 31.9%(-13.7)#58 | 24.1%(-5.89)#5,818 |
| 59. | Bellevue | 18.3% | 31.9%(-13.6)#59 | 24.1%(-5.79)#5,857 |
| 60. | Princeton | 18.3% | 31.9%(-13.6)#60 | 24.1%(-5.73)#5,873 |
| 61. | Augusta | 18.4% | 31.9%(-13.5)#61 | 24.1%(-5.71)#5,883 |
| 62. | Lebanon Junction | 18.5% | 31.9%(-13.4)#62 | 24.1%(-5.59)#5,918 |
| 63. | Shelbyville | 18.5% | 31.9%(-13.4)#63 | 24.1%(-5.55)#5,939 |
| 64. | Greenup | 18.8% | 31.9%(-13.2)#64 | 24.1%(-5.33)#6,031 |
| 65. | Beechwood Village | 18.9% | 31.9%(-13.0)#65 | 24.1%(-5.21)#6,088 |
| 66. | Stamping Ground | 19.2% | 31.9%(-12.7)#66 | 24.1%(-4.90)#6,209 |
| 67. | Oak Grove | 19.2% | 31.9%(-12.7)#67 | 24.1%(-4.85)#6,219 |
| 68. | Uniontown | 19.4% | 31.9%(-12.5)#68 | 24.1%(-4.63)#6,316 |
| 69. | Nortonville | 19.5% | 31.9%(-12.4)#69 | 24.1%(-4.56)#6,342 |
| 70. | Lyndon | 19.6% | 31.9%(-12.3)#70 | 24.1%(-4.51)#6,356 |
| 71. | Radcliff | 20.0% | 31.9%(-11.9)#71 | 24.1%(-4.10)#6,473 |
| 72. | Island | 20.0% | 31.9%(-11.9)#72 | 24.1%(-4.08)#6,552 |
| 73. | Corinth | 20.0% | 31.9%(-11.9)#73 | 24.1%(-4.08)#6,610 |
| 74. | Prestonville | 20.0% | 31.9%(-11.9)#74 | 24.1%(-4.08)#6,656 |
| 75. | Hillview | 20.4% | 31.9%(-11.5)#75 | 24.1%(-3.69)#6,762 |
| 76. | Taylor Mill | 20.4% | 31.9%(-11.5)#76 | 24.1%(-3.66)#6,773 |
| 77. | Georgetown | 20.8% | 31.9%(-11.1)#77 | 24.1%(-3.25)#6,910 |
| 78. | Versailles | 20.9% | 31.9%(-11.0)#78 | 24.1%(-3.17)#6,941 |
| 79. | Hurstbourne Acres | 20.9% | 31.9%(-11.0)#79 | 24.1%(-3.15)#6,951 |
| 80. | Bardstown | 21.2% | 31.9%(-10.7)#80 | 24.1%(-2.86)#7,052 |
| 81. | Bellefonte | 21.4% | 31.9%(-10.5)#81 | 24.1%(-2.65)#7,131 |
| 82. | Edgewood | 21.7% | 31.9%(-10.2)#82 | 24.1%(-2.41)#7,227 |
| 83. | Hebron | 21.7% | 31.9%(-10.2)#83 | 24.1%(-2.37)#7,241 |
| 84. | Moorland | 21.7% | 31.9%(-10.2)#84 | 24.1%(-2.34)#7,250 |
| 85. | Ghent | 22.0% | 31.9%(-9.96)#85 | 24.1%(-2.13)#7,354 |
| 86. | Smithfield | 22.2% | 31.9%(-9.69)#86 | 24.1%(-1.85)#7,509 |
| 87. | Elsmere | 22.7% | 31.9%(-9.24)#87 | 24.1%(-1.41)#7,671 |
| 88. | Providence | 22.7% | 31.9%(-9.18)#88 | 24.1%(-1.35)#7,688 |
| 89. | La Grange | 23.0% | 31.9%(-8.89)#89 | 24.1%(-1.06)#7,816 |
| 90. | Corydon | 23.1% | 31.9%(-8.83)#90 | 24.1%(-1.000)#7,855 |
| 91. | Maceo | 23.1% | 31.9%(-8.83)#91 | 24.1%(-1.000)#7,863 |
| 92. | Massac | 23.1% | 31.9%(-8.77)#92 | 24.1%(-0.939)#7,895 |
| 93. | Heritage Creek | 23.2% | 31.9%(-8.69)#93 | 24.1%(-0.862)#7,920 |
| 94. | Elizabethtown | 23.3% | 31.9%(-8.60)#94 | 24.1%(-0.771)#7,953 |
| 95. | Hurstbourne | 23.5% | 31.9%(-8.38)#95 | 24.1%(-0.547)#8,031 |
| 96. | Lynch | 23.5% | 31.9%(-8.38)#96 | 24.1%(-0.547)#8,048 |
| 97. | Taylorsville | 23.6% | 31.9%(-8.34)#97 | 24.1%(-0.505)#8,069 |
| 98. | Hebron Estates | 23.6% | 31.9%(-8.33)#98 | 24.1%(-0.499)#8,070 |
| 99. | Middletown | 23.6% | 31.9%(-8.30)#99 | 24.1%(-0.470)#8,073 |
| 100. | Silver Grove | 24.1% | 31.9%(-7.86)#100 | 24.1%(-0.026)#8,239 |
Common Questions
What are the Top 10 Cities with the Lowest Poverty Level Among Single Females in Kentucky?
Top 10 Cities with the Lowest Poverty Level Among Single Females in Kentucky are:
#1
2.3%
#2
2.8%
#3
4.3%
#4
4.7%
#5
4.8%
#6
4.8%
#7
7.4%
#8
7.5%
#9
7.6%
#10
8.0%
What city has the Lowest Poverty Level Among Single Females in Kentucky?
Oakbrook has the Lowest Poverty Level Among Single Females in Kentucky with 2.3%.
What is the Poverty Level Among Single Females in the State of Kentucky?
Poverty Level Among Single Females in Kentucky is 31.9%.
What is the Poverty Level Among Single Females in the United States?
Poverty Level Among Single Females in the United States is 24.1%.