Cities with the Largest Northern European Community in Kentucky
RELATED REPORTS & OPTIONS
Northern European
Kentucky
Compare Cities
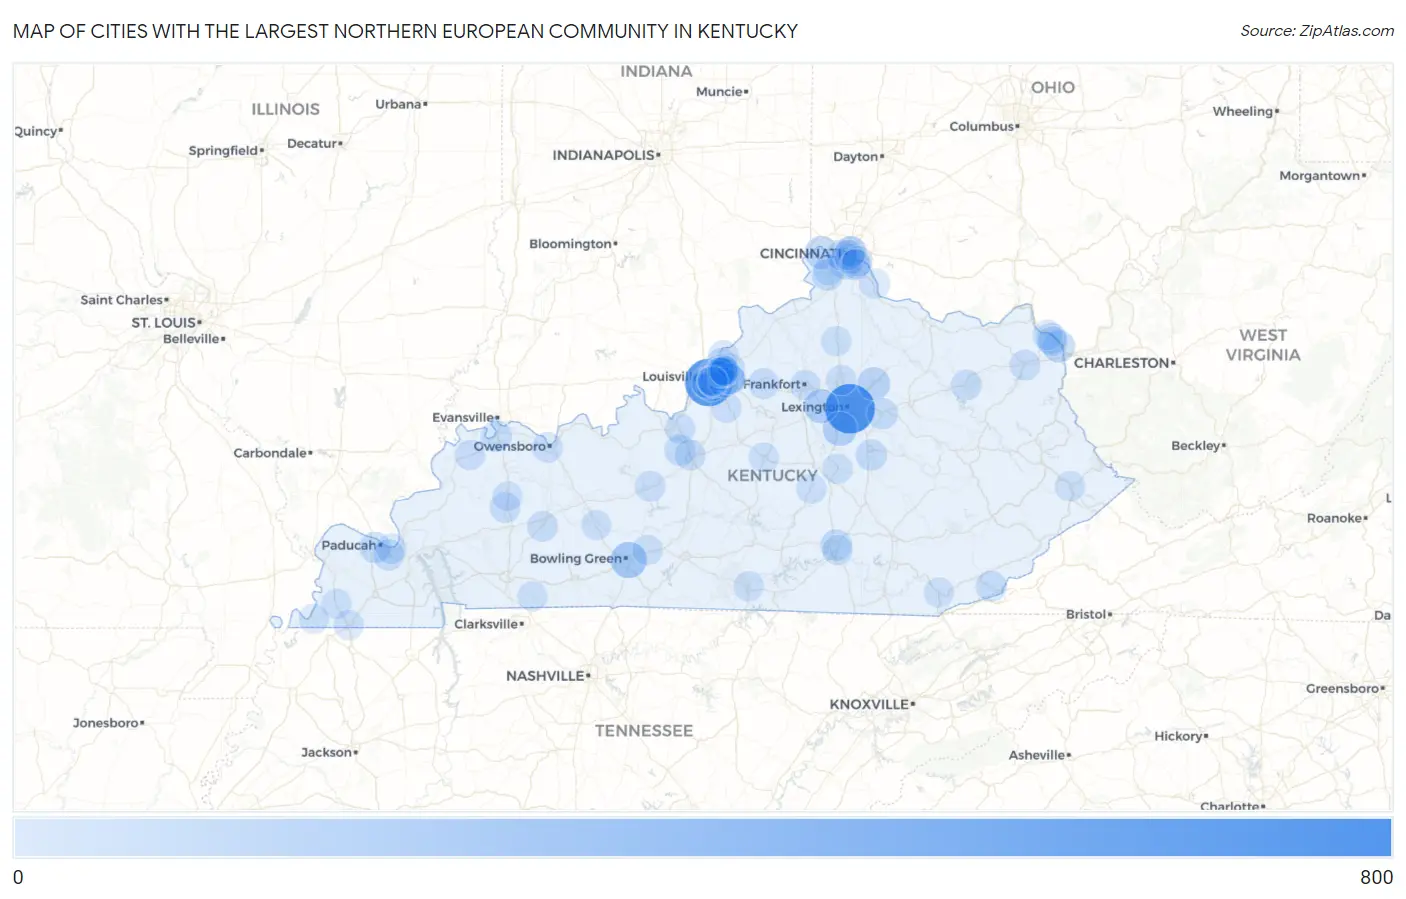
Map of Cities with the Largest Northern European Community in Kentucky
0
800
Cities with the Largest Northern European Community in Kentucky
| City | Northern European | vs State | vs National | |
| 1. | Lexington | 608 | 4,193(14.50%)#1 | 487,800(0.12%)#66 |
| 2. | Louisville | 541 | 4,193(12.90%)#2 | 487,800(0.11%)#76 |
| 3. | Bowling Green | 182 | 4,193(4.34%)#3 | 487,800(0.04%)#396 |
| 4. | Nicholasville | 120 | 4,193(2.86%)#4 | 487,800(0.02%)#674 |
| 5. | Versailles | 118 | 4,193(2.81%)#5 | 487,800(0.02%)#692 |
| 6. | St Matthews | 94 | 4,193(2.24%)#6 | 487,800(0.02%)#880 |
| 7. | Paris | 83 | 4,193(1.98%)#7 | 487,800(0.02%)#1,017 |
| 8. | Francisville | 78 | 4,193(1.86%)#8 | 487,800(0.02%)#1,084 |
| 9. | Graymoor Devondale | 78 | 4,193(1.86%)#9 | 487,800(0.02%)#1,089 |
| 10. | Ashland | 69 | 4,193(1.65%)#10 | 487,800(0.01%)#1,204 |
| 11. | Lyndon | 49 | 4,193(1.17%)#11 | 487,800(0.01%)#1,649 |
| 12. | Somerset | 46 | 4,193(1.10%)#12 | 487,800(0.01%)#1,749 |
| 13. | Middletown | 44 | 4,193(1.05%)#13 | 487,800(0.01%)#1,807 |
| 14. | Union | 42 | 4,193(1.00%)#14 | 487,800(0.01%)#1,886 |
| 15. | Richmond | 40 | 4,193(0.95%)#15 | 487,800(0.01%)#1,935 |
| 16. | Covington | 39 | 4,193(0.93%)#16 | 487,800(0.01%)#1,973 |
| 17. | Paducah | 38 | 4,193(0.91%)#17 | 487,800(0.01%)#2,017 |
| 18. | Bellevue | 35 | 4,193(0.83%)#18 | 487,800(0.01%)#2,141 |
| 19. | Douglass Hills | 33 | 4,193(0.79%)#19 | 487,800(0.01%)#2,230 |
| 20. | Winchester | 31 | 4,193(0.74%)#20 | 487,800(0.01%)#2,306 |
| 21. | Henderson | 30 | 4,193(0.72%)#21 | 487,800(0.01%)#2,359 |
| 22. | Russell | 30 | 4,193(0.72%)#22 | 487,800(0.01%)#2,399 |
| 23. | Rineyville | 30 | 4,193(0.72%)#23 | 487,800(0.01%)#2,402 |
| 24. | Cawood | 28 | 4,193(0.67%)#24 | 487,800(0.01%)#2,531 |
| 25. | Reidland | 27 | 4,193(0.64%)#25 | 487,800(0.01%)#2,575 |
| 26. | Elizabethtown | 23 | 4,193(0.55%)#26 | 487,800(0.00%)#2,809 |
| 27. | Madisonville | 20 | 4,193(0.48%)#27 | 487,800(0.00%)#3,036 |
| 28. | Florence | 19 | 4,193(0.45%)#28 | 487,800(0.00%)#3,111 |
| 29. | Grayson | 19 | 4,193(0.45%)#29 | 487,800(0.00%)#3,164 |
| 30. | Greenville | 18 | 4,193(0.43%)#30 | 487,800(0.00%)#3,273 |
| 31. | Shelbyville | 17 | 4,193(0.41%)#31 | 487,800(0.00%)#3,320 |
| 32. | Morehead | 17 | 4,193(0.41%)#32 | 487,800(0.00%)#3,354 |
| 33. | Prospect | 17 | 4,193(0.41%)#33 | 487,800(0.00%)#3,365 |
| 34. | Mount Washington | 16 | 4,193(0.38%)#34 | 487,800(0.00%)#3,433 |
| 35. | Ludlow | 16 | 4,193(0.38%)#35 | 487,800(0.00%)#3,479 |
| 36. | Clarkson | 16 | 4,193(0.38%)#36 | 487,800(0.00%)#3,516 |
| 37. | Owensboro | 15 | 4,193(0.36%)#37 | 487,800(0.00%)#3,529 |
| 38. | Barbourmeade | 14 | 4,193(0.33%)#38 | 487,800(0.00%)#3,753 |
| 39. | Southgate | 13 | 4,193(0.31%)#39 | 487,800(0.00%)#3,841 |
| 40. | Indian Hills | 13 | 4,193(0.31%)#40 | 487,800(0.00%)#3,848 |
| 41. | Georgetown | 12 | 4,193(0.29%)#41 | 487,800(0.00%)#3,893 |
| 42. | Cold Spring | 12 | 4,193(0.29%)#42 | 487,800(0.00%)#3,964 |
| 43. | Dayton | 12 | 4,193(0.29%)#43 | 487,800(0.00%)#3,966 |
| 44. | Fort Knox | 11 | 4,193(0.26%)#44 | 487,800(0.00%)#4,087 |
| 45. | Worthington Hills | 11 | 4,193(0.26%)#45 | 487,800(0.00%)#4,141 |
| 46. | Ledbetter | 11 | 4,193(0.26%)#46 | 487,800(0.00%)#4,148 |
| 47. | Thruston | 10 | 4,193(0.24%)#47 | 487,800(0.00%)#4,305 |
| 48. | Frankfort | 9 | 4,193(0.21%)#48 | 487,800(0.00%)#4,377 |
| 49. | Newport | 8 | 4,193(0.19%)#49 | 487,800(0.00%)#4,588 |
| 50. | Lancaster | 8 | 4,193(0.19%)#50 | 487,800(0.00%)#4,652 |
| 51. | Waverly | 8 | 4,193(0.19%)#51 | 487,800(0.00%)#4,746 |
| 52. | Oakland | 8 | 4,193(0.19%)#52 | 487,800(0.00%)#4,752 |
| 53. | Corinth | 7 | 4,193(0.17%)#53 | 487,800(0.00%)#4,945 |
| 54. | Pikeville | 6 | 4,193(0.14%)#54 | 487,800(0.00%)#4,988 |
| 55. | Meadow Vale | 6 | 4,193(0.14%)#55 | 487,800(0.00%)#5,118 |
| 56. | Plantation | 6 | 4,193(0.14%)#56 | 487,800(0.00%)#5,121 |
| 57. | Strathmoor Village | 6 | 4,193(0.14%)#57 | 487,800(0.00%)#5,141 |
| 58. | Bellewood | 6 | 4,193(0.14%)#58 | 487,800(0.00%)#5,160 |
| 59. | Beechwood Village | 5 | 4,193(0.12%)#59 | 487,800(0.00%)#5,295 |
| 60. | Clinton | 5 | 4,193(0.12%)#60 | 487,800(0.00%)#5,302 |
| 61. | Ferguson | 5 | 4,193(0.12%)#61 | 487,800(0.00%)#5,322 |
| 62. | Watterson Park | 5 | 4,193(0.12%)#62 | 487,800(0.00%)#5,324 |
| 63. | Mentor | 5 | 4,193(0.12%)#63 | 487,800(0.00%)#5,361 |
| 64. | Raceland | 4 | 4,193(0.10%)#64 | 487,800(0.00%)#5,444 |
| 65. | Burkesville | 4 | 4,193(0.10%)#65 | 487,800(0.00%)#5,482 |
| 66. | Silver Grove | 4 | 4,193(0.10%)#66 | 487,800(0.00%)#5,487 |
| 67. | Bellefonte | 4 | 4,193(0.10%)#67 | 487,800(0.00%)#5,492 |
| 68. | Brownsboro Farm | 4 | 4,193(0.10%)#68 | 487,800(0.00%)#5,542 |
| 69. | Springfield | 3 | 4,193(0.07%)#69 | 487,800(0.00%)#5,628 |
| 70. | Morgantown | 3 | 4,193(0.07%)#70 | 487,800(0.00%)#5,632 |
| 71. | Fulton | 3 | 4,193(0.07%)#71 | 487,800(0.00%)#5,635 |
| 72. | Goshen | 3 | 4,193(0.07%)#72 | 487,800(0.00%)#5,747 |
| 73. | Pineville | 2 | 4,193(0.05%)#73 | 487,800(0.00%)#5,905 |
| 74. | Audubon Park | 2 | 4,193(0.05%)#74 | 487,800(0.00%)#5,924 |
| 75. | Hanson | 2 | 4,193(0.05%)#75 | 487,800(0.00%)#5,959 |
| 76. | Parkway Village | 2 | 4,193(0.05%)#76 | 487,800(0.00%)#6,011 |
| 77. | Woodland Hills | 2 | 4,193(0.05%)#77 | 487,800(0.00%)#6,012 |
| 78. | Hustonville | 2 | 4,193(0.05%)#78 | 487,800(0.00%)#6,016 |
| 79. | Seneca Gardens | 2 | 4,193(0.05%)#79 | 487,800(0.00%)#6,028 |
| 80. | Wellington | 2 | 4,193(0.05%)#80 | 487,800(0.00%)#6,070 |
| 81. | Forest Hills | 2 | 4,193(0.05%)#81 | 487,800(0.00%)#6,072 |
| 82. | Briarwood | 2 | 4,193(0.05%)#82 | 487,800(0.00%)#6,088 |
| 83. | Goose Creek | 2 | 4,193(0.05%)#83 | 487,800(0.00%)#6,109 |
| 84. | Trenton | 2 | 4,193(0.05%)#84 | 487,800(0.00%)#6,110 |
| 85. | Manor Creek | 2 | 4,193(0.05%)#85 | 487,800(0.00%)#6,116 |
| 86. | Hickman | 1 | 4,193(0.02%)#86 | 487,800(0.00%)#6,189 |
| 87. | Bancroft | 1 | 4,193(0.02%)#87 | 487,800(0.00%)#6,244 |
| 88. | Crestview | 1 | 4,193(0.02%)#88 | 487,800(0.00%)#6,247 |
| 89. | Strathmoor Manor | 1 | 4,193(0.02%)#89 | 487,800(0.00%)#6,248 |
| 90. | Creekside | 1 | 4,193(0.02%)#90 | 487,800(0.00%)#6,271 |
Common Questions
What are the Top 10 Cities with the Largest Northern European Community in Kentucky?
Top 10 Cities with the Largest Northern European Community in Kentucky are:
#1
608
#2
541
#3
182
#4
120
#5
118
#6
94
#7
83
#8
78
#9
78
#10
69
What city has the Largest Northern European Community in Kentucky?
Lexington has the Largest Northern European Community in Kentucky with 608.
What is the Total Northern European Population in the State of Kentucky?
Total Northern European Population in Kentucky is 4,193.
What is the Total Northern European Population in the United States?
Total Northern European Population in the United States is 487,800.