Cities with the Highest Percentage of Population Enrolled in Kindergarten in Kentucky
RELATED REPORTS & OPTIONS
Kindergarten
Kentucky
Compare Cities
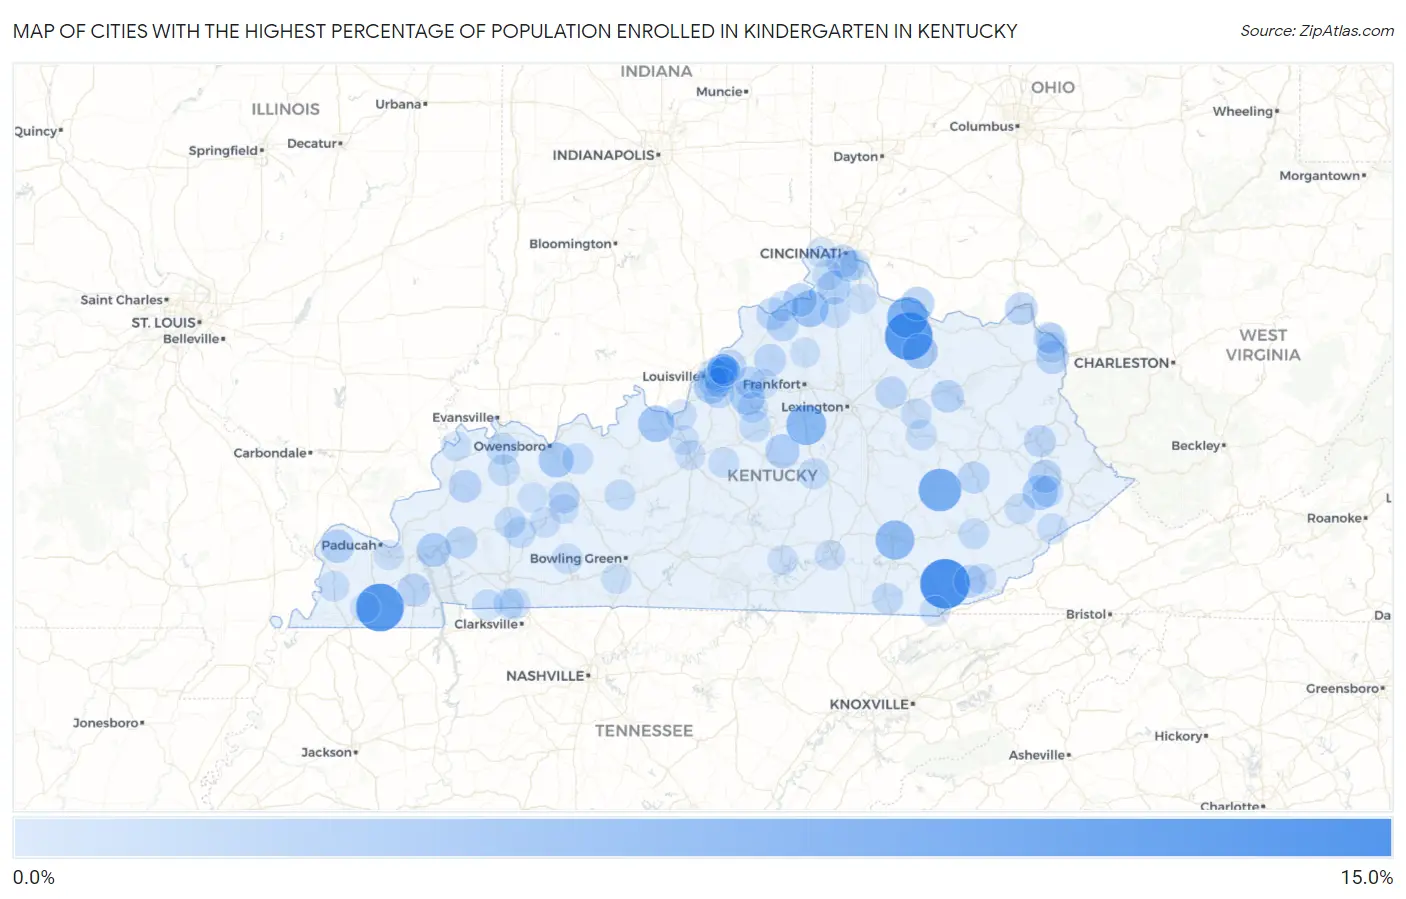
Map of Cities with the Highest Percentage of Population Enrolled in Kindergarten in Kentucky
0.0%
15.0%
Cities with the Highest Percentage of Population Enrolled in Kindergarten in Kentucky
| City | % in Kindergarten | vs State | vs National | |
| 1. | Arjay | 13.5% | 1.2%(+12.3)#1 | 1.3%(+12.3)#82 |
| 2. | Sedalia | 12.4% | 1.2%(+11.2)#2 | 1.3%(+11.2)#106 |
| 3. | Sardis | 12.3% | 1.2%(+11.1)#3 | 1.3%(+11.1)#109 |
| 4. | Yelvington | 11.7% | 1.2%(+10.5)#4 | 1.3%(+10.5)#116 |
| 5. | Booneville | 9.4% | 1.2%(+8.16)#5 | 1.3%(+8.10)#211 |
| 6. | Germantown | 8.3% | 1.2%(+7.14)#6 | 1.3%(+7.08)#276 |
| 7. | Salvisa | 7.7% | 1.2%(+6.53)#7 | 1.3%(+6.47)#324 |
| 8. | London | 7.2% | 1.2%(+6.00)#8 | 1.3%(+5.94)#380 |
| 9. | Glencoe | 5.8% | 1.2%(+4.63)#9 | 1.3%(+4.58)#615 |
| 10. | Ekron | 5.5% | 1.2%(+4.33)#10 | 1.3%(+4.27)#688 |
| 11. | Ewing | 5.0% | 1.2%(+3.79)#11 | 1.3%(+3.73)#874 |
| 12. | Masonville | 4.8% | 1.2%(+3.62)#12 | 1.3%(+3.56)#934 |
| 13. | Wayland | 4.7% | 1.2%(+3.52)#13 | 1.3%(+3.47)#966 |
| 14. | Watterson Park | 4.7% | 1.2%(+3.51)#14 | 1.3%(+3.45)#973 |
| 15. | Elk Creek | 4.7% | 1.2%(+3.46)#15 | 1.3%(+3.40)#997 |
| 16. | Rolling Hills | 4.6% | 1.2%(+3.45)#16 | 1.3%(+3.40)#998 |
| 17. | Mackville | 4.3% | 1.2%(+3.10)#17 | 1.3%(+3.04)#1,186 |
| 18. | Kuttawa | 4.2% | 1.2%(+3.01)#18 | 1.3%(+2.96)#1,242 |
| 19. | Walton | 4.1% | 1.2%(+2.94)#19 | 1.3%(+2.88)#1,285 |
| 20. | Dover | 4.1% | 1.2%(+2.88)#20 | 1.3%(+2.82)#1,334 |
| 21. | Warsaw | 4.0% | 1.2%(+2.83)#21 | 1.3%(+2.77)#1,367 |
| 22. | Philpot | 4.0% | 1.2%(+2.81)#22 | 1.3%(+2.75)#1,378 |
| 23. | La Center | 3.9% | 1.2%(+2.68)#23 | 1.3%(+2.62)#1,490 |
| 24. | Martin | 3.7% | 1.2%(+2.52)#24 | 1.3%(+2.46)#1,634 |
| 25. | Cannonsburg | 3.7% | 1.2%(+2.49)#25 | 1.3%(+2.43)#1,668 |
| 26. | Hardin | 3.6% | 1.2%(+2.41)#26 | 1.3%(+2.35)#1,763 |
| 27. | Salt Lick | 3.6% | 1.2%(+2.36)#27 | 1.3%(+2.30)#1,812 |
| 28. | Fort Wright | 3.5% | 1.2%(+2.31)#28 | 1.3%(+2.25)#1,853 |
| 29. | Wallins Creek | 3.5% | 1.2%(+2.30)#29 | 1.3%(+2.25)#1,862 |
| 30. | Wheatcroft | 3.5% | 1.2%(+2.30)#30 | 1.3%(+2.25)#1,863 |
| 31. | South Shore | 3.5% | 1.2%(+2.26)#31 | 1.3%(+2.20)#1,911 |
| 32. | Norwood | 3.4% | 1.2%(+2.22)#32 | 1.3%(+2.16)#1,951 |
| 33. | Orchard Grass Hills | 3.4% | 1.2%(+2.21)#33 | 1.3%(+2.15)#1,967 |
| 34. | Carrollton | 3.4% | 1.2%(+2.18)#34 | 1.3%(+2.12)#2,013 |
| 35. | Manor Creek | 3.3% | 1.2%(+2.14)#35 | 1.3%(+2.08)#2,061 |
| 36. | Worthville | 3.3% | 1.2%(+2.12)#36 | 1.3%(+2.07)#2,086 |
| 37. | Eminence | 3.2% | 1.2%(+1.99)#37 | 1.3%(+1.93)#2,276 |
| 38. | Jackson | 3.1% | 1.2%(+1.95)#38 | 1.3%(+1.89)#2,335 |
| 39. | Centertown | 3.1% | 1.2%(+1.94)#39 | 1.3%(+1.88)#2,346 |
| 40. | Simpsonville | 3.1% | 1.2%(+1.90)#40 | 1.3%(+1.85)#2,390 |
| 41. | Princeton | 3.1% | 1.2%(+1.89)#41 | 1.3%(+1.84)#2,404 |
| 42. | Paintsville | 3.1% | 1.2%(+1.88)#42 | 1.3%(+1.82)#2,425 |
| 43. | North Middletown | 3.1% | 1.2%(+1.87)#43 | 1.3%(+1.81)#2,436 |
| 44. | Anthoston | 3.0% | 1.2%(+1.80)#44 | 1.3%(+1.74)#2,572 |
| 45. | Mcdowell | 3.0% | 1.2%(+1.77)#45 | 1.3%(+1.71)#2,615 |
| 46. | Spring Mill | 2.9% | 1.2%(+1.70)#46 | 1.3%(+1.64)#2,763 |
| 47. | Sebree | 2.8% | 1.2%(+1.62)#47 | 1.3%(+1.56)#2,935 |
| 48. | Bloomfield | 2.7% | 1.2%(+1.50)#48 | 1.3%(+1.44)#3,176 |
| 49. | Junction City | 2.7% | 1.2%(+1.50)#49 | 1.3%(+1.44)#3,185 |
| 50. | Broeck Pointe | 2.7% | 1.2%(+1.48)#50 | 1.3%(+1.42)#3,226 |
| 51. | Emlyn | 2.7% | 1.2%(+1.47)#51 | 1.3%(+1.42)#3,237 |
| 52. | White Plains | 2.7% | 1.2%(+1.47)#52 | 1.3%(+1.41)#3,254 |
| 53. | Lafayette | 2.6% | 1.2%(+1.44)#53 | 1.3%(+1.38)#3,325 |
| 54. | Oak Grove | 2.6% | 1.2%(+1.41)#54 | 1.3%(+1.35)#3,404 |
| 55. | Taylor Mill | 2.6% | 1.2%(+1.41)#55 | 1.3%(+1.35)#3,405 |
| 56. | Dry Ridge | 2.6% | 1.2%(+1.40)#56 | 1.3%(+1.35)#3,420 |
| 57. | Rolling Fields | 2.6% | 1.2%(+1.40)#57 | 1.3%(+1.34)#3,438 |
| 58. | Hyden | 2.6% | 1.2%(+1.37)#58 | 1.3%(+1.31)#3,506 |
| 59. | Mortons Gap | 2.6% | 1.2%(+1.36)#59 | 1.3%(+1.30)#3,518 |
| 60. | Caneyville | 2.5% | 1.2%(+1.35)#60 | 1.3%(+1.29)#3,555 |
| 61. | Whitesville | 2.5% | 1.2%(+1.32)#61 | 1.3%(+1.27)#3,633 |
| 62. | Russell | 2.5% | 1.2%(+1.28)#62 | 1.3%(+1.23)#3,735 |
| 63. | Arlington | 2.5% | 1.2%(+1.27)#63 | 1.3%(+1.21)#3,784 |
| 64. | West Point | 2.5% | 1.2%(+1.26)#64 | 1.3%(+1.20)#3,794 |
| 65. | Fort Campbell North | 2.5% | 1.2%(+1.26)#65 | 1.3%(+1.20)#3,799 |
| 66. | Van Lear | 2.4% | 1.2%(+1.25)#66 | 1.3%(+1.20)#3,819 |
| 67. | Fleming Neon | 2.4% | 1.2%(+1.25)#67 | 1.3%(+1.19)#3,826 |
| 68. | Stanton | 2.4% | 1.2%(+1.23)#68 | 1.3%(+1.17)#3,920 |
| 69. | Hindman | 2.4% | 1.2%(+1.23)#69 | 1.3%(+1.17)#3,921 |
| 70. | Camargo | 2.4% | 1.2%(+1.20)#70 | 1.3%(+1.14)#4,002 |
| 71. | Flatwoods | 2.4% | 1.2%(+1.19)#71 | 1.3%(+1.13)#4,037 |
| 72. | Middlesborough | 2.4% | 1.2%(+1.18)#72 | 1.3%(+1.13)#4,072 |
| 73. | Taylorsville | 2.4% | 1.2%(+1.18)#73 | 1.3%(+1.13)#4,079 |
| 74. | Lewisburg | 2.4% | 1.2%(+1.18)#74 | 1.3%(+1.12)#4,087 |
| 75. | Ironville | 2.4% | 1.2%(+1.16)#75 | 1.3%(+1.11)#4,131 |
| 76. | New Haven | 2.3% | 1.2%(+1.13)#76 | 1.3%(+1.08)#4,240 |
| 77. | Ghent | 2.3% | 1.2%(+1.12)#77 | 1.3%(+1.07)#4,281 |
| 78. | Strathmoor Manor | 2.3% | 1.2%(+1.12)#78 | 1.3%(+1.06)#4,289 |
| 79. | Powderly | 2.3% | 1.2%(+1.08)#79 | 1.3%(+1.02)#4,420 |
| 80. | Union | 2.2% | 1.2%(+1.04)#80 | 1.3%(+0.987)#4,536 |
| 81. | Reidland | 2.2% | 1.2%(+1.03)#81 | 1.3%(+0.971)#4,598 |
| 82. | Elizabethtown | 2.2% | 1.2%(+1.01)#82 | 1.3%(+0.957)#4,662 |
| 83. | Harlan | 2.2% | 1.2%(+1.01)#83 | 1.3%(+0.957)#4,665 |
| 84. | Briarwood | 2.2% | 1.2%(+0.998)#84 | 1.3%(+0.941)#4,735 |
| 85. | Houston Acres | 2.2% | 1.2%(+0.965)#85 | 1.3%(+0.908)#4,875 |
| 86. | Francisville | 2.1% | 1.2%(+0.942)#86 | 1.3%(+0.884)#4,967 |
| 87. | Rockport | 2.1% | 1.2%(+0.925)#87 | 1.3%(+0.868)#5,031 |
| 88. | Brownsboro Farm | 2.1% | 1.2%(+0.913)#88 | 1.3%(+0.856)#5,083 |
| 89. | Uniontown | 2.1% | 1.2%(+0.901)#89 | 1.3%(+0.844)#5,136 |
| 90. | Burnside | 2.1% | 1.2%(+0.899)#90 | 1.3%(+0.842)#5,146 |
| 91. | Woodburn | 2.1% | 1.2%(+0.897)#91 | 1.3%(+0.839)#5,154 |
| 92. | Wingo | 2.1% | 1.2%(+0.877)#92 | 1.3%(+0.820)#5,242 |
| 93. | Radcliff | 2.1% | 1.2%(+0.860)#93 | 1.3%(+0.803)#5,308 |
| 94. | Monterey | 2.0% | 1.2%(+0.847)#94 | 1.3%(+0.790)#5,374 |
| 95. | Jamestown | 2.0% | 1.2%(+0.839)#95 | 1.3%(+0.782)#5,401 |
| 96. | Butler | 2.0% | 1.2%(+0.821)#96 | 1.3%(+0.764)#5,483 |
| 97. | Shelbyville | 2.0% | 1.2%(+0.820)#97 | 1.3%(+0.763)#5,486 |
| 98. | Creekside | 2.0% | 1.2%(+0.806)#98 | 1.3%(+0.749)#5,557 |
| 99. | Cold Spring | 2.0% | 1.2%(+0.793)#99 | 1.3%(+0.735)#5,615 |
| 100. | Sacramento | 2.0% | 1.2%(+0.791)#100 | 1.3%(+0.734)#5,620 |
Common Questions
What are the Top 10 Cities with the Highest Percentage of Population Enrolled in Kindergarten in Kentucky?
Top 10 Cities with the Highest Percentage of Population Enrolled in Kindergarten in Kentucky are:
#1
13.5%
#2
12.4%
#3
12.3%
#4
9.4%
#5
8.3%
#6
7.7%
#7
7.2%
#8
5.8%
#9
5.5%
#10
5.0%
What city has the Highest Percentage of Population Enrolled in Kindergarten in Kentucky?
Arjay has the Highest Percentage of Population Enrolled in Kindergarten in Kentucky with 13.5%.
What is the Percentage of Population Enrolled in Kindergarten in the State of Kentucky?
Percentage of Population Enrolled in Kindergarten in Kentucky is 1.2%.
What is the Percentage of Population Enrolled in Kindergarten in the United States?
Percentage of Population Enrolled in Kindergarten in the United States is 1.3%.