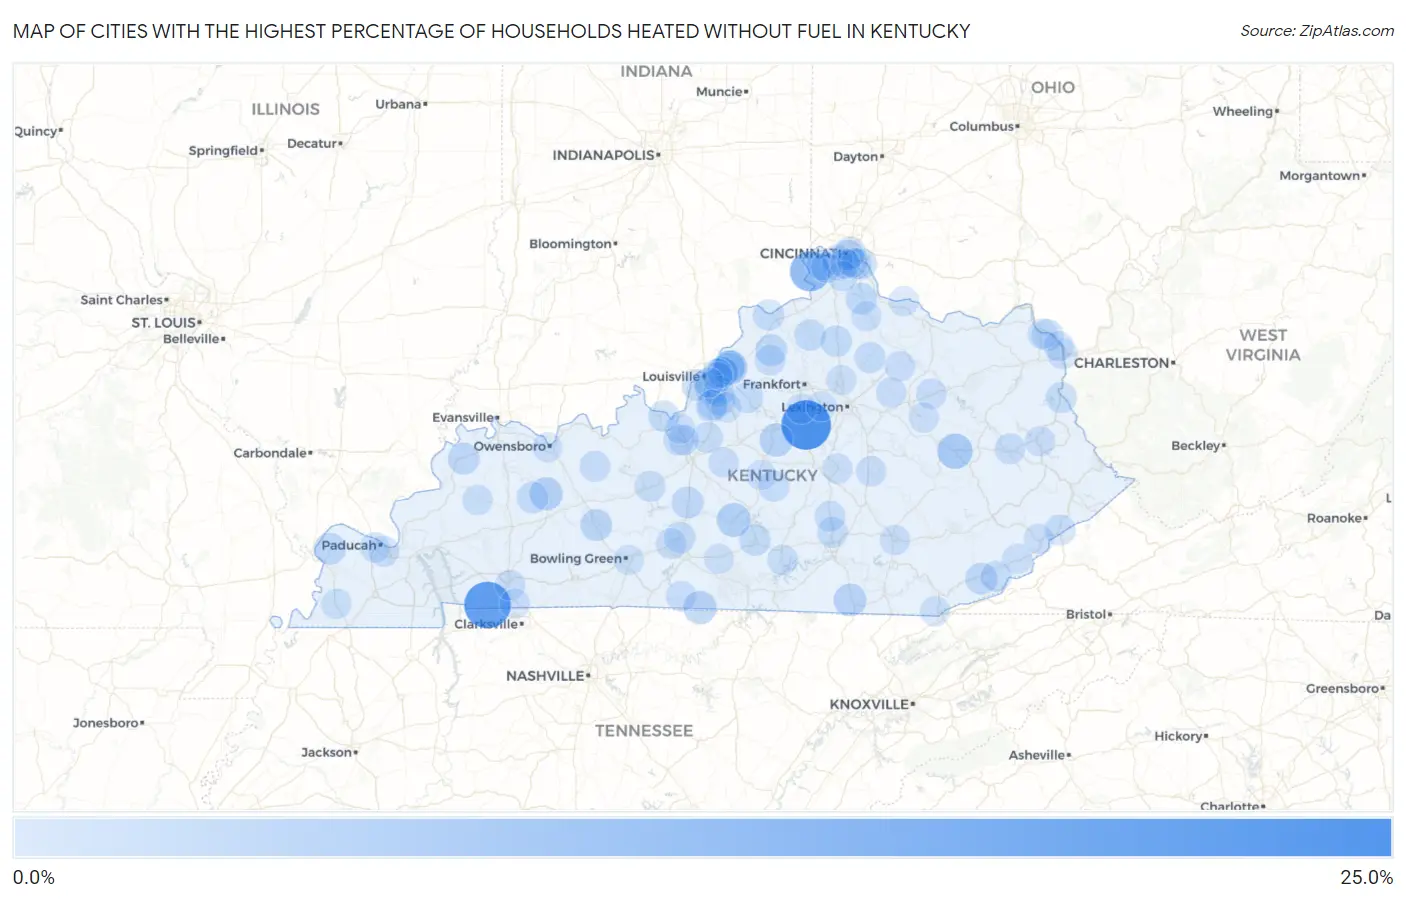
Cities with the Highest Percentage of Households Heated without Fuel in Kentucky
RELATED REPORTS & OPTIONS
Fuel-less Heating
Kentucky
Compare Cities
Map of Cities with the Highest Percentage of Households Heated without Fuel in Kentucky
0.0%
25.0%
Cities with the Highest Percentage of Households Heated without Fuel in Kentucky
| City | Fuel-less Heating | vs State | vs National | |
| 1. | Salvisa | 22.2% | 0.40%(+21.8)#1 | 1.2%(+21.0)#494 |
| 2. | Lafayette | 18.8% | 0.40%(+18.4)#2 | 1.2%(+17.6)#517 |
| 3. | Belleview | 11.4% | 0.40%(+11.0)#3 | 1.2%(+10.2)#611 |
| 4. | Yelvington | 7.7% | 0.40%(+7.30)#4 | 1.2%(+6.50)#752 |
| 5. | Campton | 5.9% | 0.40%(+5.50)#5 | 1.2%(+4.70)#913 |
| 6. | Coldstream | 5.4% | 0.40%(+5.00)#6 | 1.2%(+4.20)#979 |
| 7. | Greensburg | 4.3% | 0.40%(+3.90)#7 | 1.2%(+3.10)#1,212 |
| 8. | Willisburg | 3.8% | 0.40%(+3.40)#8 | 1.2%(+2.60)#1,346 |
| 9. | Gamaliel | 3.7% | 0.40%(+3.30)#9 | 1.2%(+2.50)#1,379 |
| 10. | Island | 3.5% | 0.40%(+3.10)#10 | 1.2%(+2.30)#1,440 |
| 11. | Poplar Hills | 3.4% | 0.40%(+3.00)#11 | 1.2%(+2.20)#1,471 |
| 12. | Stearns | 3.3% | 0.40%(+2.90)#12 | 1.2%(+2.10)#1,505 |
| 13. | Morgantown | 2.4% | 0.40%(+2.00)#13 | 1.2%(+1.20)#2,024 |
| 14. | Harlan | 2.3% | 0.40%(+1.90)#14 | 1.2%(+1.10)#2,121 |
| 15. | Breckinridge Center | 2.2% | 0.40%(+1.80)#15 | 1.2%(+1.00)#2,224 |
| 16. | New Castle | 2.2% | 0.40%(+1.80)#16 | 1.2%(+1.00)#2,249 |
| 17. | Barlow | 2.2% | 0.40%(+1.80)#17 | 1.2%(+1.00)#2,261 |
| 18. | Bonnieville | 2.2% | 0.40%(+1.80)#18 | 1.2%(+1.00)#2,272 |
| 19. | Fox Chase | 2.0% | 0.40%(+1.60)#19 | 1.2%(+0.800)#2,509 |
| 20. | Fincastle | 2.0% | 0.40%(+1.60)#20 | 1.2%(+0.800)#2,510 |
| 21. | Raceland | 1.9% | 0.40%(+1.50)#21 | 1.2%(+0.700)#2,624 |
| 22. | Sacramento | 1.9% | 0.40%(+1.50)#22 | 1.2%(+0.700)#2,672 |
| 23. | Owenton | 1.8% | 0.40%(+1.40)#23 | 1.2%(+0.600)#2,796 |
| 24. | Butler | 1.8% | 0.40%(+1.40)#24 | 1.2%(+0.600)#2,833 |
| 25. | Corinth | 1.8% | 0.40%(+1.40)#25 | 1.2%(+0.600)#2,847 |
| 26. | Bellevue | 1.7% | 0.40%(+1.30)#26 | 1.2%(+0.500)#2,917 |
| 27. | Columbia | 1.7% | 0.40%(+1.30)#27 | 1.2%(+0.500)#2,924 |
| 28. | Melbourne | 1.7% | 0.40%(+1.30)#28 | 1.2%(+0.500)#2,982 |
| 29. | Shively | 1.6% | 0.40%(+1.20)#29 | 1.2%(+0.400)#3,050 |
| 30. | Cave City | 1.6% | 0.40%(+1.20)#30 | 1.2%(+0.400)#3,112 |
| 31. | Doe Valley | 1.6% | 0.40%(+1.20)#31 | 1.2%(+0.400)#3,127 |
| 32. | Prestonville | 1.6% | 0.40%(+1.20)#32 | 1.2%(+0.400)#3,207 |
| 33. | Elk Creek | 1.5% | 0.40%(+1.10)#33 | 1.2%(+0.300)#3,338 |
| 34. | Murray Hill | 1.5% | 0.40%(+1.10)#34 | 1.2%(+0.300)#3,396 |
| 35. | Cynthiana | 1.4% | 0.40%(+1.000)#35 | 1.2%(+0.200)#3,510 |
| 36. | Louisa | 1.4% | 0.40%(+1.000)#36 | 1.2%(+0.200)#3,557 |
| 37. | Heritage Creek | 1.4% | 0.40%(+1.000)#37 | 1.2%(+0.200)#3,594 |
| 38. | Vine Grove | 1.3% | 0.40%(+0.900)#38 | 1.2%(+0.100)#3,734 |
| 39. | Clarkson | 1.3% | 0.40%(+0.900)#39 | 1.2%(+0.100)#3,835 |
| 40. | Bradfordsville | 1.3% | 0.40%(+0.900)#40 | 1.2%(+0.100)#3,879 |
| 41. | Lebanon Junction | 1.2% | 0.40%(+0.800)#41 | 1.2%(=0.000)#4,082 |
| 42. | Orchard Grass Hills | 1.2% | 0.40%(+0.800)#42 | 1.2%(=0.000)#4,087 |
| 43. | Jenkins | 1.2% | 0.40%(+0.800)#43 | 1.2%(=0.000)#4,091 |
| 44. | Evarts | 1.2% | 0.40%(+0.800)#44 | 1.2%(=0.000)#4,128 |
| 45. | Science Hill | 1.2% | 0.40%(+0.800)#45 | 1.2%(=0.000)#4,140 |
| 46. | Fordsville | 1.2% | 0.40%(+0.800)#46 | 1.2%(=0.000)#4,155 |
| 47. | Eubank | 1.2% | 0.40%(+0.800)#47 | 1.2%(=0.000)#4,161 |
| 48. | Erlanger | 1.1% | 0.40%(+0.700)#48 | 1.2%(-0.100)#4,247 |
| 49. | Farley | 1.1% | 0.40%(+0.700)#49 | 1.2%(-0.100)#4,332 |
| 50. | Salyersville | 1.1% | 0.40%(+0.700)#50 | 1.2%(-0.100)#4,405 |
| 51. | Hollow Creek | 1.1% | 0.40%(+0.700)#51 | 1.2%(-0.100)#4,457 |
| 52. | Park City | 1.1% | 0.40%(+0.700)#52 | 1.2%(-0.100)#4,458 |
| 53. | Crescent Springs | 1.0% | 0.40%(+0.600)#53 | 1.2%(-0.200)#4,703 |
| 54. | Eminence | 1.0% | 0.40%(+0.600)#54 | 1.2%(-0.200)#4,744 |
| 55. | Crestview | 1.0% | 0.40%(+0.600)#55 | 1.2%(-0.200)#4,876 |
| 56. | Briarwood | 1.0% | 0.40%(+0.600)#56 | 1.2%(-0.200)#4,886 |
| 57. | Radcliff | 0.90% | 0.40%(+0.500)#57 | 1.2%(-0.300)#4,995 |
| 58. | St Matthews | 0.90% | 0.40%(+0.500)#58 | 1.2%(-0.300)#5,021 |
| 59. | Catlettsburg | 0.90% | 0.40%(+0.500)#59 | 1.2%(-0.300)#5,218 |
| 60. | Hopkinsville | 0.80% | 0.40%(+0.400)#60 | 1.2%(-0.400)#5,410 |
| 61. | Newport | 0.80% | 0.40%(+0.400)#61 | 1.2%(-0.400)#5,474 |
| 62. | Providence | 0.80% | 0.40%(+0.400)#62 | 1.2%(-0.400)#5,639 |
| 63. | Carlisle | 0.80% | 0.40%(+0.400)#63 | 1.2%(-0.400)#5,648 |
| 64. | Owingsville | 0.80% | 0.40%(+0.400)#64 | 1.2%(-0.400)#5,686 |
| 65. | Fountain Run | 0.80% | 0.40%(+0.400)#65 | 1.2%(-0.400)#5,849 |
| 66. | Burlington | 0.70% | 0.40%(+0.300)#66 | 1.2%(-0.500)#6,010 |
| 67. | Berea | 0.70% | 0.40%(+0.300)#67 | 1.2%(-0.500)#6,029 |
| 68. | Oakbrook | 0.70% | 0.40%(+0.300)#68 | 1.2%(-0.500)#6,076 |
| 69. | Lancaster | 0.70% | 0.40%(+0.300)#69 | 1.2%(-0.500)#6,190 |
| 70. | Jamestown | 0.70% | 0.40%(+0.300)#70 | 1.2%(-0.500)#6,248 |
| 71. | North Middletown | 0.70% | 0.40%(+0.300)#71 | 1.2%(-0.500)#6,370 |
| 72. | Independence | 0.60% | 0.40%(+0.200)#72 | 1.2%(-0.600)#6,548 |
| 73. | Ashland | 0.60% | 0.40%(+0.200)#73 | 1.2%(-0.600)#6,586 |
| 74. | Lawrenceburg | 0.60% | 0.40%(+0.200)#74 | 1.2%(-0.600)#6,673 |
| 75. | Oak Grove | 0.60% | 0.40%(+0.200)#75 | 1.2%(-0.600)#6,733 |
| 76. | London | 0.60% | 0.40%(+0.200)#76 | 1.2%(-0.600)#6,741 |
| 77. | Highland Heights | 0.60% | 0.40%(+0.200)#77 | 1.2%(-0.600)#6,763 |
| 78. | Paintsville | 0.60% | 0.40%(+0.200)#78 | 1.2%(-0.600)#6,813 |
| 79. | Pioneer Village | 0.60% | 0.40%(+0.200)#79 | 1.2%(-0.600)#6,864 |
| 80. | Clinton | 0.60% | 0.40%(+0.200)#80 | 1.2%(-0.600)#6,995 |
| 81. | New Haven | 0.60% | 0.40%(+0.200)#81 | 1.2%(-0.600)#7,041 |
| 82. | Bowling Green | 0.50% | 0.40%(+0.100)#82 | 1.2%(-0.700)#7,163 |
| 83. | Owensboro | 0.50% | 0.40%(+0.100)#83 | 1.2%(-0.700)#7,179 |
| 84. | Covington | 0.50% | 0.40%(+0.100)#84 | 1.2%(-0.700)#7,208 |
| 85. | Georgetown | 0.50% | 0.40%(+0.100)#85 | 1.2%(-0.700)#7,219 |
| 86. | Paducah | 0.50% | 0.40%(+0.100)#86 | 1.2%(-0.700)#7,251 |
| 87. | Mount Washington | 0.50% | 0.40%(+0.100)#87 | 1.2%(-0.700)#7,299 |
| 88. | Versailles | 0.50% | 0.40%(+0.100)#88 | 1.2%(-0.700)#7,374 |
| 89. | Middlesborough | 0.50% | 0.40%(+0.100)#89 | 1.2%(-0.700)#7,392 |
| 90. | Fort Knox | 0.50% | 0.40%(+0.100)#90 | 1.2%(-0.700)#7,402 |
| 91. | Lebanon | 0.50% | 0.40%(+0.100)#91 | 1.2%(-0.700)#7,460 |
| 92. | Falmouth | 0.50% | 0.40%(+0.100)#92 | 1.2%(-0.700)#7,579 |
| 93. | Cumberland | 0.50% | 0.40%(+0.100)#93 | 1.2%(-0.700)#7,590 |
| 94. | Windy Hills | 0.50% | 0.40%(+0.100)#94 | 1.2%(-0.700)#7,615 |
| 95. | Whitesburg | 0.50% | 0.40%(+0.100)#95 | 1.2%(-0.700)#7,619 |
| 96. | Edmonton | 0.50% | 0.40%(+0.100)#96 | 1.2%(-0.700)#7,644 |
| 97. | Jeffersonville | 0.50% | 0.40%(+0.100)#97 | 1.2%(-0.700)#7,649 |
| 98. | Augusta | 0.50% | 0.40%(+0.100)#98 | 1.2%(-0.700)#7,666 |
| 99. | Wurtland | 0.50% | 0.40%(+0.100)#99 | 1.2%(-0.700)#7,716 |
| 100. | Louisville | 0.40% | 0.40%(=0.000)#100 | 1.2%(-0.800)#7,802 |
Common Questions
What are the Top 10 Cities with the Highest Percentage of Households Heated without Fuel in Kentucky?
Top 10 Cities with the Highest Percentage of Households Heated without Fuel in Kentucky are:
#1
22.2%
#2
18.8%
#3
11.4%
#4
5.9%
#5
5.4%
#6
4.3%
#7
3.8%
#8
3.7%
#9
3.5%
#10
3.4%
What city has the Highest Percentage of Households Heated without Fuel in Kentucky?
Salvisa has the Highest Percentage of Households Heated without Fuel in Kentucky with 22.2%.
What is the Percentage of Households Heated without Fuel in the State of Kentucky?
Percentage of Households Heated without Fuel in Kentucky is 0.40%.
What is the Percentage of Households Heated without Fuel in the United States?
Percentage of Households Heated without Fuel in the United States is 1.2%.