Northfield, KY
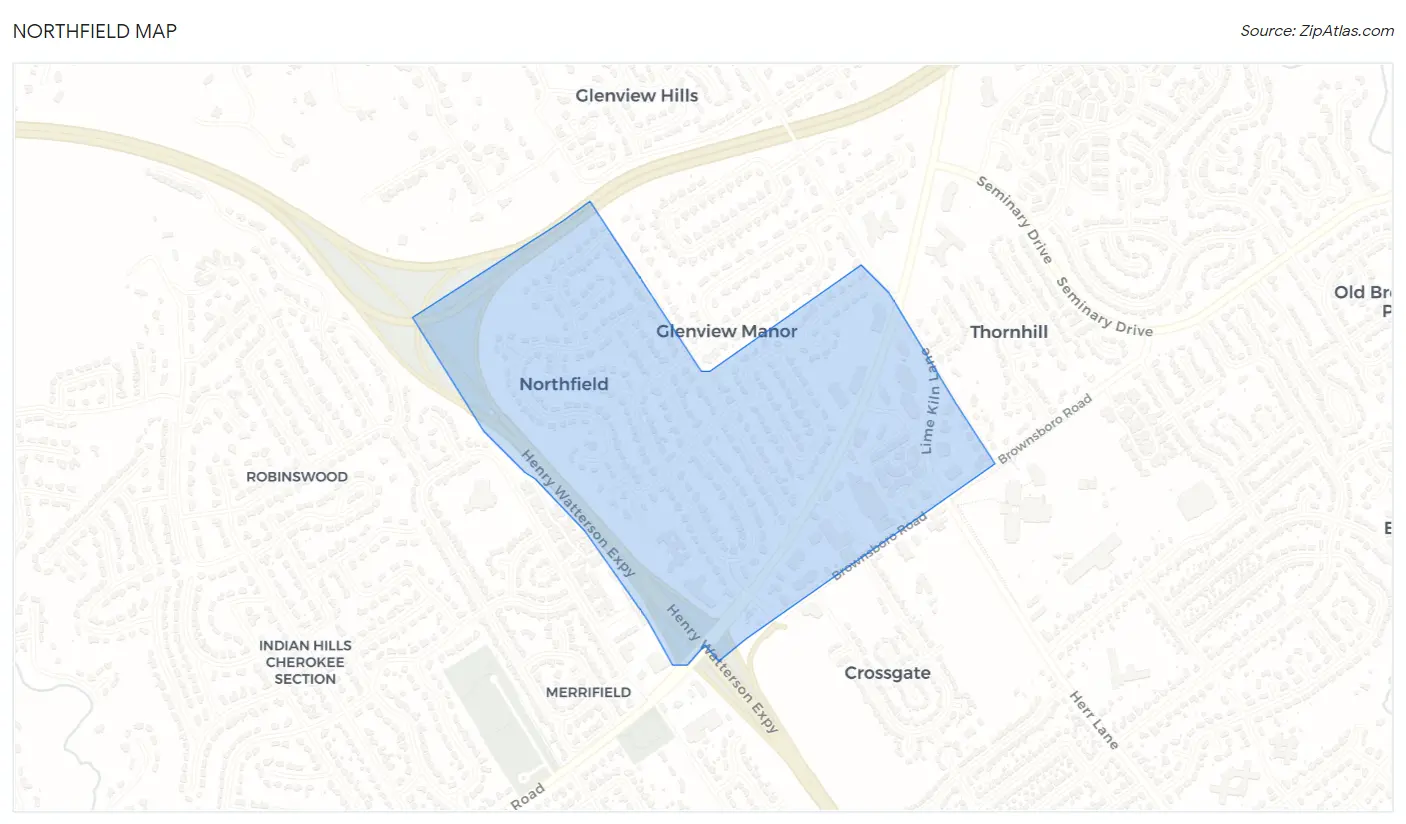
Northfield Map
Northfield Overview
1,106
TOTAL POPULATION
573
MALE POPULATION
533
FEMALE POPULATION
107.50
MALES / 100 FEMALES
93.02
FEMALES / 100 MALES
51.2
MEDIAN AGE
2.9
AVG FAMILY SIZE
2.3
AVG HOUSEHOLD SIZE
$65,200
PER CAPITA INCOME
$124,716
AVG FAMILY INCOME
$121,429
AVG HOUSEHOLD INCOME
52.4%
WAGE / INCOME GAP [ % ]
47.6¢/ $1
WAGE / INCOME GAP [ $ ]
0.46
INEQUALITY / GINI INDEX
503
LABOR FORCE [ PEOPLE ]
57.4%
PERCENT IN LABOR FORCE
0.8%
UNEMPLOYMENT RATE
Northfield Area Codes
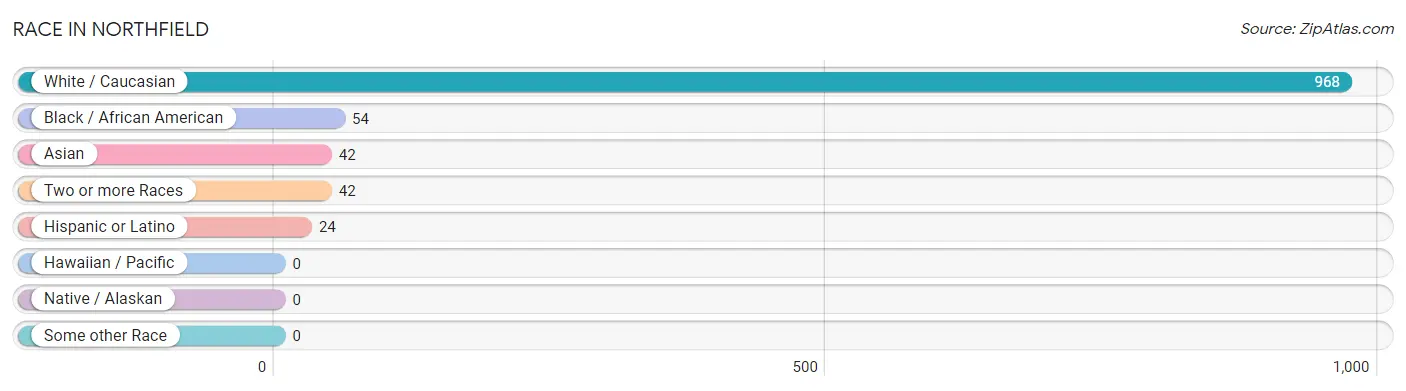
Race in Northfield
The most populous races in Northfield are White / Caucasian (968 | 87.5%), Black / African American (54 | 4.9%), and Asian (42 | 3.8%).
| Race | # Population | % Population |
| Asian | 42 | 3.8% |
| Black / African American | 54 | 4.9% |
| Hawaiian / Pacific | 0 | 0.0% |
| Hispanic or Latino | 24 | 2.2% |
| Native / Alaskan | 0 | 0.0% |
| White / Caucasian | 968 | 87.5% |
| Two or more Races | 42 | 3.8% |
| Some other Race | 0 | 0.0% |
| Total | 1,106 | 100.0% |
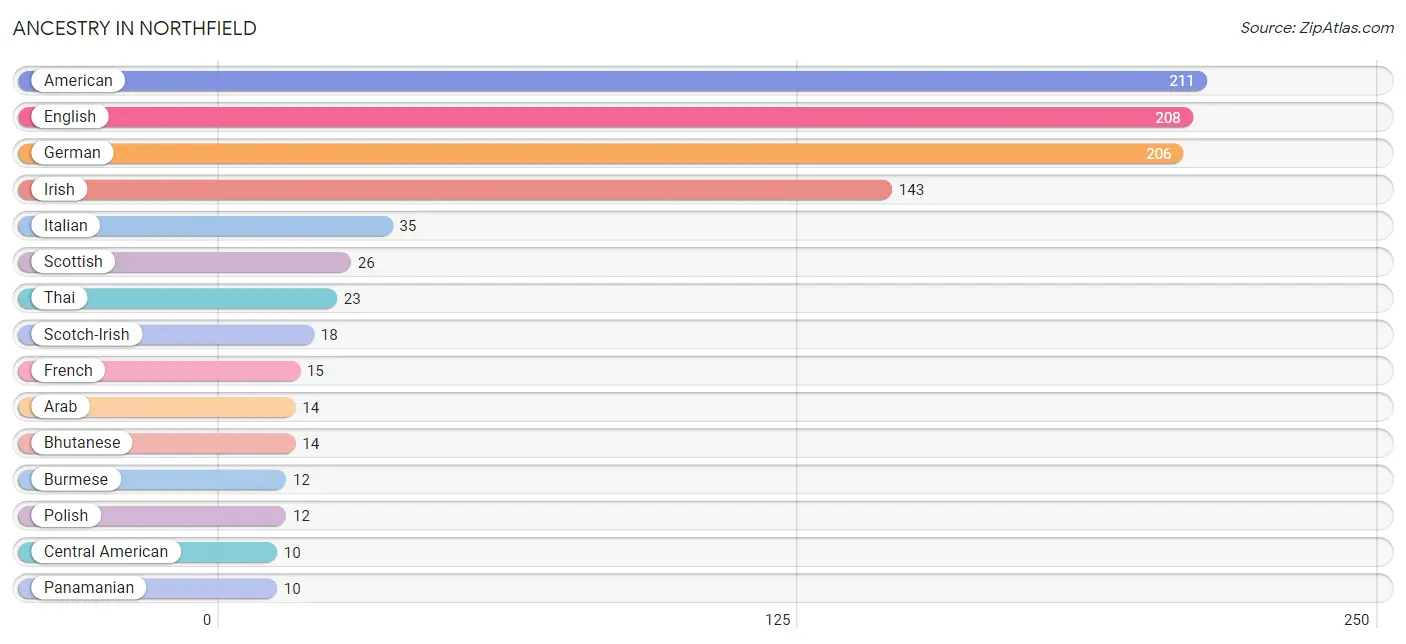
Ancestry in Northfield
The most populous ancestries reported in Northfield are American (211 | 19.1%), English (208 | 18.8%), German (206 | 18.6%), Irish (143 | 12.9%), and Italian (35 | 3.2%), together accounting for 72.6% of all Northfield residents.
| Ancestry | # Population | % Population |
| American | 211 | 19.1% |
| Arab | 14 | 1.3% |
| Armenian | 6 | 0.5% |
| Austrian | 4 | 0.4% |
| Belgian | 3 | 0.3% |
| Bhutanese | 14 | 1.3% |
| British | 7 | 0.6% |
| Burmese | 12 | 1.1% |
| Canadian | 2 | 0.2% |
| Central American | 10 | 0.9% |
| Cherokee | 1 | 0.1% |
| Cuban | 3 | 0.3% |
| Czechoslovakian | 5 | 0.4% |
| Dutch | 5 | 0.4% |
| Eastern European | 9 | 0.8% |
| English | 208 | 18.8% |
| European | 8 | 0.7% |
| Filipino | 1 | 0.1% |
| French | 15 | 1.4% |
| French Canadian | 8 | 0.7% |
| German | 206 | 18.6% |
| Irish | 143 | 12.9% |
| Italian | 35 | 3.2% |
| Laotian | 4 | 0.4% |
| Lebanese | 3 | 0.3% |
| Mexican | 6 | 0.5% |
| Norwegian | 6 | 0.5% |
| Panamanian | 10 | 0.9% |
| Polish | 12 | 1.1% |
| Puerto Rican | 1 | 0.1% |
| Romanian | 3 | 0.3% |
| Russian | 6 | 0.5% |
| Scandinavian | 4 | 0.4% |
| Scotch-Irish | 18 | 1.6% |
| Scottish | 26 | 2.4% |
| Slovak | 6 | 0.5% |
| Spaniard | 4 | 0.4% |
| Swedish | 9 | 0.8% |
| Swiss | 6 | 0.5% |
| Thai | 23 | 2.1% |
| Ukrainian | 3 | 0.3% |
| Welsh | 4 | 0.4% | View All 42 Rows |
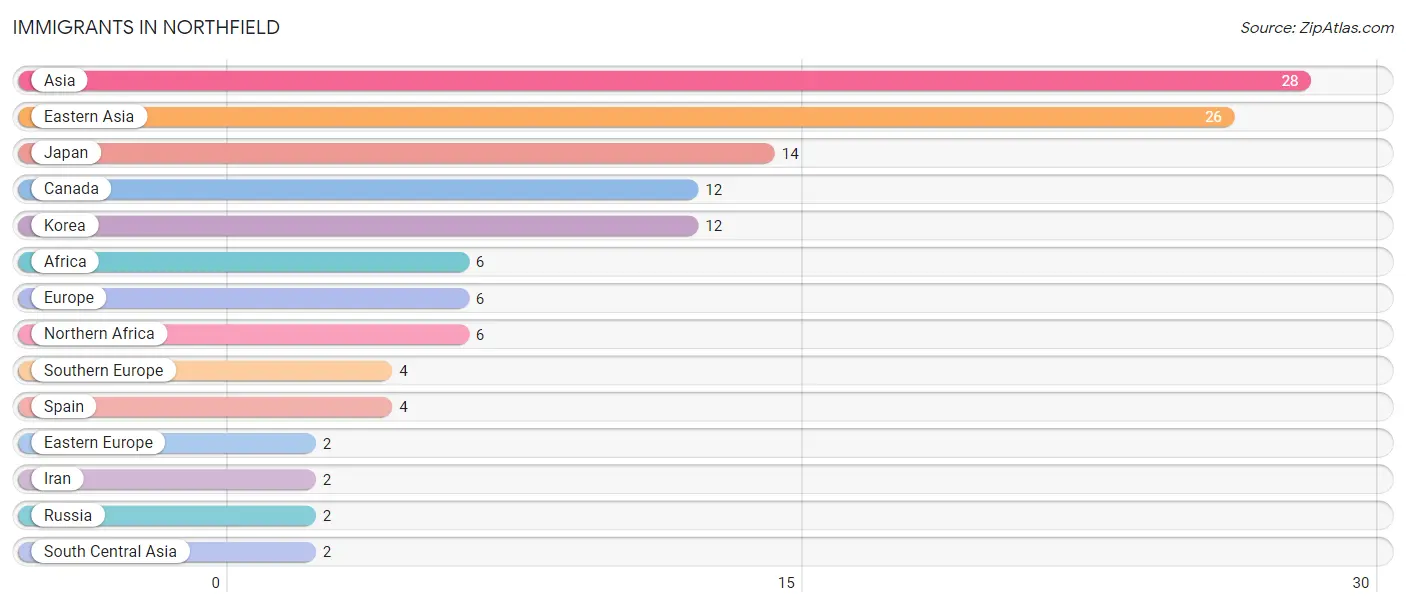
Immigrants in Northfield
The most numerous immigrant groups reported in Northfield came from Asia (28 | 2.5%), Eastern Asia (26 | 2.4%), Japan (14 | 1.3%), Canada (12 | 1.1%), and Korea (12 | 1.1%), together accounting for 8.3% of all Northfield residents.
| Immigration Origin | # Population | % Population |
| Africa | 6 | 0.5% |
| Asia | 28 | 2.5% |
| Canada | 12 | 1.1% |
| Eastern Asia | 26 | 2.4% |
| Eastern Europe | 2 | 0.2% |
| Europe | 6 | 0.5% |
| Iran | 2 | 0.2% |
| Japan | 14 | 1.3% |
| Korea | 12 | 1.1% |
| Northern Africa | 6 | 0.5% |
| Russia | 2 | 0.2% |
| South Central Asia | 2 | 0.2% |
| Southern Europe | 4 | 0.4% |
| Spain | 4 | 0.4% | View All 14 Rows |
Sex and Age in Northfield
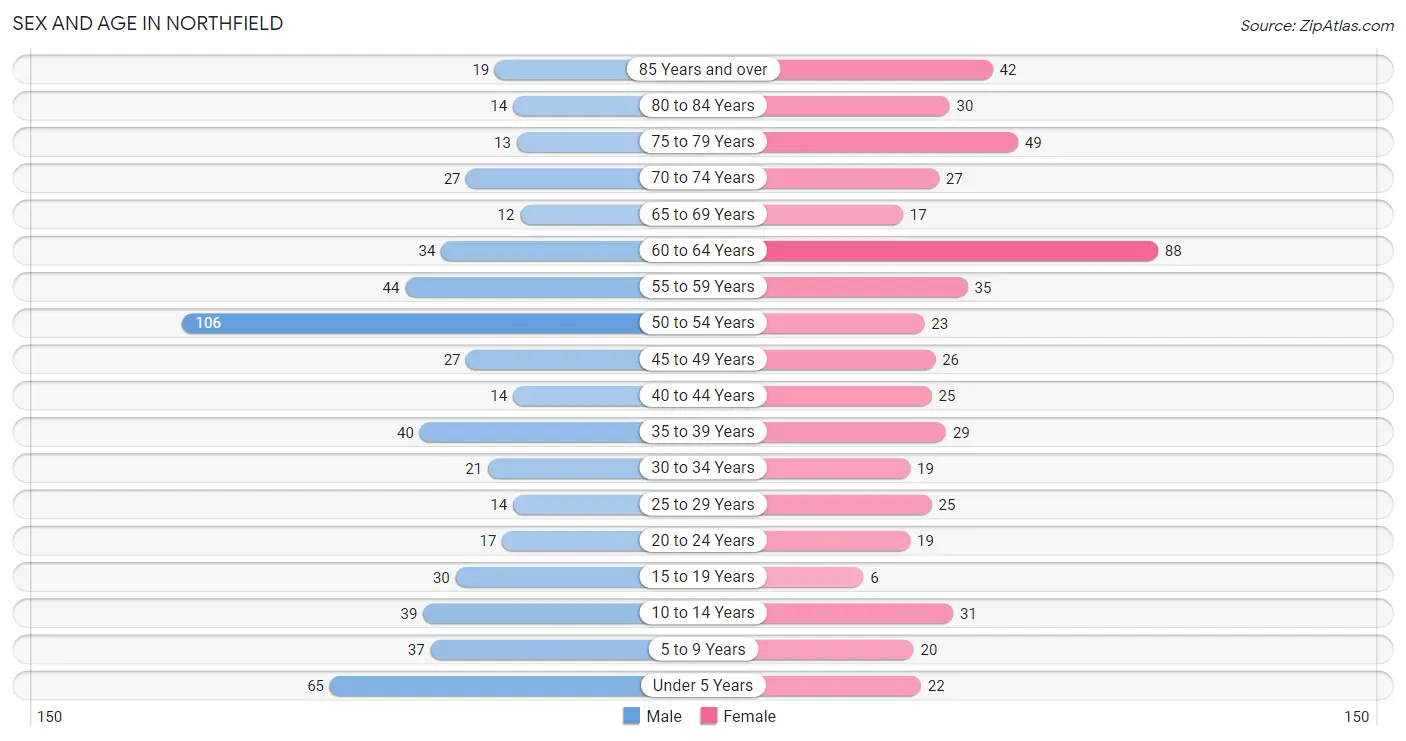
Sex and Age in Northfield
The most populous age groups in Northfield are 50 to 54 Years (106 | 18.5%) for men and 60 to 64 Years (88 | 16.5%) for women.
| Age Bracket | Male | Female |
| Under 5 Years | 65 (11.3%) | 22 (4.1%) |
| 5 to 9 Years | 37 (6.5%) | 20 (3.7%) |
| 10 to 14 Years | 39 (6.8%) | 31 (5.8%) |
| 15 to 19 Years | 30 (5.2%) | 6 (1.1%) |
| 20 to 24 Years | 17 (3.0%) | 19 (3.6%) |
| 25 to 29 Years | 14 (2.4%) | 25 (4.7%) |
| 30 to 34 Years | 21 (3.7%) | 19 (3.6%) |
| 35 to 39 Years | 40 (7.0%) | 29 (5.4%) |
| 40 to 44 Years | 14 (2.4%) | 25 (4.7%) |
| 45 to 49 Years | 27 (4.7%) | 26 (4.9%) |
| 50 to 54 Years | 106 (18.5%) | 23 (4.3%) |
| 55 to 59 Years | 44 (7.7%) | 35 (6.6%) |
| 60 to 64 Years | 34 (5.9%) | 88 (16.5%) |
| 65 to 69 Years | 12 (2.1%) | 17 (3.2%) |
| 70 to 74 Years | 27 (4.7%) | 27 (5.1%) |
| 75 to 79 Years | 13 (2.3%) | 49 (9.2%) |
| 80 to 84 Years | 14 (2.4%) | 30 (5.6%) |
| 85 Years and over | 19 (3.3%) | 42 (7.9%) |
| Total | 573 (100.0%) | 533 (100.0%) |
Families and Households in Northfield
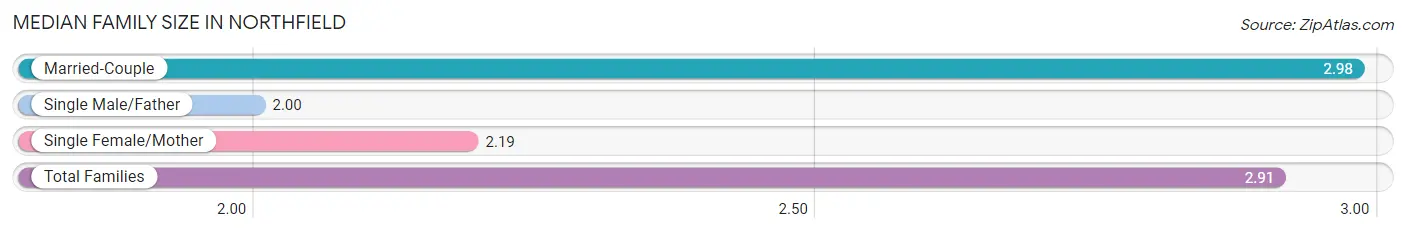
Median Family Size in Northfield
The median family size in Northfield is 2.91 persons per family, with married-couple families (268 | 92.1%) accounting for the largest median family size of 2.98 persons per family. On the other hand, single male/father families (2 | 0.7%) represent the smallest median family size with 2.00 persons per family.
| Family Type | # Families | Family Size |
| Married-Couple | 268 (92.1%) | 2.98 |
| Single Male/Father | 2 (0.7%) | 2.00 |
| Single Female/Mother | 21 (7.2%) | 2.19 |
| Total Families | 291 (100.0%) | 2.91 |
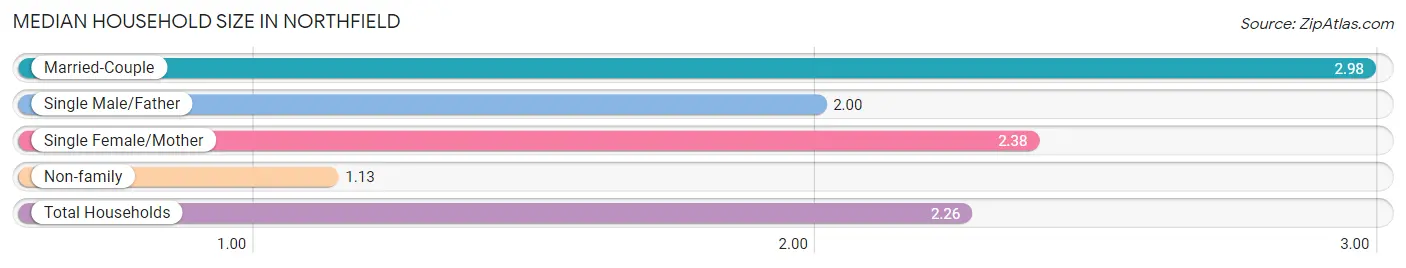
Median Household Size in Northfield
The median household size in Northfield is 2.26 persons per household, with married-couple households (268 | 58.0%) accounting for the largest median household size of 2.98 persons per household. non-family households (171 | 37.0%) represent the smallest median household size with 1.13 persons per household.
| Household Type | # Households | Household Size |
| Married-Couple | 268 (58.0%) | 2.98 |
| Single Male/Father | 2 (0.4%) | 2.00 |
| Single Female/Mother | 21 (4.5%) | 2.38 |
| Non-family | 171 (37.0%) | 1.13 |
| Total Households | 462 (100.0%) | 2.26 |
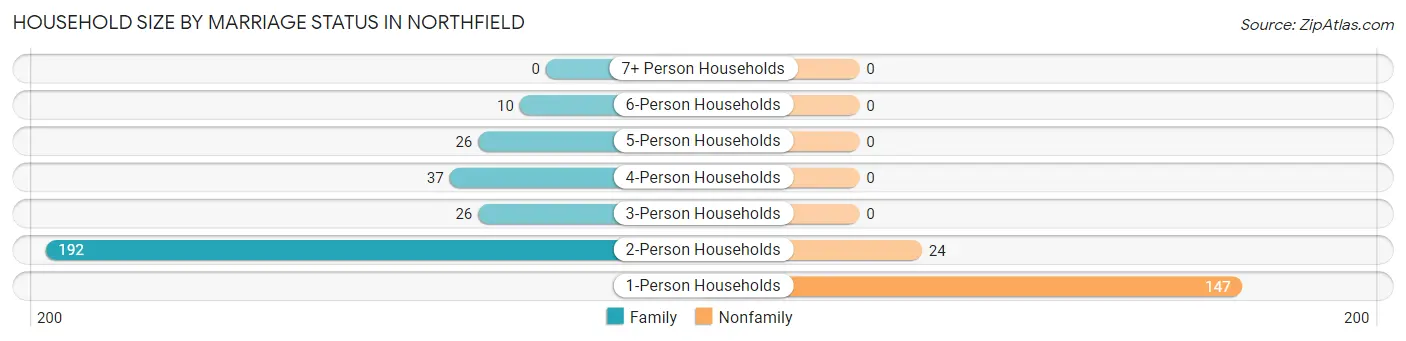
Household Size by Marriage Status in Northfield
Out of a total of 462 households in Northfield, 291 (63.0%) are family households, while 171 (37.0%) are nonfamily households. The most numerous type of family households are 2-person households, comprising 192, and the most common type of nonfamily households are 1-person households, comprising 147.
| Household Size | Family Households | Nonfamily Households |
| 1-Person Households | - | 147 (31.8%) |
| 2-Person Households | 192 (41.6%) | 24 (5.2%) |
| 3-Person Households | 26 (5.6%) | 0 (0.0%) |
| 4-Person Households | 37 (8.0%) | 0 (0.0%) |
| 5-Person Households | 26 (5.6%) | 0 (0.0%) |
| 6-Person Households | 10 (2.2%) | 0 (0.0%) |
| 7+ Person Households | 0 (0.0%) | 0 (0.0%) |
| Total | 291 (63.0%) | 171 (37.0%) |
Female Fertility in Northfield
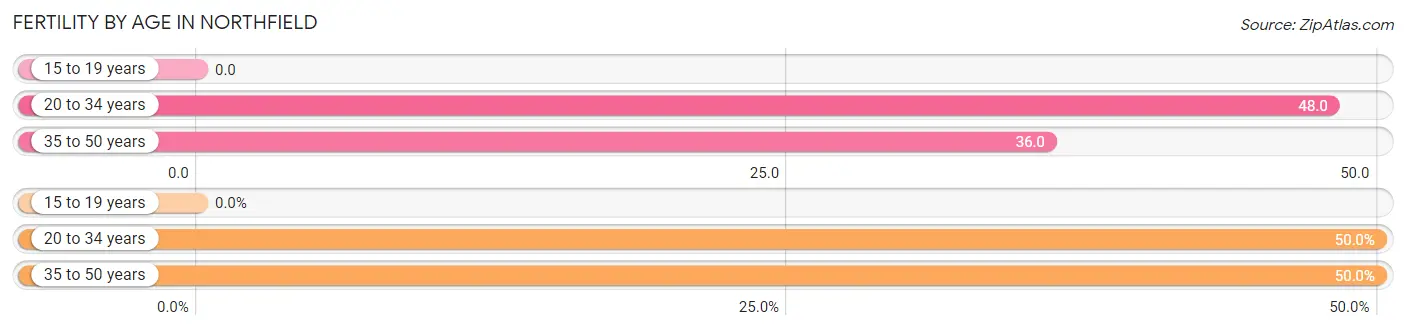
Fertility by Age in Northfield
Average fertility rate in Northfield is 39.0 births per 1,000 women. Women in the age bracket of 20 to 34 years have the highest fertility rate with 48.0 births per 1,000 women. Women in the age bracket of 20 to 34 years acount for 50.0% of all women with births.
| Age Bracket | Women with Births | Births / 1,000 Women |
| 15 to 19 years | 0 (0.0%) | 0.0 |
| 20 to 34 years | 3 (50.0%) | 48.0 |
| 35 to 50 years | 3 (50.0%) | 36.0 |
| Total | 6 (100.0%) | 39.0 |
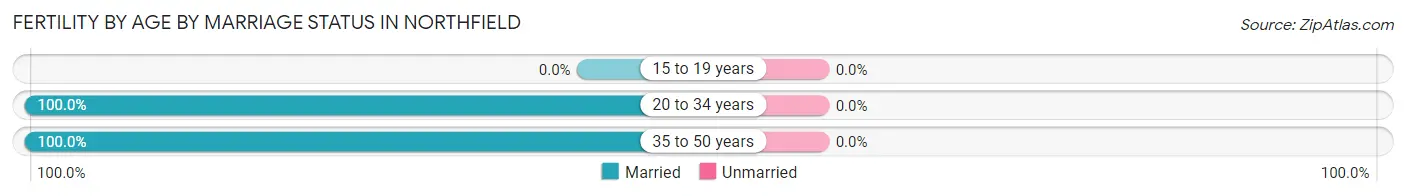
Fertility by Age by Marriage Status in Northfield
| Age Bracket | Married | Unmarried |
| 15 to 19 years | 0 (0.0%) | 0 (0.0%) |
| 20 to 34 years | 3 (100.0%) | 0 (0.0%) |
| 35 to 50 years | 3 (100.0%) | 0 (0.0%) |
| Total | 6 (100.0%) | 0 (0.0%) |
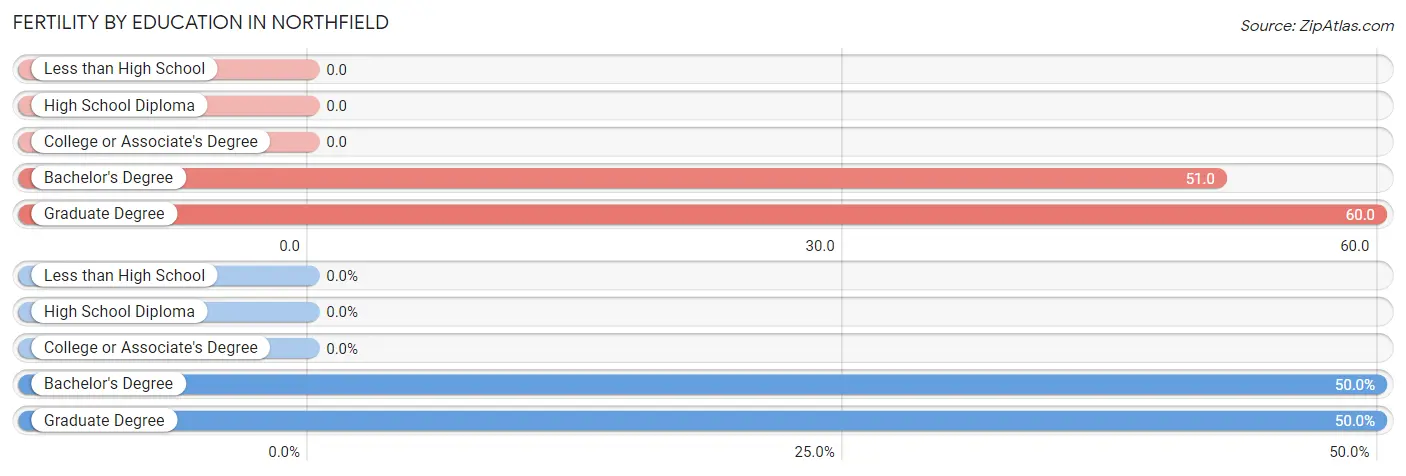
Fertility by Education in Northfield
| Educational Attainment | Women with Births | Births / 1,000 Women |
| Less than High School | 0 (0.0%) | 0.0 |
| High School Diploma | 0 (0.0%) | 0.0 |
| College or Associate's Degree | 0 (0.0%) | 0.0 |
| Bachelor's Degree | 3 (50.0%) | 51.0 |
| Graduate Degree | 3 (50.0%) | 60.0 |
| Total | 6 (100.0%) | 39.0 |
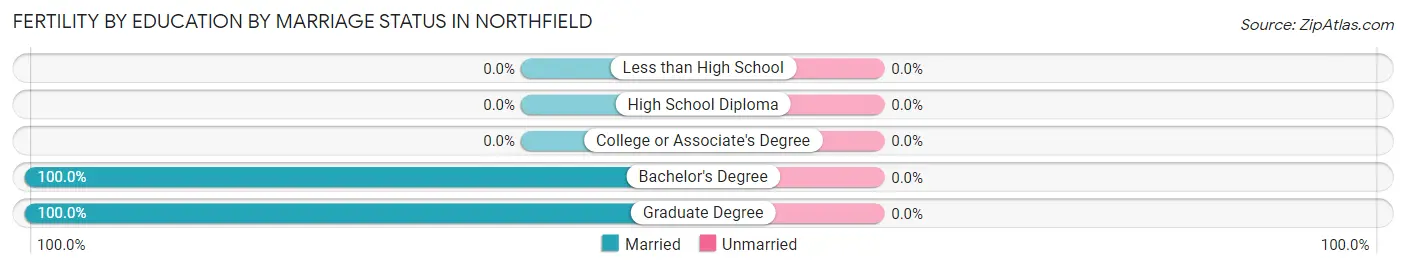
Fertility by Education by Marriage Status in Northfield
| Educational Attainment | Married | Unmarried |
| Less than High School | 0 (0.0%) | 0 (0.0%) |
| High School Diploma | 0 (0.0%) | 0 (0.0%) |
| College or Associate's Degree | 0 (0.0%) | 0 (0.0%) |
| Bachelor's Degree | 3 (100.0%) | 0 (0.0%) |
| Graduate Degree | 3 (100.0%) | 0 (0.0%) |
| Total | 6 (100.0%) | 0 (0.0%) |
Income in Northfield
Income Overview in Northfield
Per Capita Income in Northfield is $65,200, while median incomes of families and households are $124,716 and $121,429 respectively.
| Characteristic | Number | Measure |
| Per Capita Income | 1,106 | $65,200 |
| Median Family Income | 291 | $124,716 |
| Mean Family Income | 291 | $185,571 |
| Median Household Income | 462 | $121,429 |
| Mean Household Income | 462 | $141,781 |
| Income Deficit | 291 | $0 |
| Wage / Income Gap (%) | 1,106 | 52.39% |
| Wage / Income Gap ($) | 1,106 | 47.61¢ per $1 |
| Gini / Inequality Index | 1,106 | 0.46 |
Earnings by Sex in Northfield
Average Earnings in Northfield are $74,531, $98,319 for men and $46,806 for women, a difference of 52.4%.
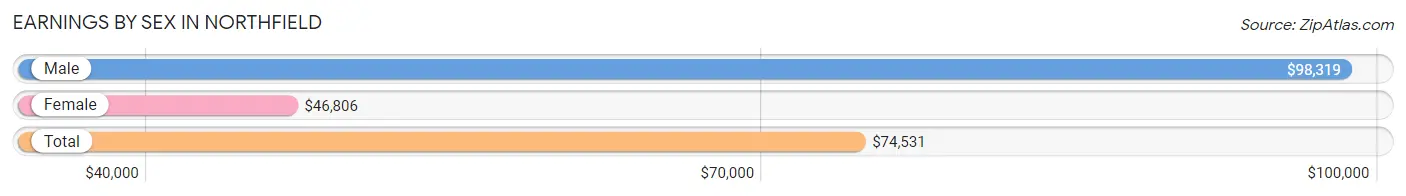
| Sex | Number | Average Earnings |
| Male | 319 (62.2%) | $98,319 |
| Female | 194 (37.8%) | $46,806 |
| Total | 513 (100.0%) | $74,531 |
Earnings by Sex by Income Bracket in Northfield
The most common earnings brackets in Northfield are $75,000 to $99,999 for men (102 | 32.0%) and $100,000+ for women (33 | 17.0%).
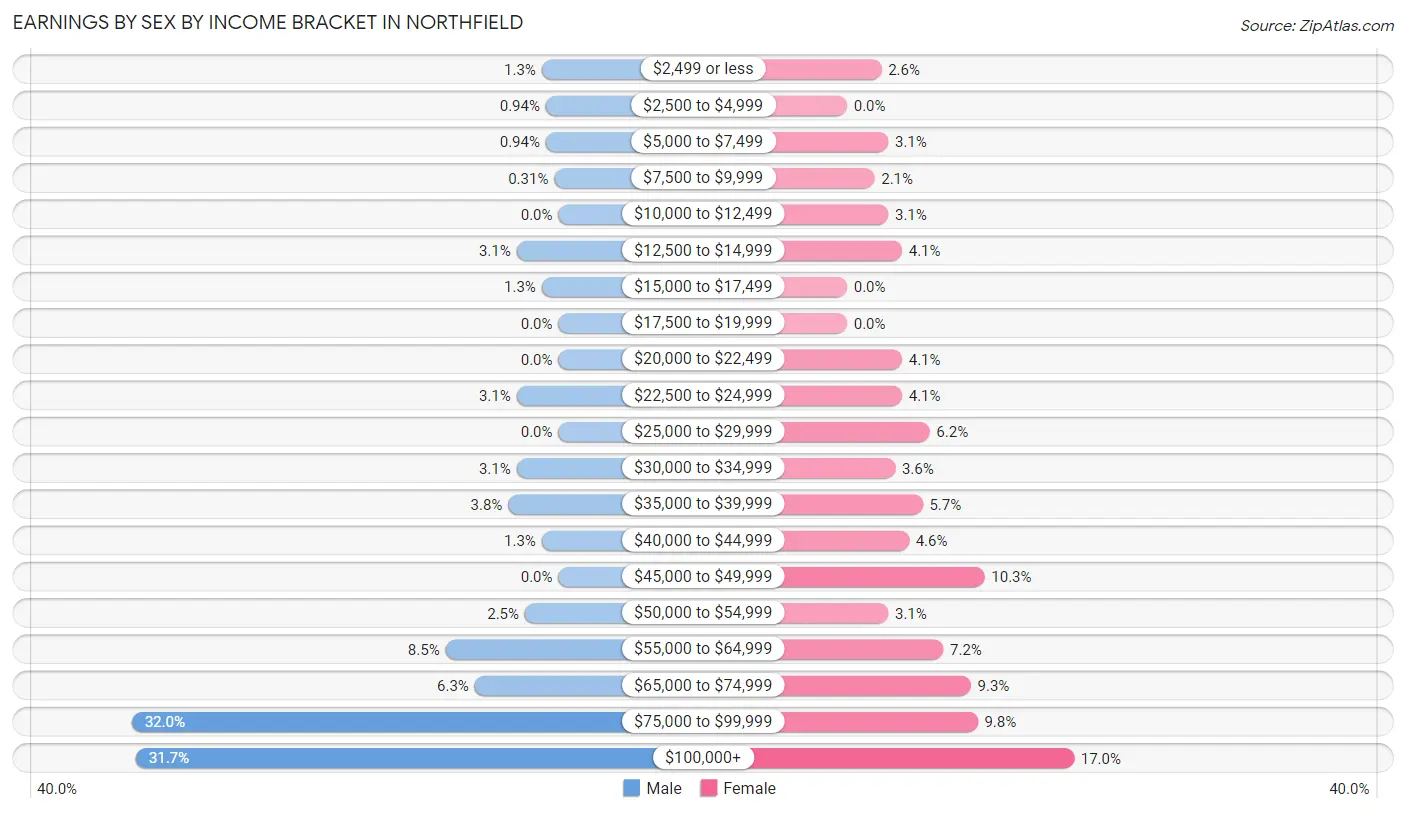
| Income | Male | Female |
| $2,499 or less | 4 (1.3%) | 5 (2.6%) |
| $2,500 to $4,999 | 3 (0.9%) | 0 (0.0%) |
| $5,000 to $7,499 | 3 (0.9%) | 6 (3.1%) |
| $7,500 to $9,999 | 1 (0.3%) | 4 (2.1%) |
| $10,000 to $12,499 | 0 (0.0%) | 6 (3.1%) |
| $12,500 to $14,999 | 10 (3.1%) | 8 (4.1%) |
| $15,000 to $17,499 | 4 (1.3%) | 0 (0.0%) |
| $17,500 to $19,999 | 0 (0.0%) | 0 (0.0%) |
| $20,000 to $22,499 | 0 (0.0%) | 8 (4.1%) |
| $22,500 to $24,999 | 10 (3.1%) | 8 (4.1%) |
| $25,000 to $29,999 | 0 (0.0%) | 12 (6.2%) |
| $30,000 to $34,999 | 10 (3.1%) | 7 (3.6%) |
| $35,000 to $39,999 | 12 (3.8%) | 11 (5.7%) |
| $40,000 to $44,999 | 4 (1.3%) | 9 (4.6%) |
| $45,000 to $49,999 | 0 (0.0%) | 20 (10.3%) |
| $50,000 to $54,999 | 8 (2.5%) | 6 (3.1%) |
| $55,000 to $64,999 | 27 (8.5%) | 14 (7.2%) |
| $65,000 to $74,999 | 20 (6.3%) | 18 (9.3%) |
| $75,000 to $99,999 | 102 (32.0%) | 19 (9.8%) |
| $100,000+ | 101 (31.7%) | 33 (17.0%) |
| Total | 319 (100.0%) | 194 (100.0%) |
Earnings by Sex by Educational Attainment in Northfield
Average earnings in Northfield are $98,649 for men and $47,361 for women, a difference of 52.0%. Men with an educational attainment of bachelor's degree enjoy the highest average annual earnings of $98,980, while those with high school diploma education earn the least with $60,417. Women with an educational attainment of bachelor's degree earn the most with the average annual earnings of $59,583, while those with college or associate's degree education have the smallest earnings of $39,375.
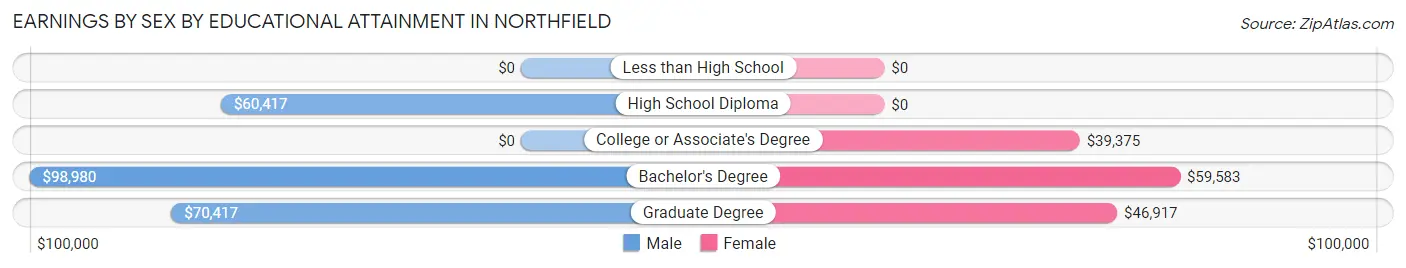
| Educational Attainment | Male Income | Female Income |
| Less than High School | - | - |
| High School Diploma | $60,417 | $0 |
| College or Associate's Degree | - | - |
| Bachelor's Degree | $98,980 | $59,583 |
| Graduate Degree | $70,417 | $46,917 |
| Total | $98,649 | $47,361 |
Family Income in Northfield
Family Income Brackets in Northfield
According to the Northfield family income data, there are 125 families falling into the $100,000 to $149,999 income range, which is the most common income bracket and makes up 43.0% of all families.
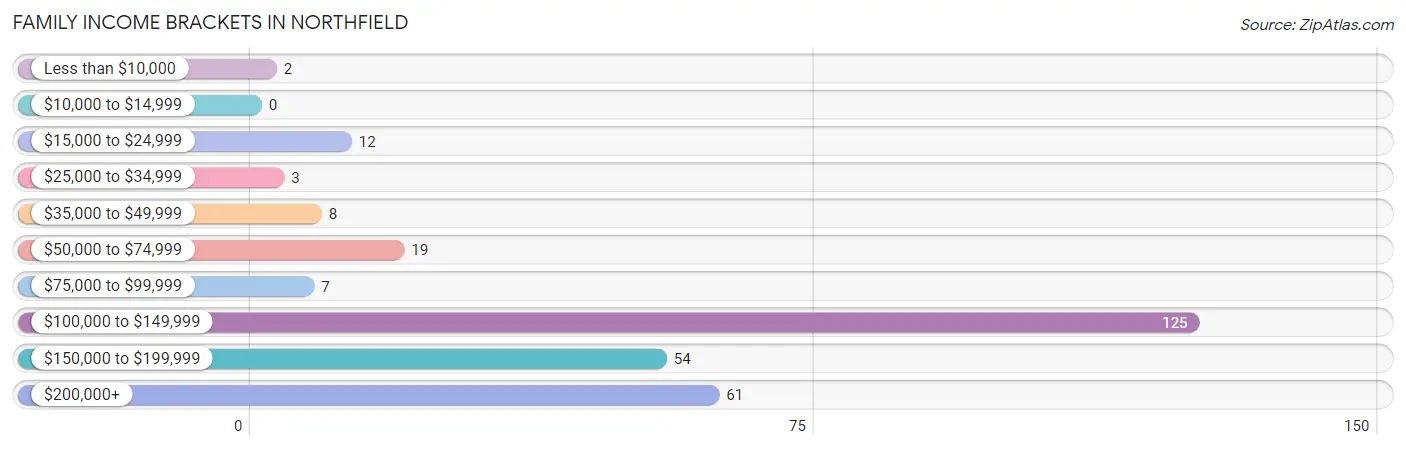
| Income Bracket | # Families | % Families |
| Less than $10,000 | 2 | 0.7% |
| $10,000 to $14,999 | 0 | 0.0% |
| $15,000 to $24,999 | 12 | 4.1% |
| $25,000 to $34,999 | 3 | 1.0% |
| $35,000 to $49,999 | 8 | 2.7% |
| $50,000 to $74,999 | 19 | 6.5% |
| $75,000 to $99,999 | 7 | 2.4% |
| $100,000 to $149,999 | 125 | 43.0% |
| $150,000 to $199,999 | 54 | 18.6% |
| $200,000+ | 61 | 21.0% |
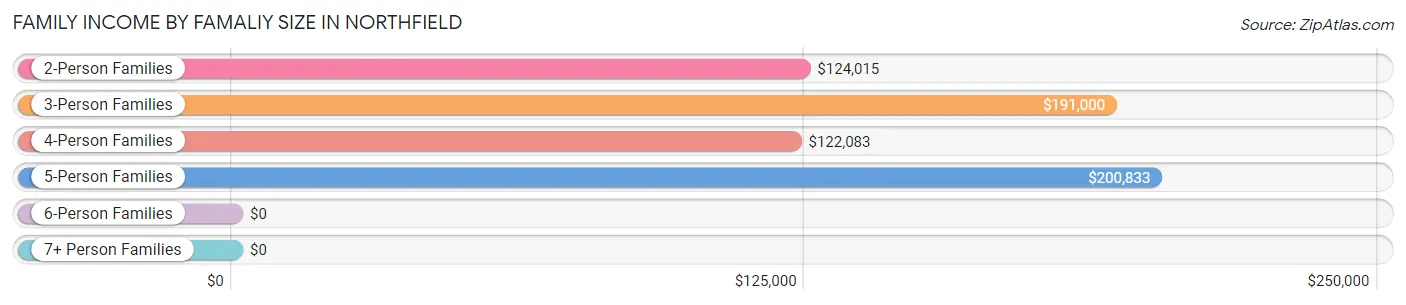
Family Income by Famaliy Size in Northfield
5-person families (26 | 8.9%) account for the highest median family income in Northfield with $200,833 per family, while 3-person families (22 | 7.6%) have the highest median income of $63,667 per family member.
| Income Bracket | # Families | Median Income |
| 2-Person Families | 196 (67.3%) | $124,015 |
| 3-Person Families | 22 (7.6%) | $191,000 |
| 4-Person Families | 37 (12.7%) | $122,083 |
| 5-Person Families | 26 (8.9%) | $200,833 |
| 6-Person Families | 10 (3.4%) | $0 |
| 7+ Person Families | 0 (0.0%) | $0 |
| Total | 291 (100.0%) | $124,716 |
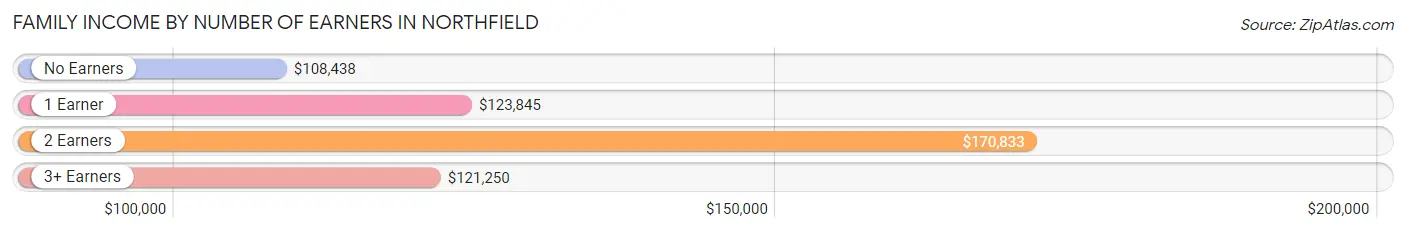
Family Income by Number of Earners in Northfield
The median family income in Northfield is $124,716, with families comprising 2 earners (102) having the highest median family income of $170,833, while families with no earners (39) have the lowest median family income of $108,438, accounting for 35.0% and 13.4% of families, respectively.
| Number of Earners | # Families | Median Income |
| No Earners | 39 (13.4%) | $108,438 |
| 1 Earner | 141 (48.4%) | $123,845 |
| 2 Earners | 102 (35.0%) | $170,833 |
| 3+ Earners | 9 (3.1%) | $121,250 |
| Total | 291 (100.0%) | $124,716 |
Household Income in Northfield
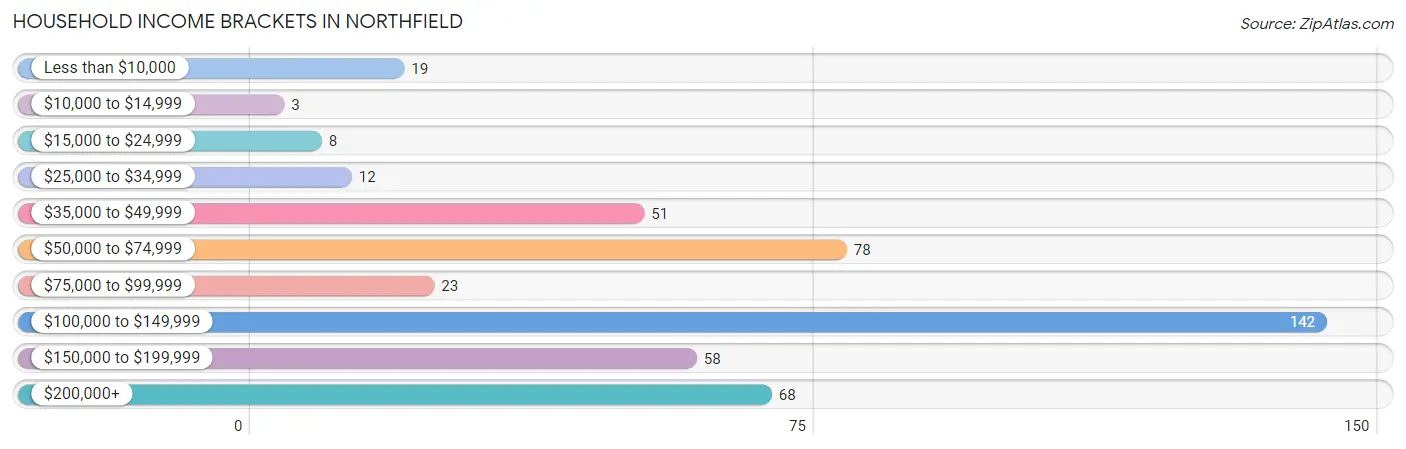
Household Income Brackets in Northfield
With 142 households falling in the category, the $100,000 to $149,999 income range is the most frequent in Northfield, accounting for 30.7% of all households. In contrast, only 3 households (0.6%) fall into the $10,000 to $14,999 income bracket, making it the least populous group.
| Income Bracket | # Households | % Households |
| Less than $10,000 | 19 | 4.1% |
| $10,000 to $14,999 | 3 | 0.6% |
| $15,000 to $24,999 | 8 | 1.7% |
| $25,000 to $34,999 | 12 | 2.6% |
| $35,000 to $49,999 | 51 | 11.0% |
| $50,000 to $74,999 | 78 | 16.9% |
| $75,000 to $99,999 | 23 | 5.0% |
| $100,000 to $149,999 | 142 | 30.7% |
| $150,000 to $199,999 | 58 | 12.6% |
| $200,000+ | 68 | 14.7% |
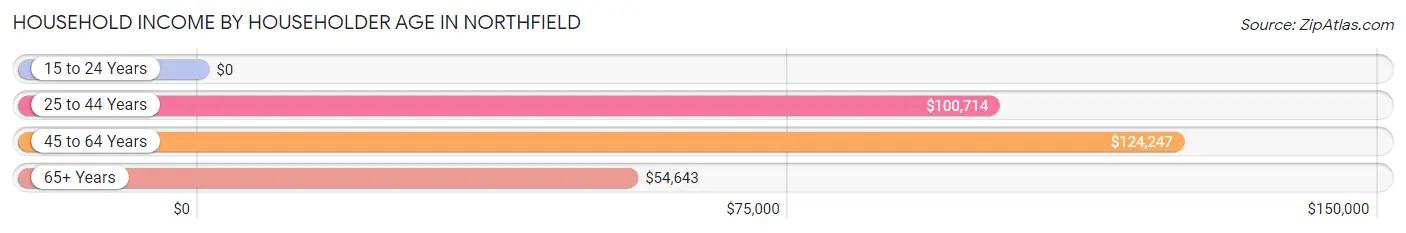
Household Income by Householder Age in Northfield
The median household income in Northfield is $121,429, with the highest median household income of $124,247 found in the 45 to 64 years age bracket for the primary householder. A total of 192 households (41.6%) fall into this category. Meanwhile, the 15 to 24 years age bracket for the primary householder has the lowest median household income of $0, with 14 households (3.0%) in this group.
| Income Bracket | # Households | Median Income |
| 15 to 24 Years | 14 (3.0%) | $0 |
| 25 to 44 Years | 114 (24.7%) | $100,714 |
| 45 to 64 Years | 192 (41.6%) | $124,247 |
| 65+ Years | 142 (30.7%) | $54,643 |
| Total | 462 (100.0%) | $121,429 |
Poverty in Northfield
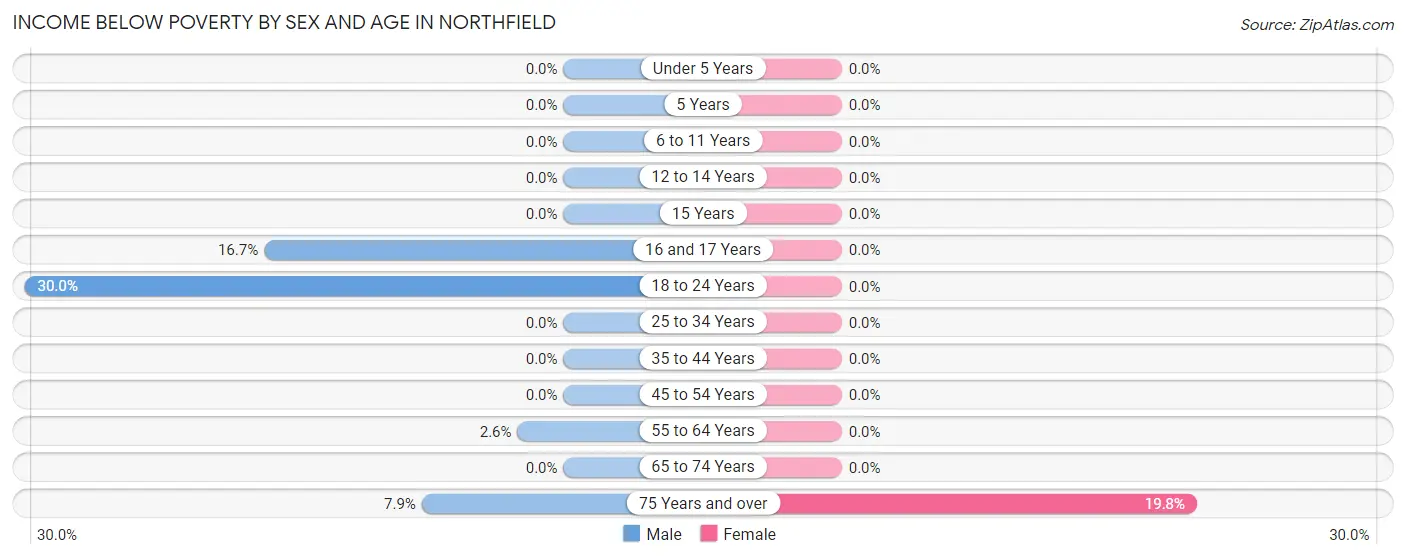
Income Below Poverty by Sex and Age in Northfield
With 2.4% poverty level for males and 3.4% for females among the residents of Northfield, 18 to 24 year old males and 75 year old and over females are the most vulnerable to poverty, with 6 males (30.0%) and 17 females (19.8%) in their respective age groups living below the poverty level.
| Age Bracket | Male | Female |
| Under 5 Years | 0 (0.0%) | 0 (0.0%) |
| 5 Years | 0 (0.0%) | 0 (0.0%) |
| 6 to 11 Years | 0 (0.0%) | 0 (0.0%) |
| 12 to 14 Years | 0 (0.0%) | 0 (0.0%) |
| 15 Years | 0 (0.0%) | 0 (0.0%) |
| 16 and 17 Years | 2 (16.7%) | 0 (0.0%) |
| 18 to 24 Years | 6 (30.0%) | 0 (0.0%) |
| 25 to 34 Years | 0 (0.0%) | 0 (0.0%) |
| 35 to 44 Years | 0 (0.0%) | 0 (0.0%) |
| 45 to 54 Years | 0 (0.0%) | 0 (0.0%) |
| 55 to 64 Years | 2 (2.6%) | 0 (0.0%) |
| 65 to 74 Years | 0 (0.0%) | 0 (0.0%) |
| 75 Years and over | 3 (7.9%) | 17 (19.8%) |
| Total | 13 (2.4%) | 17 (3.4%) |
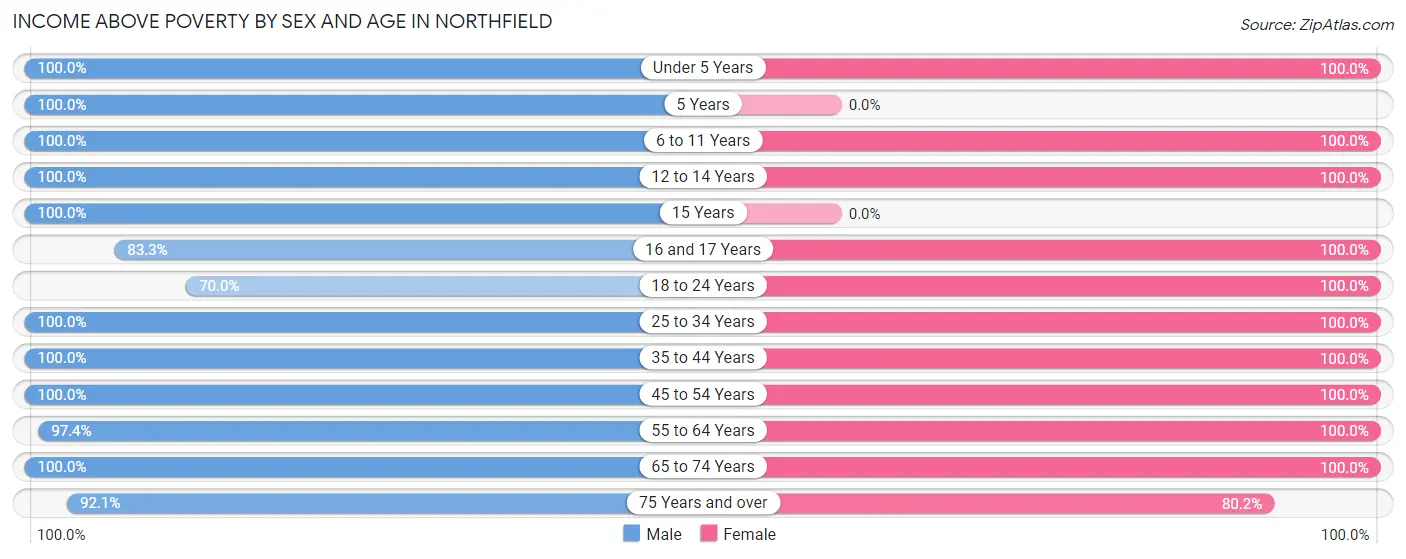
Income Above Poverty by Sex and Age in Northfield
According to the poverty statistics in Northfield, males aged under 5 years and females aged under 5 years are the age groups that are most secure financially, with 100.0% of males and 100.0% of females in these age groups living above the poverty line.
| Age Bracket | Male | Female |
| Under 5 Years | 65 (100.0%) | 22 (100.0%) |
| 5 Years | 15 (100.0%) | 0 (0.0%) |
| 6 to 11 Years | 47 (100.0%) | 26 (100.0%) |
| 12 to 14 Years | 14 (100.0%) | 25 (100.0%) |
| 15 Years | 15 (100.0%) | 0 (0.0%) |
| 16 and 17 Years | 10 (83.3%) | 5 (100.0%) |
| 18 to 24 Years | 14 (70.0%) | 20 (100.0%) |
| 25 to 34 Years | 35 (100.0%) | 44 (100.0%) |
| 35 to 44 Years | 54 (100.0%) | 54 (100.0%) |
| 45 to 54 Years | 124 (100.0%) | 49 (100.0%) |
| 55 to 64 Years | 76 (97.4%) | 123 (100.0%) |
| 65 to 74 Years | 30 (100.0%) | 44 (100.0%) |
| 75 Years and over | 35 (92.1%) | 69 (80.2%) |
| Total | 534 (97.6%) | 481 (96.6%) |
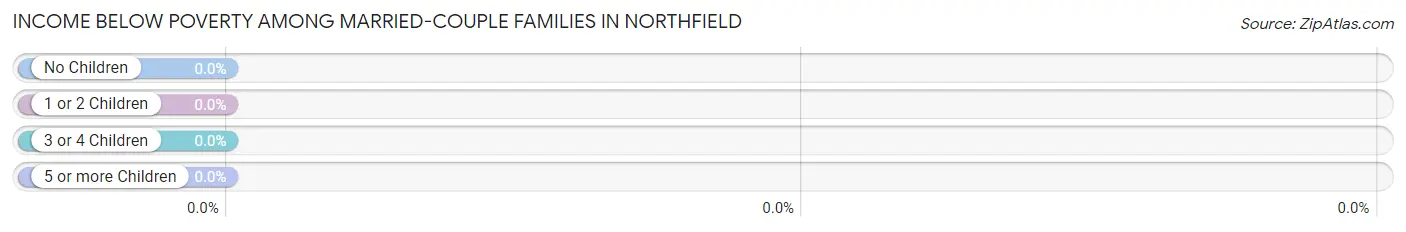
Income Below Poverty Among Married-Couple Families in Northfield
| Children | Above Poverty | Below Poverty |
| No Children | 183 (100.0%) | 0 (0.0%) |
| 1 or 2 Children | 52 (100.0%) | 0 (0.0%) |
| 3 or 4 Children | 33 (100.0%) | 0 (0.0%) |
| 5 or more Children | 0 (0.0%) | 0 (0.0%) |
| Total | 268 (100.0%) | 0 (0.0%) |
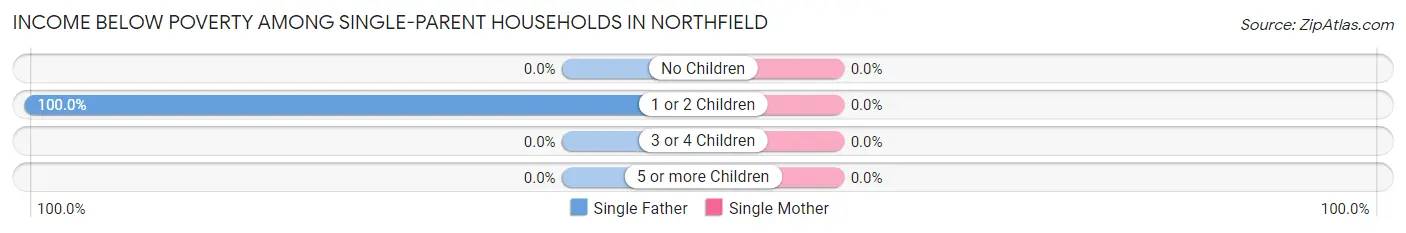
Income Below Poverty Among Single-Parent Households in Northfield
| Children | Single Father | Single Mother |
| No Children | 0 (0.0%) | 0 (0.0%) |
| 1 or 2 Children | 2 (100.0%) | 0 (0.0%) |
| 3 or 4 Children | 0 (0.0%) | 0 (0.0%) |
| 5 or more Children | 0 (0.0%) | 0 (0.0%) |
| Total | 2 (100.0%) | 0 (0.0%) |
Income Below Poverty Among Married-Couple vs Single-Parent Households in Northfield
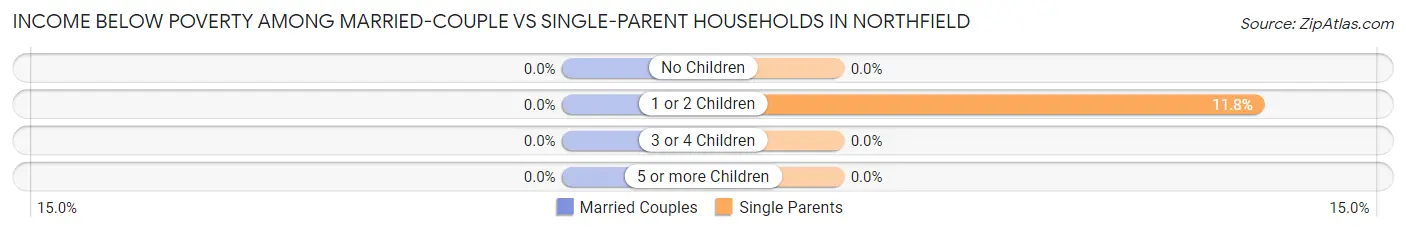
| Children | Married-Couple Families | Single-Parent Households |
| No Children | 0 (0.0%) | 0 (0.0%) |
| 1 or 2 Children | 0 (0.0%) | 2 (11.8%) |
| 3 or 4 Children | 0 (0.0%) | 0 (0.0%) |
| 5 or more Children | 0 (0.0%) | 0 (0.0%) |
| Total | 0 (0.0%) | 2 (8.7%) |
Employment Characteristics in Northfield
Employment by Class of Employer in Northfield
Among the 492 employed individuals in Northfield, private company employees (294 | 59.8%), not-for-profit organizations (92 | 18.7%), and local government employees (28 | 5.7%) make up the most common classes of employment.
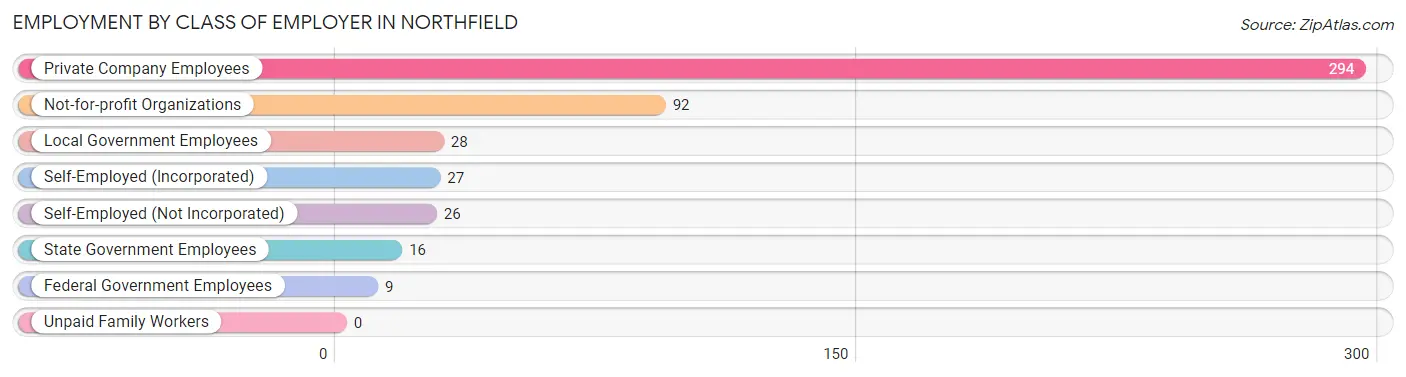
| Employer Class | # Employees | % Employees |
| Private Company Employees | 294 | 59.8% |
| Self-Employed (Incorporated) | 27 | 5.5% |
| Self-Employed (Not Incorporated) | 26 | 5.3% |
| Not-for-profit Organizations | 92 | 18.7% |
| Local Government Employees | 28 | 5.7% |
| State Government Employees | 16 | 3.3% |
| Federal Government Employees | 9 | 1.8% |
| Unpaid Family Workers | 0 | 0.0% |
| Total | 492 | 100.0% |
Employment Status by Age in Northfield
According to the labor force statistics for Northfield, out of the total population over 16 years of age (877), 57.4% or 503 individuals are in the labor force, with 0.8% or 4 of them unemployed. The age group with the highest labor force participation rate is 20 to 24 years, with 100.0% or 36 individuals in the labor force. Within the labor force, the 25 to 29 years age range has the highest percentage of unemployed individuals, with 10.8% or 4 of them being unemployed.
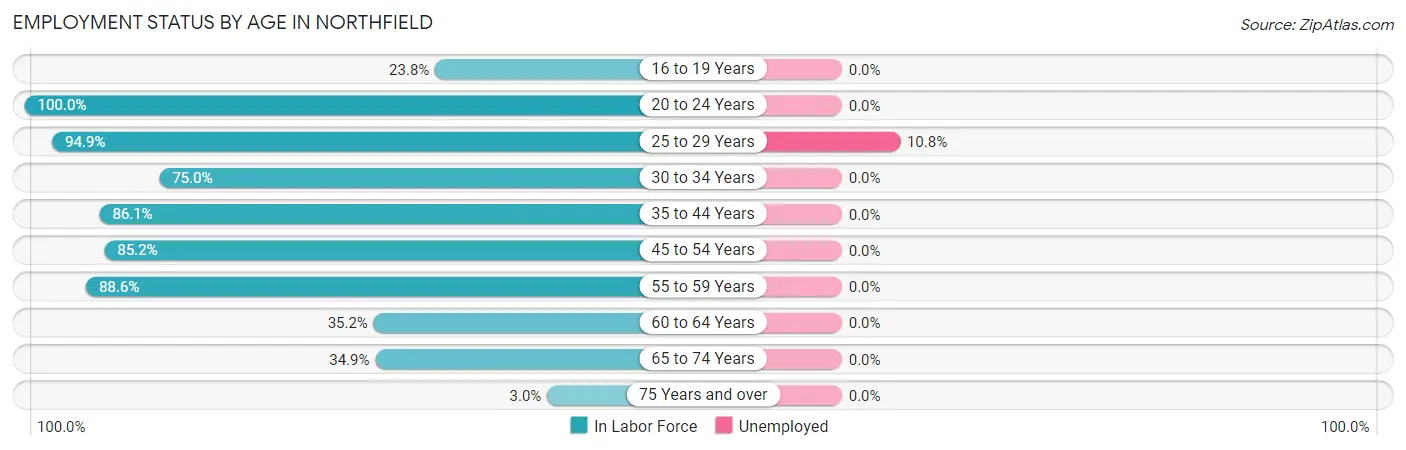
| Age Bracket | In Labor Force | Unemployed |
| 16 to 19 Years | 5 (23.8%) | 0 (0.0%) |
| 20 to 24 Years | 36 (100.0%) | 0 (0.0%) |
| 25 to 29 Years | 37 (94.9%) | 4 (10.8%) |
| 30 to 34 Years | 30 (75.0%) | 0 (0.0%) |
| 35 to 44 Years | 93 (86.1%) | 0 (0.0%) |
| 45 to 54 Years | 155 (85.2%) | 0 (0.0%) |
| 55 to 59 Years | 70 (88.6%) | 0 (0.0%) |
| 60 to 64 Years | 43 (35.2%) | 0 (0.0%) |
| 65 to 74 Years | 29 (34.9%) | 0 (0.0%) |
| 75 Years and over | 5 (3.0%) | 0 (0.0%) |
| Total | 503 (57.4%) | 4 (0.8%) |
Employment Status by Educational Attainment in Northfield
According to labor force statistics for Northfield, 75.1% of individuals (428) out of the total population between 25 and 64 years of age (570) are in the labor force, with 0.9% or 4 of them being unemployed. The group with the highest labor force participation rate are those with the educational attainment of high school diploma, with 83.3% or 15 individuals in the labor force. Within the labor force, individuals with less than high school education have the highest percentage of unemployment, with 100.0% or 4 of them being unemployed.
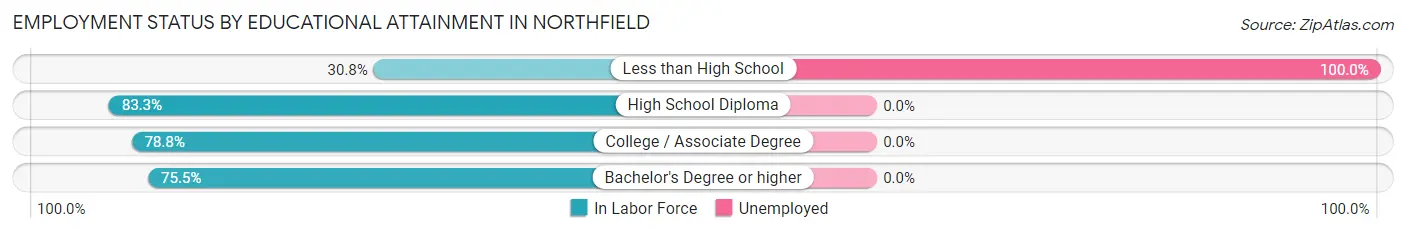
| Educational Attainment | In Labor Force | Unemployed |
| Less than High School | 4 (30.8%) | 13 (100.0%) |
| High School Diploma | 15 (83.3%) | 0 (0.0%) |
| College / Associate Degree | 52 (78.8%) | 0 (0.0%) |
| Bachelor's Degree or higher | 357 (75.5%) | 0 (0.0%) |
| Total | 428 (75.1%) | 5 (0.9%) |
Employment Occupations by Sex in Northfield
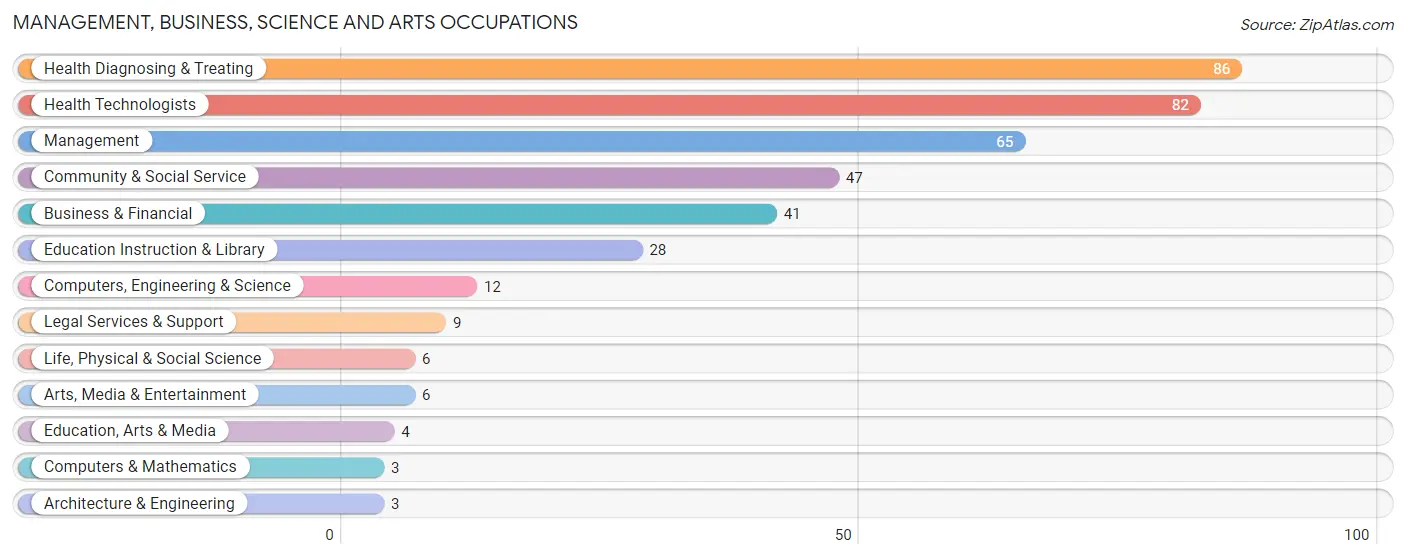
Management, Business, Science and Arts Occupations
The most common Management, Business, Science and Arts occupations in Northfield are Health Diagnosing & Treating (86 | 17.2%), Health Technologists (82 | 16.4%), Management (65 | 13.0%), Community & Social Service (47 | 9.4%), and Business & Financial (41 | 8.2%).
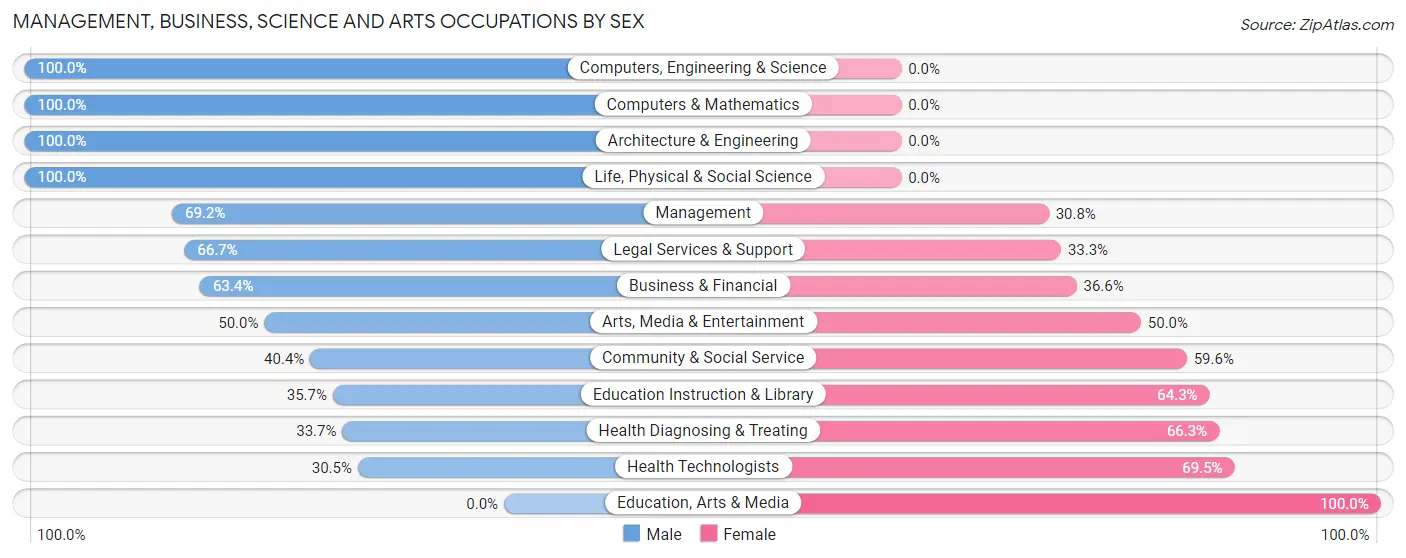
Management, Business, Science and Arts Occupations by Sex
Within the Management, Business, Science and Arts occupations in Northfield, the most male-oriented occupations are Computers, Engineering & Science (100.0%), Computers & Mathematics (100.0%), and Architecture & Engineering (100.0%), while the most female-oriented occupations are Education, Arts & Media (100.0%), Health Technologists (69.5%), and Health Diagnosing & Treating (66.3%).
| Occupation | Male | Female |
| Management | 45 (69.2%) | 20 (30.8%) |
| Business & Financial | 26 (63.4%) | 15 (36.6%) |
| Computers, Engineering & Science | 12 (100.0%) | 0 (0.0%) |
| Computers & Mathematics | 3 (100.0%) | 0 (0.0%) |
| Architecture & Engineering | 3 (100.0%) | 0 (0.0%) |
| Life, Physical & Social Science | 6 (100.0%) | 0 (0.0%) |
| Community & Social Service | 19 (40.4%) | 28 (59.6%) |
| Education, Arts & Media | 0 (0.0%) | 4 (100.0%) |
| Legal Services & Support | 6 (66.7%) | 3 (33.3%) |
| Education Instruction & Library | 10 (35.7%) | 18 (64.3%) |
| Arts, Media & Entertainment | 3 (50.0%) | 3 (50.0%) |
| Health Diagnosing & Treating | 29 (33.7%) | 57 (66.3%) |
| Health Technologists | 25 (30.5%) | 57 (69.5%) |
| Total (Category) | 131 (52.2%) | 120 (47.8%) |
| Total (Overall) | 313 (62.7%) | 186 (37.3%) |
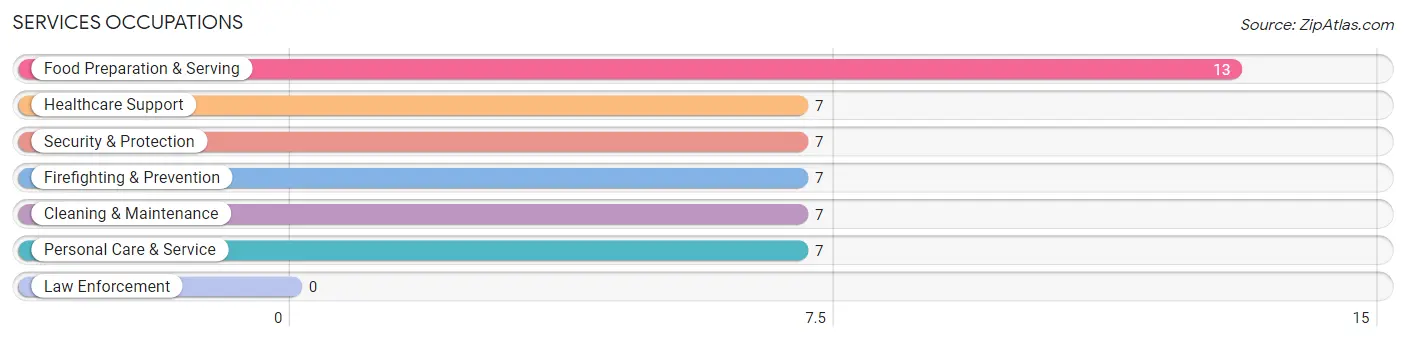
Services Occupations
The most common Services occupations in Northfield are Food Preparation & Serving (13 | 2.6%), Healthcare Support (7 | 1.4%), Security & Protection (7 | 1.4%), Firefighting & Prevention (7 | 1.4%), and Cleaning & Maintenance (7 | 1.4%).
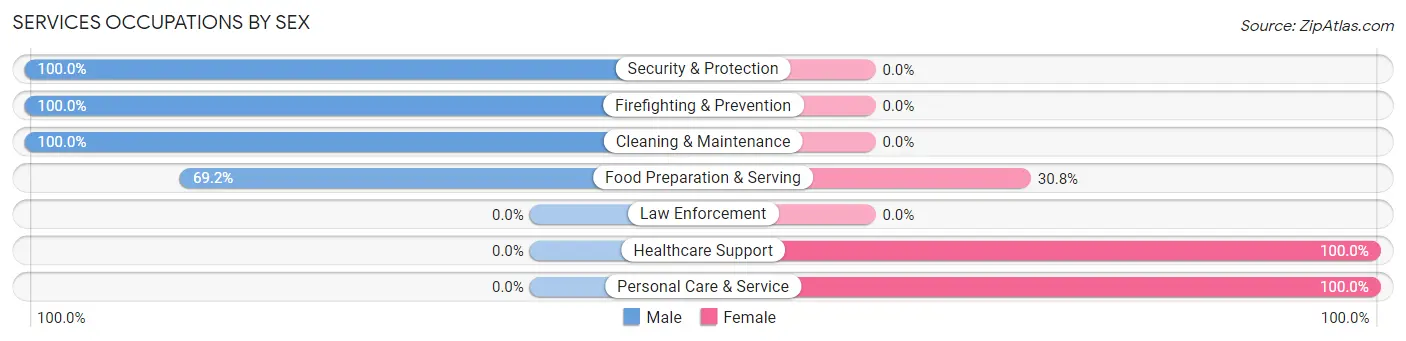
Services Occupations by Sex
Within the Services occupations in Northfield, the most male-oriented occupations are Security & Protection (100.0%), Firefighting & Prevention (100.0%), and Cleaning & Maintenance (100.0%), while the most female-oriented occupations are Healthcare Support (100.0%), Personal Care & Service (100.0%), and Food Preparation & Serving (30.8%).
| Occupation | Male | Female |
| Healthcare Support | 0 (0.0%) | 7 (100.0%) |
| Security & Protection | 7 (100.0%) | 0 (0.0%) |
| Firefighting & Prevention | 7 (100.0%) | 0 (0.0%) |
| Law Enforcement | 0 (0.0%) | 0 (0.0%) |
| Food Preparation & Serving | 9 (69.2%) | 4 (30.8%) |
| Cleaning & Maintenance | 7 (100.0%) | 0 (0.0%) |
| Personal Care & Service | 0 (0.0%) | 7 (100.0%) |
| Total (Category) | 23 (56.1%) | 18 (43.9%) |
| Total (Overall) | 313 (62.7%) | 186 (37.3%) |
Sales and Office Occupations
The most common Sales and Office occupations in Northfield are Sales & Related (133 | 26.7%), and Office & Administration (50 | 10.0%).
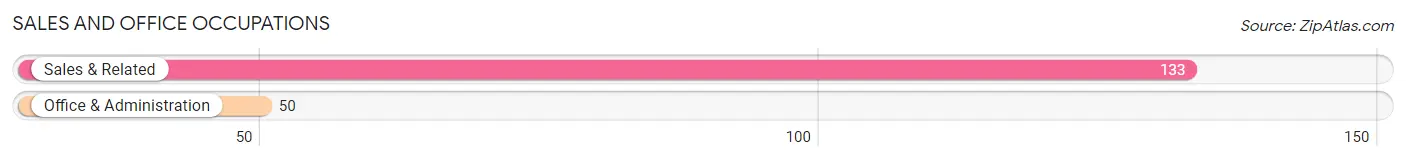
Sales and Office Occupations by Sex
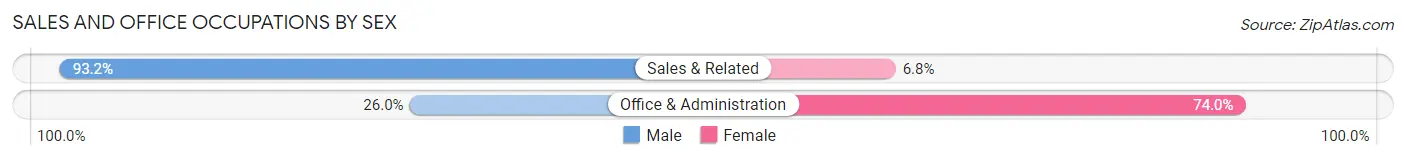
| Occupation | Male | Female |
| Sales & Related | 124 (93.2%) | 9 (6.8%) |
| Office & Administration | 13 (26.0%) | 37 (74.0%) |
| Total (Category) | 137 (74.9%) | 46 (25.1%) |
| Total (Overall) | 313 (62.7%) | 186 (37.3%) |
Natural Resources, Construction and Maintenance Occupations
The most common Natural Resources, Construction and Maintenance occupations in Northfield are Construction & Extraction (11 | 2.2%), and Installation, Maintenance & Repair (7 | 1.4%).
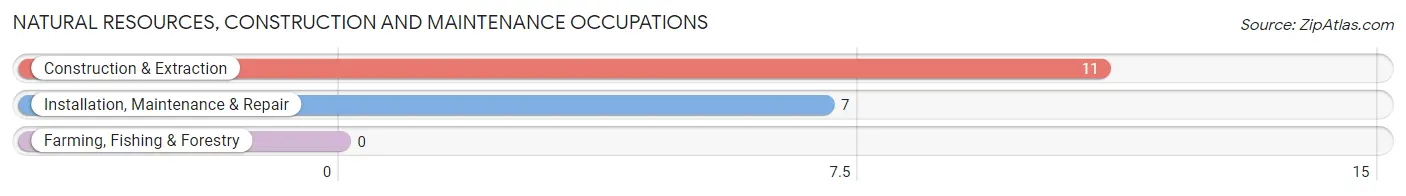
Natural Resources, Construction and Maintenance Occupations by Sex
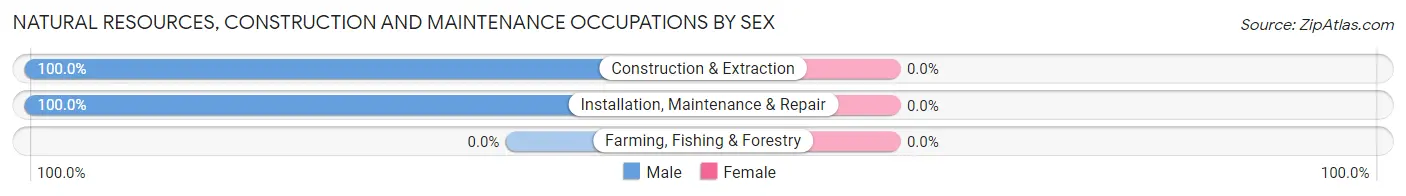
| Occupation | Male | Female |
| Farming, Fishing & Forestry | 0 (0.0%) | 0 (0.0%) |
| Construction & Extraction | 11 (100.0%) | 0 (0.0%) |
| Installation, Maintenance & Repair | 7 (100.0%) | 0 (0.0%) |
| Total (Category) | 18 (100.0%) | 0 (0.0%) |
| Total (Overall) | 313 (62.7%) | 186 (37.3%) |
Production, Transportation and Moving Occupations
The most common Production, Transportation and Moving occupations in Northfield are Material Moving (4 | 0.8%), and Production (2 | 0.4%).
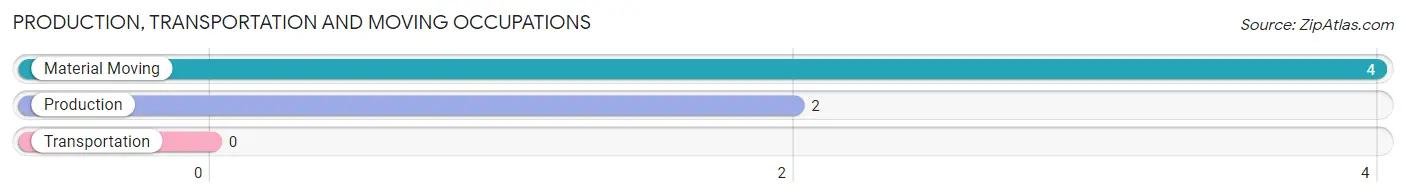
Production, Transportation and Moving Occupations by Sex
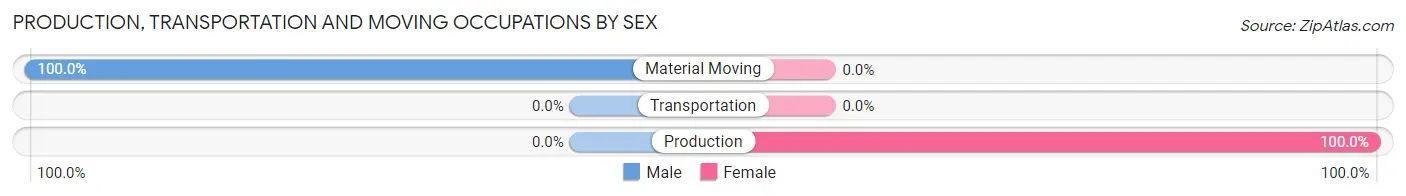
| Occupation | Male | Female |
| Production | 0 (0.0%) | 2 (100.0%) |
| Transportation | 0 (0.0%) | 0 (0.0%) |
| Material Moving | 4 (100.0%) | 0 (0.0%) |
| Total (Category) | 4 (66.7%) | 2 (33.3%) |
| Total (Overall) | 313 (62.7%) | 186 (37.3%) |
Employment Industries by Sex in Northfield
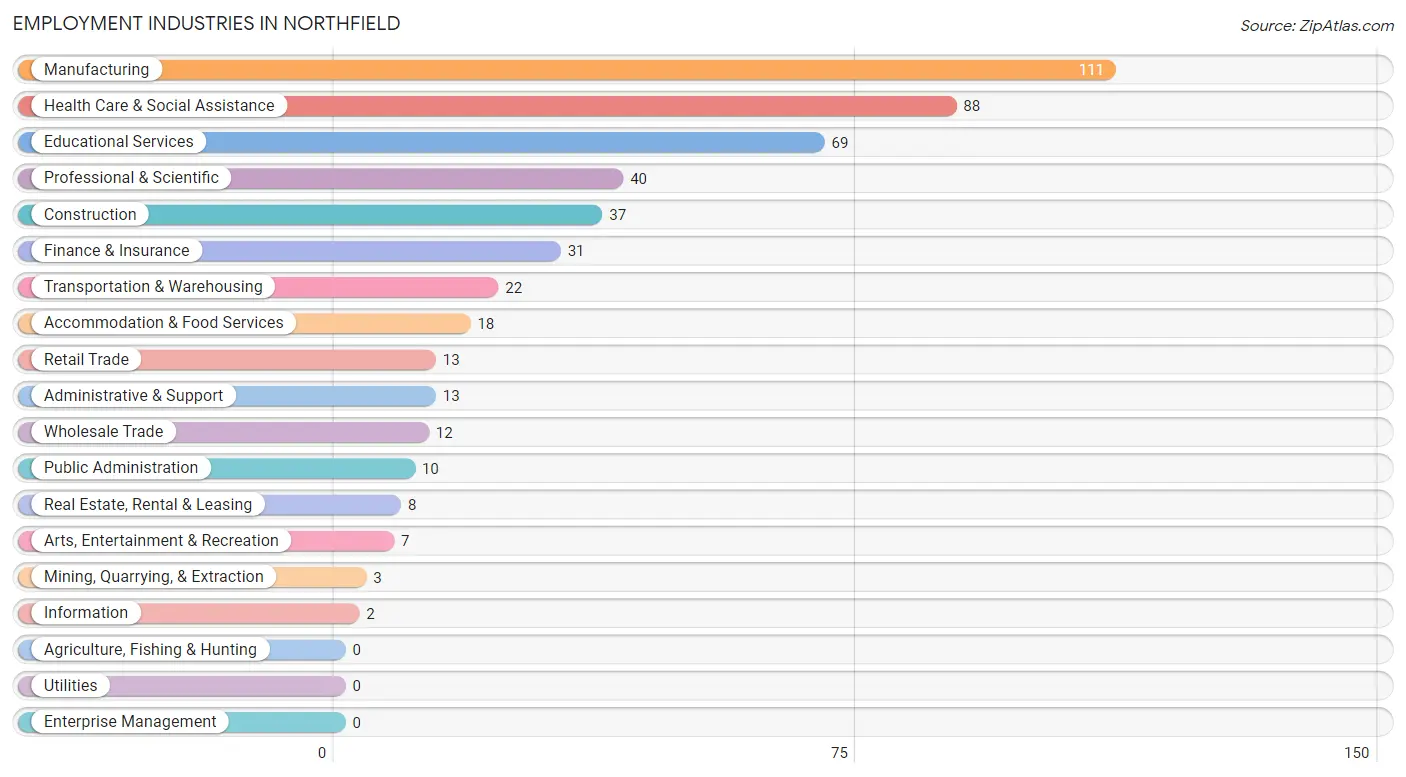
Employment Industries in Northfield
The major employment industries in Northfield include Manufacturing (111 | 22.2%), Health Care & Social Assistance (88 | 17.6%), Educational Services (69 | 13.8%), Professional & Scientific (40 | 8.0%), and Construction (37 | 7.4%).
Employment Industries by Sex in Northfield
The Northfield industries that see more men than women are Mining, Quarrying, & Extraction (100.0%), Retail Trade (100.0%), and Transportation & Warehousing (100.0%), whereas the industries that tend to have a higher number of women are Arts, Entertainment & Recreation (100.0%), Health Care & Social Assistance (72.7%), and Wholesale Trade (50.0%).
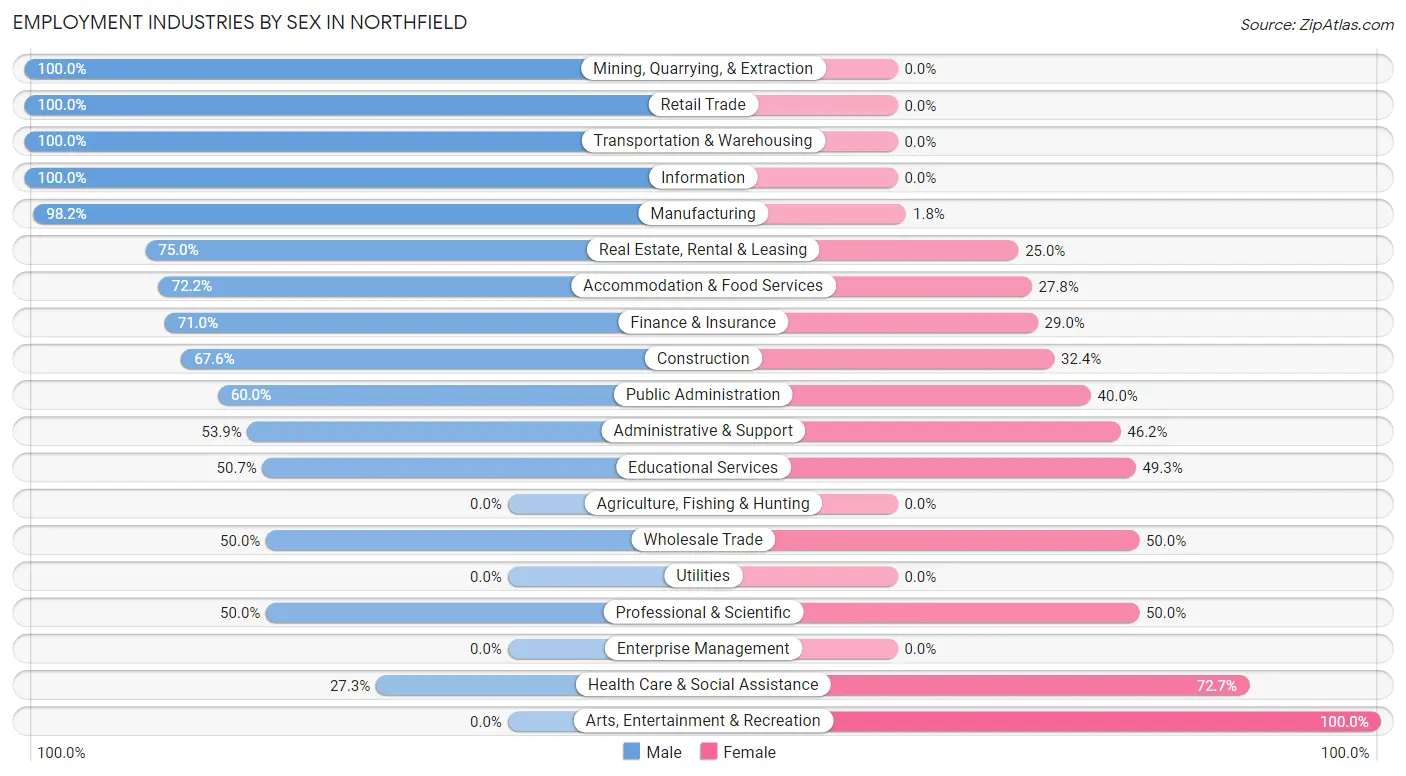
| Industry | Male | Female |
| Agriculture, Fishing & Hunting | 0 (0.0%) | 0 (0.0%) |
| Mining, Quarrying, & Extraction | 3 (100.0%) | 0 (0.0%) |
| Construction | 25 (67.6%) | 12 (32.4%) |
| Manufacturing | 109 (98.2%) | 2 (1.8%) |
| Wholesale Trade | 6 (50.0%) | 6 (50.0%) |
| Retail Trade | 13 (100.0%) | 0 (0.0%) |
| Transportation & Warehousing | 22 (100.0%) | 0 (0.0%) |
| Utilities | 0 (0.0%) | 0 (0.0%) |
| Information | 2 (100.0%) | 0 (0.0%) |
| Finance & Insurance | 22 (71.0%) | 9 (29.0%) |
| Real Estate, Rental & Leasing | 6 (75.0%) | 2 (25.0%) |
| Professional & Scientific | 20 (50.0%) | 20 (50.0%) |
| Enterprise Management | 0 (0.0%) | 0 (0.0%) |
| Administrative & Support | 7 (53.8%) | 6 (46.2%) |
| Educational Services | 35 (50.7%) | 34 (49.3%) |
| Health Care & Social Assistance | 24 (27.3%) | 64 (72.7%) |
| Arts, Entertainment & Recreation | 0 (0.0%) | 7 (100.0%) |
| Accommodation & Food Services | 13 (72.2%) | 5 (27.8%) |
| Public Administration | 6 (60.0%) | 4 (40.0%) |
| Total | 313 (62.7%) | 186 (37.3%) |
Education in Northfield
School Enrollment in Northfield
The most common levels of schooling among the 231 students in Northfield are middle school (57 | 24.7%), nursery / preschool (55 | 23.8%), and high school (42 | 18.2%).
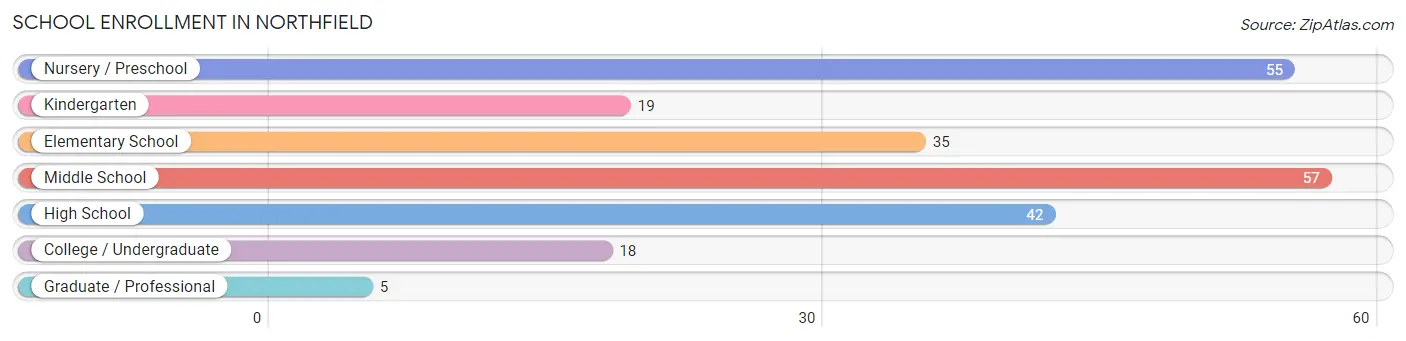
| School Level | # Students | % Students |
| Nursery / Preschool | 55 | 23.8% |
| Kindergarten | 19 | 8.2% |
| Elementary School | 35 | 15.1% |
| Middle School | 57 | 24.7% |
| High School | 42 | 18.2% |
| College / Undergraduate | 18 | 7.8% |
| Graduate / Professional | 5 | 2.2% |
| Total | 231 | 100.0% |
School Enrollment by Age by Funding Source in Northfield
Out of a total of 231 students who are enrolled in schools in Northfield, 111 (48.1%) attend a private institution, while the remaining 120 (51.9%) are enrolled in public schools. The age group of 3 to 4 year olds has the highest likelihood of being enrolled in private schools, with 36 (69.2% in the age bracket) enrolled. Conversely, the age group of 20 to 24 year olds has the lowest likelihood of being enrolled in a private school, with 7 (100.0% in the age bracket) attending a public institution.
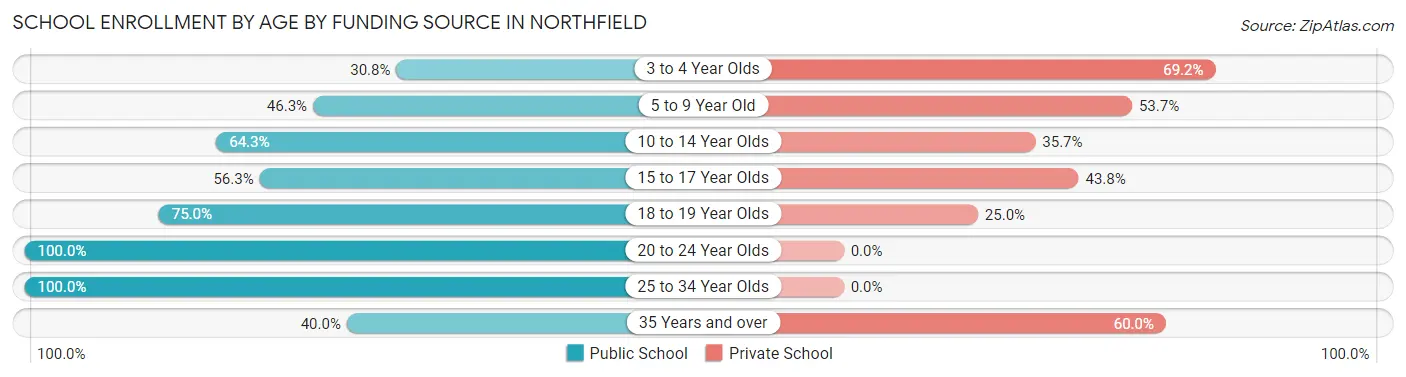
| Age Bracket | Public School | Private School |
| 3 to 4 Year Olds | 16 (30.8%) | 36 (69.2%) |
| 5 to 9 Year Old | 25 (46.3%) | 29 (53.7%) |
| 10 to 14 Year Olds | 45 (64.3%) | 25 (35.7%) |
| 15 to 17 Year Olds | 18 (56.2%) | 14 (43.8%) |
| 18 to 19 Year Olds | 3 (75.0%) | 1 (25.0%) |
| 20 to 24 Year Olds | 7 (100.0%) | 0 (0.0%) |
| 25 to 34 Year Olds | 2 (100.0%) | 0 (0.0%) |
| 35 Years and over | 4 (40.0%) | 6 (60.0%) |
| Total | 120 (51.9%) | 111 (48.1%) |
Educational Attainment by Field of Study in Northfield
Business (207 | 34.2%), bio, nature & agricultural (87 | 14.4%), education (51 | 8.4%), science & technology (39 | 6.5%), and communications (39 | 6.5%) are the most common fields of study among 605 individuals in Northfield who have obtained a bachelor's degree or higher.
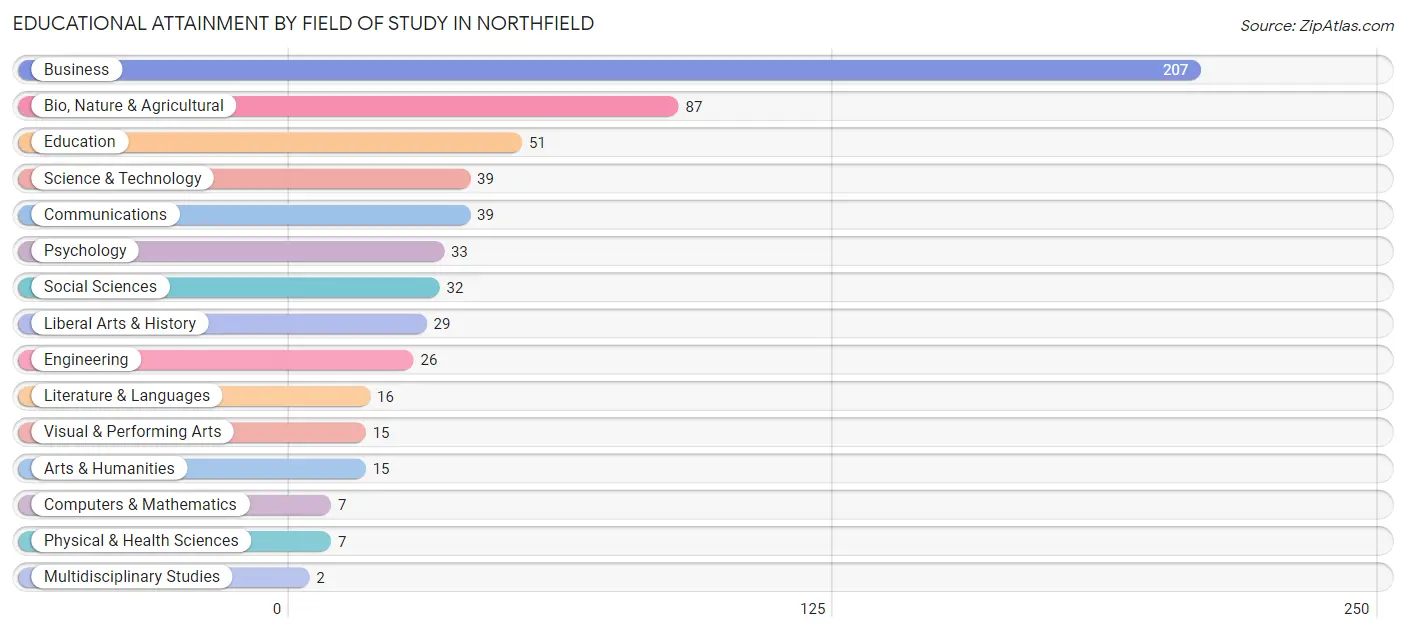
| Field of Study | # Graduates | % Graduates |
| Computers & Mathematics | 7 | 1.2% |
| Bio, Nature & Agricultural | 87 | 14.4% |
| Physical & Health Sciences | 7 | 1.2% |
| Psychology | 33 | 5.4% |
| Social Sciences | 32 | 5.3% |
| Engineering | 26 | 4.3% |
| Multidisciplinary Studies | 2 | 0.3% |
| Science & Technology | 39 | 6.5% |
| Business | 207 | 34.2% |
| Education | 51 | 8.4% |
| Literature & Languages | 16 | 2.6% |
| Liberal Arts & History | 29 | 4.8% |
| Visual & Performing Arts | 15 | 2.5% |
| Communications | 39 | 6.5% |
| Arts & Humanities | 15 | 2.5% |
| Total | 605 | 100.0% |
Transportation & Commute in Northfield
Vehicle Availability by Sex in Northfield
The most prevalent vehicle ownership categories in Northfield are males with 2 vehicles (129, accounting for 42.2%) and females with 2 vehicles (109, making up 69.4%).
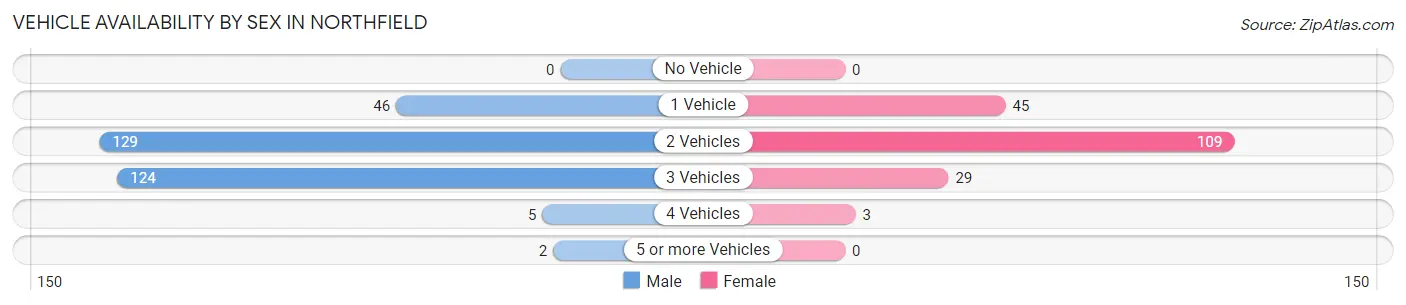
| Vehicles Available | Male | Female |
| No Vehicle | 0 (0.0%) | 0 (0.0%) |
| 1 Vehicle | 46 (15.0%) | 45 (24.2%) |
| 2 Vehicles | 129 (42.2%) | 109 (58.6%) |
| 3 Vehicles | 124 (40.5%) | 29 (15.6%) |
| 4 Vehicles | 5 (1.6%) | 3 (1.6%) |
| 5 or more Vehicles | 2 (0.6%) | 0 (0.0%) |
| Total | 306 (100.0%) | 186 (100.0%) |
Commute Time in Northfield
The most frequently occuring commute durations in Northfield are 15 to 19 minutes (114 commuters, 33.3%), 10 to 14 minutes (74 commuters, 21.6%), and 20 to 24 minutes (72 commuters, 21.0%).
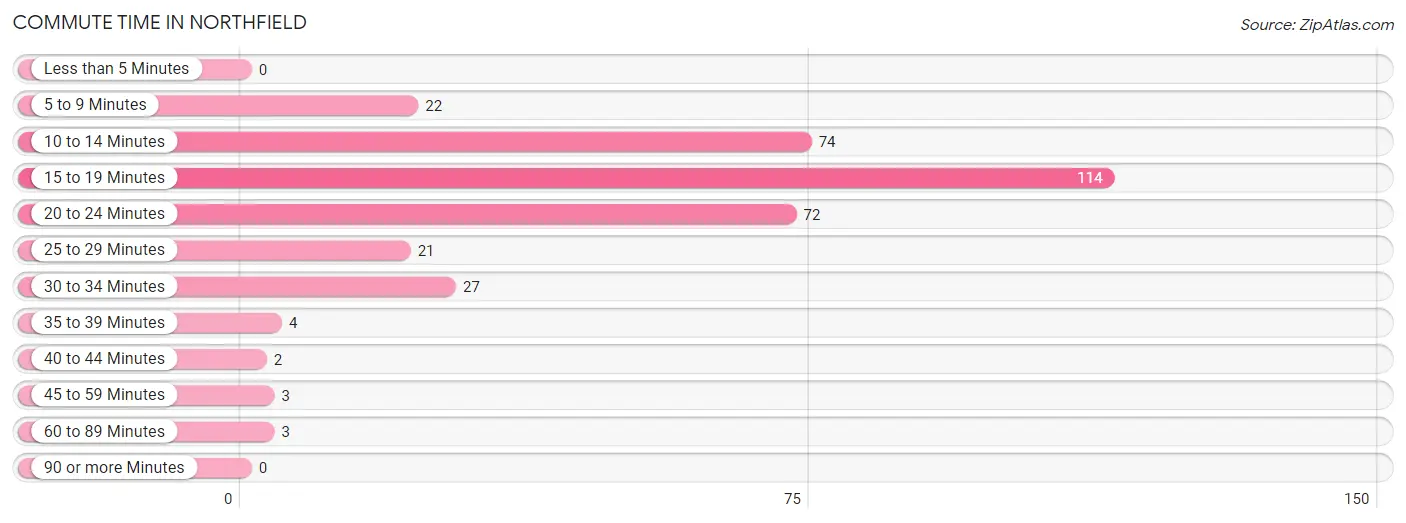
| Commute Time | # Commuters | % Commuters |
| Less than 5 Minutes | 0 | 0.0% |
| 5 to 9 Minutes | 22 | 6.4% |
| 10 to 14 Minutes | 74 | 21.6% |
| 15 to 19 Minutes | 114 | 33.3% |
| 20 to 24 Minutes | 72 | 21.0% |
| 25 to 29 Minutes | 21 | 6.1% |
| 30 to 34 Minutes | 27 | 7.9% |
| 35 to 39 Minutes | 4 | 1.2% |
| 40 to 44 Minutes | 2 | 0.6% |
| 45 to 59 Minutes | 3 | 0.9% |
| 60 to 89 Minutes | 3 | 0.9% |
| 90 or more Minutes | 0 | 0.0% |
Commute Time by Sex in Northfield
The most common commute times in Northfield are 15 to 19 minutes (75 commuters, 40.3%) for males and 15 to 19 minutes (39 commuters, 25.0%) for females.
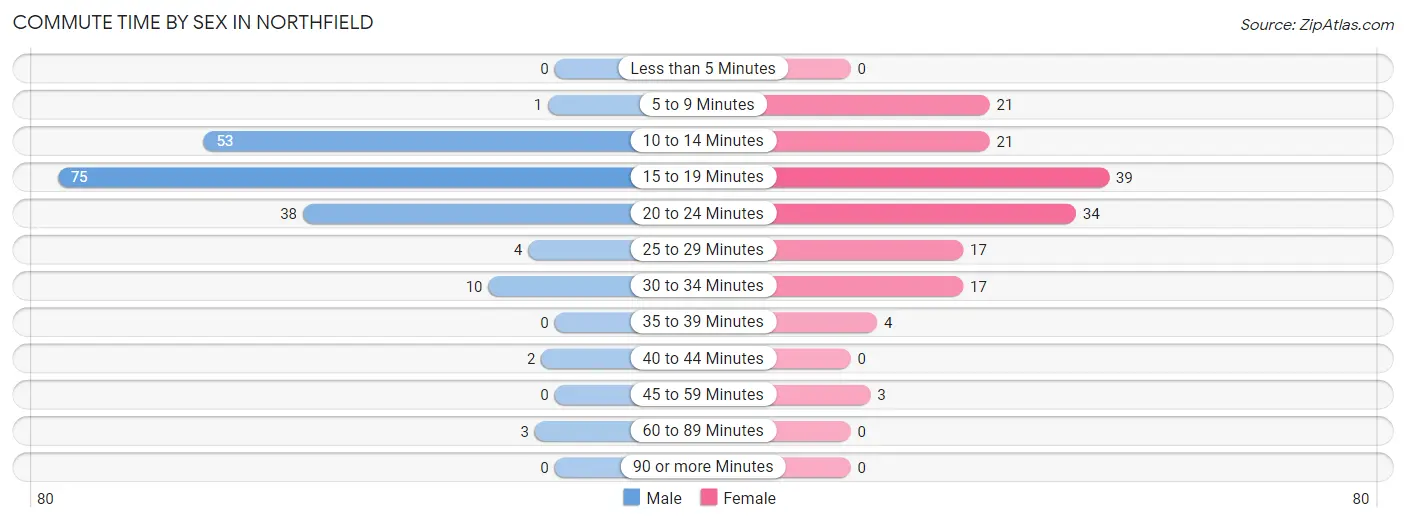
| Commute Time | Male | Female |
| Less than 5 Minutes | 0 (0.0%) | 0 (0.0%) |
| 5 to 9 Minutes | 1 (0.5%) | 21 (13.5%) |
| 10 to 14 Minutes | 53 (28.5%) | 21 (13.5%) |
| 15 to 19 Minutes | 75 (40.3%) | 39 (25.0%) |
| 20 to 24 Minutes | 38 (20.4%) | 34 (21.8%) |
| 25 to 29 Minutes | 4 (2.1%) | 17 (10.9%) |
| 30 to 34 Minutes | 10 (5.4%) | 17 (10.9%) |
| 35 to 39 Minutes | 0 (0.0%) | 4 (2.6%) |
| 40 to 44 Minutes | 2 (1.1%) | 0 (0.0%) |
| 45 to 59 Minutes | 0 (0.0%) | 3 (1.9%) |
| 60 to 89 Minutes | 3 (1.6%) | 0 (0.0%) |
| 90 or more Minutes | 0 (0.0%) | 0 (0.0%) |
Time of Departure to Work by Sex in Northfield
The most frequent times of departure to work in Northfield are 7:30 AM to 7:59 AM (54, 29.0%) for males and 9:00 AM to 9:59 AM (32, 20.5%) for females.
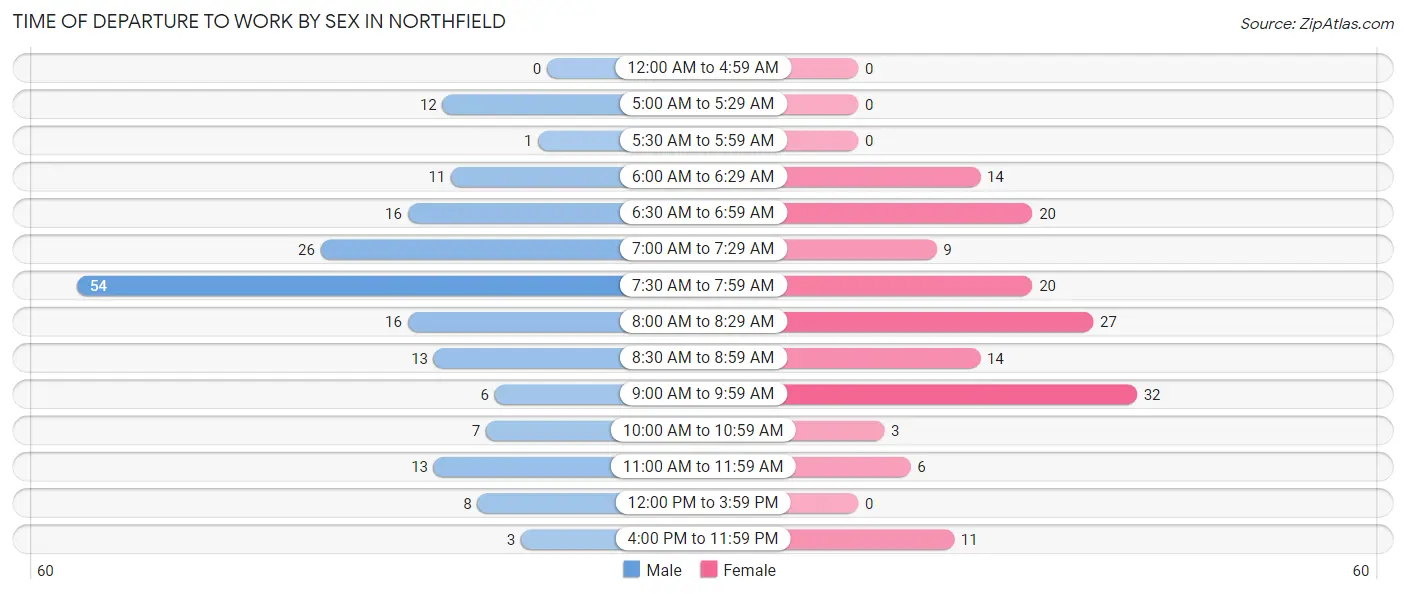
| Time of Departure | Male | Female |
| 12:00 AM to 4:59 AM | 0 (0.0%) | 0 (0.0%) |
| 5:00 AM to 5:29 AM | 12 (6.5%) | 0 (0.0%) |
| 5:30 AM to 5:59 AM | 1 (0.5%) | 0 (0.0%) |
| 6:00 AM to 6:29 AM | 11 (5.9%) | 14 (9.0%) |
| 6:30 AM to 6:59 AM | 16 (8.6%) | 20 (12.8%) |
| 7:00 AM to 7:29 AM | 26 (14.0%) | 9 (5.8%) |
| 7:30 AM to 7:59 AM | 54 (29.0%) | 20 (12.8%) |
| 8:00 AM to 8:29 AM | 16 (8.6%) | 27 (17.3%) |
| 8:30 AM to 8:59 AM | 13 (7.0%) | 14 (9.0%) |
| 9:00 AM to 9:59 AM | 6 (3.2%) | 32 (20.5%) |
| 10:00 AM to 10:59 AM | 7 (3.8%) | 3 (1.9%) |
| 11:00 AM to 11:59 AM | 13 (7.0%) | 6 (3.8%) |
| 12:00 PM to 3:59 PM | 8 (4.3%) | 0 (0.0%) |
| 4:00 PM to 11:59 PM | 3 (1.6%) | 11 (7.0%) |
| Total | 186 (100.0%) | 156 (100.0%) |
Housing Occupancy in Northfield
Occupancy by Ownership in Northfield
Of the total 462 dwellings in Northfield, owner-occupied units account for 331 (71.7%), while renter-occupied units make up 131 (28.3%).
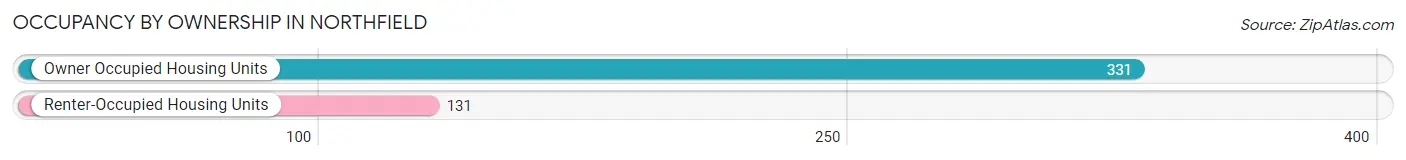
| Occupancy | # Housing Units | % Housing Units |
| Owner Occupied Housing Units | 331 | 71.7% |
| Renter-Occupied Housing Units | 131 | 28.3% |
| Total Occupied Housing Units | 462 | 100.0% |
Occupancy by Household Size in Northfield
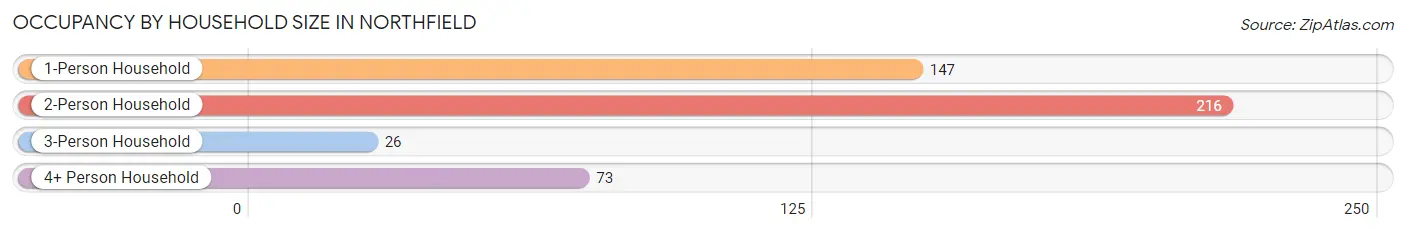
| Household Size | # Housing Units | % Housing Units |
| 1-Person Household | 147 | 31.8% |
| 2-Person Household | 216 | 46.8% |
| 3-Person Household | 26 | 5.6% |
| 4+ Person Household | 73 | 15.8% |
| Total Housing Units | 462 | 100.0% |
Occupancy by Ownership by Household Size in Northfield
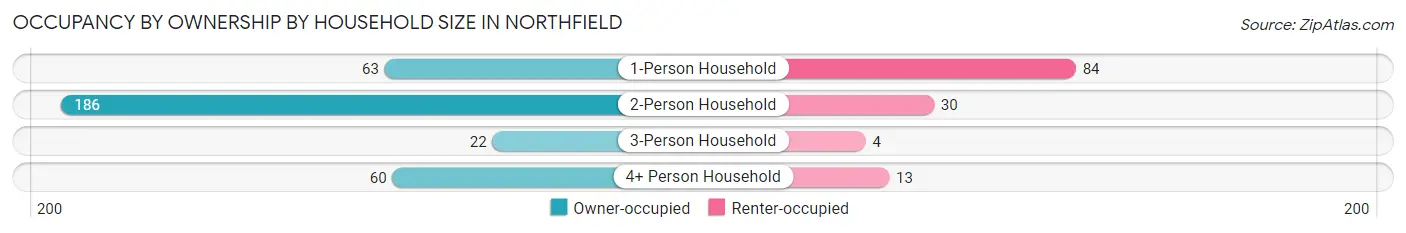
| Household Size | Owner-occupied | Renter-occupied |
| 1-Person Household | 63 (42.9%) | 84 (57.1%) |
| 2-Person Household | 186 (86.1%) | 30 (13.9%) |
| 3-Person Household | 22 (84.6%) | 4 (15.4%) |
| 4+ Person Household | 60 (82.2%) | 13 (17.8%) |
| Total Housing Units | 331 (71.7%) | 131 (28.3%) |
Occupancy by Educational Attainment in Northfield
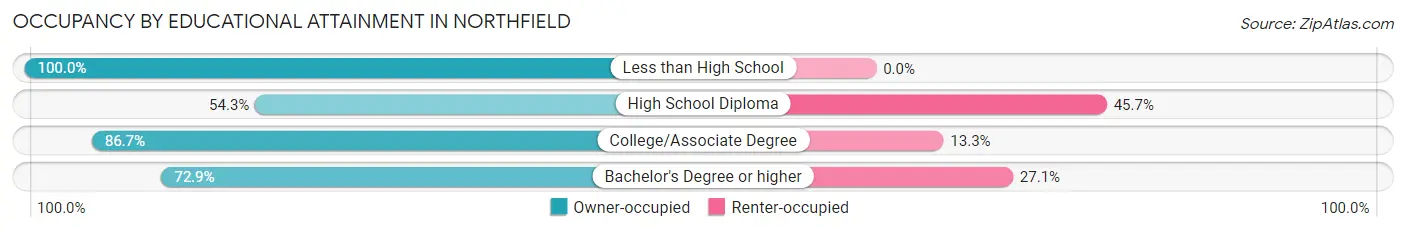
| Household Size | Owner-occupied | Renter-occupied |
| Less than High School | 4 (100.0%) | 0 (0.0%) |
| High School Diploma | 38 (54.3%) | 32 (45.7%) |
| College/Associate Degree | 39 (86.7%) | 6 (13.3%) |
| Bachelor's Degree or higher | 250 (72.9%) | 93 (27.1%) |
Occupancy by Age of Householder in Northfield
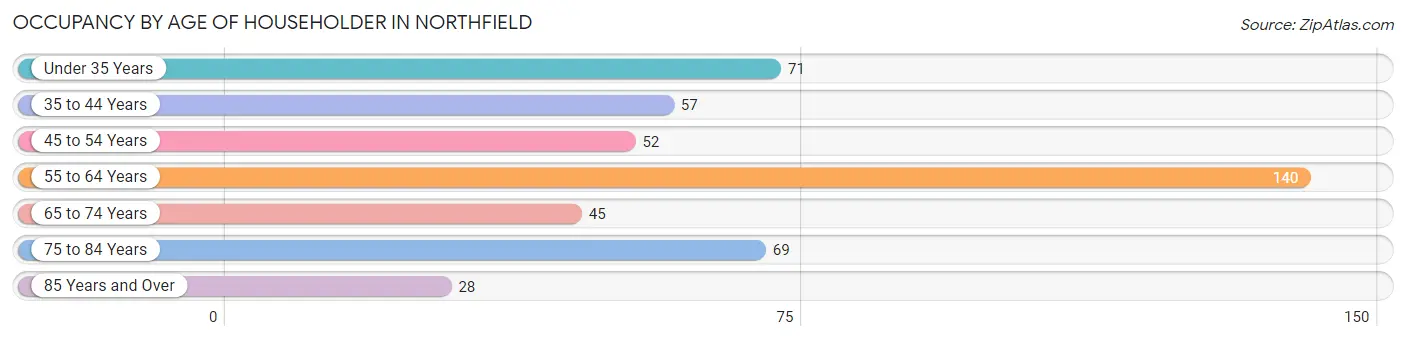
| Age Bracket | # Households | % Households |
| Under 35 Years | 71 | 15.4% |
| 35 to 44 Years | 57 | 12.3% |
| 45 to 54 Years | 52 | 11.3% |
| 55 to 64 Years | 140 | 30.3% |
| 65 to 74 Years | 45 | 9.7% |
| 75 to 84 Years | 69 | 14.9% |
| 85 Years and Over | 28 | 6.1% |
| Total | 462 | 100.0% |
Housing Finances in Northfield
Median Income by Occupancy in Northfield
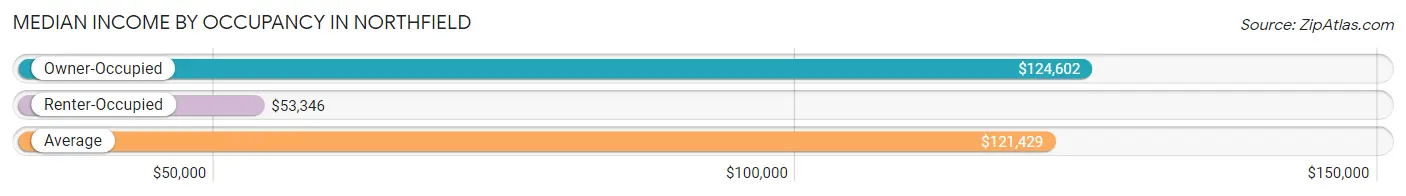
| Occupancy Type | # Households | Median Income |
| Owner-Occupied | 331 (71.7%) | $124,602 |
| Renter-Occupied | 131 (28.3%) | $53,346 |
| Average | 462 (100.0%) | $121,429 |
Occupancy by Householder Income Bracket in Northfield
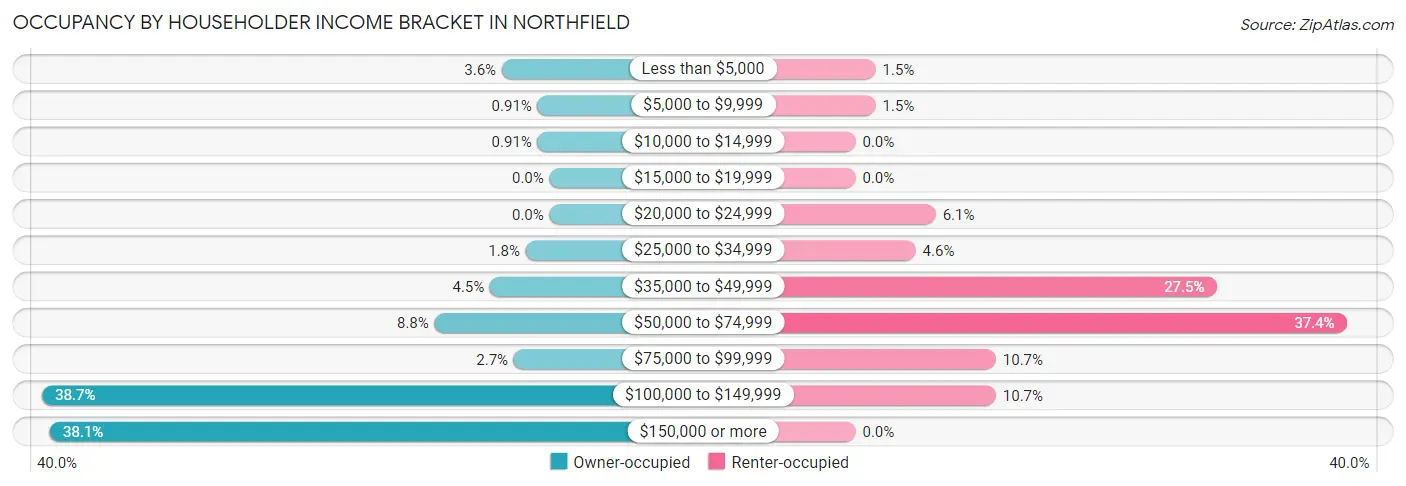
| Income Bracket | Owner-occupied | Renter-occupied |
| Less than $5,000 | 12 (3.6%) | 2 (1.5%) |
| $5,000 to $9,999 | 3 (0.9%) | 2 (1.5%) |
| $10,000 to $14,999 | 3 (0.9%) | 0 (0.0%) |
| $15,000 to $19,999 | 0 (0.0%) | 0 (0.0%) |
| $20,000 to $24,999 | 0 (0.0%) | 8 (6.1%) |
| $25,000 to $34,999 | 6 (1.8%) | 6 (4.6%) |
| $35,000 to $49,999 | 15 (4.5%) | 36 (27.5%) |
| $50,000 to $74,999 | 29 (8.8%) | 49 (37.4%) |
| $75,000 to $99,999 | 9 (2.7%) | 14 (10.7%) |
| $100,000 to $149,999 | 128 (38.7%) | 14 (10.7%) |
| $150,000 or more | 126 (38.1%) | 0 (0.0%) |
| Total | 331 (100.0%) | 131 (100.0%) |
Monthly Housing Cost Tiers in Northfield
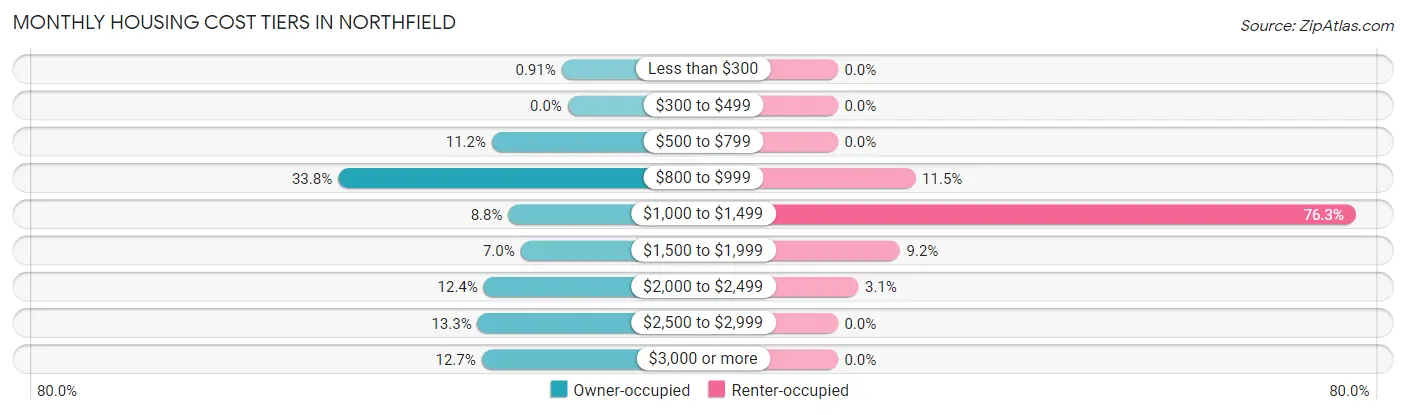
| Monthly Cost | Owner-occupied | Renter-occupied |
| Less than $300 | 3 (0.9%) | 0 (0.0%) |
| $300 to $499 | 0 (0.0%) | 0 (0.0%) |
| $500 to $799 | 37 (11.2%) | 0 (0.0%) |
| $800 to $999 | 112 (33.8%) | 15 (11.5%) |
| $1,000 to $1,499 | 29 (8.8%) | 100 (76.3%) |
| $1,500 to $1,999 | 23 (7.0%) | 12 (9.2%) |
| $2,000 to $2,499 | 41 (12.4%) | 4 (3.0%) |
| $2,500 to $2,999 | 44 (13.3%) | 0 (0.0%) |
| $3,000 or more | 42 (12.7%) | 0 (0.0%) |
| Total | 331 (100.0%) | 131 (100.0%) |
Physical Housing Characteristics in Northfield
Housing Structures in Northfield
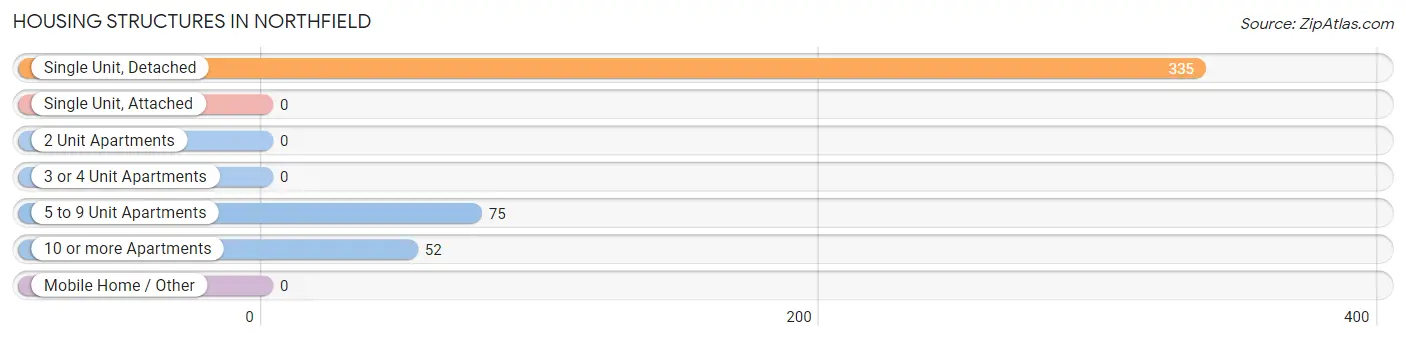
| Structure Type | # Housing Units | % Housing Units |
| Single Unit, Detached | 335 | 72.5% |
| Single Unit, Attached | 0 | 0.0% |
| 2 Unit Apartments | 0 | 0.0% |
| 3 or 4 Unit Apartments | 0 | 0.0% |
| 5 to 9 Unit Apartments | 75 | 16.2% |
| 10 or more Apartments | 52 | 11.3% |
| Mobile Home / Other | 0 | 0.0% |
| Total | 462 | 100.0% |
Housing Structures by Occupancy in Northfield
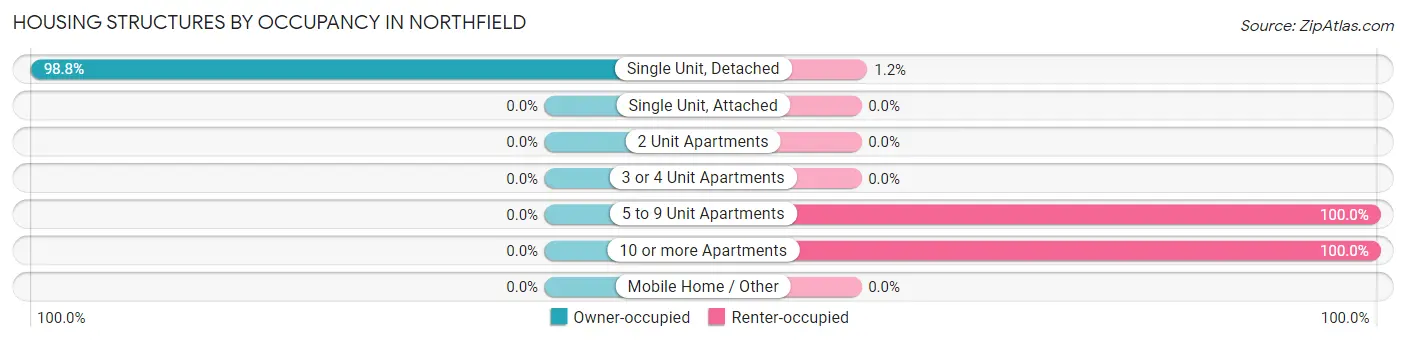
| Structure Type | Owner-occupied | Renter-occupied |
| Single Unit, Detached | 331 (98.8%) | 4 (1.2%) |
| Single Unit, Attached | 0 (0.0%) | 0 (0.0%) |
| 2 Unit Apartments | 0 (0.0%) | 0 (0.0%) |
| 3 or 4 Unit Apartments | 0 (0.0%) | 0 (0.0%) |
| 5 to 9 Unit Apartments | 0 (0.0%) | 75 (100.0%) |
| 10 or more Apartments | 0 (0.0%) | 52 (100.0%) |
| Mobile Home / Other | 0 (0.0%) | 0 (0.0%) |
| Total | 331 (71.7%) | 131 (28.3%) |
Housing Structures by Number of Rooms in Northfield
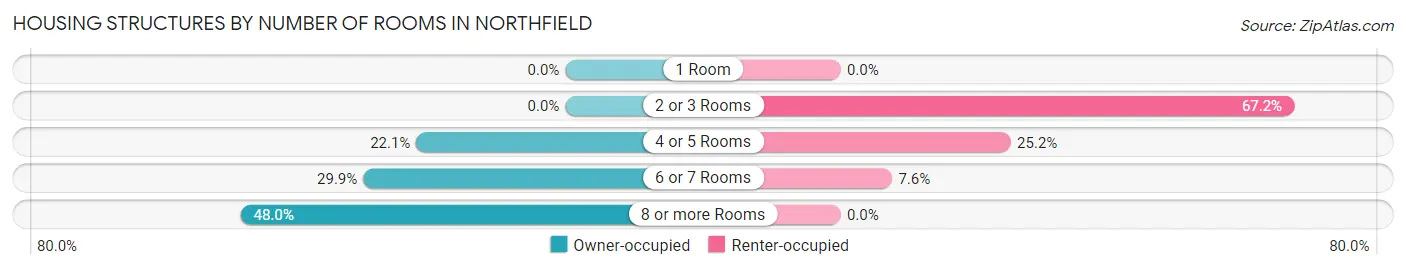
| Number of Rooms | Owner-occupied | Renter-occupied |
| 1 Room | 0 (0.0%) | 0 (0.0%) |
| 2 or 3 Rooms | 0 (0.0%) | 88 (67.2%) |
| 4 or 5 Rooms | 73 (22.1%) | 33 (25.2%) |
| 6 or 7 Rooms | 99 (29.9%) | 10 (7.6%) |
| 8 or more Rooms | 159 (48.0%) | 0 (0.0%) |
| Total | 331 (100.0%) | 131 (100.0%) |
Housing Structure by Heating Type in Northfield
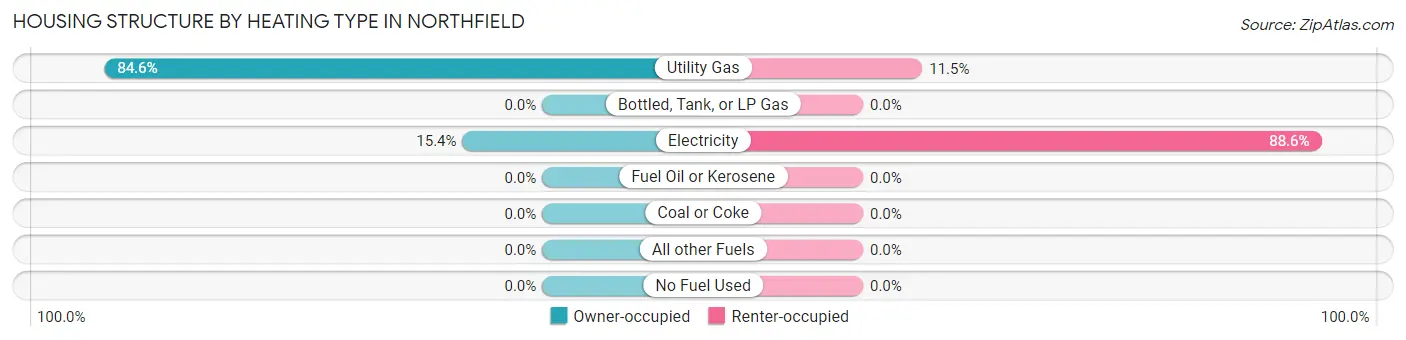
| Heating Type | Owner-occupied | Renter-occupied |
| Utility Gas | 280 (84.6%) | 15 (11.5%) |
| Bottled, Tank, or LP Gas | 0 (0.0%) | 0 (0.0%) |
| Electricity | 51 (15.4%) | 116 (88.5%) |
| Fuel Oil or Kerosene | 0 (0.0%) | 0 (0.0%) |
| Coal or Coke | 0 (0.0%) | 0 (0.0%) |
| All other Fuels | 0 (0.0%) | 0 (0.0%) |
| No Fuel Used | 0 (0.0%) | 0 (0.0%) |
| Total | 331 (100.0%) | 131 (100.0%) |
Household Vehicle Usage in Northfield
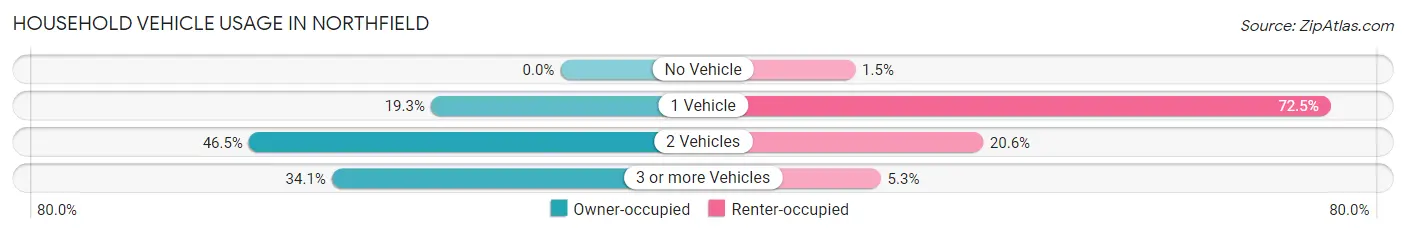
| Vehicles per Household | Owner-occupied | Renter-occupied |
| No Vehicle | 0 (0.0%) | 2 (1.5%) |
| 1 Vehicle | 64 (19.3%) | 95 (72.5%) |
| 2 Vehicles | 154 (46.5%) | 27 (20.6%) |
| 3 or more Vehicles | 113 (34.1%) | 7 (5.3%) |
| Total | 331 (100.0%) | 131 (100.0%) |
Real Estate & Mortgages in Northfield
Real Estate and Mortgage Overview in Northfield
| Characteristic | Without Mortgage | With Mortgage |
| Housing Units | 180 | 151 |
| Median Property Value | $452,500 | $501,800 |
| Median Household Income | $123,220 | $91 |
| Monthly Housing Costs | $856 | $42 |
| Real Estate Taxes | $4,263 | $6 |
Property Value by Mortgage Status in Northfield
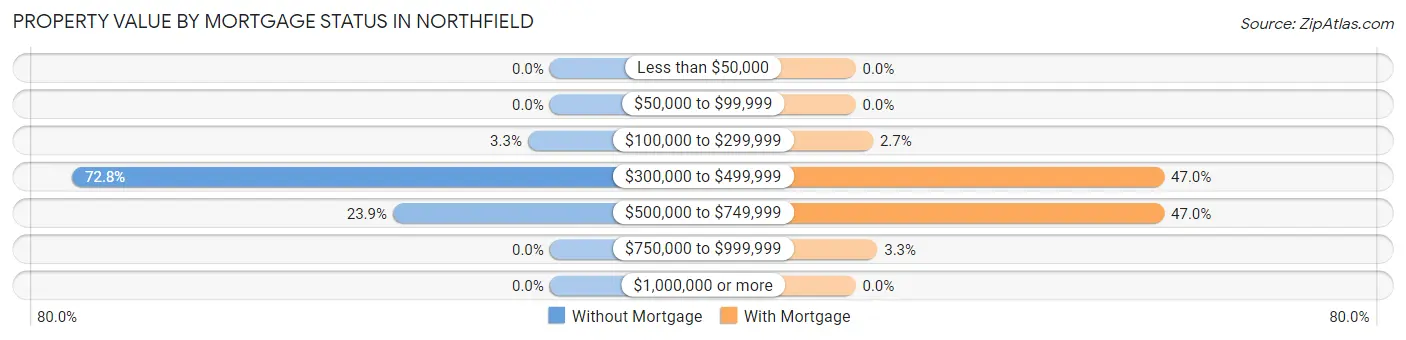
| Property Value | Without Mortgage | With Mortgage |
| Less than $50,000 | 0 (0.0%) | 0 (0.0%) |
| $50,000 to $99,999 | 0 (0.0%) | 0 (0.0%) |
| $100,000 to $299,999 | 6 (3.3%) | 4 (2.6%) |
| $300,000 to $499,999 | 131 (72.8%) | 71 (47.0%) |
| $500,000 to $749,999 | 43 (23.9%) | 71 (47.0%) |
| $750,000 to $999,999 | 0 (0.0%) | 5 (3.3%) |
| $1,000,000 or more | 0 (0.0%) | 0 (0.0%) |
| Total | 180 (100.0%) | 151 (100.0%) |
Household Income by Mortgage Status in Northfield
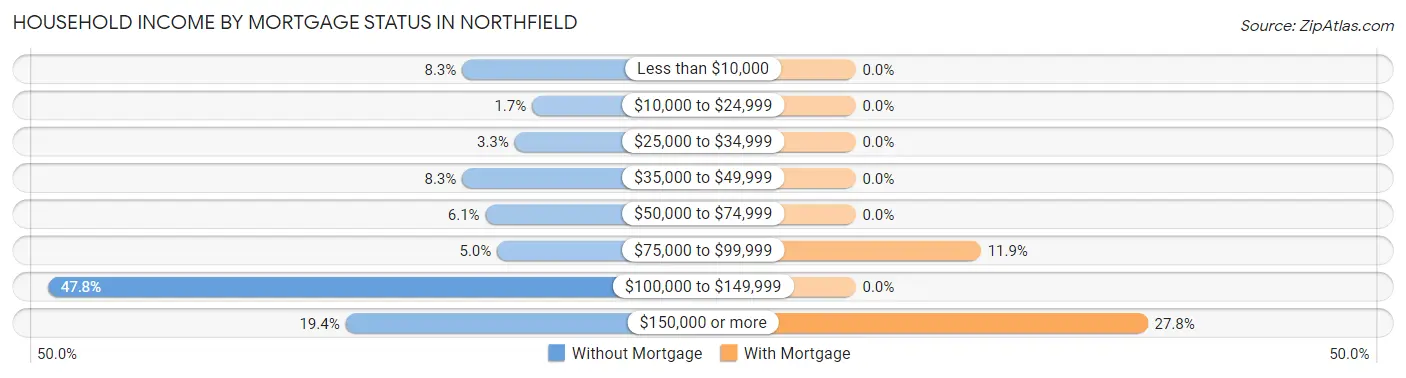
| Household Income | Without Mortgage | With Mortgage |
| Less than $10,000 | 15 (8.3%) | 0 (0.0%) |
| $10,000 to $24,999 | 3 (1.7%) | 0 (0.0%) |
| $25,000 to $34,999 | 6 (3.3%) | 0 (0.0%) |
| $35,000 to $49,999 | 15 (8.3%) | 0 (0.0%) |
| $50,000 to $74,999 | 11 (6.1%) | 0 (0.0%) |
| $75,000 to $99,999 | 9 (5.0%) | 18 (11.9%) |
| $100,000 to $149,999 | 86 (47.8%) | 0 (0.0%) |
| $150,000 or more | 35 (19.4%) | 42 (27.8%) |
| Total | 180 (100.0%) | 151 (100.0%) |
Property Value to Household Income Ratio in Northfield
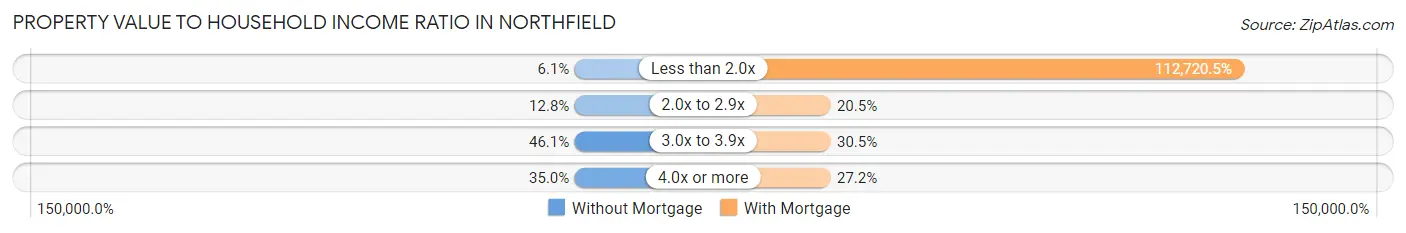
| Value-to-Income Ratio | Without Mortgage | With Mortgage |
| Less than 2.0x | 11 (6.1%) | 170,208 (112,720.5%) |
| 2.0x to 2.9x | 23 (12.8%) | 31 (20.5%) |
| 3.0x to 3.9x | 83 (46.1%) | 46 (30.5%) |
| 4.0x or more | 63 (35.0%) | 41 (27.2%) |
| Total | 180 (100.0%) | 151 (100.0%) |
Real Estate Taxes by Mortgage Status in Northfield
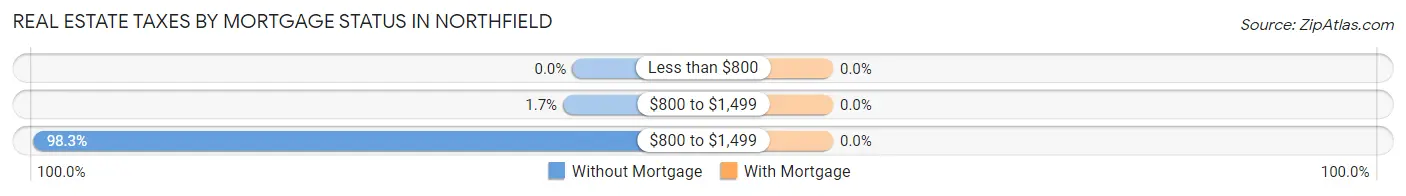
| Property Taxes | Without Mortgage | With Mortgage |
| Less than $800 | 0 (0.0%) | 0 (0.0%) |
| $800 to $1,499 | 3 (1.7%) | 0 (0.0%) |
| $800 to $1,499 | 177 (98.3%) | 0 (0.0%) |
| Total | 180 (100.0%) | 151 (100.0%) |
Health & Disability in Northfield
Health Insurance Coverage by Age in Northfield
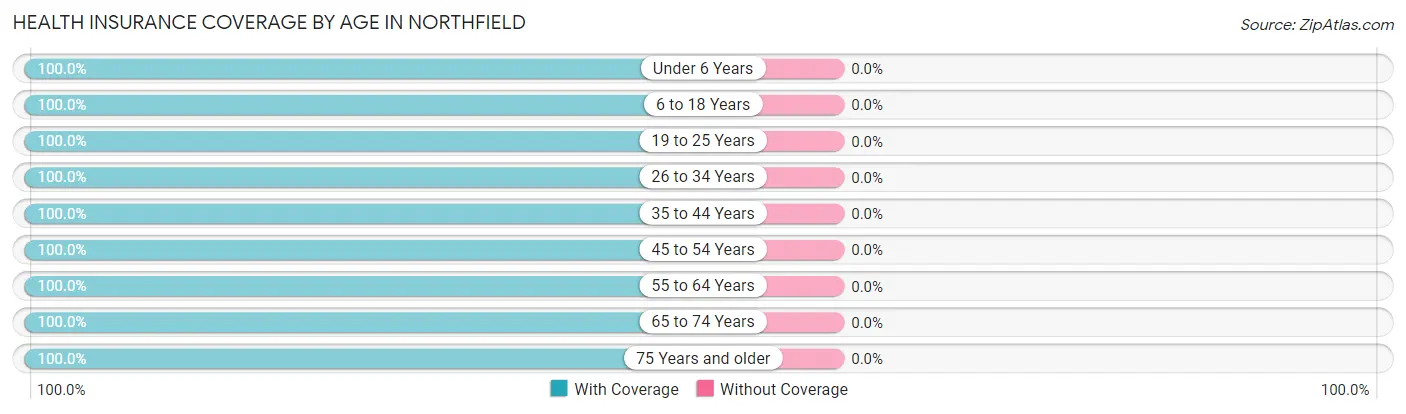
| Age Bracket | With Coverage | Without Coverage |
| Under 6 Years | 102 (100.0%) | 0 (0.0%) |
| 6 to 18 Years | 148 (100.0%) | 0 (0.0%) |
| 19 to 25 Years | 42 (100.0%) | 0 (0.0%) |
| 26 to 34 Years | 73 (100.0%) | 0 (0.0%) |
| 35 to 44 Years | 108 (100.0%) | 0 (0.0%) |
| 45 to 54 Years | 173 (100.0%) | 0 (0.0%) |
| 55 to 64 Years | 201 (100.0%) | 0 (0.0%) |
| 65 to 74 Years | 74 (100.0%) | 0 (0.0%) |
| 75 Years and older | 124 (100.0%) | 0 (0.0%) |
| Total | 1,045 (100.0%) | 0 (0.0%) |
Health Insurance Coverage by Citizenship Status in Northfield
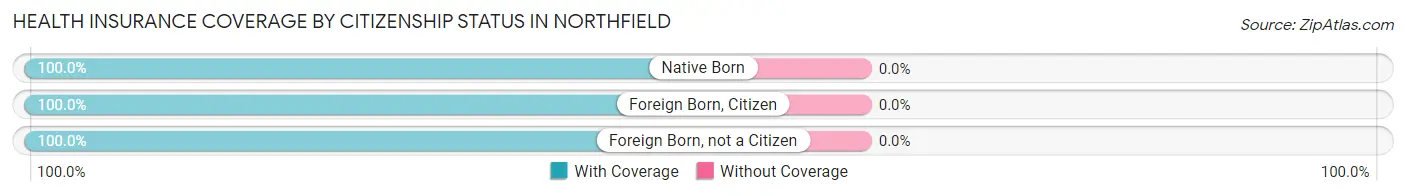
| Citizenship Status | With Coverage | Without Coverage |
| Native Born | 102 (100.0%) | 0 (0.0%) |
| Foreign Born, Citizen | 148 (100.0%) | 0 (0.0%) |
| Foreign Born, not a Citizen | 42 (100.0%) | 0 (0.0%) |
Health Insurance Coverage by Household Income in Northfield
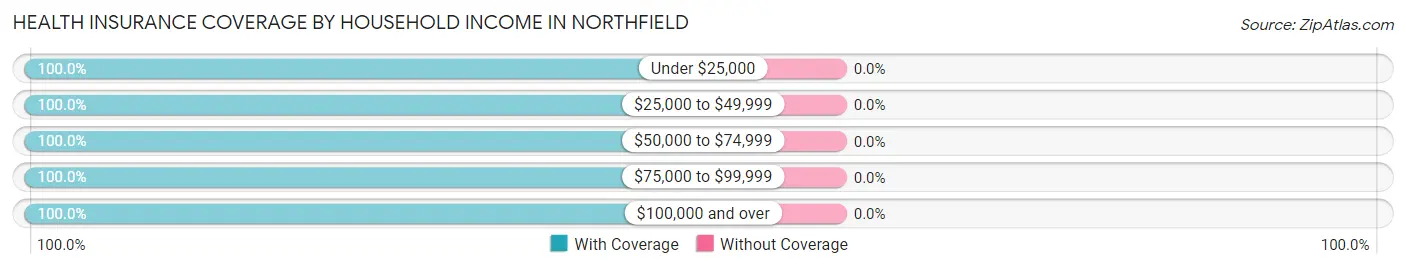
| Household Income | With Coverage | Without Coverage |
| Under $25,000 | 40 (100.0%) | 0 (0.0%) |
| $25,000 to $49,999 | 79 (100.0%) | 0 (0.0%) |
| $50,000 to $74,999 | 125 (100.0%) | 0 (0.0%) |
| $75,000 to $99,999 | 35 (100.0%) | 0 (0.0%) |
| $100,000 and over | 766 (100.0%) | 0 (0.0%) |
Public vs Private Health Insurance Coverage by Age in Northfield
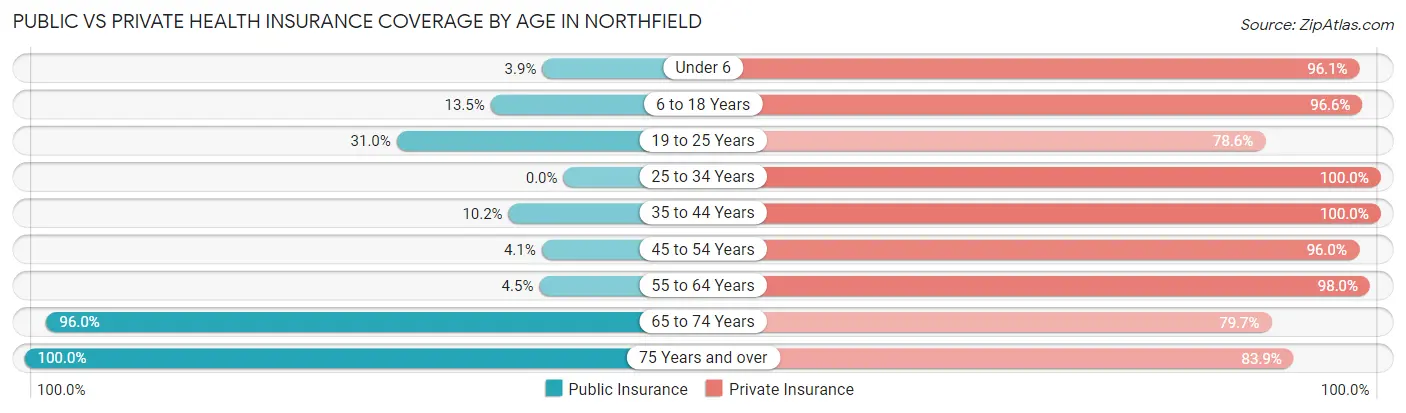
| Age Bracket | Public Insurance | Private Insurance |
| Under 6 | 4 (3.9%) | 98 (96.1%) |
| 6 to 18 Years | 20 (13.5%) | 143 (96.6%) |
| 19 to 25 Years | 13 (30.9%) | 33 (78.6%) |
| 25 to 34 Years | 0 (0.0%) | 73 (100.0%) |
| 35 to 44 Years | 11 (10.2%) | 108 (100.0%) |
| 45 to 54 Years | 7 (4.1%) | 166 (96.0%) |
| 55 to 64 Years | 9 (4.5%) | 197 (98.0%) |
| 65 to 74 Years | 71 (96.0%) | 59 (79.7%) |
| 75 Years and over | 124 (100.0%) | 104 (83.9%) |
| Total | 259 (24.8%) | 981 (93.9%) |
Disability Status by Sex by Age in Northfield
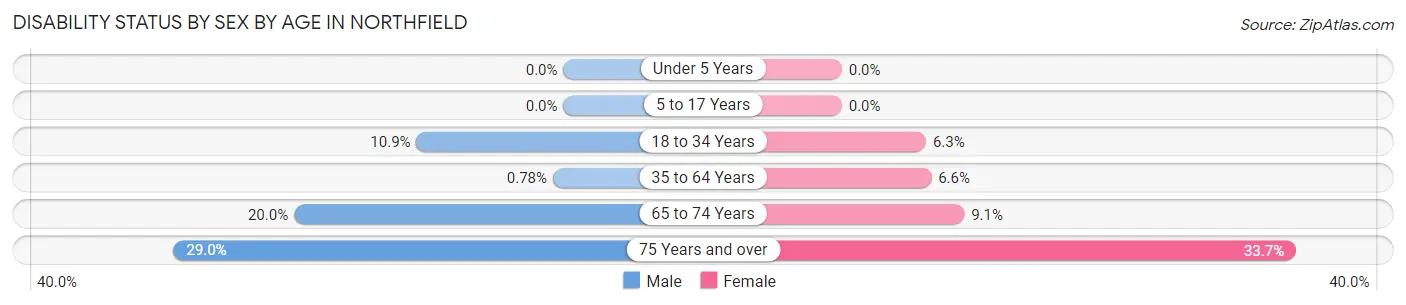
| Age Bracket | Male | Female |
| Under 5 Years | 0 (0.0%) | 0 (0.0%) |
| 5 to 17 Years | 0 (0.0%) | 0 (0.0%) |
| 18 to 34 Years | 6 (10.9%) | 4 (6.2%) |
| 35 to 64 Years | 2 (0.8%) | 15 (6.6%) |
| 65 to 74 Years | 6 (20.0%) | 4 (9.1%) |
| 75 Years and over | 11 (28.9%) | 29 (33.7%) |
Disability Class by Sex by Age in Northfield
Disability Class: Hearing Difficulty
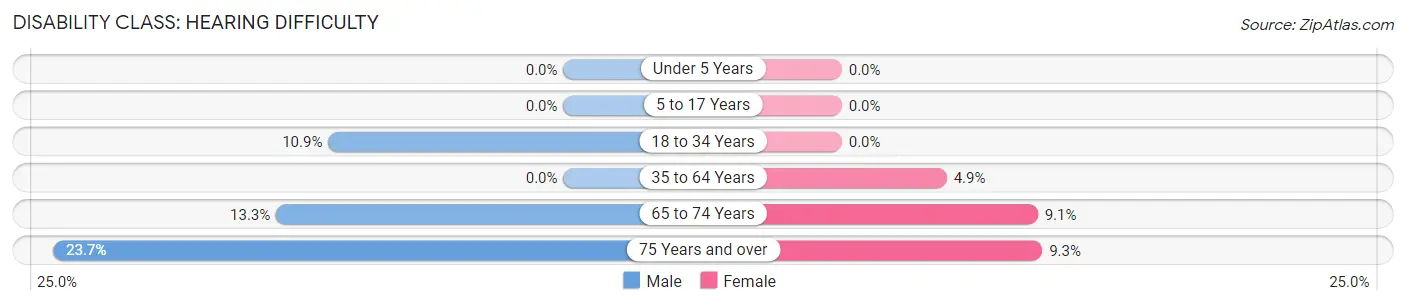
| Age Bracket | Male | Female |
| Under 5 Years | 0 (0.0%) | 0 (0.0%) |
| 5 to 17 Years | 0 (0.0%) | 0 (0.0%) |
| 18 to 34 Years | 6 (10.9%) | 0 (0.0%) |
| 35 to 64 Years | 0 (0.0%) | 11 (4.9%) |
| 65 to 74 Years | 4 (13.3%) | 4 (9.1%) |
| 75 Years and over | 9 (23.7%) | 8 (9.3%) |
Disability Class: Vision Difficulty
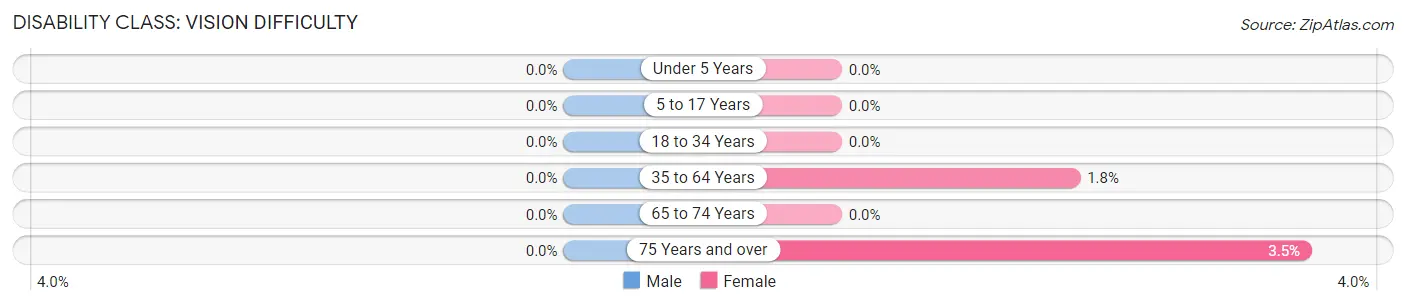
| Age Bracket | Male | Female |
| Under 5 Years | 0 (0.0%) | 0 (0.0%) |
| 5 to 17 Years | 0 (0.0%) | 0 (0.0%) |
| 18 to 34 Years | 0 (0.0%) | 0 (0.0%) |
| 35 to 64 Years | 0 (0.0%) | 4 (1.8%) |
| 65 to 74 Years | 0 (0.0%) | 0 (0.0%) |
| 75 Years and over | 0 (0.0%) | 3 (3.5%) |
Disability Class: Cognitive Difficulty
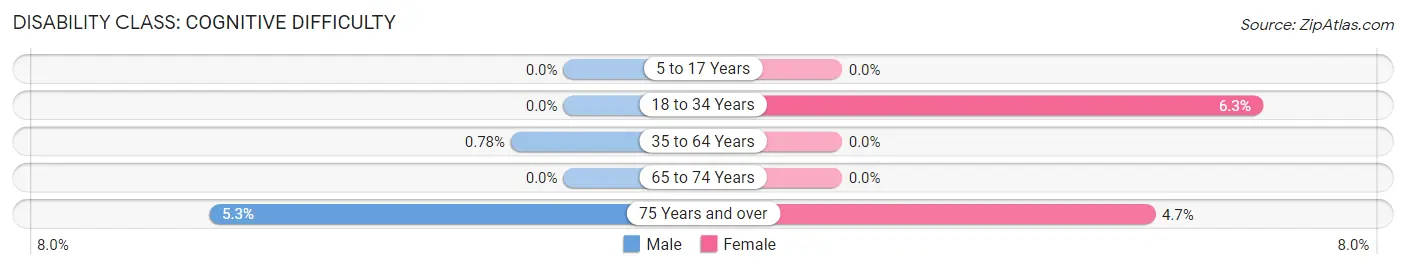
| Age Bracket | Male | Female |
| 5 to 17 Years | 0 (0.0%) | 0 (0.0%) |
| 18 to 34 Years | 0 (0.0%) | 4 (6.2%) |
| 35 to 64 Years | 2 (0.8%) | 0 (0.0%) |
| 65 to 74 Years | 0 (0.0%) | 0 (0.0%) |
| 75 Years and over | 2 (5.3%) | 4 (4.6%) |
Disability Class: Ambulatory Difficulty
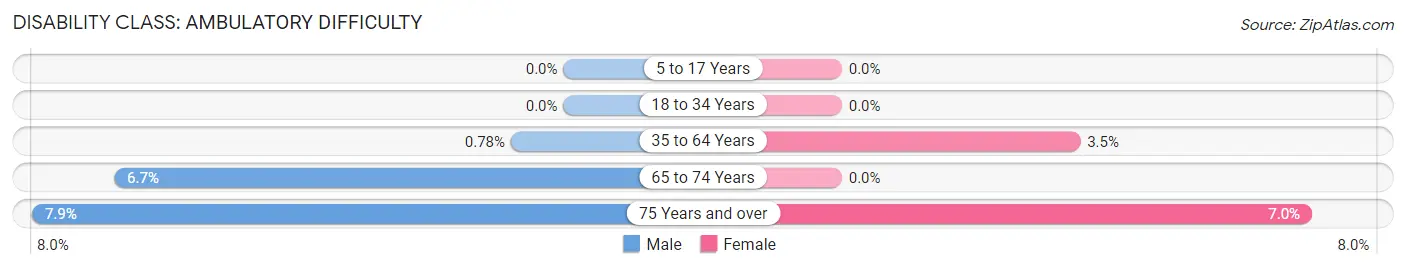
| Age Bracket | Male | Female |
| 5 to 17 Years | 0 (0.0%) | 0 (0.0%) |
| 18 to 34 Years | 0 (0.0%) | 0 (0.0%) |
| 35 to 64 Years | 2 (0.8%) | 8 (3.5%) |
| 65 to 74 Years | 2 (6.7%) | 0 (0.0%) |
| 75 Years and over | 3 (7.9%) | 6 (7.0%) |
Disability Class: Self-Care Difficulty
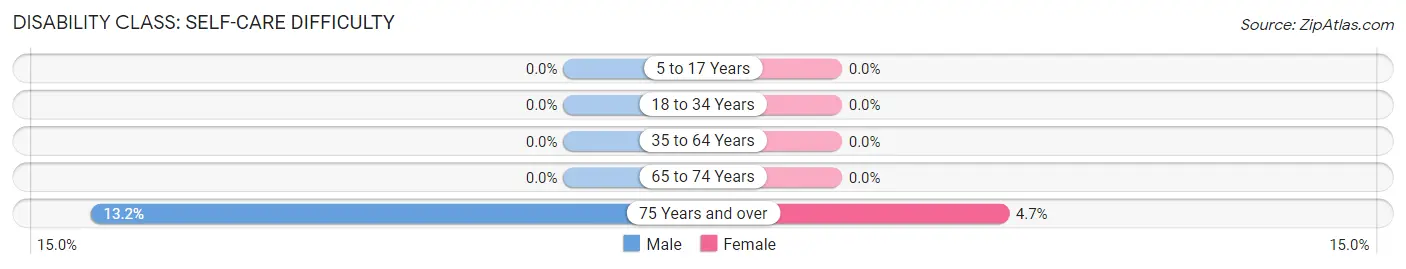
| Age Bracket | Male | Female |
| 5 to 17 Years | 0 (0.0%) | 0 (0.0%) |
| 18 to 34 Years | 0 (0.0%) | 0 (0.0%) |
| 35 to 64 Years | 0 (0.0%) | 0 (0.0%) |
| 65 to 74 Years | 0 (0.0%) | 0 (0.0%) |
| 75 Years and over | 5 (13.2%) | 4 (4.6%) |
Technology Access in Northfield
Computing Device Access in Northfield
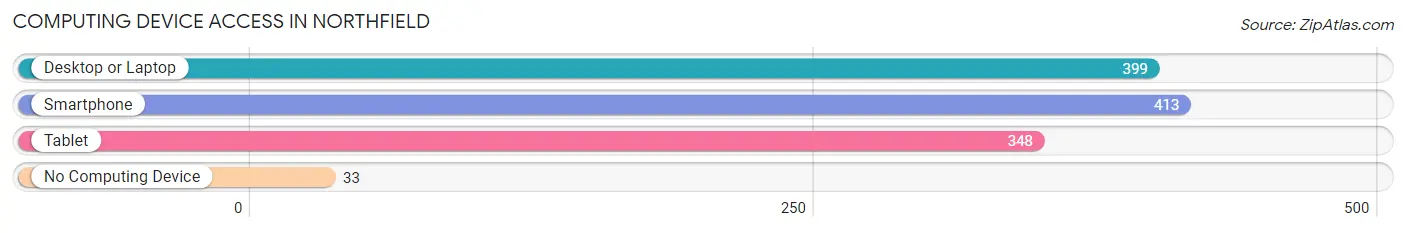
| Device Type | # Households | % Households |
| Desktop or Laptop | 399 | 86.4% |
| Smartphone | 413 | 89.4% |
| Tablet | 348 | 75.3% |
| No Computing Device | 33 | 7.1% |
| Total | 462 | 100.0% |
Internet Access in Northfield
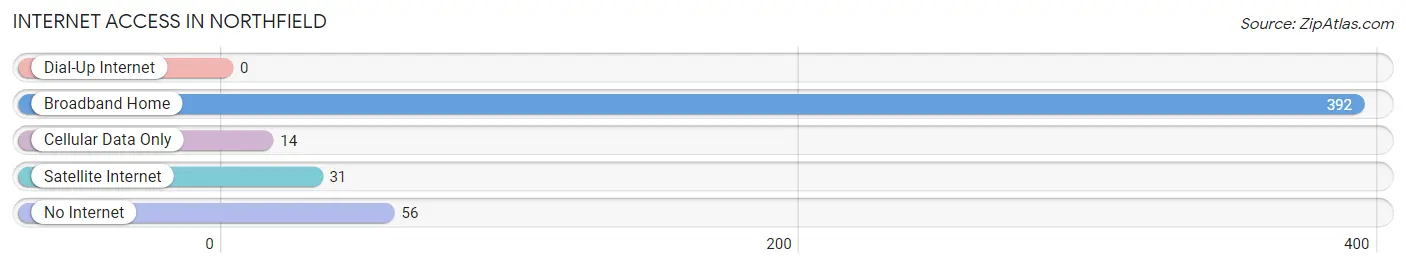
| Internet Type | # Households | % Households |
| Dial-Up Internet | 0 | 0.0% |
| Broadband Home | 392 | 84.9% |
| Cellular Data Only | 14 | 3.0% |
| Satellite Internet | 31 | 6.7% |
| No Internet | 56 | 12.1% |
| Total | 462 | 100.0% |
Northfield Summary
Northfield, Kentucky is a small unincorporated community located in the western part of the state, in the county of Warren. It is situated on the banks of the Green River, and is part of the Bowling Green metropolitan area. The population of Northfield was estimated to be around 1,000 in 2020.
History
Northfield was first settled in the early 1800s by a group of settlers from North Carolina. The town was originally known as North Carolina, but the name was changed to Northfield in 1820. The town was incorporated in 1825 and was the first town in Warren County to be incorporated.
The town was a major stop on the Louisville and Nashville Railroad, which ran through the town from 1859 to 1971. The railroad was a major factor in the growth of the town, as it allowed for the transportation of goods and people to and from the town.
Geography
Northfield is located in western Kentucky, in the county of Warren. It is situated on the banks of the Green River, and is part of the Bowling Green metropolitan area. The town is located about 25 miles south of Bowling Green and about 50 miles north of Nashville, Tennessee.
The town is located in a rural area, and is surrounded by rolling hills and farmland. The town is located in a humid subtropical climate zone, and experiences hot summers and mild winters.
Economy
The economy of Northfield is largely based on agriculture and tourism. The town is home to several farms, which produce a variety of crops, including corn, soybeans, and wheat. The town is also home to several tourist attractions, including the Northfield Historical Museum, the Northfield Country Club, and the Northfield Golf Course.
The town is also home to several small businesses, including restaurants, retail stores, and service providers. The town is also home to several manufacturing companies, which produce a variety of products, including furniture, clothing, and automotive parts.
Demographics
The population of Northfield was estimated to be around 1,000 in 2020. The town is predominantly white, with about 95% of the population being white. The town is also home to a small Hispanic population, which makes up about 3% of the population. The town is also home to a small African American population, which makes up about 2% of the population.
The median household income in Northfield is around $45,000, and the median home value is around $150,000. The town has a low unemployment rate, and the poverty rate is around 10%.
Conclusion
Northfield, Kentucky is a small unincorporated community located in the western part of the state, in the county of Warren. It is situated on the banks of the Green River, and is part of the Bowling Green metropolitan area. The town is predominantly white, with about 95% of the population being white. The economy of Northfield is largely based on agriculture and tourism, and the town is home to several small businesses, including restaurants, retail stores, and service providers. The median household income in Northfield is around $45,000, and the median home value is around $150,000.
Common Questions
What is the Total Population of Northfield?
Total Population of Northfield is 1,106.
What is the Total Male Population of Northfield?
Total Male Population of Northfield is 573.
What is the Total Female Population of Northfield?
Total Female Population of Northfield is 533.
What is the Ratio of Males per 100 Females in Northfield?
There are 107.50 Males per 100 Females in Northfield.
What is the Ratio of Females per 100 Males in Northfield?
There are 93.02 Females per 100 Males in Northfield.
What is the Median Population Age in Northfield?
Median Population Age in Northfield is 51.2 Years.
What is the Average Family Size in Northfield
Average Family Size in Northfield is 2.9 People.
What is the Average Household Size in Northfield
Average Household Size in Northfield is 2.3 People.
What is Per Capita Income in Northfield?
Per Capita income in Northfield is $65,200.
What is the Median Family Income in Northfield?
Median Family Income in Northfield is $124,716.
What is the Median Household income in Northfield?
Median Household Income in Northfield is $121,429.
What is Income or Wage Gap in Northfield?
Income or Wage Gap in Northfield is 52.4%.
Women in Northfield earn 47.6 cents for every dollar earned by a man.
What is Inequality or Gini Index in Northfield?
Inequality or Gini Index in Northfield is 0.46.
How Large is the Labor Force in Northfield?
There are 503 People in the Labor Forcein in Northfield.
What is the Percentage of People in the Labor Force in Northfield?
57.4% of People are in the Labor Force in Northfield.
What is the Unemployment Rate in Northfield?
Unemployment Rate in Northfield is 0.8%.