Anchorage, KY
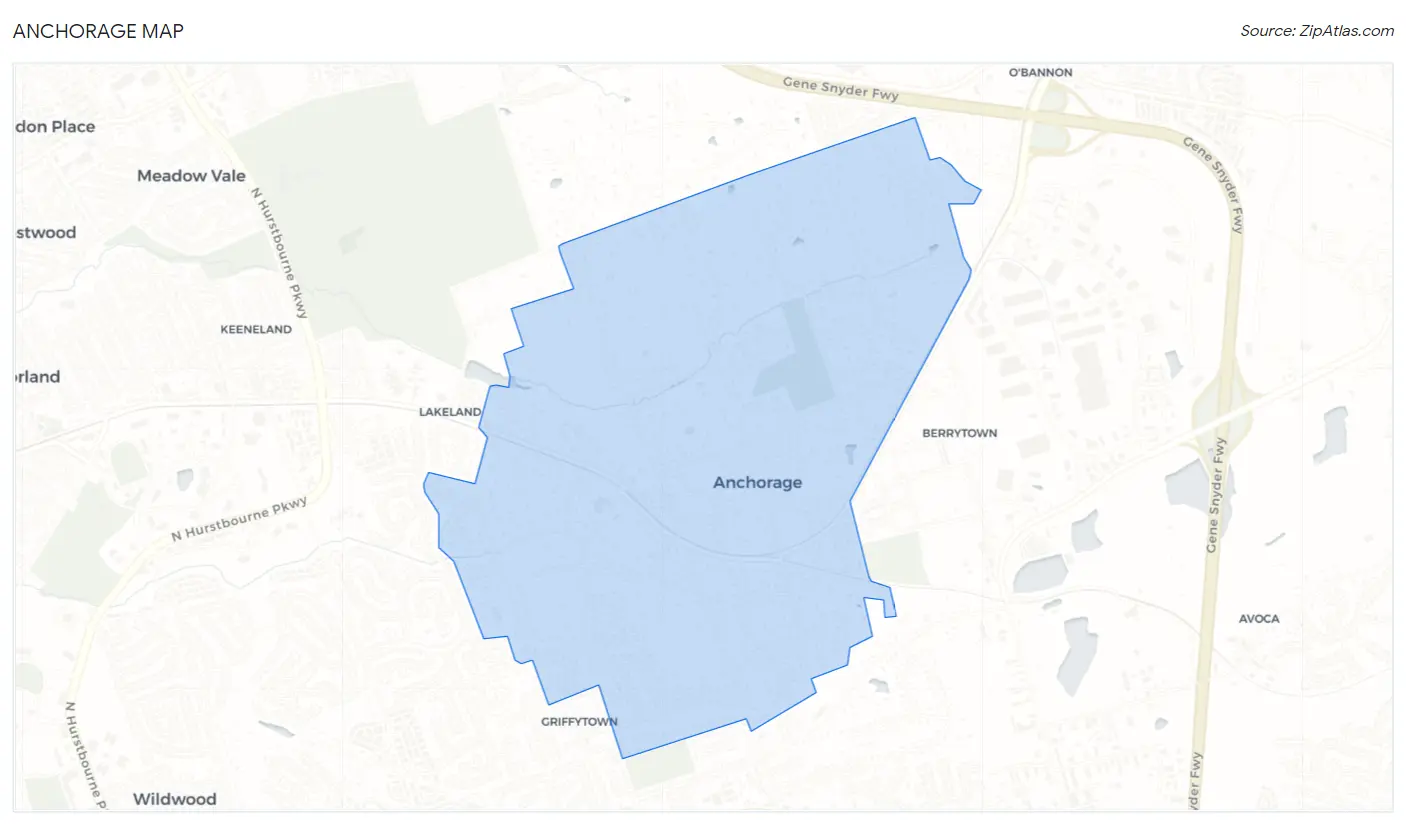
Anchorage Map
Anchorage Overview
2,419
TOTAL POPULATION
1,191
MALE POPULATION
1,228
FEMALE POPULATION
96.99
MALES / 100 FEMALES
103.11
FEMALES / 100 MALES
41.2
MEDIAN AGE
3.3
AVG FAMILY SIZE
3.0
AVG HOUSEHOLD SIZE
$105,317
PER CAPITA INCOME
$250,001
AVG FAMILY INCOME
$202,917
AVG HOUSEHOLD INCOME
37.6%
WAGE / INCOME GAP [ % ]
62.4¢/ $1
WAGE / INCOME GAP [ $ ]
$12,129
FAMILY INCOME DEFICIT
0.54
INEQUALITY / GINI INDEX
1,106
LABOR FORCE [ PEOPLE ]
64.2%
PERCENT IN LABOR FORCE
6.1%
UNEMPLOYMENT RATE
Anchorage Area Codes
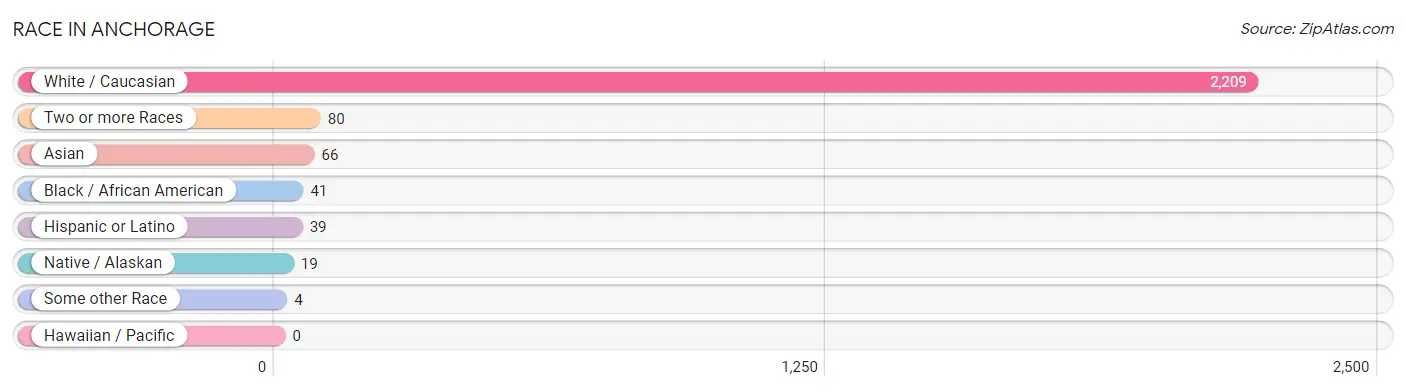
Race in Anchorage
The most populous races in Anchorage are White / Caucasian (2,209 | 91.3%), Two or more Races (80 | 3.3%), and Asian (66 | 2.7%).
| Race | # Population | % Population |
| Asian | 66 | 2.7% |
| Black / African American | 41 | 1.7% |
| Hawaiian / Pacific | 0 | 0.0% |
| Hispanic or Latino | 39 | 1.6% |
| Native / Alaskan | 19 | 0.8% |
| White / Caucasian | 2,209 | 91.3% |
| Two or more Races | 80 | 3.3% |
| Some other Race | 4 | 0.2% |
| Total | 2,419 | 100.0% |
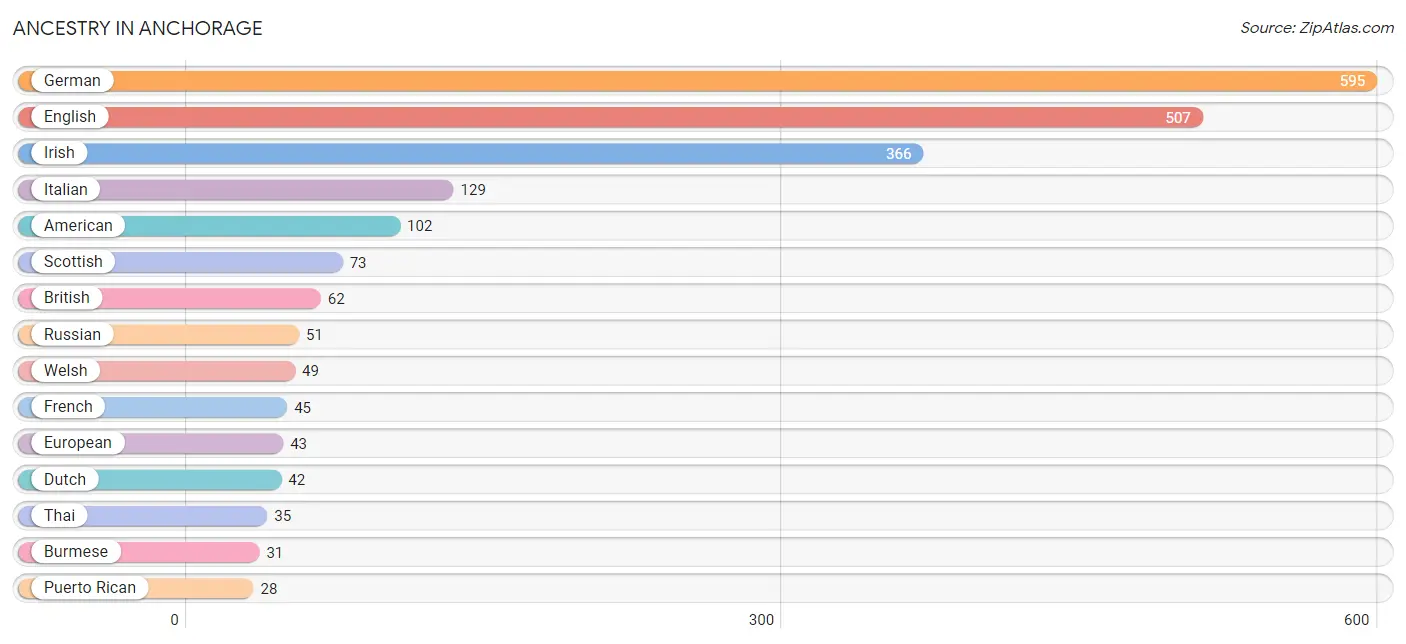
Ancestry in Anchorage
The most populous ancestries reported in Anchorage are German (595 | 24.6%), English (507 | 21.0%), Irish (366 | 15.1%), Italian (129 | 5.3%), and American (102 | 4.2%), together accounting for 70.2% of all Anchorage residents.
| Ancestry | # Population | % Population |
| American | 102 | 4.2% |
| Arab | 7 | 0.3% |
| Austrian | 13 | 0.5% |
| Bhutanese | 22 | 0.9% |
| Brazilian | 8 | 0.3% |
| British | 62 | 2.6% |
| Burmese | 31 | 1.3% |
| Canadian | 10 | 0.4% |
| Central American | 1 | 0.0% |
| Central American Indian | 1 | 0.0% |
| Cherokee | 4 | 0.2% |
| Czechoslovakian | 19 | 0.8% |
| Danish | 6 | 0.3% |
| Dutch | 42 | 1.7% |
| Eastern European | 17 | 0.7% |
| English | 507 | 21.0% |
| European | 43 | 1.8% |
| French | 45 | 1.9% |
| German | 595 | 24.6% |
| Greek | 15 | 0.6% |
| Guatemalan | 1 | 0.0% |
| Hungarian | 2 | 0.1% |
| Indian (Asian) | 8 | 0.3% |
| Irish | 366 | 15.1% |
| Italian | 129 | 5.3% |
| Korean | 17 | 0.7% |
| Mexican | 10 | 0.4% |
| Mexican American Indian | 10 | 0.4% |
| Norwegian | 20 | 0.8% |
| Pennsylvania German | 4 | 0.2% |
| Polish | 10 | 0.4% |
| Puerto Rican | 28 | 1.2% |
| Romanian | 5 | 0.2% |
| Russian | 51 | 2.1% |
| Scandinavian | 13 | 0.5% |
| Scotch-Irish | 25 | 1.0% |
| Scottish | 73 | 3.0% |
| Slavic | 2 | 0.1% |
| Slovak | 2 | 0.1% |
| Swedish | 2 | 0.1% |
| Swiss | 6 | 0.3% |
| Thai | 35 | 1.5% |
| Turkish | 3 | 0.1% |
| Welsh | 49 | 2.0% | View All 44 Rows |
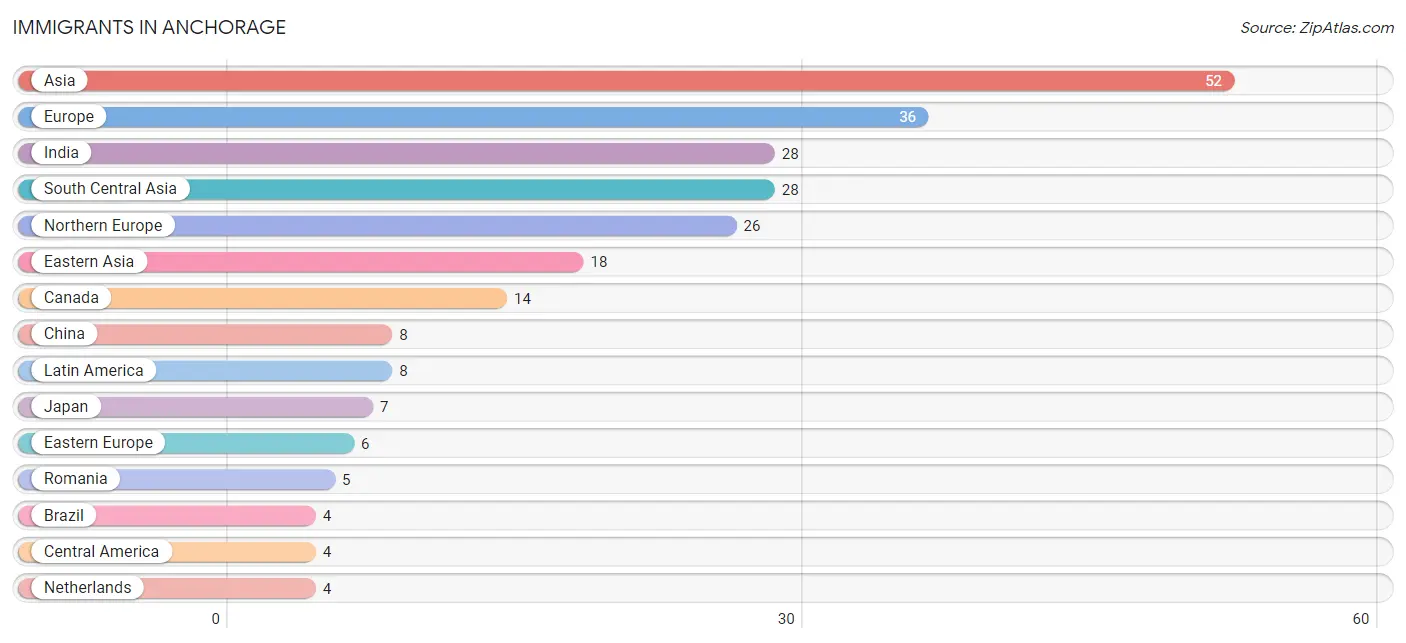
Immigrants in Anchorage
The most numerous immigrant groups reported in Anchorage came from Asia (52 | 2.1%), Europe (36 | 1.5%), India (28 | 1.2%), South Central Asia (28 | 1.2%), and Northern Europe (26 | 1.1%), together accounting for 7.0% of all Anchorage residents.
| Immigration Origin | # Population | % Population |
| Asia | 52 | 2.1% |
| Brazil | 4 | 0.2% |
| Canada | 14 | 0.6% |
| Central America | 4 | 0.2% |
| China | 8 | 0.3% |
| Eastern Asia | 18 | 0.7% |
| Eastern Europe | 6 | 0.3% |
| England | 3 | 0.1% |
| Europe | 36 | 1.5% |
| Guatemala | 1 | 0.0% |
| India | 28 | 1.2% |
| Ireland | 3 | 0.1% |
| Japan | 7 | 0.3% |
| Korea | 3 | 0.1% |
| Latin America | 8 | 0.3% |
| Mexico | 3 | 0.1% |
| Netherlands | 4 | 0.2% |
| Northern Europe | 26 | 1.1% |
| Philippines | 3 | 0.1% |
| Romania | 5 | 0.2% |
| Russia | 1 | 0.0% |
| South America | 4 | 0.2% |
| South Central Asia | 28 | 1.2% |
| South Eastern Asia | 3 | 0.1% |
| Turkey | 3 | 0.1% |
| Western Asia | 3 | 0.1% |
| Western Europe | 4 | 0.2% | View All 27 Rows |
Sex and Age in Anchorage
Sex and Age in Anchorage
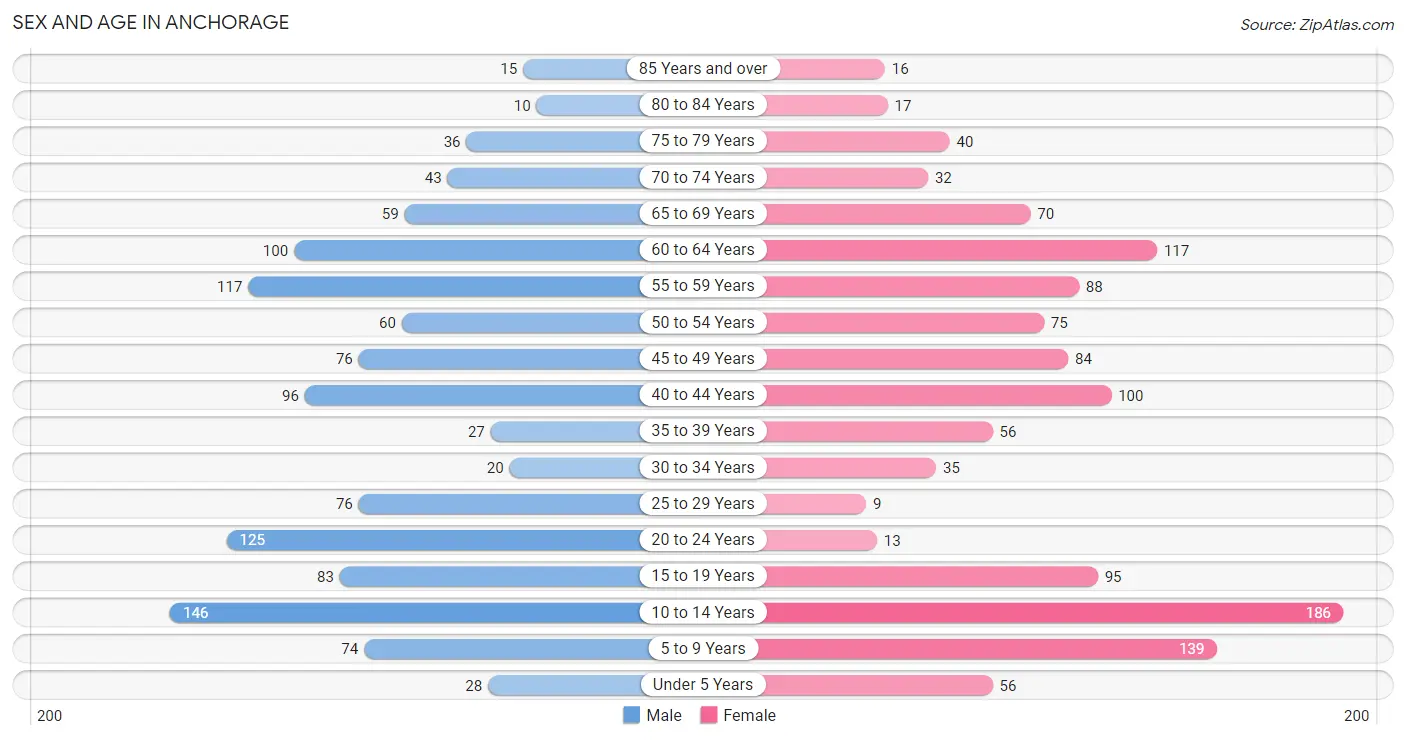
The most populous age groups in Anchorage are 10 to 14 Years (146 | 12.3%) for men and 10 to 14 Years (186 | 15.1%) for women.
| Age Bracket | Male | Female |
| Under 5 Years | 28 (2.4%) | 56 (4.6%) |
| 5 to 9 Years | 74 (6.2%) | 139 (11.3%) |
| 10 to 14 Years | 146 (12.3%) | 186 (15.1%) |
| 15 to 19 Years | 83 (7.0%) | 95 (7.7%) |
| 20 to 24 Years | 125 (10.5%) | 13 (1.1%) |
| 25 to 29 Years | 76 (6.4%) | 9 (0.7%) |
| 30 to 34 Years | 20 (1.7%) | 35 (2.9%) |
| 35 to 39 Years | 27 (2.3%) | 56 (4.6%) |
| 40 to 44 Years | 96 (8.1%) | 100 (8.1%) |
| 45 to 49 Years | 76 (6.4%) | 84 (6.8%) |
| 50 to 54 Years | 60 (5.0%) | 75 (6.1%) |
| 55 to 59 Years | 117 (9.8%) | 88 (7.2%) |
| 60 to 64 Years | 100 (8.4%) | 117 (9.5%) |
| 65 to 69 Years | 59 (5.0%) | 70 (5.7%) |
| 70 to 74 Years | 43 (3.6%) | 32 (2.6%) |
| 75 to 79 Years | 36 (3.0%) | 40 (3.3%) |
| 80 to 84 Years | 10 (0.8%) | 17 (1.4%) |
| 85 Years and over | 15 (1.3%) | 16 (1.3%) |
| Total | 1,191 (100.0%) | 1,228 (100.0%) |
Families and Households in Anchorage
Median Family Size in Anchorage
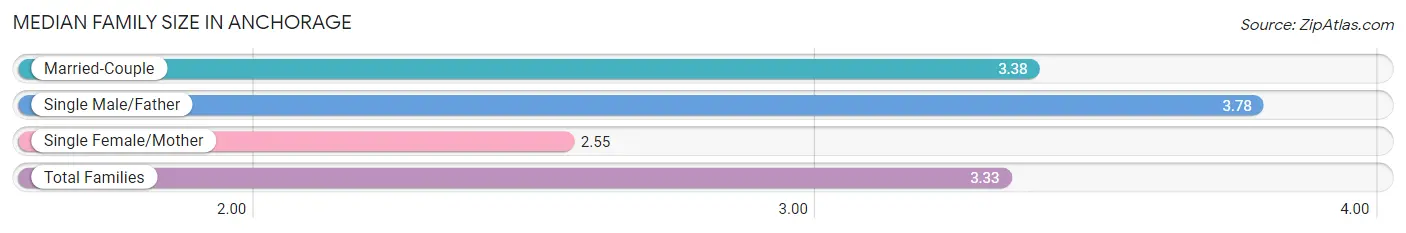
The median family size in Anchorage is 3.33 persons per family, with single male/father families (9 | 1.4%) accounting for the largest median family size of 3.78 persons per family. On the other hand, single female/mother families (44 | 6.7%) represent the smallest median family size with 2.55 persons per family.
| Family Type | # Families | Family Size |
| Married-Couple | 603 (91.9%) | 3.38 |
| Single Male/Father | 9 (1.4%) | 3.78 |
| Single Female/Mother | 44 (6.7%) | 2.55 |
| Total Families | 656 (100.0%) | 3.33 |
Median Household Size in Anchorage
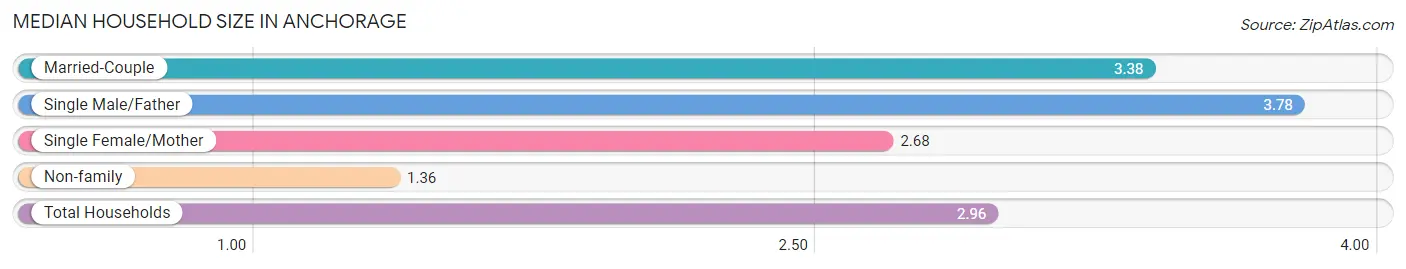
The median household size in Anchorage is 2.96 persons per household, with single male/father households (9 | 1.1%) accounting for the largest median household size of 3.78 persons per household. non-family households (156 | 19.2%) represent the smallest median household size with 1.36 persons per household.
| Household Type | # Households | Household Size |
| Married-Couple | 603 (74.3%) | 3.38 |
| Single Male/Father | 9 (1.1%) | 3.78 |
| Single Female/Mother | 44 (5.4%) | 2.68 |
| Non-family | 156 (19.2%) | 1.36 |
| Total Households | 812 (100.0%) | 2.96 |
Household Size by Marriage Status in Anchorage
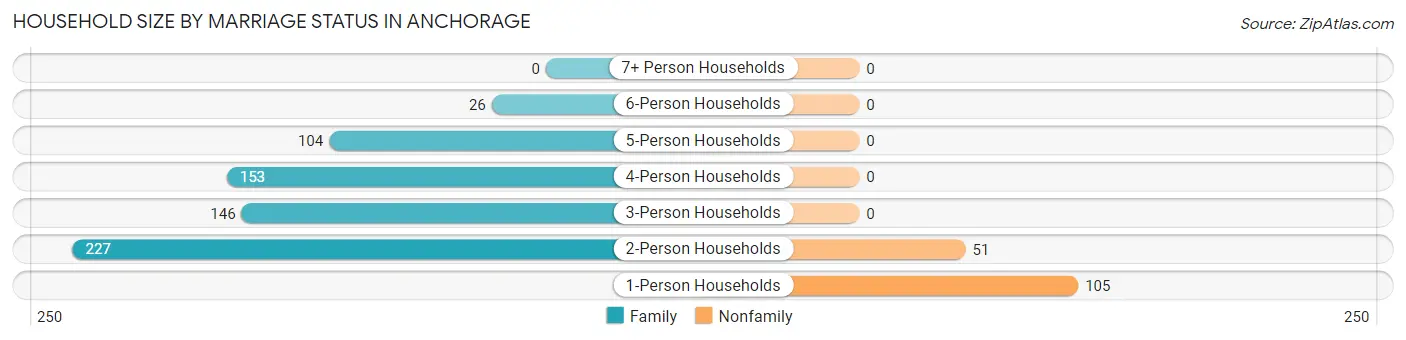
Out of a total of 812 households in Anchorage, 656 (80.8%) are family households, while 156 (19.2%) are nonfamily households. The most numerous type of family households are 2-person households, comprising 227, and the most common type of nonfamily households are 1-person households, comprising 105.
| Household Size | Family Households | Nonfamily Households |
| 1-Person Households | - | 105 (12.9%) |
| 2-Person Households | 227 (28.0%) | 51 (6.3%) |
| 3-Person Households | 146 (18.0%) | 0 (0.0%) |
| 4-Person Households | 153 (18.8%) | 0 (0.0%) |
| 5-Person Households | 104 (12.8%) | 0 (0.0%) |
| 6-Person Households | 26 (3.2%) | 0 (0.0%) |
| 7+ Person Households | 0 (0.0%) | 0 (0.0%) |
| Total | 656 (80.8%) | 156 (19.2%) |
Female Fertility in Anchorage
Fertility by Age in Anchorage
Average fertility rate in Anchorage is 31.0 births per 1,000 women. Women in the age bracket of 20 to 34 years have the highest fertility rate with 105.0 births per 1,000 women. Women in the age bracket of 35 to 50 years acount for 53.8% of all women with births.
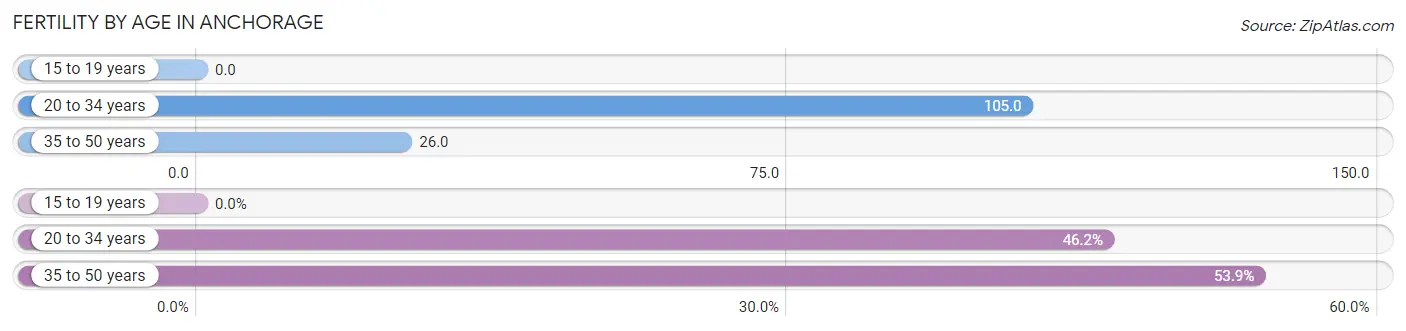
| Age Bracket | Women with Births | Births / 1,000 Women |
| 15 to 19 years | 0 (0.0%) | 0.0 |
| 20 to 34 years | 6 (46.2%) | 105.0 |
| 35 to 50 years | 7 (53.8%) | 26.0 |
| Total | 13 (100.0%) | 31.0 |
Fertility by Age by Marriage Status in Anchorage
76.9% of women with births (13) in Anchorage are married. The highest percentage of unmarried women with births falls into 35 to 50 years age bracket with 42.9% of them unmarried at the time of birth, while the lowest percentage of unmarried women with births belong to 20 to 34 years age bracket with 0.0% of them unmarried.
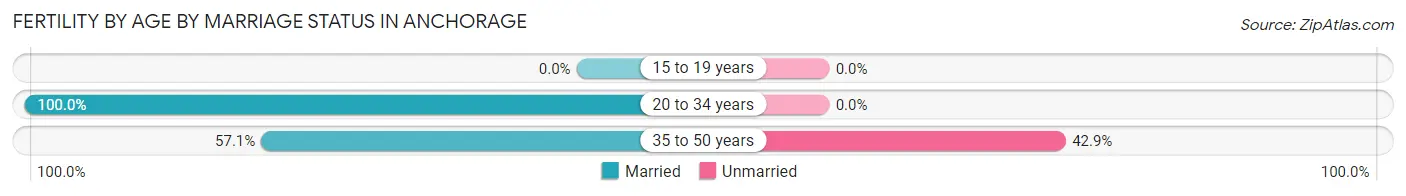
| Age Bracket | Married | Unmarried |
| 15 to 19 years | 0 (0.0%) | 0 (0.0%) |
| 20 to 34 years | 6 (100.0%) | 0 (0.0%) |
| 35 to 50 years | 4 (57.1%) | 3 (42.9%) |
| Total | 10 (76.9%) | 3 (23.1%) |
Fertility by Education in Anchorage
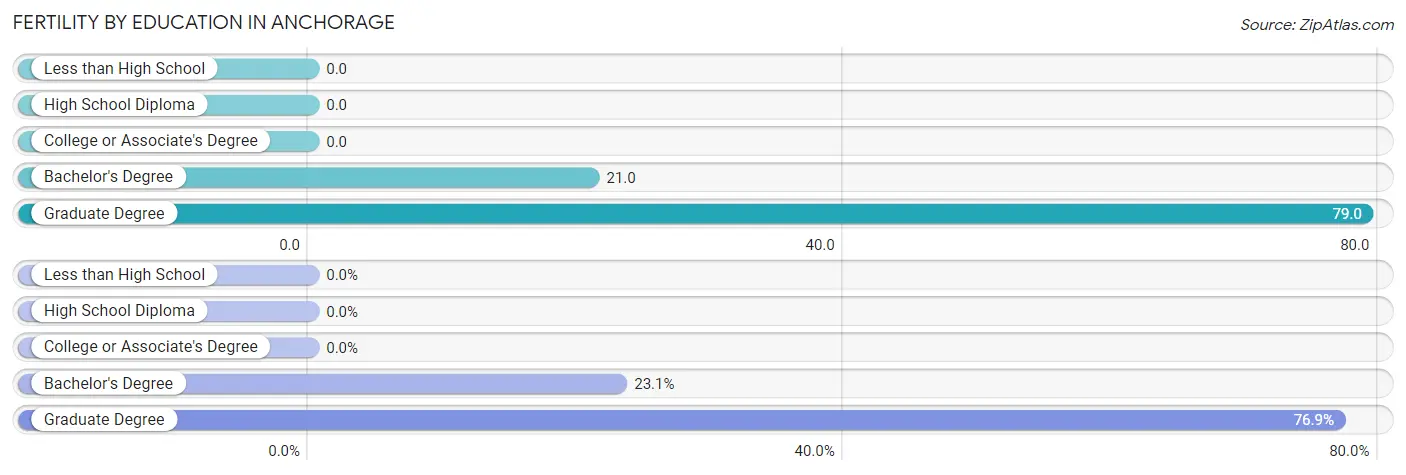
| Educational Attainment | Women with Births | Births / 1,000 Women |
| Less than High School | 0 (0.0%) | 0.0 |
| High School Diploma | 0 (0.0%) | 0.0 |
| College or Associate's Degree | 0 (0.0%) | 0.0 |
| Bachelor's Degree | 3 (23.1%) | 21.0 |
| Graduate Degree | 10 (76.9%) | 79.0 |
| Total | 13 (100.0%) | 31.0 |
Fertility by Education by Marriage Status in Anchorage
23.1% of women with births in Anchorage are unmarried. Women with the educational attainment of bachelor's degree are most likely to be married with 100.0% of them married at childbirth, while women with the educational attainment of graduate degree are least likely to be married with 30.0% of them unmarried at childbirth.
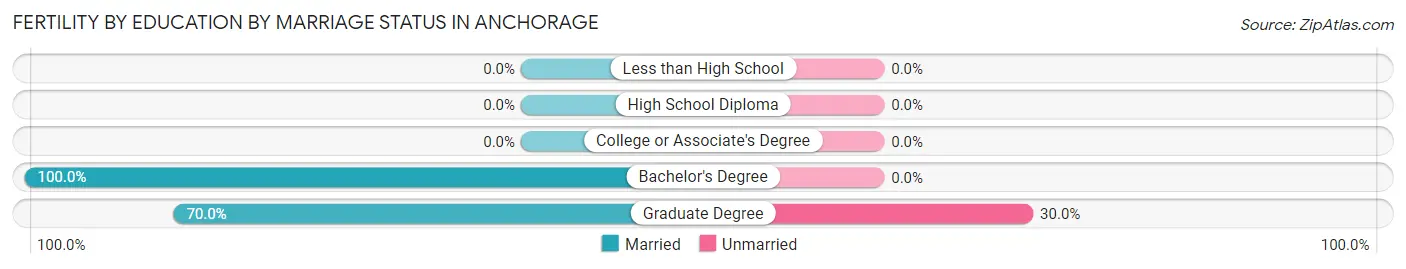
| Educational Attainment | Married | Unmarried |
| Less than High School | 0 (0.0%) | 0 (0.0%) |
| High School Diploma | 0 (0.0%) | 0 (0.0%) |
| College or Associate's Degree | 0 (0.0%) | 0 (0.0%) |
| Bachelor's Degree | 3 (100.0%) | 0 (0.0%) |
| Graduate Degree | 7 (70.0%) | 3 (30.0%) |
| Total | 10 (76.9%) | 3 (23.1%) |
Income in Anchorage
Income Overview in Anchorage
Per Capita Income in Anchorage is $105,317, while median incomes of families and households are $250,001 and $202,917 respectively.
| Characteristic | Number | Measure |
| Per Capita Income | 2,419 | $105,317 |
| Median Family Income | 656 | $250,001 |
| Mean Family Income | 656 | $361,357 |
| Median Household Income | 812 | $202,917 |
| Mean Household Income | 812 | $314,691 |
| Income Deficit | 656 | $12,129 |
| Wage / Income Gap (%) | 2,419 | 37.56% |
| Wage / Income Gap ($) | 2,419 | 62.44¢ per $1 |
| Gini / Inequality Index | 2,419 | 0.54 |
Earnings by Sex in Anchorage
Average Earnings in Anchorage are $93,661, $113,438 for men and $70,833 for women, a difference of 37.6%.
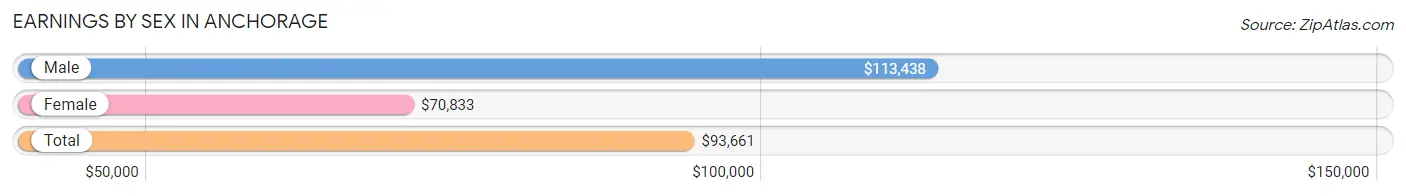
| Sex | Number | Average Earnings |
| Male | 751 (62.3%) | $113,438 |
| Female | 454 (37.7%) | $70,833 |
| Total | 1,205 (100.0%) | $93,661 |
Earnings by Sex by Income Bracket in Anchorage
The most common earnings brackets in Anchorage are $100,000+ for men (396 | 52.7%) and $100,000+ for women (183 | 40.3%).
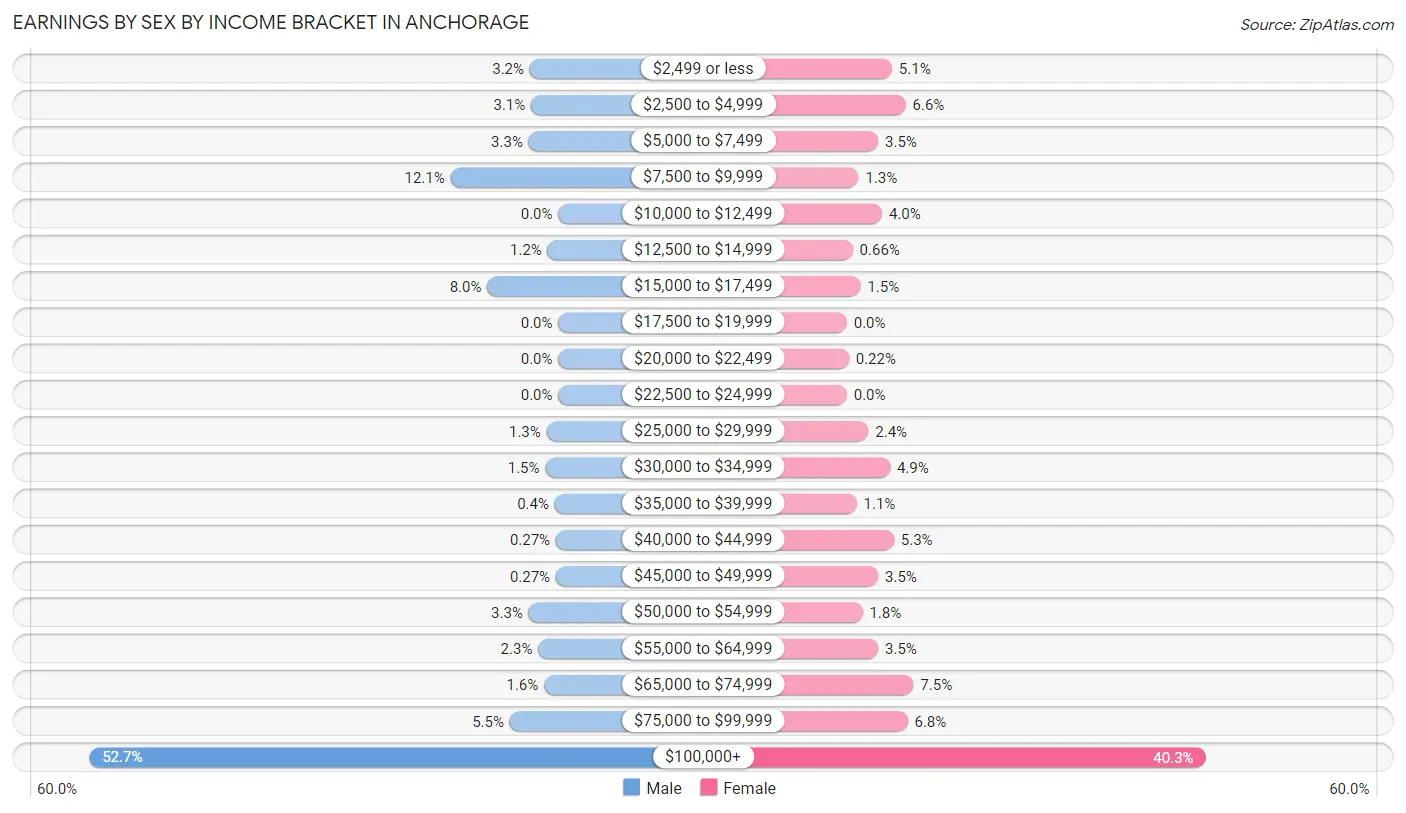
| Income | Male | Female |
| $2,499 or less | 24 (3.2%) | 23 (5.1%) |
| $2,500 to $4,999 | 23 (3.1%) | 30 (6.6%) |
| $5,000 to $7,499 | 25 (3.3%) | 16 (3.5%) |
| $7,500 to $9,999 | 91 (12.1%) | 6 (1.3%) |
| $10,000 to $12,499 | 0 (0.0%) | 18 (4.0%) |
| $12,500 to $14,999 | 9 (1.2%) | 3 (0.7%) |
| $15,000 to $17,499 | 60 (8.0%) | 7 (1.5%) |
| $17,500 to $19,999 | 0 (0.0%) | 0 (0.0%) |
| $20,000 to $22,499 | 0 (0.0%) | 1 (0.2%) |
| $22,500 to $24,999 | 0 (0.0%) | 0 (0.0%) |
| $25,000 to $29,999 | 10 (1.3%) | 11 (2.4%) |
| $30,000 to $34,999 | 11 (1.5%) | 22 (4.9%) |
| $35,000 to $39,999 | 3 (0.4%) | 5 (1.1%) |
| $40,000 to $44,999 | 2 (0.3%) | 24 (5.3%) |
| $45,000 to $49,999 | 2 (0.3%) | 16 (3.5%) |
| $50,000 to $54,999 | 25 (3.3%) | 8 (1.8%) |
| $55,000 to $64,999 | 17 (2.3%) | 16 (3.5%) |
| $65,000 to $74,999 | 12 (1.6%) | 34 (7.5%) |
| $75,000 to $99,999 | 41 (5.5%) | 31 (6.8%) |
| $100,000+ | 396 (52.7%) | 183 (40.3%) |
| Total | 751 (100.0%) | 454 (100.0%) |
Earnings by Sex by Educational Attainment in Anchorage
Average earnings in Anchorage are $160,893 for men and $82,857 for women, a difference of 48.5%. Men with an educational attainment of high school diploma enjoy the highest average annual earnings of $183,250, while those with college or associate's degree education earn the least with $54,444. Women with an educational attainment of graduate degree earn the most with the average annual earnings of $153,375, while those with college or associate's degree education have the smallest earnings of $41,563.
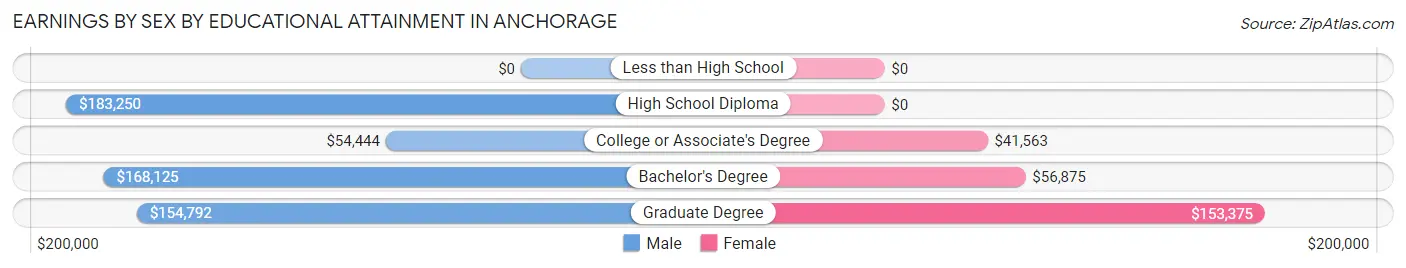
| Educational Attainment | Male Income | Female Income |
| Less than High School | - | - |
| High School Diploma | $183,250 | $0 |
| College or Associate's Degree | $54,444 | $41,563 |
| Bachelor's Degree | $168,125 | $56,875 |
| Graduate Degree | $154,792 | $153,375 |
| Total | $160,893 | $82,857 |
Family Income in Anchorage
Family Income Brackets in Anchorage
According to the Anchorage family income data, there are 388 families falling into the $200,000+ income range, which is the most common income bracket and makes up 59.2% of all families. Conversely, the $10,000 to $14,999 income bracket is the least frequent group with only 2 families (0.3%) belonging to this category.
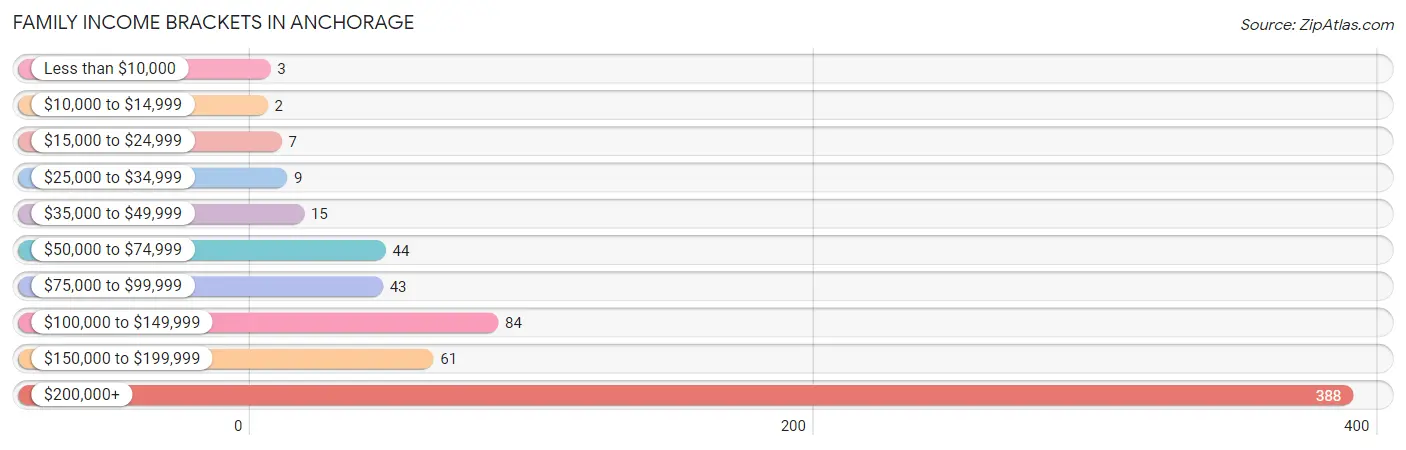
| Income Bracket | # Families | % Families |
| Less than $10,000 | 3 | 0.5% |
| $10,000 to $14,999 | 2 | 0.3% |
| $15,000 to $24,999 | 7 | 1.1% |
| $25,000 to $34,999 | 9 | 1.4% |
| $35,000 to $49,999 | 15 | 2.3% |
| $50,000 to $74,999 | 44 | 6.7% |
| $75,000 to $99,999 | 43 | 6.6% |
| $100,000 to $149,999 | 84 | 12.8% |
| $150,000 to $199,999 | 61 | 9.3% |
| $200,000+ | 388 | 59.1% |
Family Income by Famaliy Size in Anchorage
3-person families (140 | 21.3%) account for the highest median family income in Anchorage with $250,001 per family, while 3-person families (140 | 21.3%) have the highest median income of $83,334 per family member.
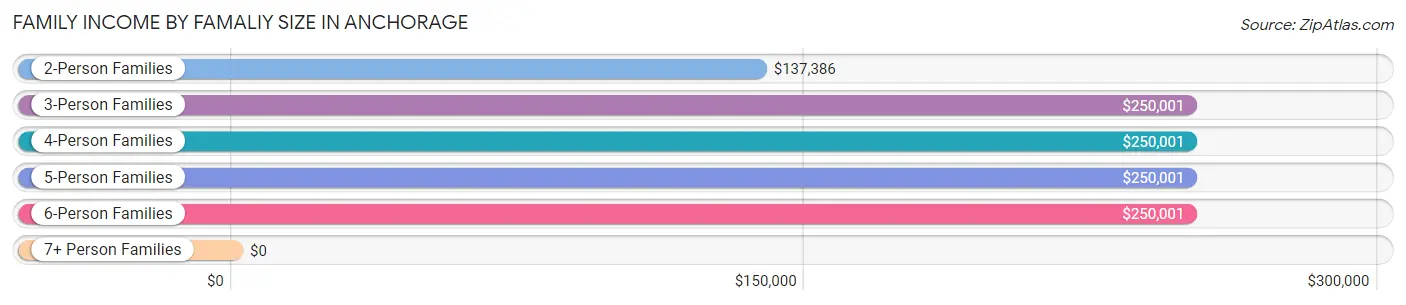
| Income Bracket | # Families | Median Income |
| 2-Person Families | 233 (35.5%) | $137,386 |
| 3-Person Families | 140 (21.3%) | $250,001 |
| 4-Person Families | 153 (23.3%) | $250,001 |
| 5-Person Families | 104 (15.9%) | $250,001 |
| 6-Person Families | 26 (4.0%) | $250,001 |
| 7+ Person Families | 0 (0.0%) | $0 |
| Total | 656 (100.0%) | $250,001 |
Family Income by Number of Earners in Anchorage
The median family income in Anchorage is $250,001, with families comprising 2 earners (267) having the highest median family income of $250,001, while families with no earners (74) have the lowest median family income of $111,667, accounting for 40.7% and 11.3% of families, respectively.
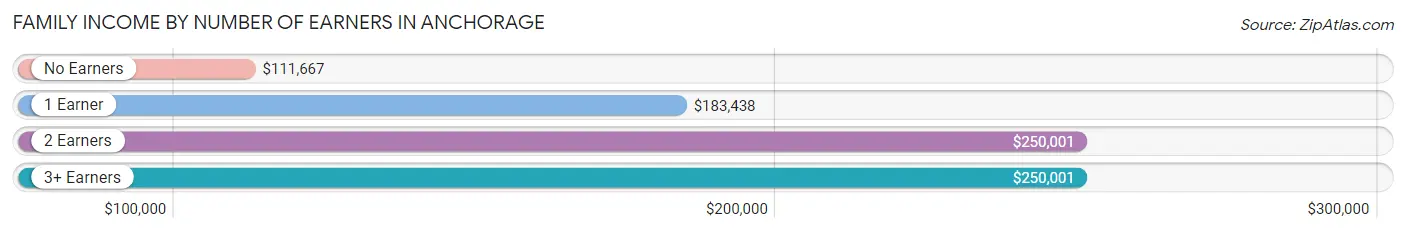
| Number of Earners | # Families | Median Income |
| No Earners | 74 (11.3%) | $111,667 |
| 1 Earner | 213 (32.5%) | $183,438 |
| 2 Earners | 267 (40.7%) | $250,001 |
| 3+ Earners | 102 (15.5%) | $250,001 |
| Total | 656 (100.0%) | $250,001 |
Household Income in Anchorage
Household Income Brackets in Anchorage
With 409 households falling in the category, the $200,000+ income range is the most frequent in Anchorage, accounting for 50.4% of all households. In contrast, only 3 households (0.4%) fall into the less than $10,000 income bracket, making it the least populous group.
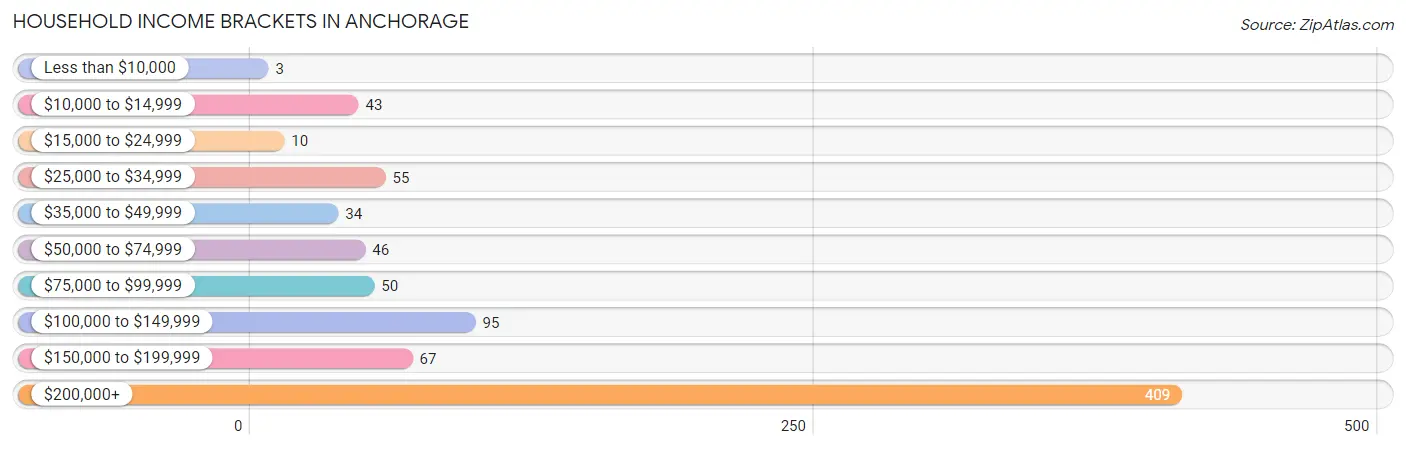
| Income Bracket | # Households | % Households |
| Less than $10,000 | 3 | 0.4% |
| $10,000 to $14,999 | 43 | 5.3% |
| $15,000 to $24,999 | 10 | 1.2% |
| $25,000 to $34,999 | 55 | 6.8% |
| $35,000 to $49,999 | 34 | 4.2% |
| $50,000 to $74,999 | 46 | 5.7% |
| $75,000 to $99,999 | 50 | 6.2% |
| $100,000 to $149,999 | 95 | 11.7% |
| $150,000 to $199,999 | 67 | 8.3% |
| $200,000+ | 409 | 50.4% |
Household Income by Householder Age in Anchorage
The median household income in Anchorage is $202,917, with the highest median household income of $250,001 found in the 45 to 64 years age bracket for the primary householder. A total of 396 households (48.8%) fall into this category. Meanwhile, the 15 to 24 years age bracket for the primary householder has the lowest median household income of $0, with 43 households (5.3%) in this group.
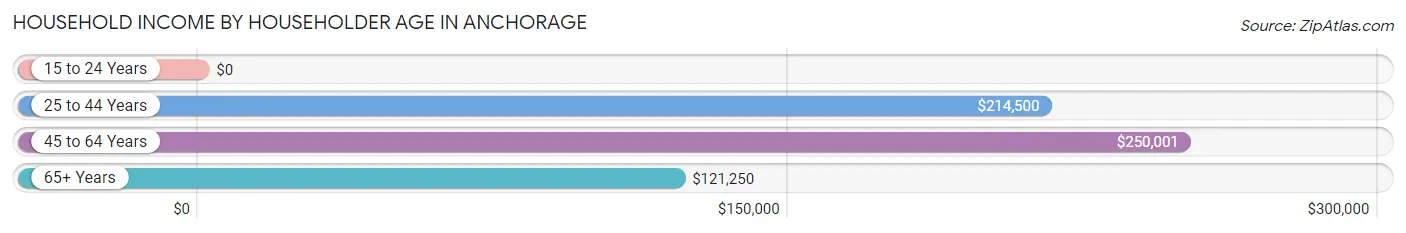
| Income Bracket | # Households | Median Income |
| 15 to 24 Years | 43 (5.3%) | $0 |
| 25 to 44 Years | 176 (21.7%) | $214,500 |
| 45 to 64 Years | 396 (48.8%) | $250,001 |
| 65+ Years | 197 (24.3%) | $121,250 |
| Total | 812 (100.0%) | $202,917 |
Poverty in Anchorage
Income Below Poverty by Sex and Age in Anchorage
With 4.8% poverty level for males and 4.3% for females among the residents of Anchorage, 18 to 24 year old males and 55 to 64 year old females are the most vulnerable to poverty, with 43 males (33.6%) and 44 females (21.5%) in their respective age groups living below the poverty level.
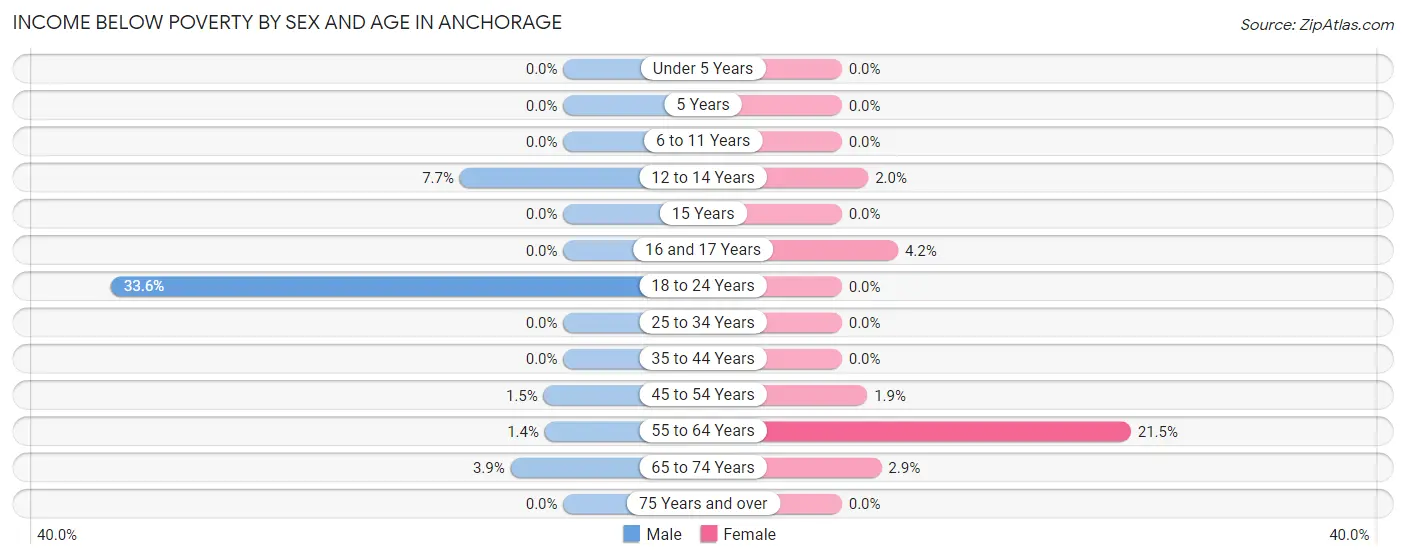
| Age Bracket | Male | Female |
| Under 5 Years | 0 (0.0%) | 0 (0.0%) |
| 5 Years | 0 (0.0%) | 0 (0.0%) |
| 6 to 11 Years | 0 (0.0%) | 0 (0.0%) |
| 12 to 14 Years | 5 (7.7%) | 2 (2.0%) |
| 15 Years | 0 (0.0%) | 0 (0.0%) |
| 16 and 17 Years | 0 (0.0%) | 1 (4.2%) |
| 18 to 24 Years | 43 (33.6%) | 0 (0.0%) |
| 25 to 34 Years | 0 (0.0%) | 0 (0.0%) |
| 35 to 44 Years | 0 (0.0%) | 0 (0.0%) |
| 45 to 54 Years | 2 (1.5%) | 3 (1.9%) |
| 55 to 64 Years | 3 (1.4%) | 44 (21.5%) |
| 65 to 74 Years | 4 (3.9%) | 3 (2.9%) |
| 75 Years and over | 0 (0.0%) | 0 (0.0%) |
| Total | 57 (4.8%) | 53 (4.3%) |
Income Above Poverty by Sex and Age in Anchorage
According to the poverty statistics in Anchorage, males aged under 5 years and females aged under 5 years are the age groups that are most secure financially, with 100.0% of males and 100.0% of females in these age groups living above the poverty line.
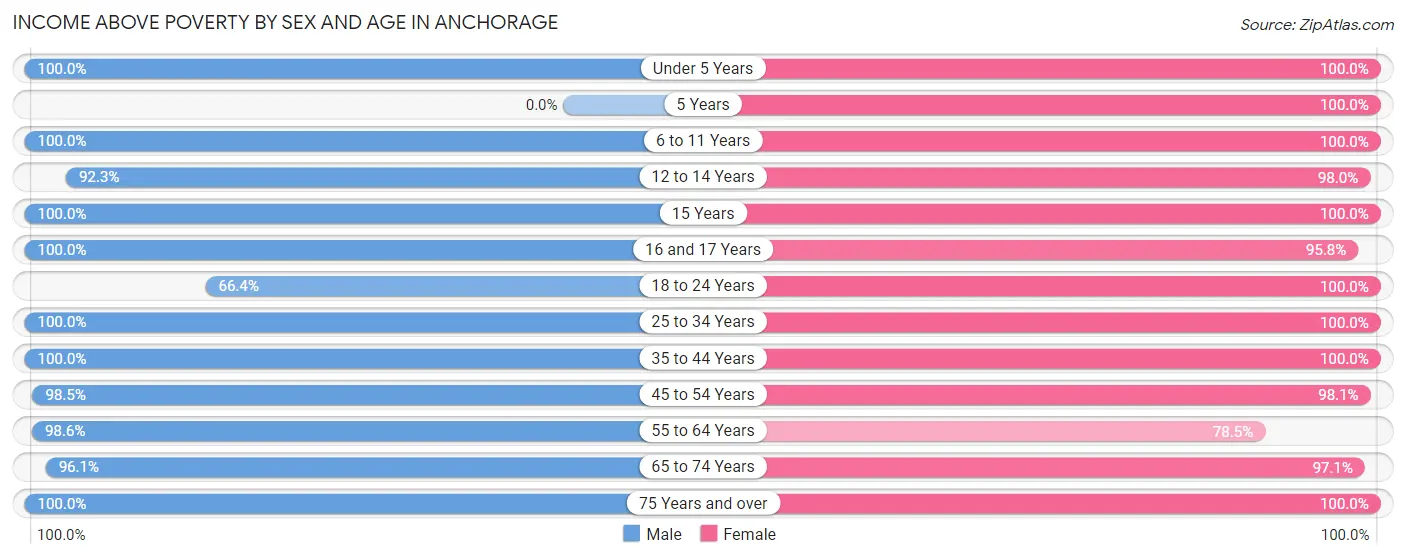
| Age Bracket | Male | Female |
| Under 5 Years | 28 (100.0%) | 56 (100.0%) |
| 5 Years | 0 (0.0%) | 23 (100.0%) |
| 6 to 11 Years | 146 (100.0%) | 200 (100.0%) |
| 12 to 14 Years | 60 (92.3%) | 100 (98.0%) |
| 15 Years | 21 (100.0%) | 46 (100.0%) |
| 16 and 17 Years | 54 (100.0%) | 23 (95.8%) |
| 18 to 24 Years | 85 (66.4%) | 33 (100.0%) |
| 25 to 34 Years | 96 (100.0%) | 44 (100.0%) |
| 35 to 44 Years | 123 (100.0%) | 156 (100.0%) |
| 45 to 54 Years | 134 (98.5%) | 156 (98.1%) |
| 55 to 64 Years | 214 (98.6%) | 161 (78.5%) |
| 65 to 74 Years | 98 (96.1%) | 99 (97.1%) |
| 75 Years and over | 61 (100.0%) | 73 (100.0%) |
| Total | 1,120 (95.2%) | 1,170 (95.7%) |
Income Below Poverty Among Married-Couple Families in Anchorage
The poverty statistics for married-couple families in Anchorage show that 1.2% or 7 of the total 603 families live below the poverty line. Families with 3 or 4 children have the highest poverty rate of 1.9%, comprising of 2 families. On the other hand, families with 1 or 2 children have the lowest poverty rate of 0.9%, which includes 2 families.
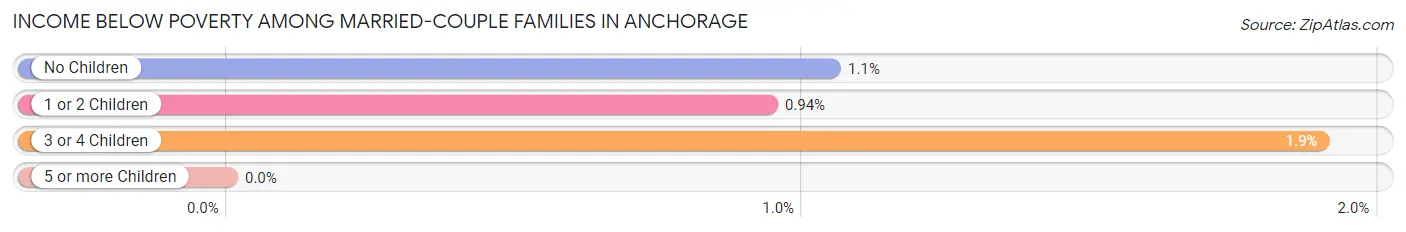
| Children | Above Poverty | Below Poverty |
| No Children | 283 (99.0%) | 3 (1.1%) |
| 1 or 2 Children | 210 (99.1%) | 2 (0.9%) |
| 3 or 4 Children | 103 (98.1%) | 2 (1.9%) |
| 5 or more Children | 0 (0.0%) | 0 (0.0%) |
| Total | 596 (98.8%) | 7 (1.2%) |
Income Below Poverty Among Single-Parent Households in Anchorage
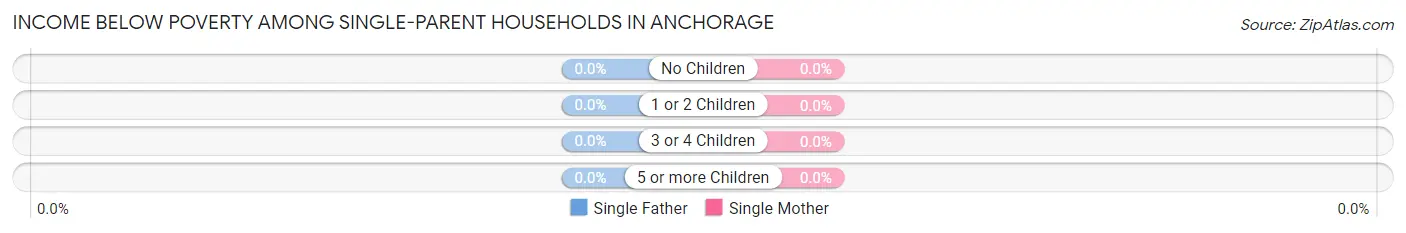
| Children | Single Father | Single Mother |
| No Children | 0 (0.0%) | 0 (0.0%) |
| 1 or 2 Children | 0 (0.0%) | 0 (0.0%) |
| 3 or 4 Children | 0 (0.0%) | 0 (0.0%) |
| 5 or more Children | 0 (0.0%) | 0 (0.0%) |
| Total | 0 (0.0%) | 0 (0.0%) |
Income Below Poverty Among Married-Couple vs Single-Parent Households in Anchorage
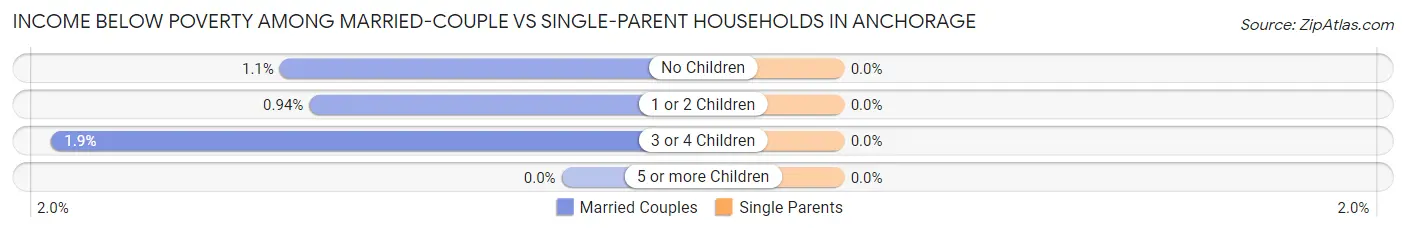
| Children | Married-Couple Families | Single-Parent Households |
| No Children | 3 (1.1%) | 0 (0.0%) |
| 1 or 2 Children | 2 (0.9%) | 0 (0.0%) |
| 3 or 4 Children | 2 (1.9%) | 0 (0.0%) |
| 5 or more Children | 0 (0.0%) | 0 (0.0%) |
| Total | 7 (1.2%) | 0 (0.0%) |
Employment Characteristics in Anchorage
Employment by Class of Employer in Anchorage
Among the 1,024 employed individuals in Anchorage, private company employees (651 | 63.6%), self-employed (incorporated) (131 | 12.8%), and not-for-profit organizations (100 | 9.8%) make up the most common classes of employment.
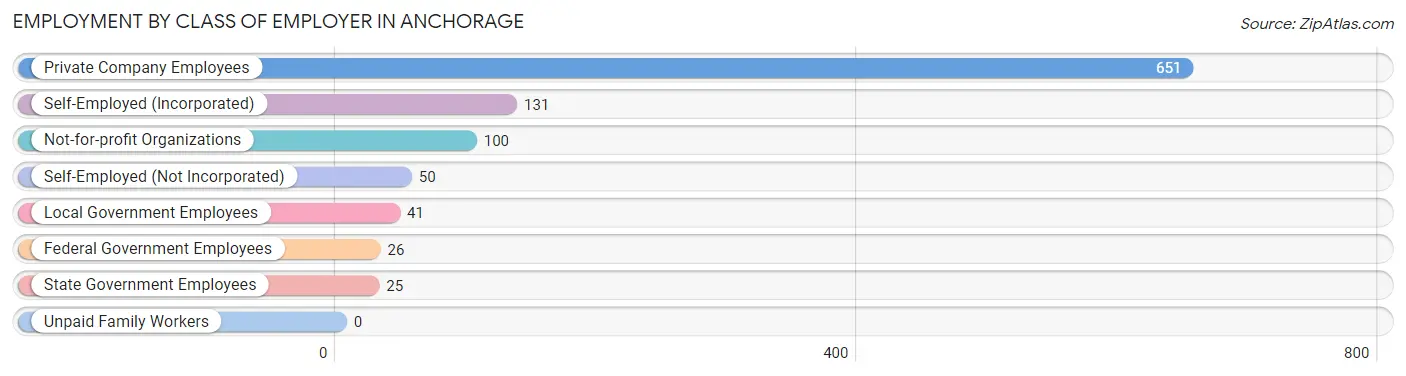
| Employer Class | # Employees | % Employees |
| Private Company Employees | 651 | 63.6% |
| Self-Employed (Incorporated) | 131 | 12.8% |
| Self-Employed (Not Incorporated) | 50 | 4.9% |
| Not-for-profit Organizations | 100 | 9.8% |
| Local Government Employees | 41 | 4.0% |
| State Government Employees | 25 | 2.4% |
| Federal Government Employees | 26 | 2.5% |
| Unpaid Family Workers | 0 | 0.0% |
| Total | 1,024 | 100.0% |
Employment Status by Age in Anchorage
According to the labor force statistics for Anchorage, out of the total population over 16 years of age (1,723), 64.2% or 1,106 individuals are in the labor force, with 6.1% or 67 of them unemployed. The age group with the highest labor force participation rate is 25 to 29 years, with 88.2% or 75 individuals in the labor force. Within the labor force, the 20 to 24 years age range has the highest percentage of unemployed individuals, with 42.4% or 50 of them being unemployed.
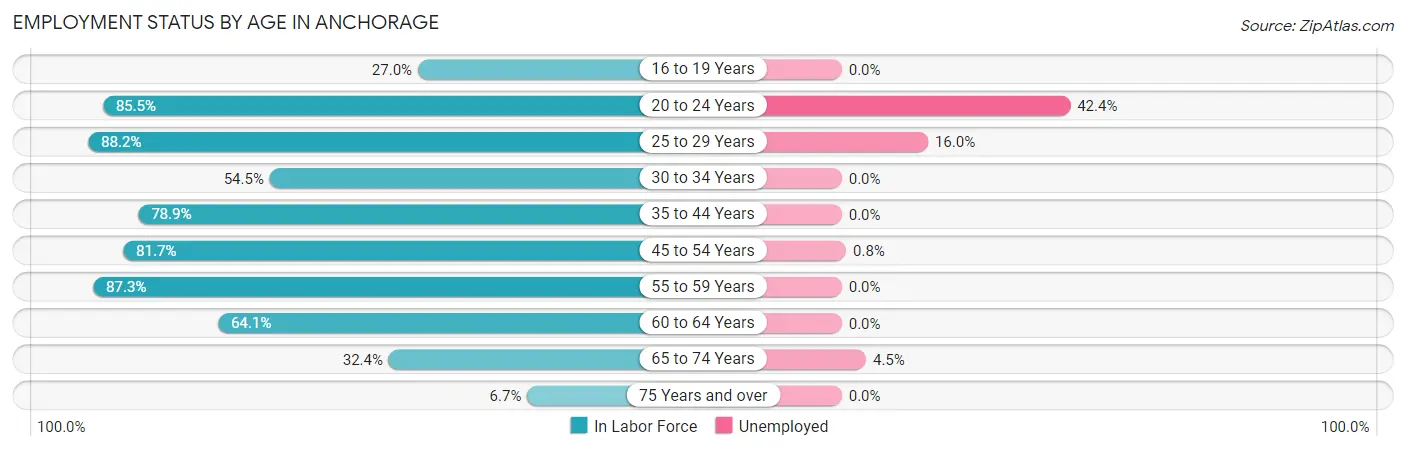
| Age Bracket | In Labor Force | Unemployed |
| 16 to 19 Years | 30 (27.0%) | 0 (0.0%) |
| 20 to 24 Years | 118 (85.5%) | 50 (42.4%) |
| 25 to 29 Years | 75 (88.2%) | 12 (16.0%) |
| 30 to 34 Years | 30 (54.5%) | 0 (0.0%) |
| 35 to 44 Years | 220 (78.9%) | 0 (0.0%) |
| 45 to 54 Years | 241 (81.7%) | 2 (0.8%) |
| 55 to 59 Years | 179 (87.3%) | 0 (0.0%) |
| 60 to 64 Years | 139 (64.1%) | 0 (0.0%) |
| 65 to 74 Years | 66 (32.4%) | 3 (4.5%) |
| 75 Years and over | 9 (6.7%) | 0 (0.0%) |
| Total | 1,106 (64.2%) | 67 (6.1%) |
Employment Status by Educational Attainment in Anchorage
According to labor force statistics for Anchorage, 77.8% of individuals (884) out of the total population between 25 and 64 years of age (1,136) are in the labor force, with 1.6% or 14 of them being unemployed. The group with the highest labor force participation rate are those with the educational attainment of less than high school, with 100.0% or 2 individuals in the labor force. Within the labor force, individuals with bachelor's degree or higher education have the highest percentage of unemployment, with 1.8% or 14 of them being unemployed.
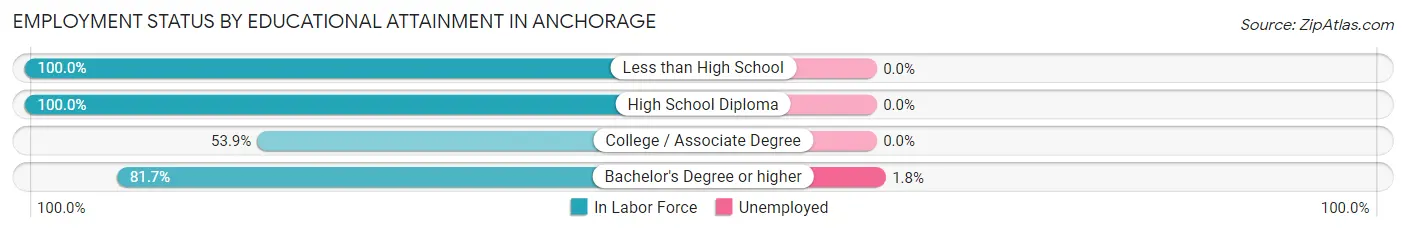
| Educational Attainment | In Labor Force | Unemployed |
| Less than High School | 2 (100.0%) | 0 (0.0%) |
| High School Diploma | 28 (100.0%) | 0 (0.0%) |
| College / Associate Degree | 96 (53.9%) | 0 (0.0%) |
| Bachelor's Degree or higher | 758 (81.7%) | 17 (1.8%) |
| Total | 884 (77.8%) | 18 (1.6%) |
Employment Occupations by Sex in Anchorage
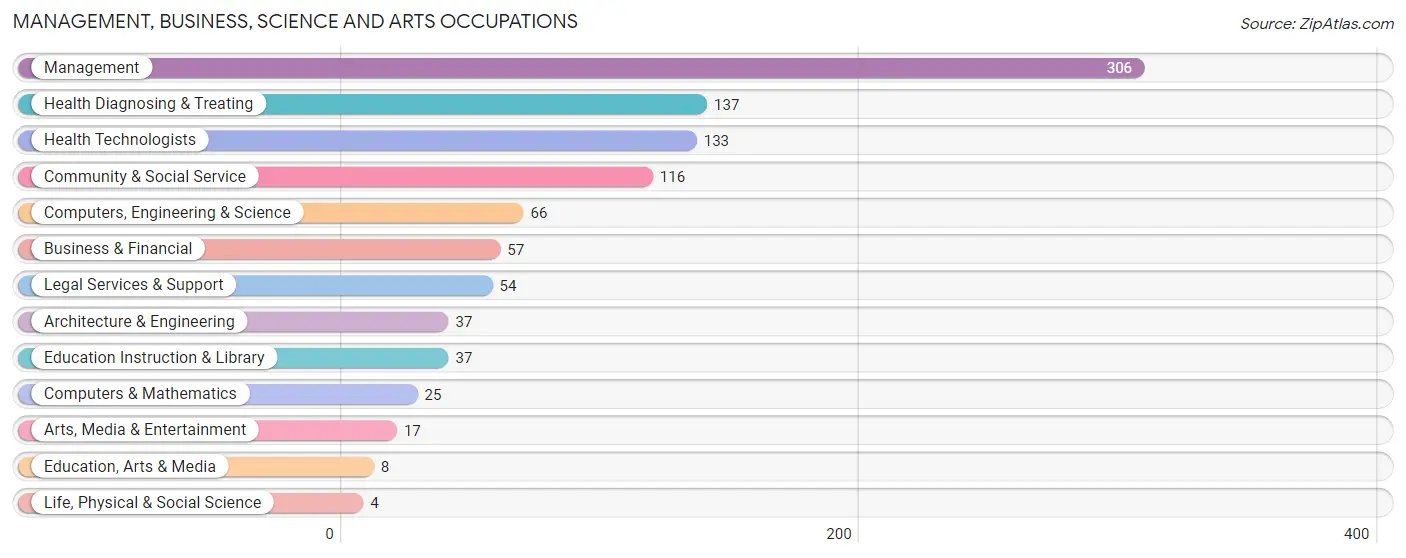
Management, Business, Science and Arts Occupations
The most common Management, Business, Science and Arts occupations in Anchorage are Management (306 | 29.4%), Health Diagnosing & Treating (137 | 13.2%), Health Technologists (133 | 12.8%), Community & Social Service (116 | 11.2%), and Computers, Engineering & Science (66 | 6.4%).
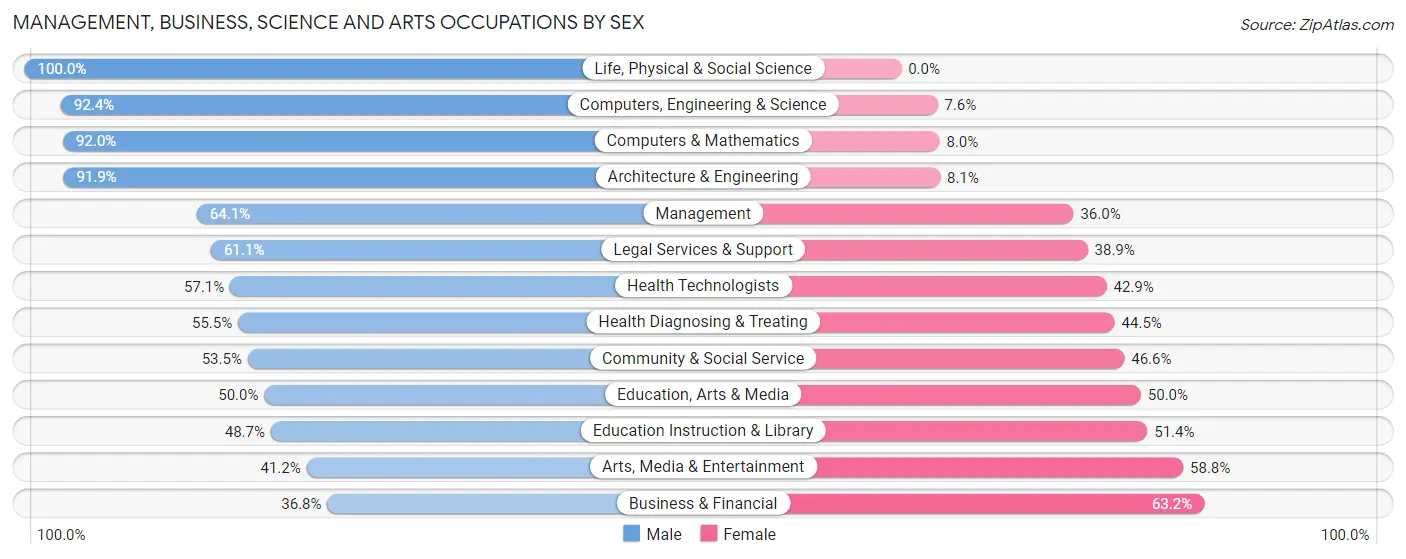
Management, Business, Science and Arts Occupations by Sex
Within the Management, Business, Science and Arts occupations in Anchorage, the most male-oriented occupations are Life, Physical & Social Science (100.0%), Computers, Engineering & Science (92.4%), and Computers & Mathematics (92.0%), while the most female-oriented occupations are Business & Financial (63.2%), Arts, Media & Entertainment (58.8%), and Education Instruction & Library (51.3%).
| Occupation | Male | Female |
| Management | 196 (64.0%) | 110 (35.9%) |
| Business & Financial | 21 (36.8%) | 36 (63.2%) |
| Computers, Engineering & Science | 61 (92.4%) | 5 (7.6%) |
| Computers & Mathematics | 23 (92.0%) | 2 (8.0%) |
| Architecture & Engineering | 34 (91.9%) | 3 (8.1%) |
| Life, Physical & Social Science | 4 (100.0%) | 0 (0.0%) |
| Community & Social Service | 62 (53.4%) | 54 (46.6%) |
| Education, Arts & Media | 4 (50.0%) | 4 (50.0%) |
| Legal Services & Support | 33 (61.1%) | 21 (38.9%) |
| Education Instruction & Library | 18 (48.6%) | 19 (51.3%) |
| Arts, Media & Entertainment | 7 (41.2%) | 10 (58.8%) |
| Health Diagnosing & Treating | 76 (55.5%) | 61 (44.5%) |
| Health Technologists | 76 (57.1%) | 57 (42.9%) |
| Total (Category) | 416 (61.0%) | 266 (39.0%) |
| Total (Overall) | 651 (62.6%) | 389 (37.4%) |
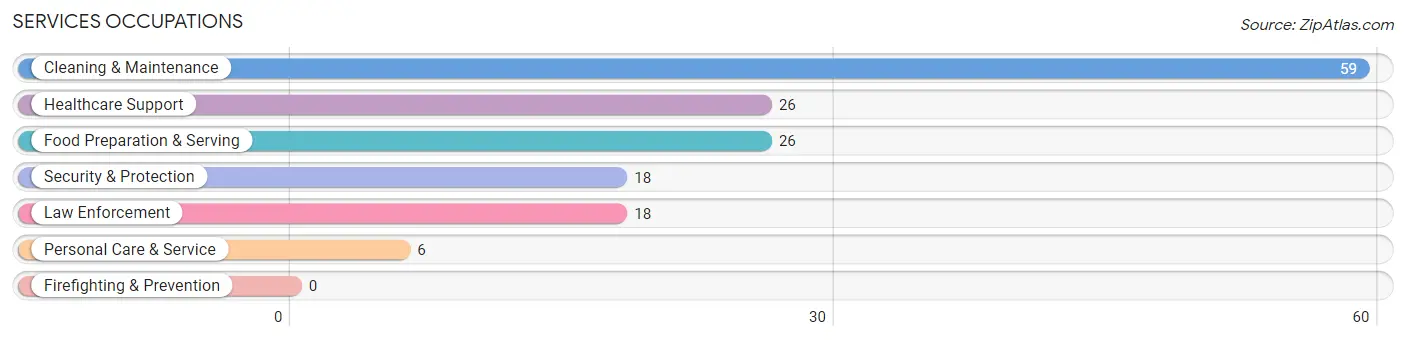
Services Occupations
The most common Services occupations in Anchorage are Cleaning & Maintenance (59 | 5.7%), Healthcare Support (26 | 2.5%), Food Preparation & Serving (26 | 2.5%), Security & Protection (18 | 1.7%), and Law Enforcement (18 | 1.7%).
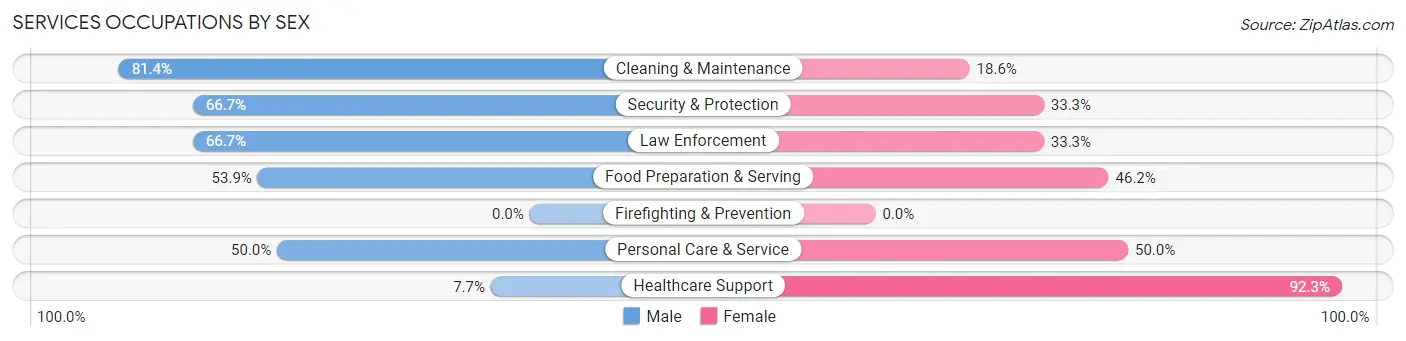
Services Occupations by Sex
Within the Services occupations in Anchorage, the most male-oriented occupations are Cleaning & Maintenance (81.4%), Security & Protection (66.7%), and Law Enforcement (66.7%), while the most female-oriented occupations are Healthcare Support (92.3%), Personal Care & Service (50.0%), and Food Preparation & Serving (46.2%).
| Occupation | Male | Female |
| Healthcare Support | 2 (7.7%) | 24 (92.3%) |
| Security & Protection | 12 (66.7%) | 6 (33.3%) |
| Firefighting & Prevention | 0 (0.0%) | 0 (0.0%) |
| Law Enforcement | 12 (66.7%) | 6 (33.3%) |
| Food Preparation & Serving | 14 (53.8%) | 12 (46.2%) |
| Cleaning & Maintenance | 48 (81.4%) | 11 (18.6%) |
| Personal Care & Service | 3 (50.0%) | 3 (50.0%) |
| Total (Category) | 79 (58.5%) | 56 (41.5%) |
| Total (Overall) | 651 (62.6%) | 389 (37.4%) |
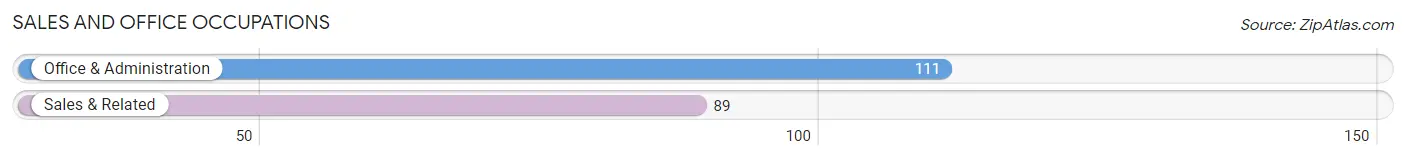
Sales and Office Occupations
The most common Sales and Office occupations in Anchorage are Office & Administration (111 | 10.7%), and Sales & Related (89 | 8.6%).
Sales and Office Occupations by Sex
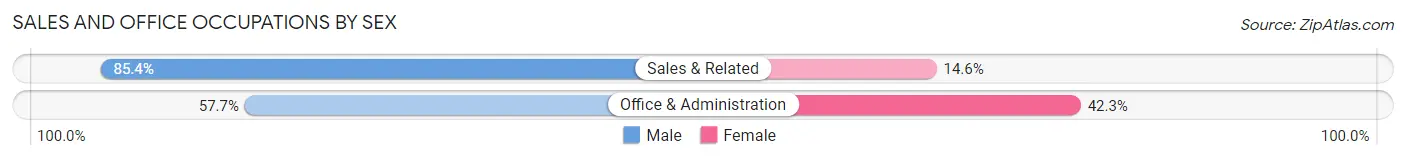
| Occupation | Male | Female |
| Sales & Related | 76 (85.4%) | 13 (14.6%) |
| Office & Administration | 64 (57.7%) | 47 (42.3%) |
| Total (Category) | 140 (70.0%) | 60 (30.0%) |
| Total (Overall) | 651 (62.6%) | 389 (37.4%) |
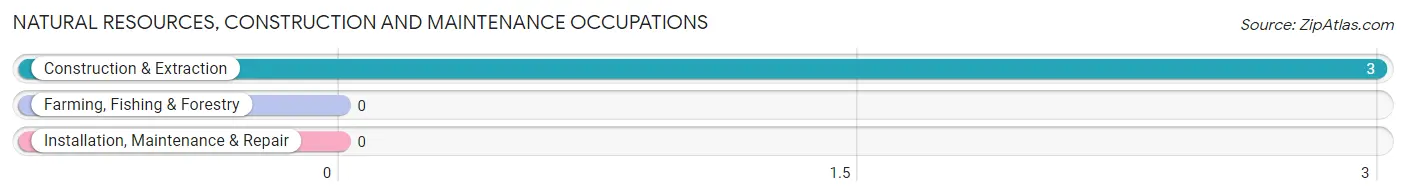
Natural Resources, Construction and Maintenance Occupations
The most common Natural Resources, Construction and Maintenance occupations in Anchorage are , and Construction & Extraction (3 | 0.3%).
Natural Resources, Construction and Maintenance Occupations by Sex
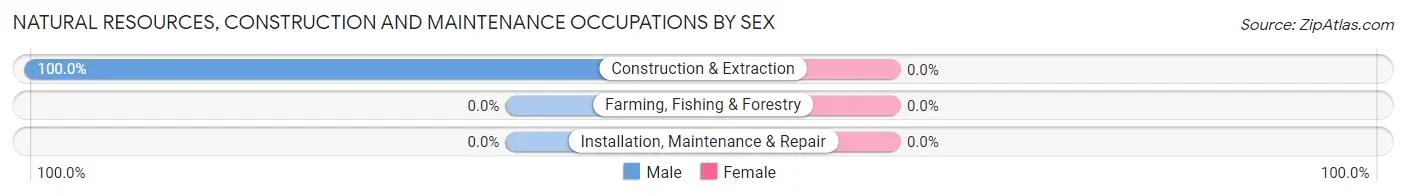
| Occupation | Male | Female |
| Farming, Fishing & Forestry | 0 (0.0%) | 0 (0.0%) |
| Construction & Extraction | 3 (100.0%) | 0 (0.0%) |
| Installation, Maintenance & Repair | 0 (0.0%) | 0 (0.0%) |
| Total (Category) | 3 (100.0%) | 0 (0.0%) |
| Total (Overall) | 651 (62.6%) | 389 (37.4%) |
Production, Transportation and Moving Occupations
The most common Production, Transportation and Moving occupations in Anchorage are Production (16 | 1.5%), and Transportation (4 | 0.4%).
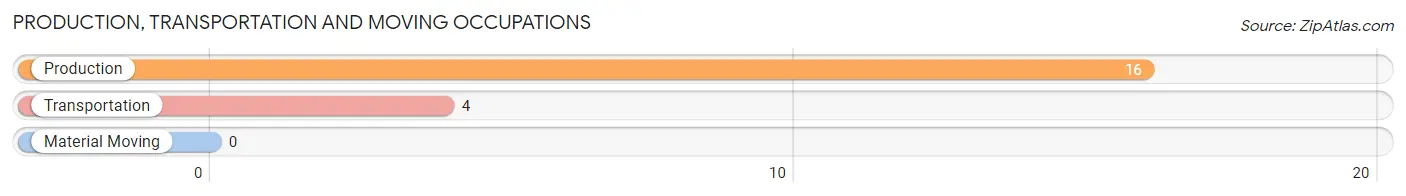
Production, Transportation and Moving Occupations by Sex
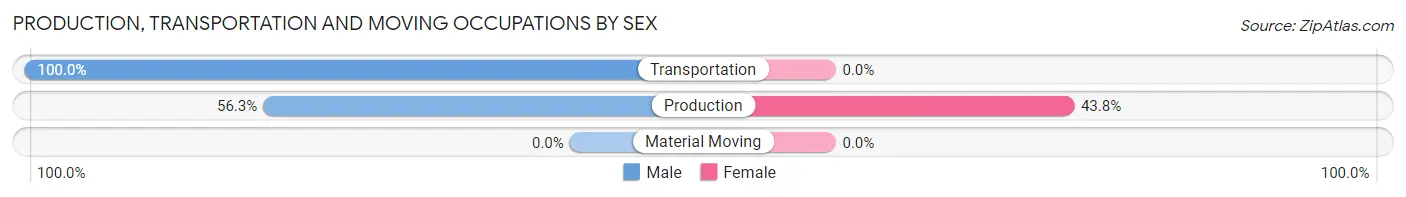
| Occupation | Male | Female |
| Production | 9 (56.2%) | 7 (43.8%) |
| Transportation | 4 (100.0%) | 0 (0.0%) |
| Material Moving | 0 (0.0%) | 0 (0.0%) |
| Total (Category) | 13 (65.0%) | 7 (35.0%) |
| Total (Overall) | 651 (62.6%) | 389 (37.4%) |
Employment Industries by Sex in Anchorage
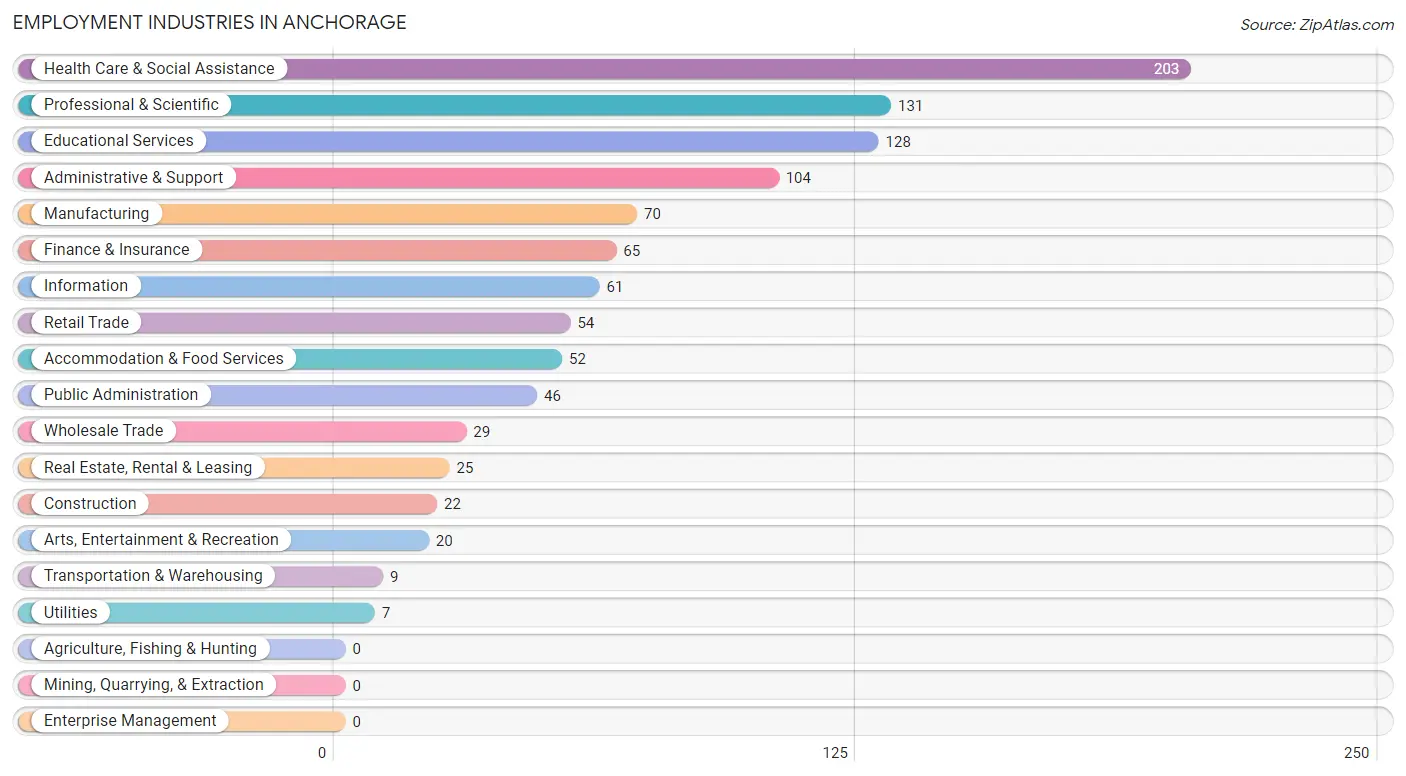
Employment Industries in Anchorage
The major employment industries in Anchorage include Health Care & Social Assistance (203 | 19.5%), Professional & Scientific (131 | 12.6%), Educational Services (128 | 12.3%), Administrative & Support (104 | 10.0%), and Manufacturing (70 | 6.7%).
Employment Industries by Sex in Anchorage
The Anchorage industries that see more men than women are Utilities (100.0%), Information (93.4%), and Real Estate, Rental & Leasing (92.0%), whereas the industries that tend to have a higher number of women are Wholesale Trade (55.2%), Arts, Entertainment & Recreation (55.0%), and Health Care & Social Assistance (54.7%).
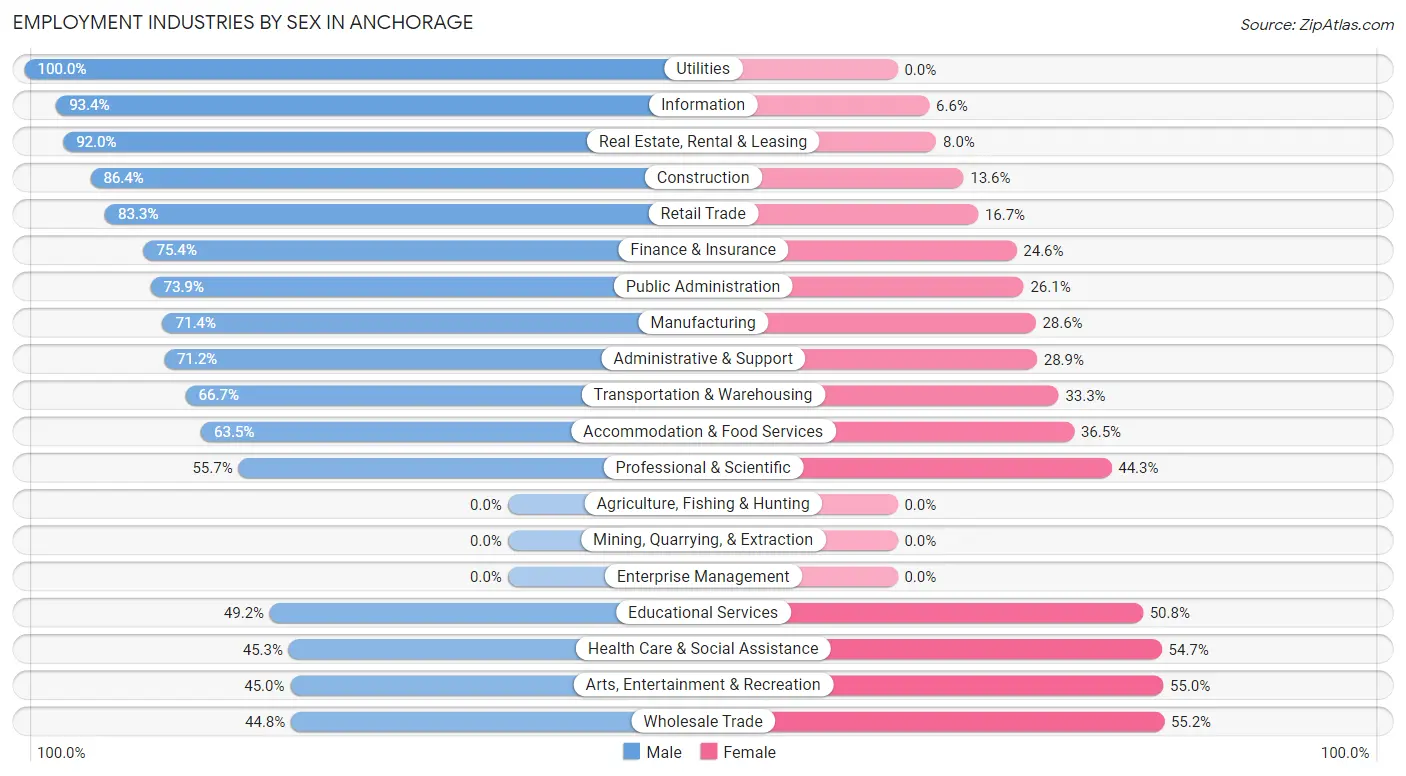
| Industry | Male | Female |
| Agriculture, Fishing & Hunting | 0 (0.0%) | 0 (0.0%) |
| Mining, Quarrying, & Extraction | 0 (0.0%) | 0 (0.0%) |
| Construction | 19 (86.4%) | 3 (13.6%) |
| Manufacturing | 50 (71.4%) | 20 (28.6%) |
| Wholesale Trade | 13 (44.8%) | 16 (55.2%) |
| Retail Trade | 45 (83.3%) | 9 (16.7%) |
| Transportation & Warehousing | 6 (66.7%) | 3 (33.3%) |
| Utilities | 7 (100.0%) | 0 (0.0%) |
| Information | 57 (93.4%) | 4 (6.6%) |
| Finance & Insurance | 49 (75.4%) | 16 (24.6%) |
| Real Estate, Rental & Leasing | 23 (92.0%) | 2 (8.0%) |
| Professional & Scientific | 73 (55.7%) | 58 (44.3%) |
| Enterprise Management | 0 (0.0%) | 0 (0.0%) |
| Administrative & Support | 74 (71.2%) | 30 (28.8%) |
| Educational Services | 63 (49.2%) | 65 (50.8%) |
| Health Care & Social Assistance | 92 (45.3%) | 111 (54.7%) |
| Arts, Entertainment & Recreation | 9 (45.0%) | 11 (55.0%) |
| Accommodation & Food Services | 33 (63.5%) | 19 (36.5%) |
| Public Administration | 34 (73.9%) | 12 (26.1%) |
| Total | 651 (62.6%) | 389 (37.4%) |
Education in Anchorage
School Enrollment in Anchorage
The most common levels of schooling among the 838 students in Anchorage are middle school (271 | 32.3%), elementary school (205 | 24.5%), and high school (186 | 22.2%).
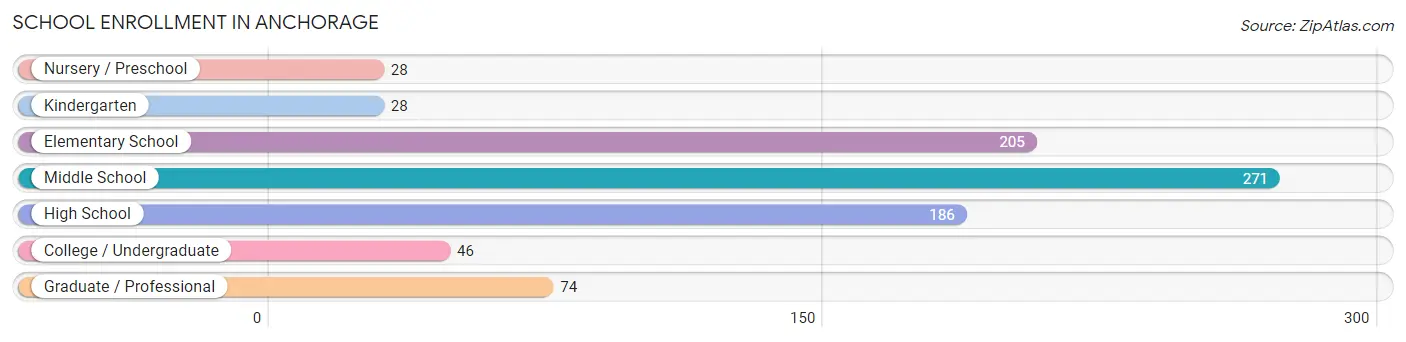
| School Level | # Students | % Students |
| Nursery / Preschool | 28 | 3.3% |
| Kindergarten | 28 | 3.3% |
| Elementary School | 205 | 24.5% |
| Middle School | 271 | 32.3% |
| High School | 186 | 22.2% |
| College / Undergraduate | 46 | 5.5% |
| Graduate / Professional | 74 | 8.8% |
| Total | 838 | 100.0% |
School Enrollment by Age by Funding Source in Anchorage
Out of a total of 838 students who are enrolled in schools in Anchorage, 306 (36.5%) attend a private institution, while the remaining 532 (63.5%) are enrolled in public schools. The age group of 25 to 34 year olds has the highest likelihood of being enrolled in private schools, with 54 (84.4% in the age bracket) enrolled. Conversely, the age group of 35 years and over has the lowest likelihood of being enrolled in a private school, with 6 (100.0% in the age bracket) attending a public institution.
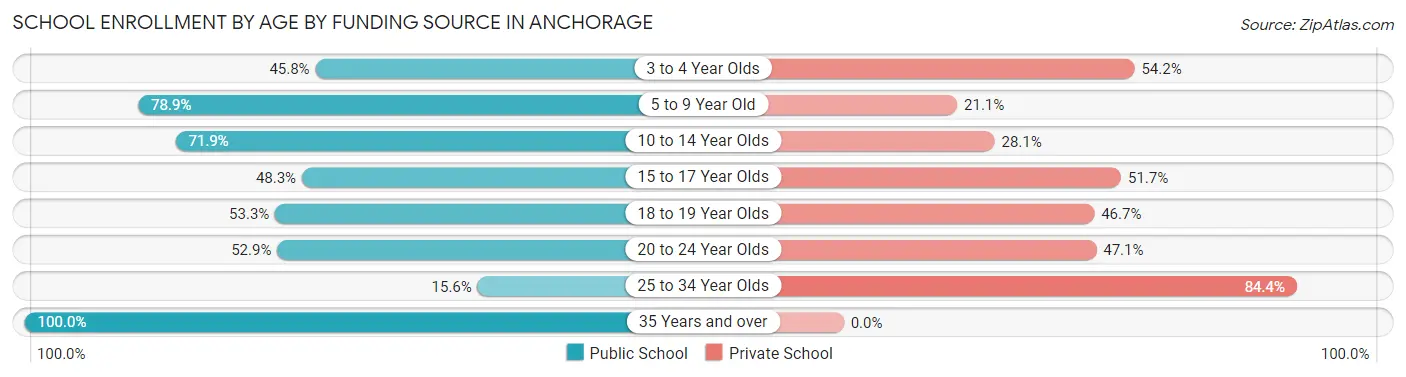
| Age Bracket | Public School | Private School |
| 3 to 4 Year Olds | 11 (45.8%) | 13 (54.2%) |
| 5 to 9 Year Old | 168 (78.9%) | 45 (21.1%) |
| 10 to 14 Year Olds | 238 (71.9%) | 93 (28.1%) |
| 15 to 17 Year Olds | 73 (48.3%) | 78 (51.7%) |
| 18 to 19 Year Olds | 8 (53.3%) | 7 (46.7%) |
| 20 to 24 Year Olds | 18 (52.9%) | 16 (47.1%) |
| 25 to 34 Year Olds | 10 (15.6%) | 54 (84.4%) |
| 35 Years and over | 6 (100.0%) | 0 (0.0%) |
| Total | 532 (63.5%) | 306 (36.5%) |
Educational Attainment by Field of Study in Anchorage
Business (260 | 20.9%), social sciences (164 | 13.2%), bio, nature & agricultural (148 | 11.9%), communications (99 | 8.0%), and science & technology (88 | 7.1%) are the most common fields of study among 1,246 individuals in Anchorage who have obtained a bachelor's degree or higher.
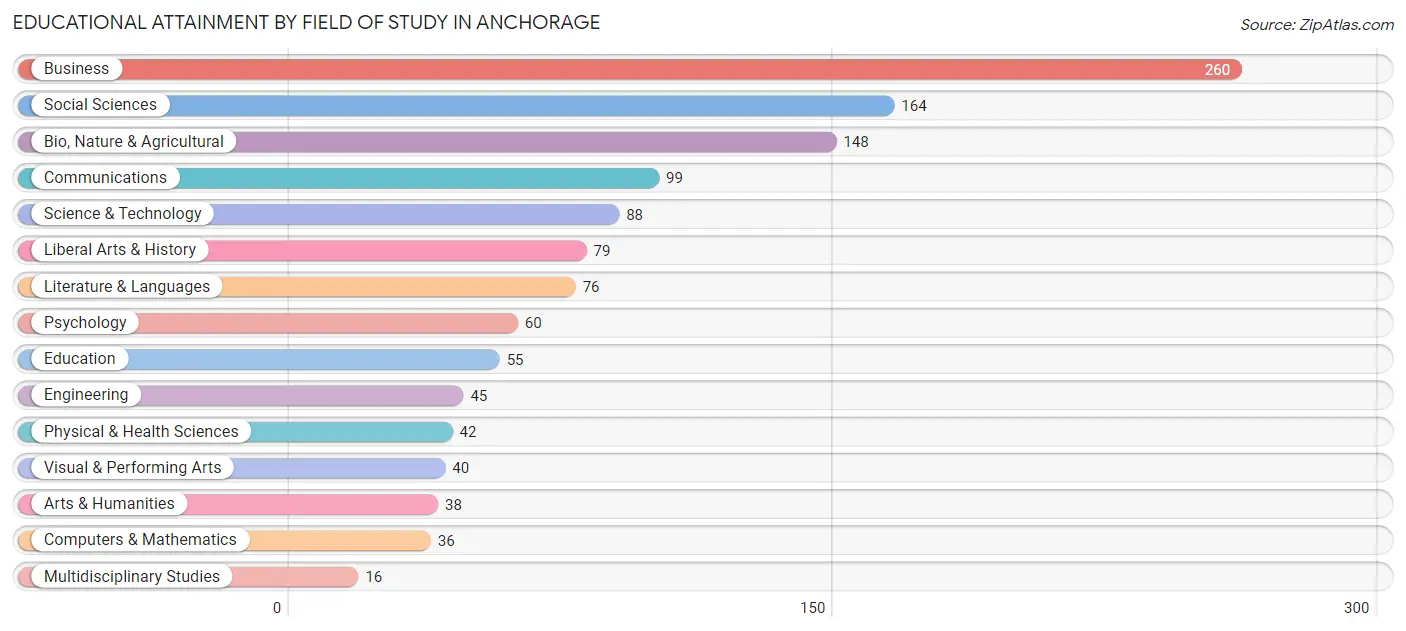
| Field of Study | # Graduates | % Graduates |
| Computers & Mathematics | 36 | 2.9% |
| Bio, Nature & Agricultural | 148 | 11.9% |
| Physical & Health Sciences | 42 | 3.4% |
| Psychology | 60 | 4.8% |
| Social Sciences | 164 | 13.2% |
| Engineering | 45 | 3.6% |
| Multidisciplinary Studies | 16 | 1.3% |
| Science & Technology | 88 | 7.1% |
| Business | 260 | 20.9% |
| Education | 55 | 4.4% |
| Literature & Languages | 76 | 6.1% |
| Liberal Arts & History | 79 | 6.3% |
| Visual & Performing Arts | 40 | 3.2% |
| Communications | 99 | 8.0% |
| Arts & Humanities | 38 | 3.0% |
| Total | 1,246 | 100.0% |
Transportation & Commute in Anchorage
Vehicle Availability by Sex in Anchorage
The most prevalent vehicle ownership categories in Anchorage are males with 2 vehicles (323, accounting for 49.9%) and females with 2 vehicles (206, making up 85.7%).
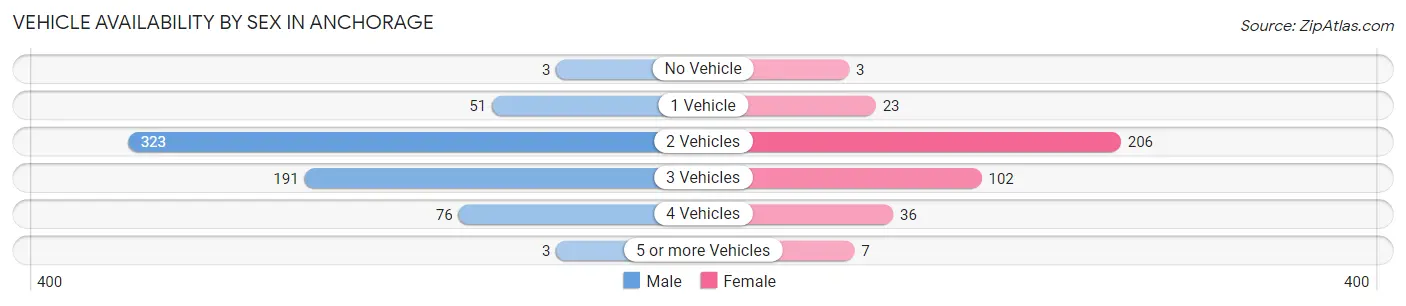
| Vehicles Available | Male | Female |
| No Vehicle | 3 (0.5%) | 3 (0.8%) |
| 1 Vehicle | 51 (7.9%) | 23 (6.1%) |
| 2 Vehicles | 323 (49.9%) | 206 (54.6%) |
| 3 Vehicles | 191 (29.5%) | 102 (27.1%) |
| 4 Vehicles | 76 (11.7%) | 36 (9.6%) |
| 5 or more Vehicles | 3 (0.5%) | 7 (1.9%) |
| Total | 647 (100.0%) | 377 (100.0%) |
Commute Time in Anchorage
The most frequently occuring commute durations in Anchorage are 20 to 24 minutes (174 commuters, 23.0%), 15 to 19 minutes (170 commuters, 22.4%), and 30 to 34 minutes (107 commuters, 14.1%).
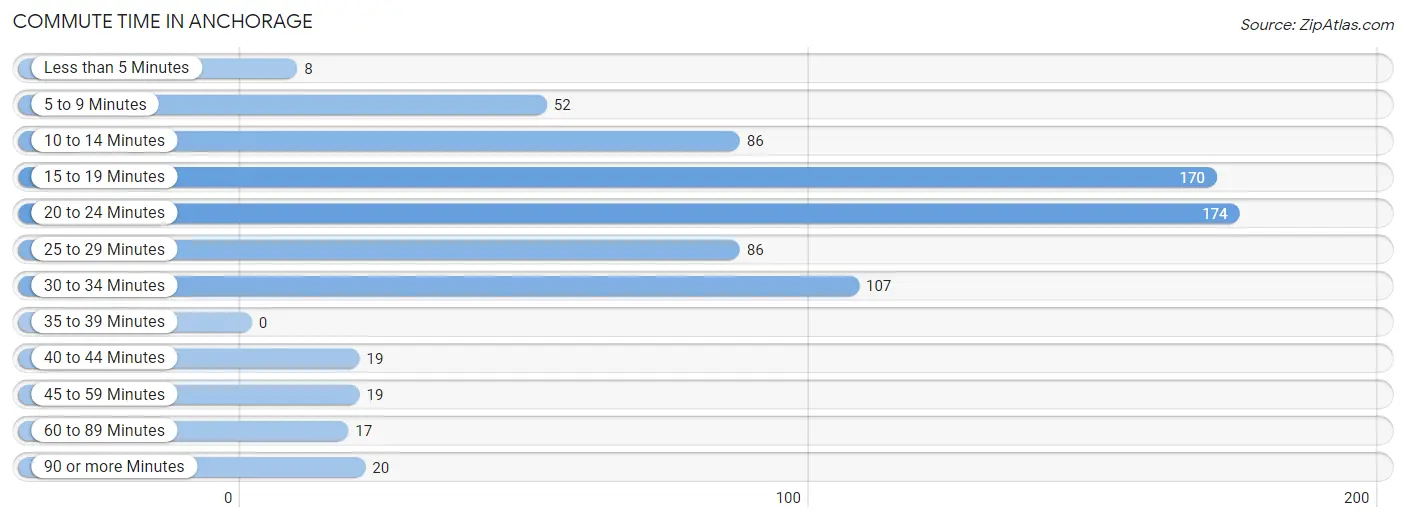
| Commute Time | # Commuters | % Commuters |
| Less than 5 Minutes | 8 | 1.1% |
| 5 to 9 Minutes | 52 | 6.9% |
| 10 to 14 Minutes | 86 | 11.4% |
| 15 to 19 Minutes | 170 | 22.4% |
| 20 to 24 Minutes | 174 | 23.0% |
| 25 to 29 Minutes | 86 | 11.4% |
| 30 to 34 Minutes | 107 | 14.1% |
| 35 to 39 Minutes | 0 | 0.0% |
| 40 to 44 Minutes | 19 | 2.5% |
| 45 to 59 Minutes | 19 | 2.5% |
| 60 to 89 Minutes | 17 | 2.2% |
| 90 or more Minutes | 20 | 2.6% |
Commute Time by Sex in Anchorage
The most common commute times in Anchorage are 20 to 24 minutes (144 commuters, 28.9%) for males and 15 to 19 minutes (60 commuters, 23.2%) for females.
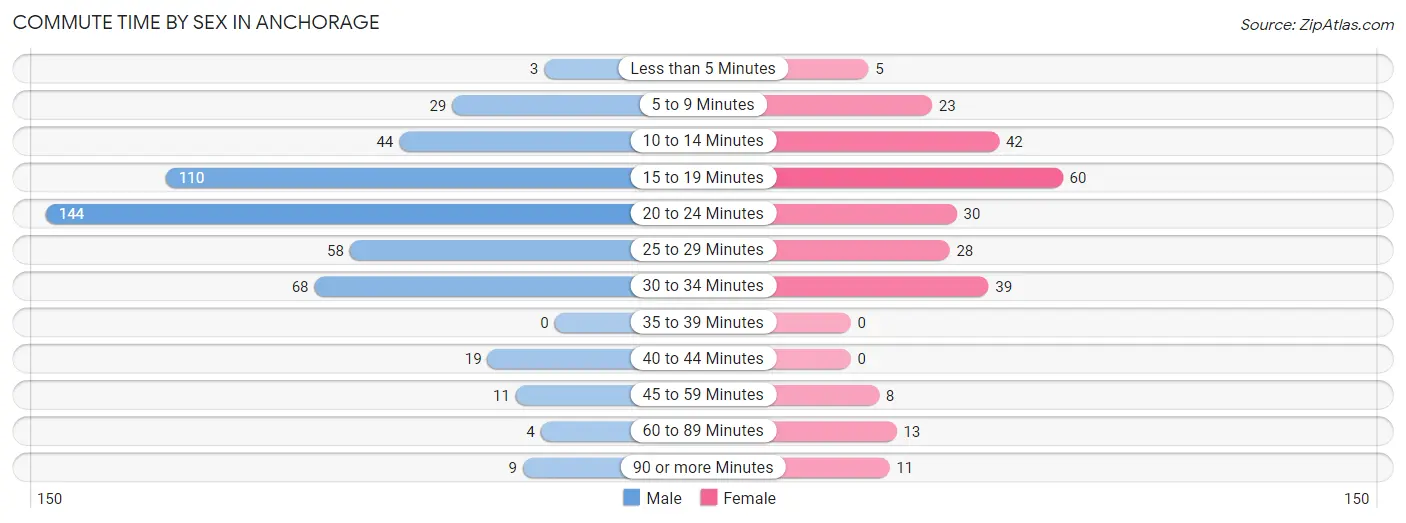
| Commute Time | Male | Female |
| Less than 5 Minutes | 3 (0.6%) | 5 (1.9%) |
| 5 to 9 Minutes | 29 (5.8%) | 23 (8.9%) |
| 10 to 14 Minutes | 44 (8.8%) | 42 (16.2%) |
| 15 to 19 Minutes | 110 (22.0%) | 60 (23.2%) |
| 20 to 24 Minutes | 144 (28.9%) | 30 (11.6%) |
| 25 to 29 Minutes | 58 (11.6%) | 28 (10.8%) |
| 30 to 34 Minutes | 68 (13.6%) | 39 (15.1%) |
| 35 to 39 Minutes | 0 (0.0%) | 0 (0.0%) |
| 40 to 44 Minutes | 19 (3.8%) | 0 (0.0%) |
| 45 to 59 Minutes | 11 (2.2%) | 8 (3.1%) |
| 60 to 89 Minutes | 4 (0.8%) | 13 (5.0%) |
| 90 or more Minutes | 9 (1.8%) | 11 (4.3%) |
Time of Departure to Work by Sex in Anchorage
The most frequent times of departure to work in Anchorage are 8:00 AM to 8:29 AM (149, 29.9%) for males and 8:00 AM to 8:29 AM (51, 19.7%) for females.
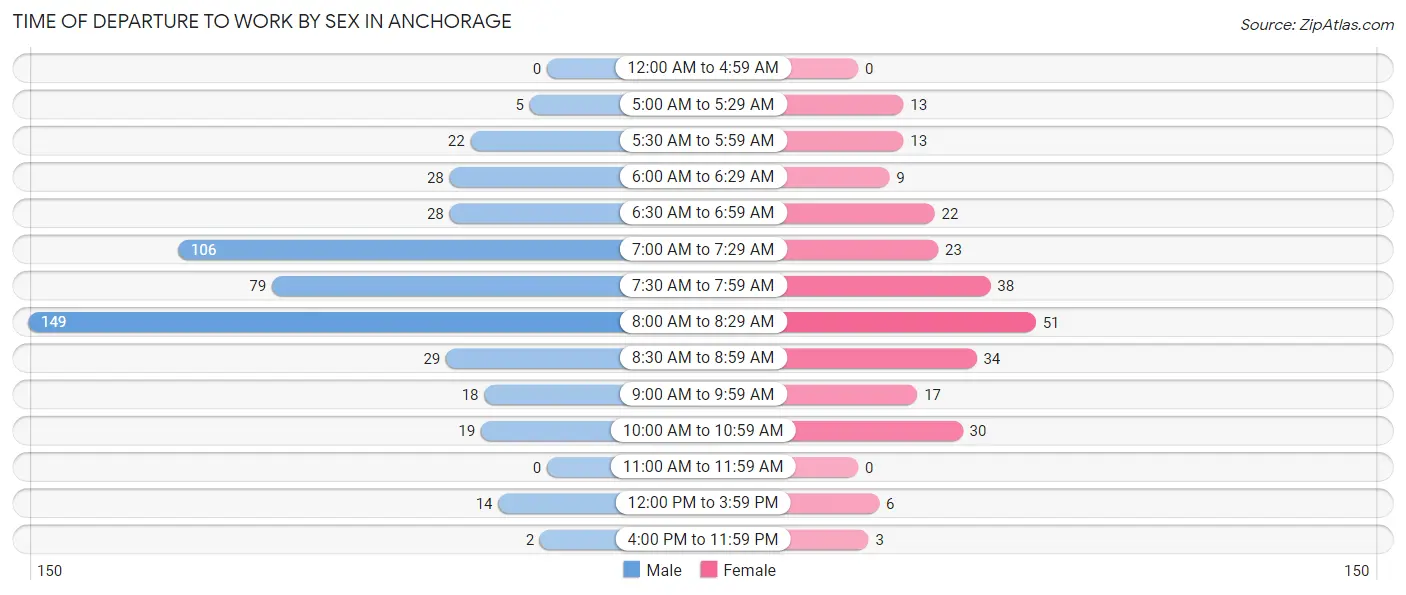
| Time of Departure | Male | Female |
| 12:00 AM to 4:59 AM | 0 (0.0%) | 0 (0.0%) |
| 5:00 AM to 5:29 AM | 5 (1.0%) | 13 (5.0%) |
| 5:30 AM to 5:59 AM | 22 (4.4%) | 13 (5.0%) |
| 6:00 AM to 6:29 AM | 28 (5.6%) | 9 (3.5%) |
| 6:30 AM to 6:59 AM | 28 (5.6%) | 22 (8.5%) |
| 7:00 AM to 7:29 AM | 106 (21.2%) | 23 (8.9%) |
| 7:30 AM to 7:59 AM | 79 (15.8%) | 38 (14.7%) |
| 8:00 AM to 8:29 AM | 149 (29.9%) | 51 (19.7%) |
| 8:30 AM to 8:59 AM | 29 (5.8%) | 34 (13.1%) |
| 9:00 AM to 9:59 AM | 18 (3.6%) | 17 (6.6%) |
| 10:00 AM to 10:59 AM | 19 (3.8%) | 30 (11.6%) |
| 11:00 AM to 11:59 AM | 0 (0.0%) | 0 (0.0%) |
| 12:00 PM to 3:59 PM | 14 (2.8%) | 6 (2.3%) |
| 4:00 PM to 11:59 PM | 2 (0.4%) | 3 (1.2%) |
| Total | 499 (100.0%) | 259 (100.0%) |
Housing Occupancy in Anchorage
Occupancy by Ownership in Anchorage
Of the total 812 dwellings in Anchorage, owner-occupied units account for 754 (92.9%), while renter-occupied units make up 58 (7.1%).
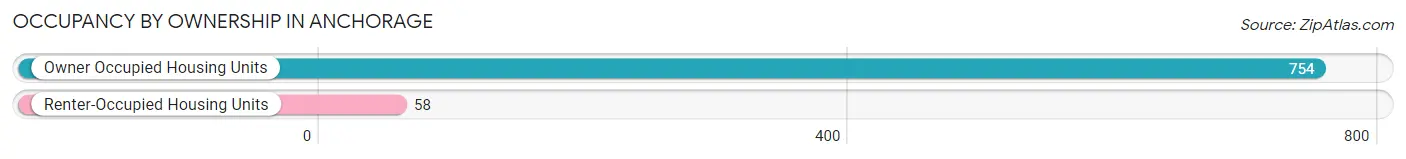
| Occupancy | # Housing Units | % Housing Units |
| Owner Occupied Housing Units | 754 | 92.9% |
| Renter-Occupied Housing Units | 58 | 7.1% |
| Total Occupied Housing Units | 812 | 100.0% |
Occupancy by Household Size in Anchorage
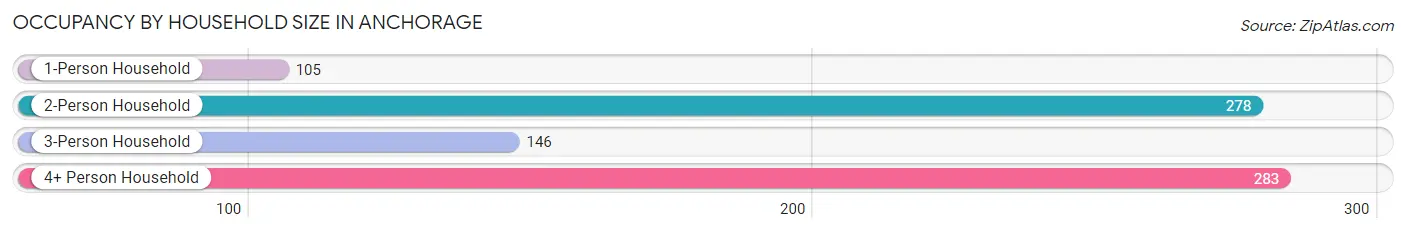
| Household Size | # Housing Units | % Housing Units |
| 1-Person Household | 105 | 12.9% |
| 2-Person Household | 278 | 34.2% |
| 3-Person Household | 146 | 18.0% |
| 4+ Person Household | 283 | 34.8% |
| Total Housing Units | 812 | 100.0% |
Occupancy by Ownership by Household Size in Anchorage
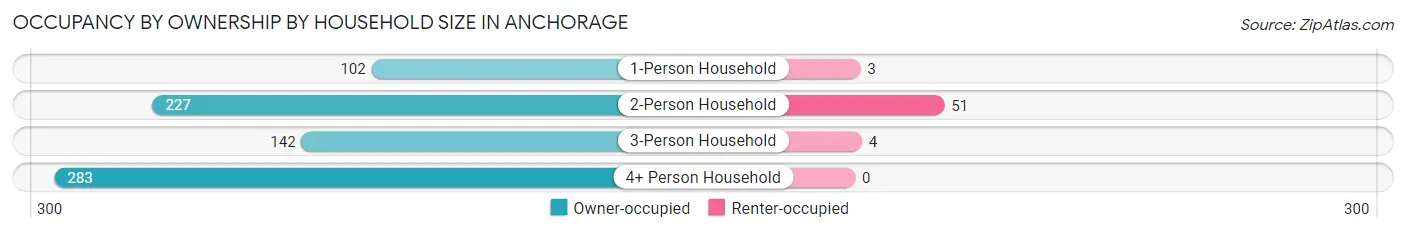
| Household Size | Owner-occupied | Renter-occupied |
| 1-Person Household | 102 (97.1%) | 3 (2.9%) |
| 2-Person Household | 227 (81.7%) | 51 (18.3%) |
| 3-Person Household | 142 (97.3%) | 4 (2.7%) |
| 4+ Person Household | 283 (100.0%) | 0 (0.0%) |
| Total Housing Units | 754 (92.9%) | 58 (7.1%) |
Occupancy by Educational Attainment in Anchorage
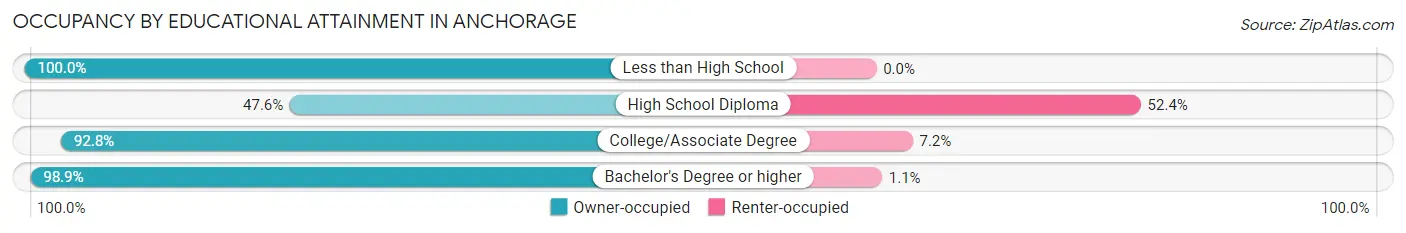
| Household Size | Owner-occupied | Renter-occupied |
| Less than High School | 2 (100.0%) | 0 (0.0%) |
| High School Diploma | 39 (47.6%) | 43 (52.4%) |
| College/Associate Degree | 103 (92.8%) | 8 (7.2%) |
| Bachelor's Degree or higher | 610 (98.9%) | 7 (1.1%) |
Occupancy by Age of Householder in Anchorage
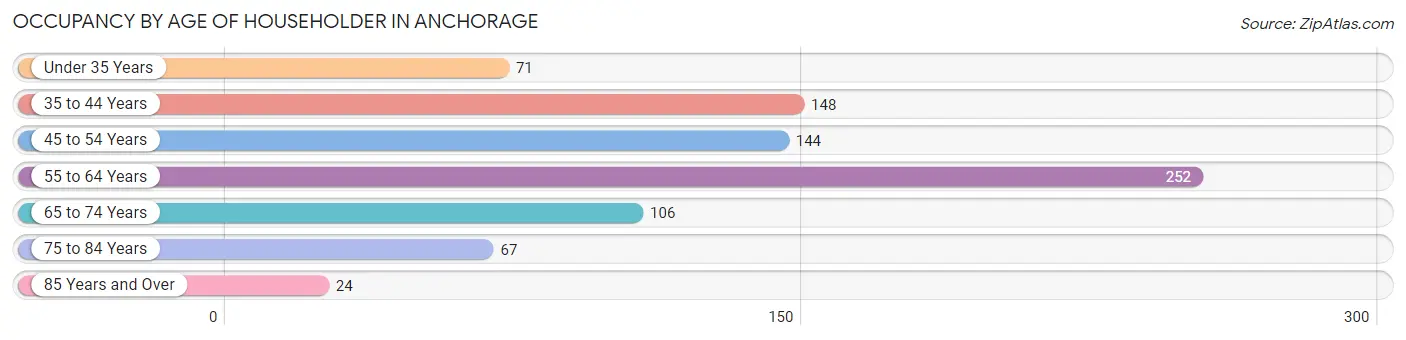
| Age Bracket | # Households | % Households |
| Under 35 Years | 71 | 8.7% |
| 35 to 44 Years | 148 | 18.2% |
| 45 to 54 Years | 144 | 17.7% |
| 55 to 64 Years | 252 | 31.0% |
| 65 to 74 Years | 106 | 13.1% |
| 75 to 84 Years | 67 | 8.3% |
| 85 Years and Over | 24 | 3.0% |
| Total | 812 | 100.0% |
Housing Finances in Anchorage
Median Income by Occupancy in Anchorage
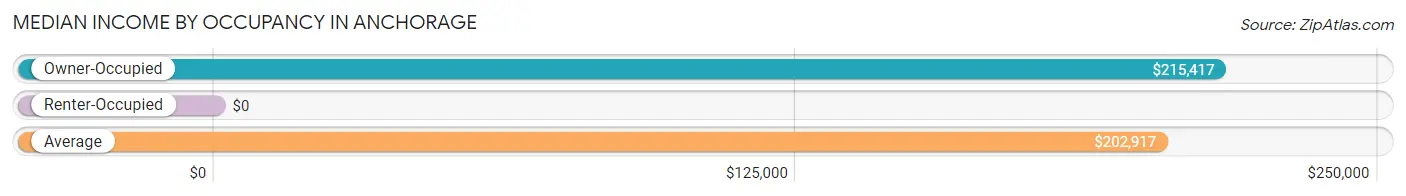
| Occupancy Type | # Households | Median Income |
| Owner-Occupied | 754 (92.9%) | $215,417 |
| Renter-Occupied | 58 (7.1%) | $0 |
| Average | 812 (100.0%) | $202,917 |
Occupancy by Householder Income Bracket in Anchorage
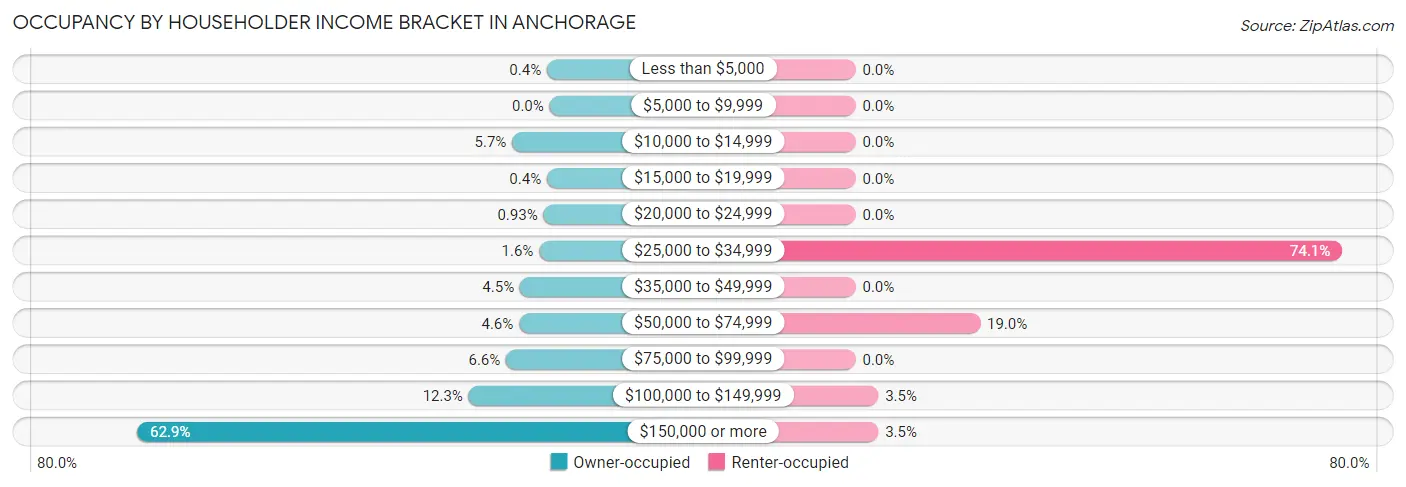
| Income Bracket | Owner-occupied | Renter-occupied |
| Less than $5,000 | 3 (0.4%) | 0 (0.0%) |
| $5,000 to $9,999 | 0 (0.0%) | 0 (0.0%) |
| $10,000 to $14,999 | 43 (5.7%) | 0 (0.0%) |
| $15,000 to $19,999 | 3 (0.4%) | 0 (0.0%) |
| $20,000 to $24,999 | 7 (0.9%) | 0 (0.0%) |
| $25,000 to $34,999 | 12 (1.6%) | 43 (74.1%) |
| $35,000 to $49,999 | 34 (4.5%) | 0 (0.0%) |
| $50,000 to $74,999 | 35 (4.6%) | 11 (19.0%) |
| $75,000 to $99,999 | 50 (6.6%) | 0 (0.0%) |
| $100,000 to $149,999 | 93 (12.3%) | 2 (3.5%) |
| $150,000 or more | 474 (62.9%) | 2 (3.5%) |
| Total | 754 (100.0%) | 58 (100.0%) |
Monthly Housing Cost Tiers in Anchorage
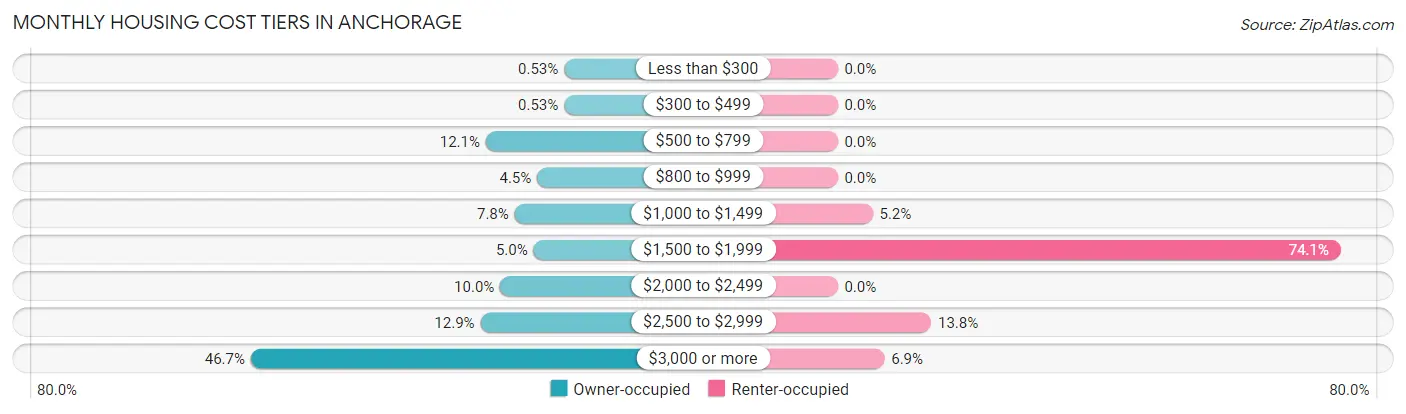
| Monthly Cost | Owner-occupied | Renter-occupied |
| Less than $300 | 4 (0.5%) | 0 (0.0%) |
| $300 to $499 | 4 (0.5%) | 0 (0.0%) |
| $500 to $799 | 91 (12.1%) | 0 (0.0%) |
| $800 to $999 | 34 (4.5%) | 0 (0.0%) |
| $1,000 to $1,499 | 59 (7.8%) | 3 (5.2%) |
| $1,500 to $1,999 | 38 (5.0%) | 43 (74.1%) |
| $2,000 to $2,499 | 75 (10.0%) | 0 (0.0%) |
| $2,500 to $2,999 | 97 (12.9%) | 8 (13.8%) |
| $3,000 or more | 352 (46.7%) | 4 (6.9%) |
| Total | 754 (100.0%) | 58 (100.0%) |
Physical Housing Characteristics in Anchorage
Housing Structures in Anchorage
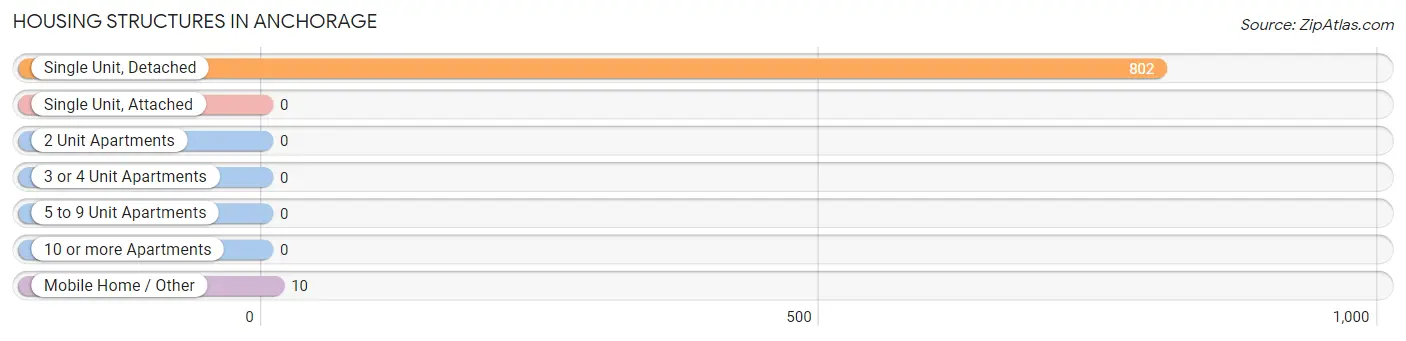
| Structure Type | # Housing Units | % Housing Units |
| Single Unit, Detached | 802 | 98.8% |
| Single Unit, Attached | 0 | 0.0% |
| 2 Unit Apartments | 0 | 0.0% |
| 3 or 4 Unit Apartments | 0 | 0.0% |
| 5 to 9 Unit Apartments | 0 | 0.0% |
| 10 or more Apartments | 0 | 0.0% |
| Mobile Home / Other | 10 | 1.2% |
| Total | 812 | 100.0% |
Housing Structures by Occupancy in Anchorage
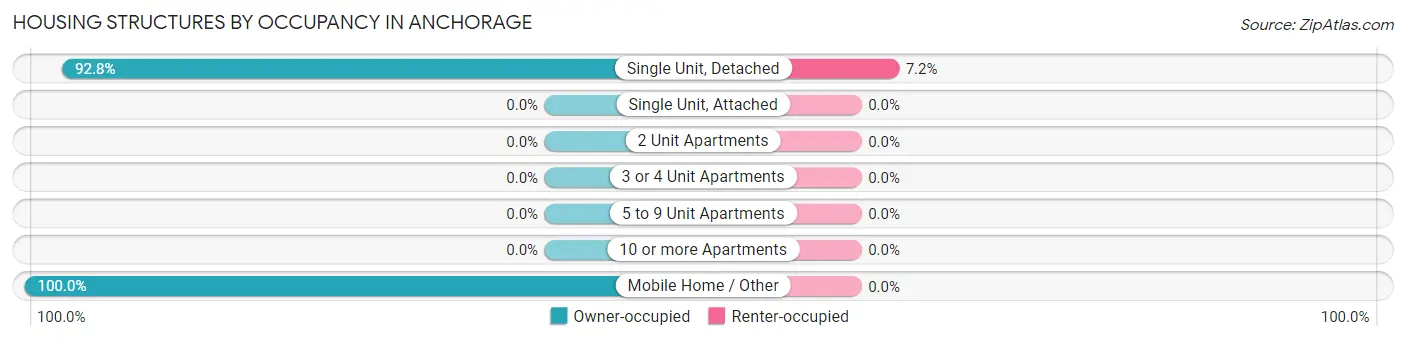
| Structure Type | Owner-occupied | Renter-occupied |
| Single Unit, Detached | 744 (92.8%) | 58 (7.2%) |
| Single Unit, Attached | 0 (0.0%) | 0 (0.0%) |
| 2 Unit Apartments | 0 (0.0%) | 0 (0.0%) |
| 3 or 4 Unit Apartments | 0 (0.0%) | 0 (0.0%) |
| 5 to 9 Unit Apartments | 0 (0.0%) | 0 (0.0%) |
| 10 or more Apartments | 0 (0.0%) | 0 (0.0%) |
| Mobile Home / Other | 10 (100.0%) | 0 (0.0%) |
| Total | 754 (92.9%) | 58 (7.1%) |
Housing Structures by Number of Rooms in Anchorage
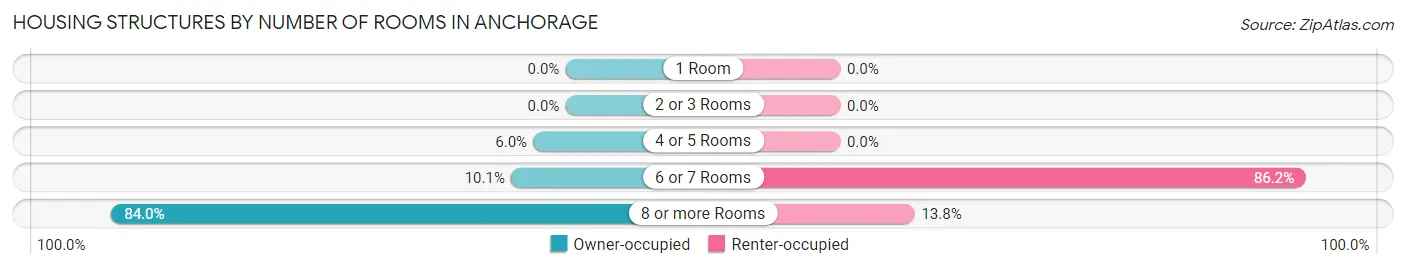
| Number of Rooms | Owner-occupied | Renter-occupied |
| 1 Room | 0 (0.0%) | 0 (0.0%) |
| 2 or 3 Rooms | 0 (0.0%) | 0 (0.0%) |
| 4 or 5 Rooms | 45 (6.0%) | 0 (0.0%) |
| 6 or 7 Rooms | 76 (10.1%) | 50 (86.2%) |
| 8 or more Rooms | 633 (84.0%) | 8 (13.8%) |
| Total | 754 (100.0%) | 58 (100.0%) |
Housing Structure by Heating Type in Anchorage
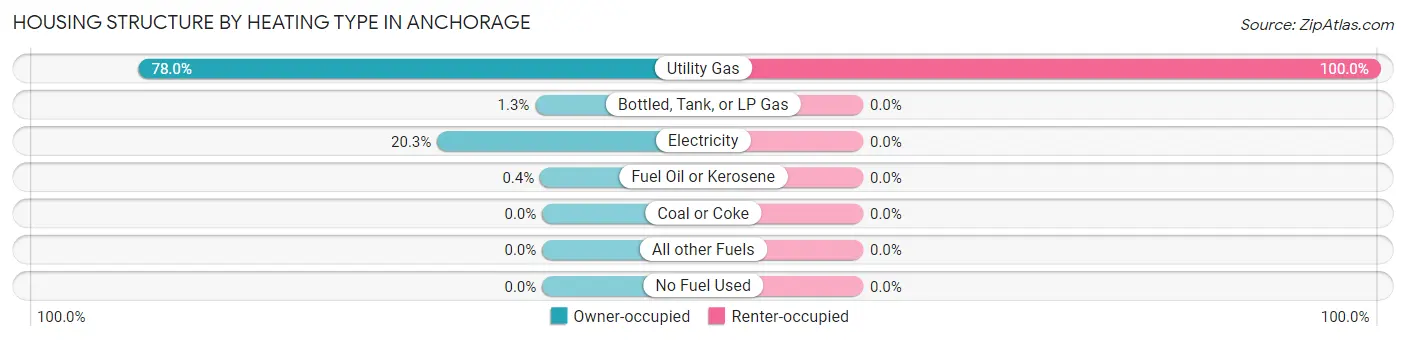
| Heating Type | Owner-occupied | Renter-occupied |
| Utility Gas | 588 (78.0%) | 58 (100.0%) |
| Bottled, Tank, or LP Gas | 10 (1.3%) | 0 (0.0%) |
| Electricity | 153 (20.3%) | 0 (0.0%) |
| Fuel Oil or Kerosene | 3 (0.4%) | 0 (0.0%) |
| Coal or Coke | 0 (0.0%) | 0 (0.0%) |
| All other Fuels | 0 (0.0%) | 0 (0.0%) |
| No Fuel Used | 0 (0.0%) | 0 (0.0%) |
| Total | 754 (100.0%) | 58 (100.0%) |
Household Vehicle Usage in Anchorage
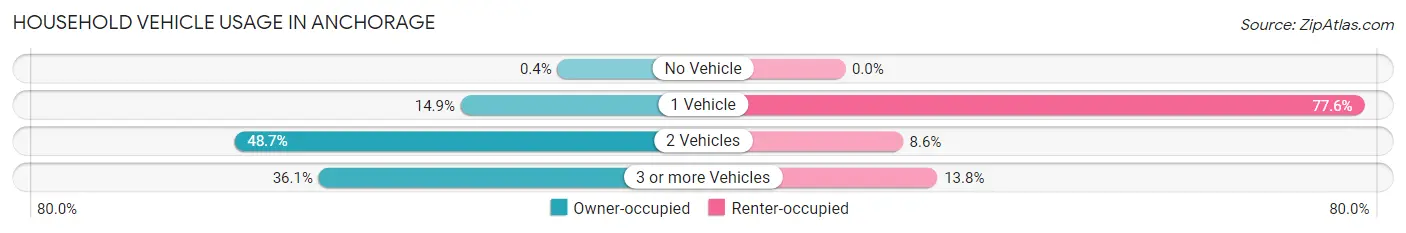
| Vehicles per Household | Owner-occupied | Renter-occupied |
| No Vehicle | 3 (0.4%) | 0 (0.0%) |
| 1 Vehicle | 112 (14.8%) | 45 (77.6%) |
| 2 Vehicles | 367 (48.7%) | 5 (8.6%) |
| 3 or more Vehicles | 272 (36.1%) | 8 (13.8%) |
| Total | 754 (100.0%) | 58 (100.0%) |
Real Estate & Mortgages in Anchorage
Real Estate and Mortgage Overview in Anchorage
| Characteristic | Without Mortgage | With Mortgage |
| Housing Units | 225 | 529 |
| Median Property Value | $667,100 | $801,500 |
| Median Household Income | $129,821 | $375 |
| Monthly Housing Costs | $1,175 | $337 |
| Real Estate Taxes | $7,196 | $3 |
Property Value by Mortgage Status in Anchorage
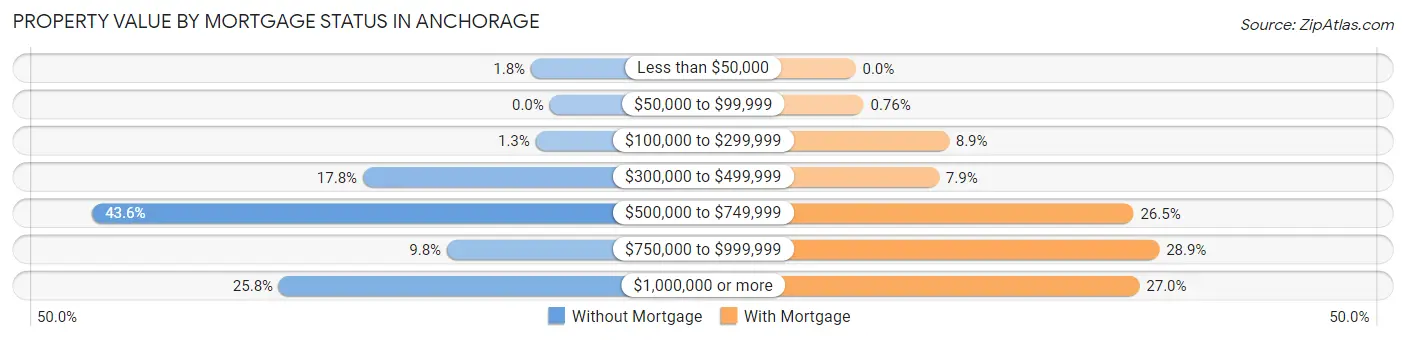
| Property Value | Without Mortgage | With Mortgage |
| Less than $50,000 | 4 (1.8%) | 0 (0.0%) |
| $50,000 to $99,999 | 0 (0.0%) | 4 (0.8%) |
| $100,000 to $299,999 | 3 (1.3%) | 47 (8.9%) |
| $300,000 to $499,999 | 40 (17.8%) | 42 (7.9%) |
| $500,000 to $749,999 | 98 (43.6%) | 140 (26.5%) |
| $750,000 to $999,999 | 22 (9.8%) | 153 (28.9%) |
| $1,000,000 or more | 58 (25.8%) | 143 (27.0%) |
| Total | 225 (100.0%) | 529 (100.0%) |
Household Income by Mortgage Status in Anchorage
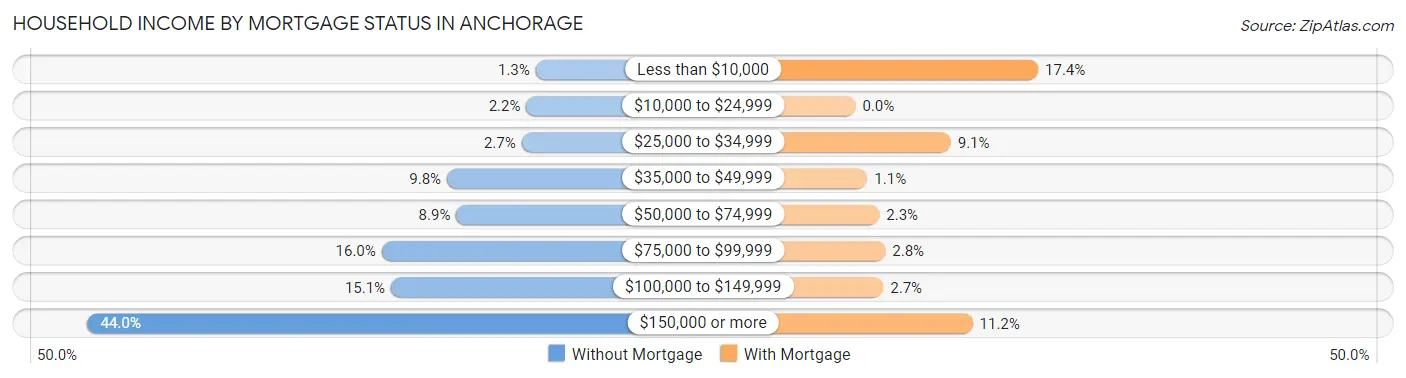
| Household Income | Without Mortgage | With Mortgage |
| Less than $10,000 | 3 (1.3%) | 92 (17.4%) |
| $10,000 to $24,999 | 5 (2.2%) | 0 (0.0%) |
| $25,000 to $34,999 | 6 (2.7%) | 48 (9.1%) |
| $35,000 to $49,999 | 22 (9.8%) | 6 (1.1%) |
| $50,000 to $74,999 | 20 (8.9%) | 12 (2.3%) |
| $75,000 to $99,999 | 36 (16.0%) | 15 (2.8%) |
| $100,000 to $149,999 | 34 (15.1%) | 14 (2.6%) |
| $150,000 or more | 99 (44.0%) | 59 (11.2%) |
| Total | 225 (100.0%) | 529 (100.0%) |
Property Value to Household Income Ratio in Anchorage
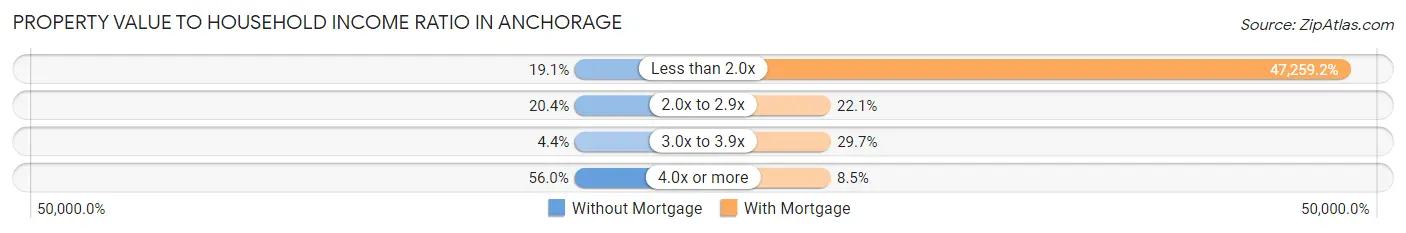
| Value-to-Income Ratio | Without Mortgage | With Mortgage |
| Less than 2.0x | 43 (19.1%) | 250,001 (47,259.2%) |
| 2.0x to 2.9x | 46 (20.4%) | 117 (22.1%) |
| 3.0x to 3.9x | 10 (4.4%) | 157 (29.7%) |
| 4.0x or more | 126 (56.0%) | 45 (8.5%) |
| Total | 225 (100.0%) | 529 (100.0%) |
Real Estate Taxes by Mortgage Status in Anchorage
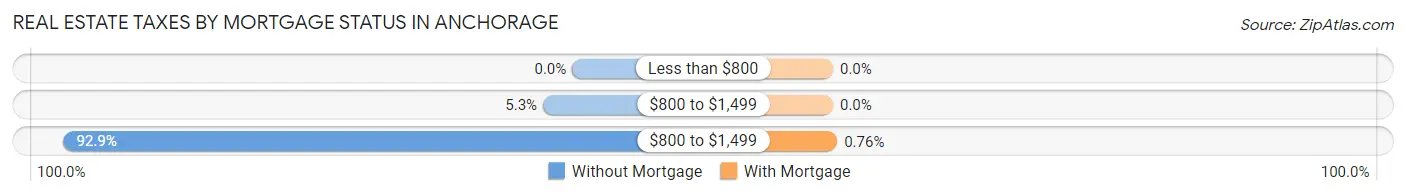
| Property Taxes | Without Mortgage | With Mortgage |
| Less than $800 | 0 (0.0%) | 0 (0.0%) |
| $800 to $1,499 | 12 (5.3%) | 0 (0.0%) |
| $800 to $1,499 | 209 (92.9%) | 4 (0.8%) |
| Total | 225 (100.0%) | 529 (100.0%) |
Health & Disability in Anchorage
Health Insurance Coverage by Age in Anchorage
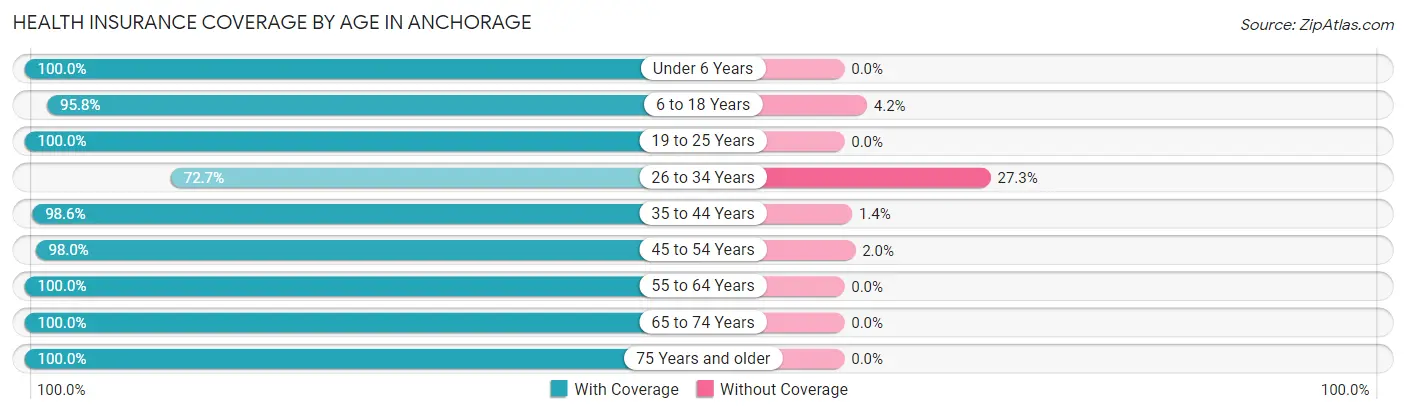
| Age Bracket | With Coverage | Without Coverage |
| Under 6 Years | 107 (100.0%) | 0 (0.0%) |
| 6 to 18 Years | 637 (95.8%) | 28 (4.2%) |
| 19 to 25 Years | 206 (100.0%) | 0 (0.0%) |
| 26 to 34 Years | 64 (72.7%) | 24 (27.3%) |
| 35 to 44 Years | 275 (98.6%) | 4 (1.4%) |
| 45 to 54 Years | 289 (98.0%) | 6 (2.0%) |
| 55 to 64 Years | 422 (100.0%) | 0 (0.0%) |
| 65 to 74 Years | 204 (100.0%) | 0 (0.0%) |
| 75 Years and older | 134 (100.0%) | 0 (0.0%) |
| Total | 2,338 (97.4%) | 62 (2.6%) |
Health Insurance Coverage by Citizenship Status in Anchorage
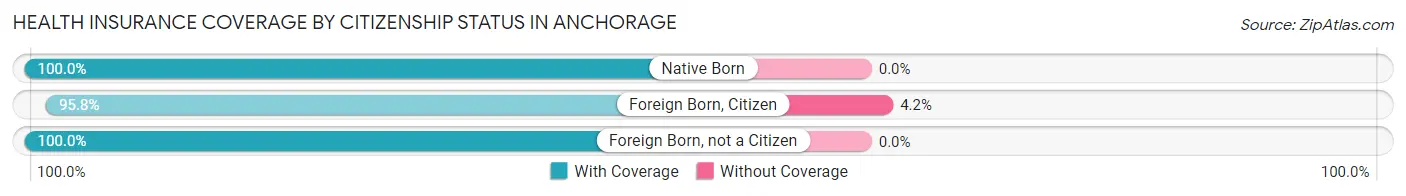
| Citizenship Status | With Coverage | Without Coverage |
| Native Born | 107 (100.0%) | 0 (0.0%) |
| Foreign Born, Citizen | 637 (95.8%) | 28 (4.2%) |
| Foreign Born, not a Citizen | 206 (100.0%) | 0 (0.0%) |
Health Insurance Coverage by Household Income in Anchorage
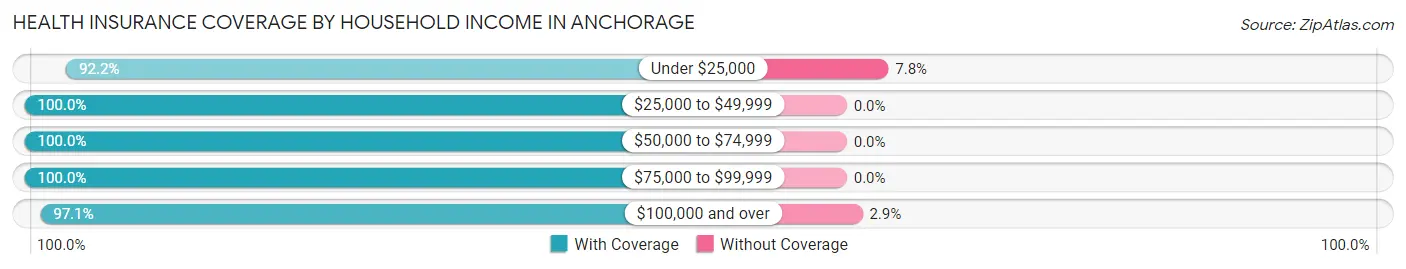
| Household Income | With Coverage | Without Coverage |
| Under $25,000 | 71 (92.2%) | 6 (7.8%) |
| $25,000 to $49,999 | 164 (100.0%) | 0 (0.0%) |
| $50,000 to $74,999 | 129 (100.0%) | 0 (0.0%) |
| $75,000 to $99,999 | 128 (100.0%) | 0 (0.0%) |
| $100,000 and over | 1,846 (97.1%) | 56 (2.9%) |
Public vs Private Health Insurance Coverage by Age in Anchorage
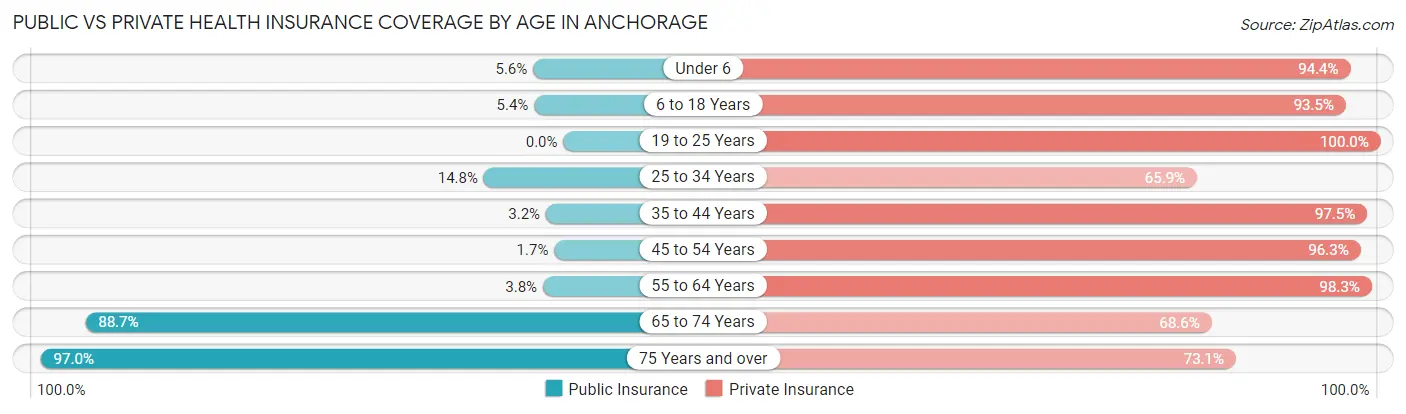
| Age Bracket | Public Insurance | Private Insurance |
| Under 6 | 6 (5.6%) | 101 (94.4%) |
| 6 to 18 Years | 36 (5.4%) | 622 (93.5%) |
| 19 to 25 Years | 0 (0.0%) | 206 (100.0%) |
| 25 to 34 Years | 13 (14.8%) | 58 (65.9%) |
| 35 to 44 Years | 9 (3.2%) | 272 (97.5%) |
| 45 to 54 Years | 5 (1.7%) | 284 (96.3%) |
| 55 to 64 Years | 16 (3.8%) | 415 (98.3%) |
| 65 to 74 Years | 181 (88.7%) | 140 (68.6%) |
| 75 Years and over | 130 (97.0%) | 98 (73.1%) |
| Total | 396 (16.5%) | 2,196 (91.5%) |
Disability Status by Sex by Age in Anchorage
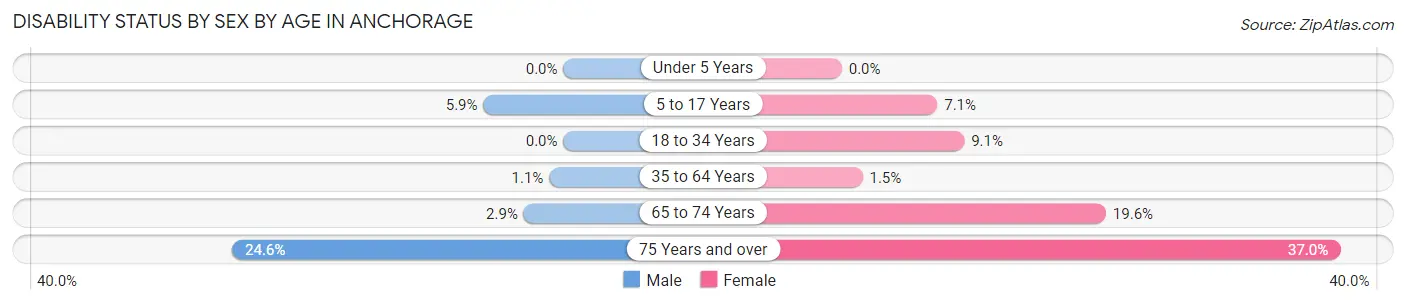
| Age Bracket | Male | Female |
| Under 5 Years | 0 (0.0%) | 0 (0.0%) |
| 5 to 17 Years | 17 (5.9%) | 28 (7.1%) |
| 18 to 34 Years | 0 (0.0%) | 7 (9.1%) |
| 35 to 64 Years | 5 (1.1%) | 8 (1.5%) |
| 65 to 74 Years | 3 (2.9%) | 20 (19.6%) |
| 75 Years and over | 15 (24.6%) | 27 (37.0%) |
Disability Class by Sex by Age in Anchorage
Disability Class: Hearing Difficulty

| Age Bracket | Male | Female |
| Under 5 Years | 0 (0.0%) | 0 (0.0%) |
| 5 to 17 Years | 0 (0.0%) | 0 (0.0%) |
| 18 to 34 Years | 0 (0.0%) | 0 (0.0%) |
| 35 to 64 Years | 0 (0.0%) | 0 (0.0%) |
| 65 to 74 Years | 0 (0.0%) | 4 (3.9%) |
| 75 Years and over | 12 (19.7%) | 13 (17.8%) |
Disability Class: Vision Difficulty
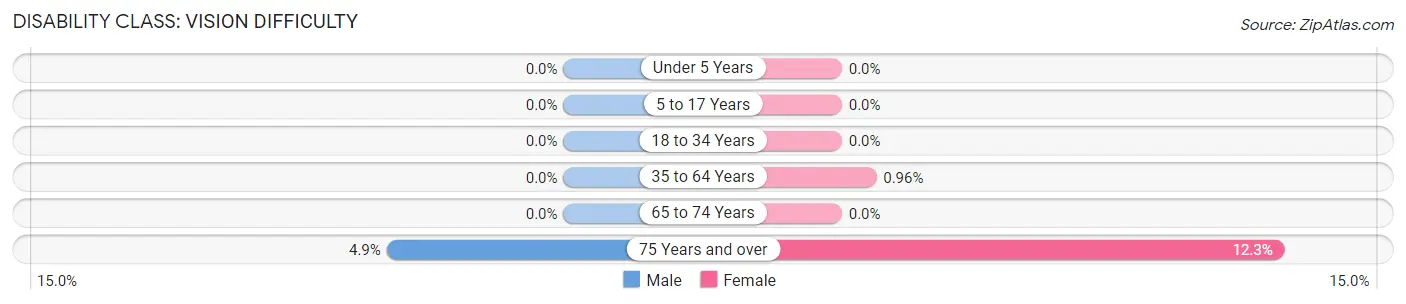
| Age Bracket | Male | Female |
| Under 5 Years | 0 (0.0%) | 0 (0.0%) |
| 5 to 17 Years | 0 (0.0%) | 0 (0.0%) |
| 18 to 34 Years | 0 (0.0%) | 0 (0.0%) |
| 35 to 64 Years | 0 (0.0%) | 5 (1.0%) |
| 65 to 74 Years | 0 (0.0%) | 0 (0.0%) |
| 75 Years and over | 3 (4.9%) | 9 (12.3%) |
Disability Class: Cognitive Difficulty
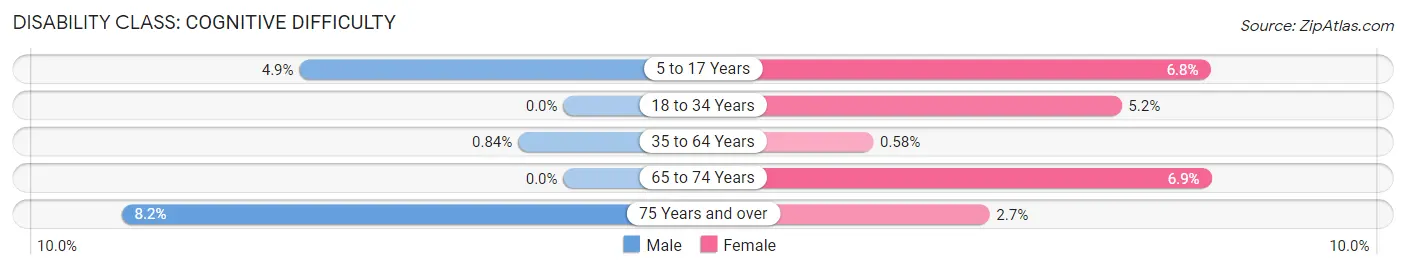
| Age Bracket | Male | Female |
| 5 to 17 Years | 14 (4.9%) | 27 (6.8%) |
| 18 to 34 Years | 0 (0.0%) | 4 (5.2%) |
| 35 to 64 Years | 4 (0.8%) | 3 (0.6%) |
| 65 to 74 Years | 0 (0.0%) | 7 (6.9%) |
| 75 Years and over | 5 (8.2%) | 2 (2.7%) |
Disability Class: Ambulatory Difficulty
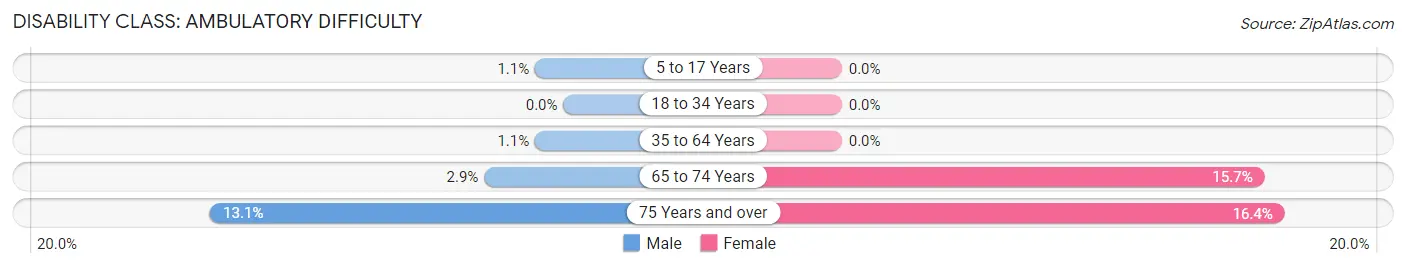
| Age Bracket | Male | Female |
| 5 to 17 Years | 3 (1.1%) | 0 (0.0%) |
| 18 to 34 Years | 0 (0.0%) | 0 (0.0%) |
| 35 to 64 Years | 5 (1.1%) | 0 (0.0%) |
| 65 to 74 Years | 3 (2.9%) | 16 (15.7%) |
| 75 Years and over | 8 (13.1%) | 12 (16.4%) |
Disability Class: Self-Care Difficulty
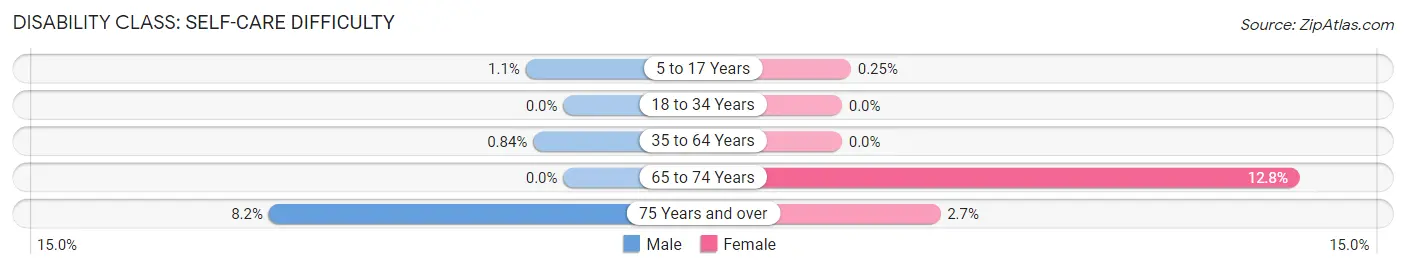
| Age Bracket | Male | Female |
| 5 to 17 Years | 3 (1.1%) | 1 (0.3%) |
| 18 to 34 Years | 0 (0.0%) | 0 (0.0%) |
| 35 to 64 Years | 4 (0.8%) | 0 (0.0%) |
| 65 to 74 Years | 0 (0.0%) | 13 (12.8%) |
| 75 Years and over | 5 (8.2%) | 2 (2.7%) |
Technology Access in Anchorage
Computing Device Access in Anchorage
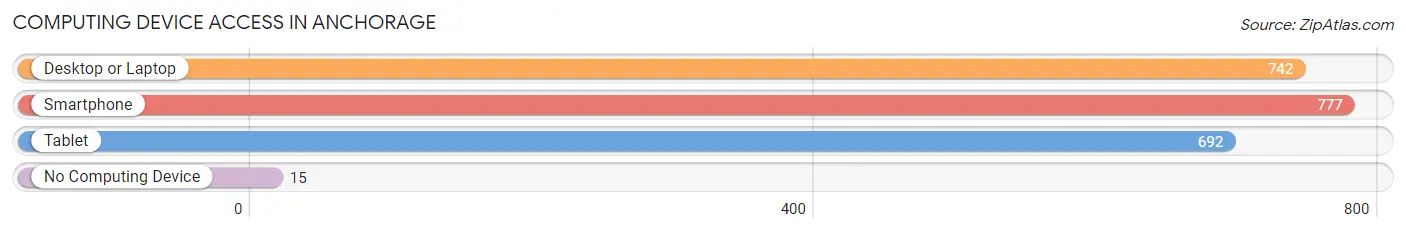
| Device Type | # Households | % Households |
| Desktop or Laptop | 742 | 91.4% |
| Smartphone | 777 | 95.7% |
| Tablet | 692 | 85.2% |
| No Computing Device | 15 | 1.8% |
| Total | 812 | 100.0% |
Internet Access in Anchorage
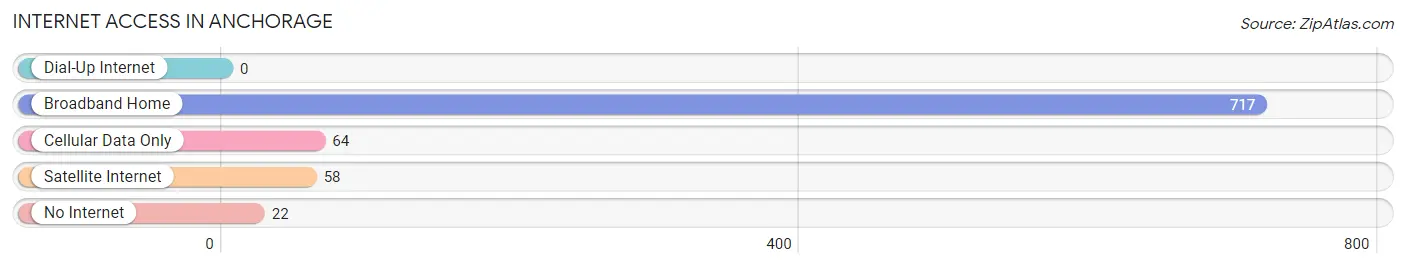
| Internet Type | # Households | % Households |
| Dial-Up Internet | 0 | 0.0% |
| Broadband Home | 717 | 88.3% |
| Cellular Data Only | 64 | 7.9% |
| Satellite Internet | 58 | 7.1% |
| No Internet | 22 | 2.7% |
| Total | 812 | 100.0% |
Anchorage Summary
Anchorage, Kentucky is a small city located in the eastern part of Jefferson County, Kentucky. It is situated on the banks of the Ohio River, just south of Louisville. The city has a population of approximately 2,000 people and is part of the Louisville metropolitan area.
History
Anchorage was founded in 1879 by a group of settlers from the nearby city of Louisville. The city was named after the nearby Anchorage Inn, which was built in 1876. The inn was a popular destination for travelers and was known for its hospitality.
The city was incorporated in 1883 and quickly grew in population. By the early 1900s, Anchorage had become a popular summer resort destination for wealthy families from Louisville. The city was known for its beautiful homes and gardens, as well as its many parks and recreational areas.
In the 1920s, Anchorage began to experience a decline in population as many of its wealthy residents moved away. The city was also affected by the Great Depression, which caused many businesses to close. However, the city was able to recover and by the 1950s, Anchorage had become a popular residential area for middle-class families.
Geography
Anchorage is located in the eastern part of Jefferson County, Kentucky. It is situated on the banks of the Ohio River, just south of Louisville. The city has a total area of 2.2 square miles, all of which is land.
The city is located in a hilly region and is surrounded by forests and rolling hills. The city is also home to several parks and recreational areas, including Anchorage Park, which is located on the banks of the Ohio River.
Economy
Anchorage’s economy is largely based on the service industry. The city is home to several restaurants, retail stores, and other businesses. The city is also home to several manufacturing companies, including a paper mill and a furniture factory.
The city is also home to several educational institutions, including the University of Louisville and Jefferson Community and Technical College.
Demographics
As of the 2010 census, Anchorage had a population of 2,000 people. The racial makeup of the city was 94.2% White, 2.2% African American, 0.2% Native American, 0.8% Asian, 0.2% from other races, and 2.4% from two or more races. Hispanic or Latino of any race were 1.2% of the population.
The median income for a household in Anchorage was $50,000, and the median income for a family was $60,000. The per capita income for the city was $25,000. About 8.2% of families and 10.2% of the population were below the poverty line, including 14.2% of those under age 18 and 6.2% of those age 65 or over.
Anchorage is a small city with a rich history and a diverse population. The city is home to several businesses and educational institutions, and is a popular residential area for middle-class families. The city is also home to several parks and recreational areas, making it a great place to live and visit.
Common Questions
What is the Total Population of Anchorage?
Total Population of Anchorage is 2,419.
What is the Total Male Population of Anchorage?
Total Male Population of Anchorage is 1,191.
What is the Total Female Population of Anchorage?
Total Female Population of Anchorage is 1,228.
What is the Ratio of Males per 100 Females in Anchorage?
There are 96.99 Males per 100 Females in Anchorage.
What is the Ratio of Females per 100 Males in Anchorage?
There are 103.11 Females per 100 Males in Anchorage.
What is the Median Population Age in Anchorage?
Median Population Age in Anchorage is 41.2 Years.
What is the Average Family Size in Anchorage
Average Family Size in Anchorage is 3.3 People.
What is the Average Household Size in Anchorage
Average Household Size in Anchorage is 3.0 People.
What is Per Capita Income in Anchorage?
Per Capita income in Anchorage is $105,317.
What is the Median Family Income in Anchorage?
Median Family Income in Anchorage is $250,001.
What is the Median Household income in Anchorage?
Median Household Income in Anchorage is $202,917.
What is Income or Wage Gap in Anchorage?
Income or Wage Gap in Anchorage is 37.6%.
Women in Anchorage earn 62.4 cents for every dollar earned by a man.
What is Family Income Deficit in Anchorage?
Family Income Deficit in Anchorage is $12,129.
Families that are below poverty line in Anchorage earn $12,129 less on average than the poverty threshold level.
What is Inequality or Gini Index in Anchorage?
Inequality or Gini Index in Anchorage is 0.54.
How Large is the Labor Force in Anchorage?
There are 1,106 People in the Labor Forcein in Anchorage.
What is the Percentage of People in the Labor Force in Anchorage?
64.2% of People are in the Labor Force in Anchorage.
What is the Unemployment Rate in Anchorage?
Unemployment Rate in Anchorage is 6.1%.