Zip Codes with the Highest Percentage of Population Employed in Health Diagnosing & Treating in Louisville, KY
RELATED REPORTS & OPTIONS
Health Diagnosing & Treating
Louisville
Compare Zip Codes
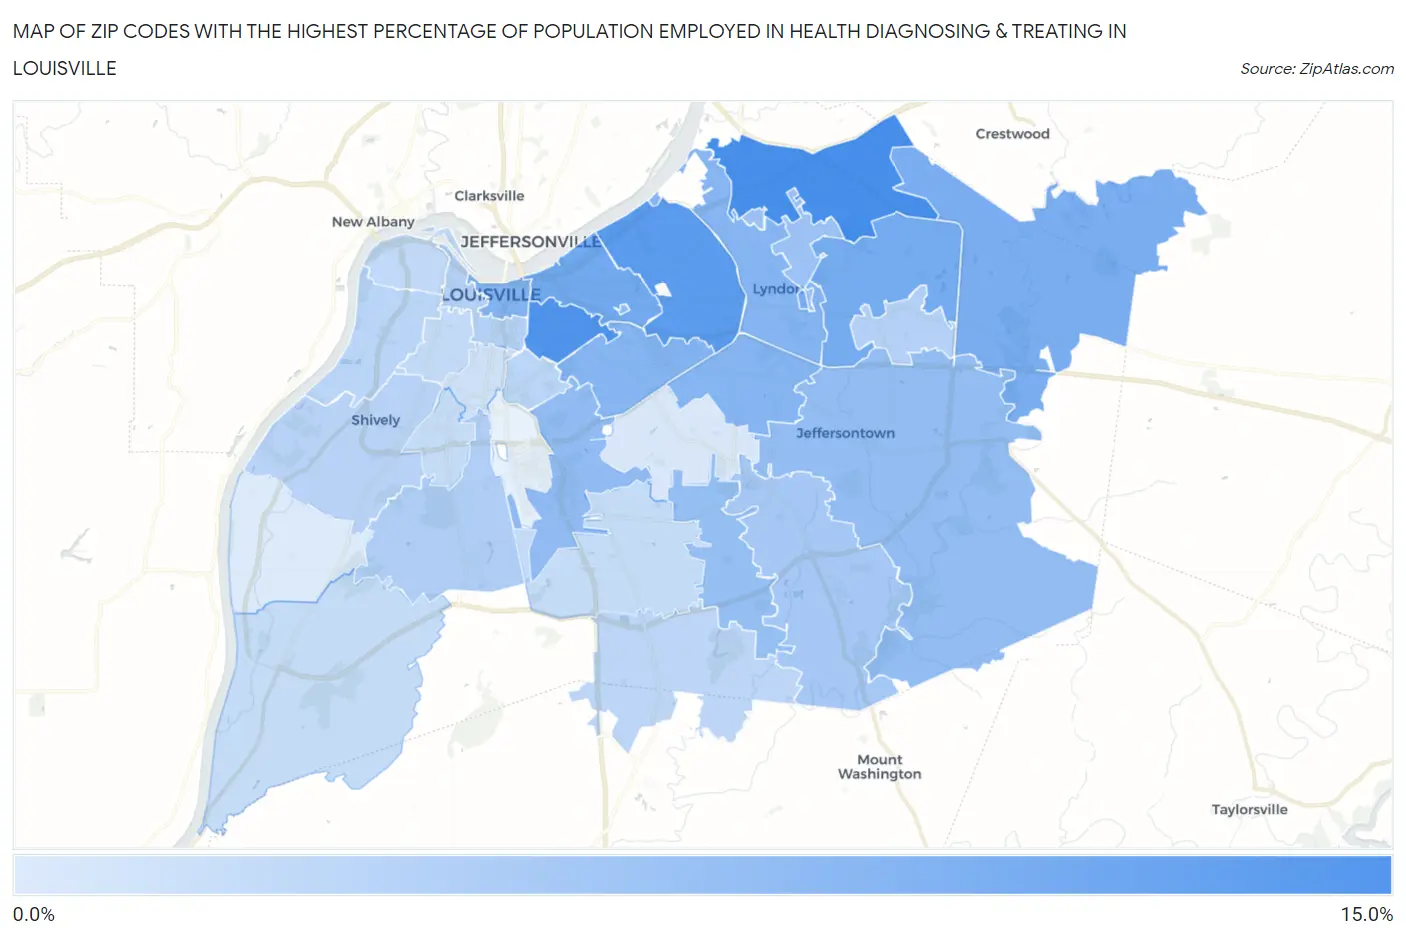
Map of Zip Codes with the Highest Percentage of Population Employed in Health Diagnosing & Treating in Louisville
0.0%
15.0%
Zip Codes with the Highest Percentage of Population Employed in Health Diagnosing & Treating in Louisville, KY
| Zip Code | % Employed | vs State | vs National | |
| 1. | 40241 | 13.4% | 7.2%(+6.19)#86 | 6.2%(+7.15)#1,614 |
| 2. | 40204 | 12.7% | 7.2%(+5.47)#94 | 6.2%(+6.44)#1,873 |
| 3. | 40207 | 11.9% | 7.2%(+4.71)#112 | 6.2%(+5.68)#2,265 |
| 4. | 40206 | 10.3% | 7.2%(+3.11)#144 | 6.2%(+4.08)#3,499 |
| 5. | 40223 | 10.2% | 7.2%(+2.99)#146 | 6.2%(+3.95)#3,644 |
| 6. | 40245 | 9.9% | 7.2%(+2.73)#157 | 6.2%(+3.69)#3,965 |
| 7. | 40202 | 9.2% | 7.2%(+2.01)#185 | 6.2%(+2.98)#4,987 |
| 8. | 40220 | 9.2% | 7.2%(+1.97)#186 | 6.2%(+2.94)#5,054 |
| 9. | 40222 | 9.1% | 7.2%(+1.90)#188 | 6.2%(+2.87)#5,161 |
| 10. | 40205 | 9.1% | 7.2%(+1.85)#190 | 6.2%(+2.82)#5,263 |
| 11. | 40213 | 8.3% | 7.2%(+1.11)#224 | 6.2%(+2.08)#6,721 |
| 12. | 40280 | 8.2% | 7.2%(+1.02)#230 | 6.2%(+1.98)#6,950 |
| 13. | 40299 | 8.1% | 7.2%(+0.892)#238 | 6.2%(+1.86)#7,248 |
| 14. | 40228 | 8.1% | 7.2%(+0.890)#239 | 6.2%(+1.85)#7,256 |
| 15. | 40242 | 7.5% | 7.2%(+0.339)#265 | 6.2%(+1.30)#8,658 |
| 16. | 40291 | 7.0% | 7.2%(-0.247)#302 | 6.2%(+0.718)#10,483 |
| 17. | 40214 | 6.3% | 7.2%(-0.883)#342 | 6.2%(+0.082)#12,671 |
| 18. | 40243 | 6.1% | 7.2%(-1.10)#357 | 6.2%(-0.137)#13,500 |
| 19. | 40203 | 6.0% | 7.2%(-1.22)#362 | 6.2%(-0.251)#13,890 |
| 20. | 40216 | 5.8% | 7.2%(-1.46)#378 | 6.2%(-0.493)#14,791 |
| 21. | 40217 | 5.6% | 7.2%(-1.61)#385 | 6.2%(-0.641)#15,383 |
| 22. | 40211 | 5.5% | 7.2%(-1.67)#387 | 6.2%(-0.702)#15,621 |
| 23. | 40229 | 5.4% | 7.2%(-1.79)#397 | 6.2%(-0.821)#16,076 |
| 24. | 40212 | 5.1% | 7.2%(-2.08)#416 | 6.2%(-1.12)#17,238 |
| 25. | 40210 | 5.0% | 7.2%(-2.17)#423 | 6.2%(-1.20)#17,527 |
| 26. | 40272 | 4.9% | 7.2%(-2.31)#430 | 6.2%(-1.34)#18,084 |
| 27. | 40219 | 4.8% | 7.2%(-2.41)#438 | 6.2%(-1.45)#18,500 |
| 28. | 40215 | 4.8% | 7.2%(-2.44)#442 | 6.2%(-1.47)#18,603 |
| 29. | 40208 | 4.3% | 7.2%(-2.91)#467 | 6.2%(-1.94)#20,335 |
| 30. | 40218 | 3.6% | 7.2%(-3.58)#498 | 6.2%(-2.61)#22,510 |
| 31. | 40258 | 3.3% | 7.2%(-3.86)#511 | 6.2%(-2.90)#23,329 |
1
Common Questions
What are the Top 10 Zip Codes with the Highest Percentage of Population Employed in Health Diagnosing & Treating in Louisville, KY?
Top 10 Zip Codes with the Highest Percentage of Population Employed in Health Diagnosing & Treating in Louisville, KY are:
What zip code has the Highest Percentage of Population Employed in Health Diagnosing & Treating in Louisville, KY?
40241 has the Highest Percentage of Population Employed in Health Diagnosing & Treating in Louisville, KY with 13.4%.
What is the Percentage of Population Employed in Health Diagnosing & Treating in Louisville, KY?
Percentage of Population Employed in Health Diagnosing & Treating in Louisville is 7.1%.
What is the Percentage of Population Employed in Health Diagnosing & Treating in Kentucky?
Percentage of Population Employed in Health Diagnosing & Treating in Kentucky is 7.2%.
What is the Percentage of Population Employed in Health Diagnosing & Treating in the United States?
Percentage of Population Employed in Health Diagnosing & Treating in the United States is 6.2%.