Diablock, KY
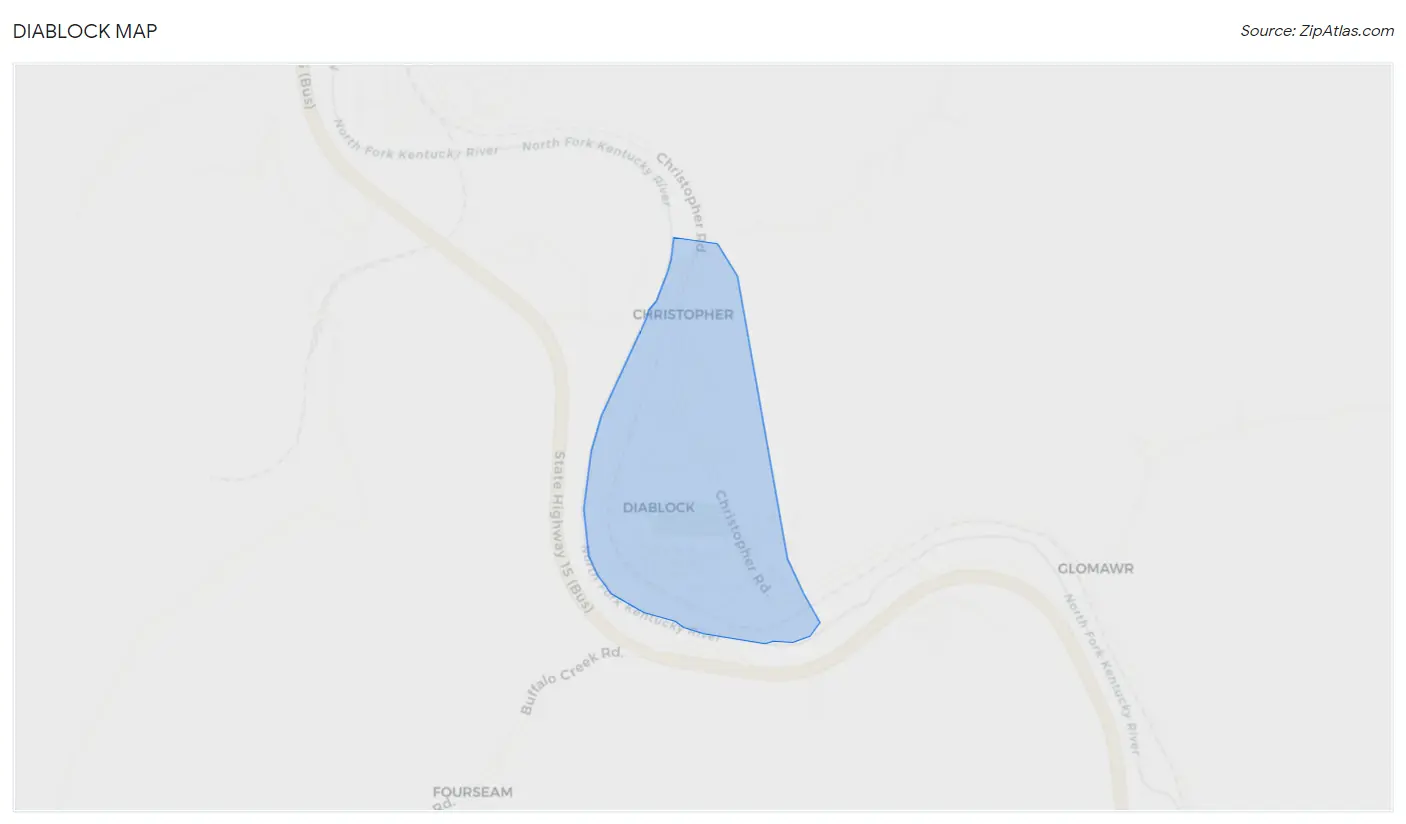
Diablock Map
Diablock Overview
425
TOTAL POPULATION
140
MALE POPULATION
285
FEMALE POPULATION
49.12
MALES / 100 FEMALES
203.57
FEMALES / 100 MALES
41.6
MEDIAN AGE
2.1
AVG FAMILY SIZE
2.2
AVG HOUSEHOLD SIZE
$22,799
PER CAPITA INCOME
$46,660
AVG FAMILY INCOME
$61,119
AVG HOUSEHOLD INCOME
43.1%
WAGE / INCOME GAP [ % ]
56.9¢/ $1
WAGE / INCOME GAP [ $ ]
0.30
INEQUALITY / GINI INDEX
216
LABOR FORCE [ PEOPLE ]
58.9%
PERCENT IN LABOR FORCE
15.3%
UNEMPLOYMENT RATE
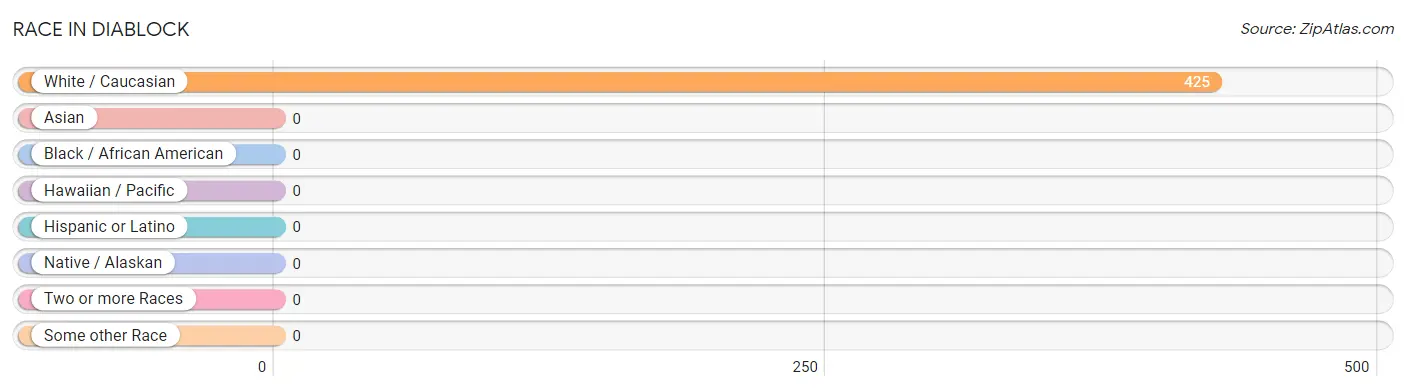
Race in Diablock
The most populous races in Diablock are , and White / Caucasian (425 | 100.0%).
| Race | # Population | % Population |
| Asian | 0 | 0.0% |
| Black / African American | 0 | 0.0% |
| Hawaiian / Pacific | 0 | 0.0% |
| Hispanic or Latino | 0 | 0.0% |
| Native / Alaskan | 0 | 0.0% |
| White / Caucasian | 425 | 100.0% |
| Two or more Races | 0 | 0.0% |
| Some other Race | 0 | 0.0% |
| Total | 425 | 100.0% |
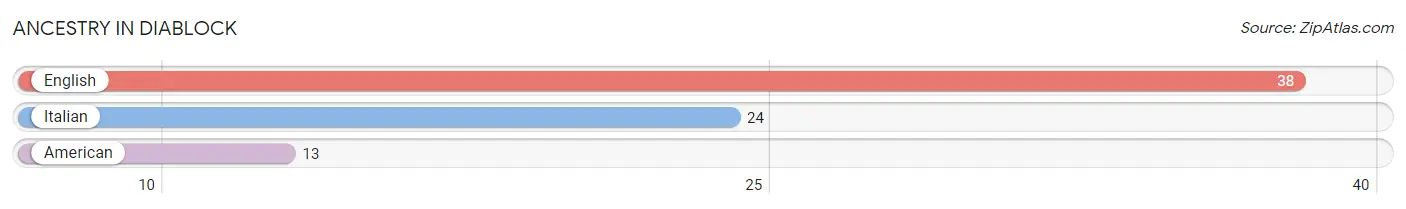
Ancestry in Diablock
The most populous ancestries reported in Diablock are English (38 | 8.9%), Italian (24 | 5.7%), and American (13 | 3.1%), together accounting for 17.6% of all Diablock residents.
| Ancestry | # Population | % Population |
| American | 13 | 3.1% |
| English | 38 | 8.9% |
| Italian | 24 | 5.7% | View All 3 Rows |
Immigrants in Diablock

| Immigration Origin | # Population | % Population | View All 0 Rows |
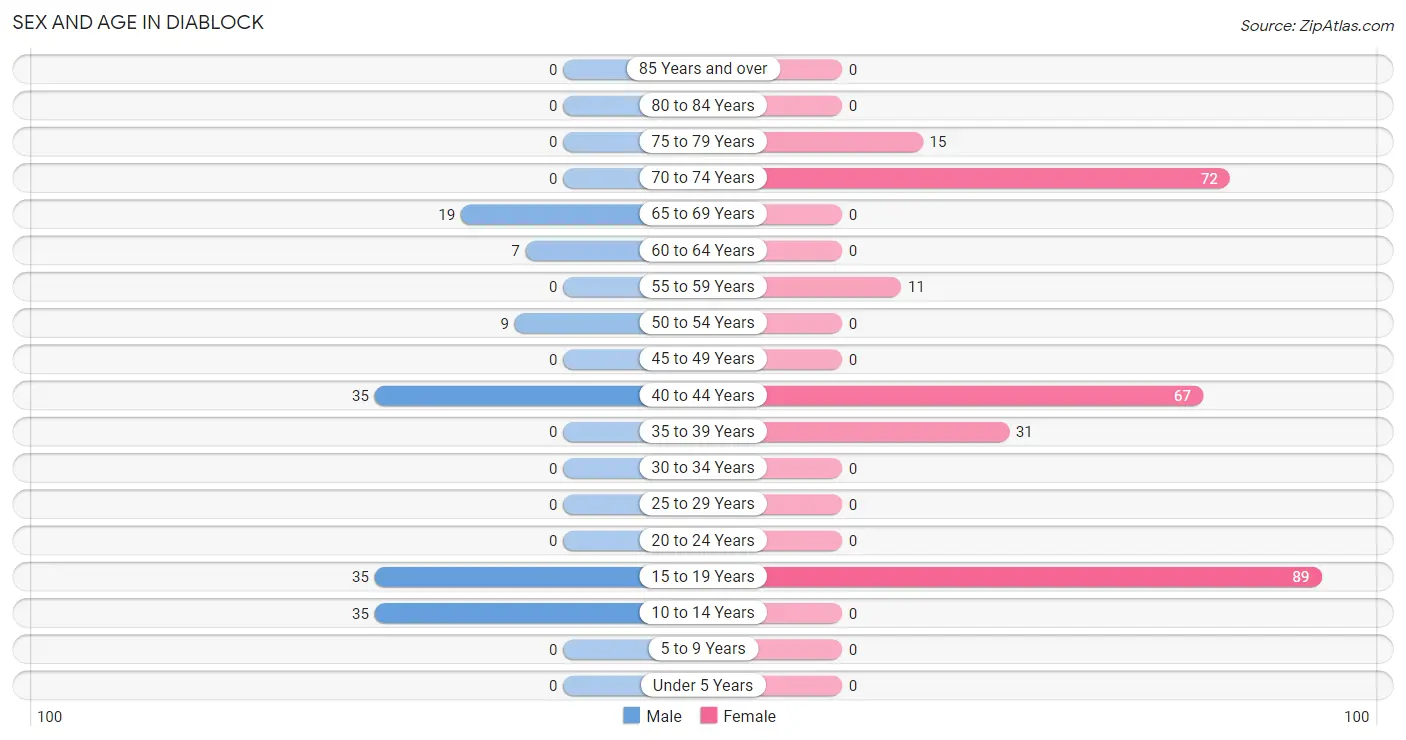
Sex and Age in Diablock
Sex and Age in Diablock
The most populous age groups in Diablock are 10 to 14 Years (35 | 25.0%) for men and 15 to 19 Years (89 | 31.2%) for women.
| Age Bracket | Male | Female |
| Under 5 Years | 0 (0.0%) | 0 (0.0%) |
| 5 to 9 Years | 0 (0.0%) | 0 (0.0%) |
| 10 to 14 Years | 35 (25.0%) | 0 (0.0%) |
| 15 to 19 Years | 35 (25.0%) | 89 (31.2%) |
| 20 to 24 Years | 0 (0.0%) | 0 (0.0%) |
| 25 to 29 Years | 0 (0.0%) | 0 (0.0%) |
| 30 to 34 Years | 0 (0.0%) | 0 (0.0%) |
| 35 to 39 Years | 0 (0.0%) | 31 (10.9%) |
| 40 to 44 Years | 35 (25.0%) | 67 (23.5%) |
| 45 to 49 Years | 0 (0.0%) | 0 (0.0%) |
| 50 to 54 Years | 9 (6.4%) | 0 (0.0%) |
| 55 to 59 Years | 0 (0.0%) | 11 (3.9%) |
| 60 to 64 Years | 7 (5.0%) | 0 (0.0%) |
| 65 to 69 Years | 19 (13.6%) | 0 (0.0%) |
| 70 to 74 Years | 0 (0.0%) | 72 (25.3%) |
| 75 to 79 Years | 0 (0.0%) | 15 (5.3%) |
| 80 to 84 Years | 0 (0.0%) | 0 (0.0%) |
| 85 Years and over | 0 (0.0%) | 0 (0.0%) |
| Total | 140 (100.0%) | 285 (100.0%) |
Families and Households in Diablock
Median Family Size in Diablock
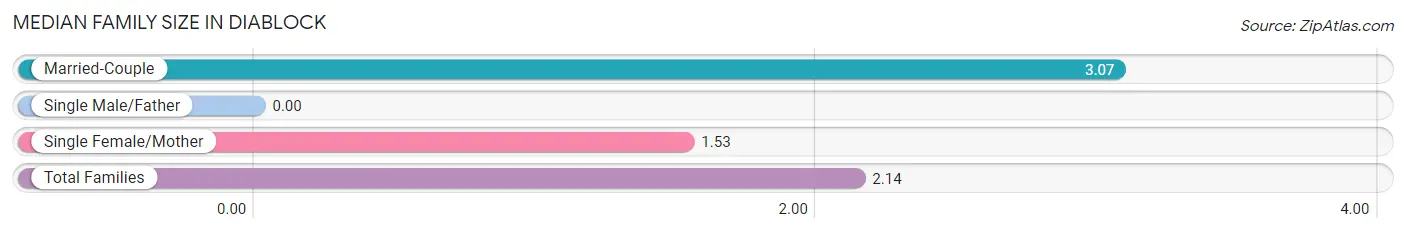
| Family Type | # Families | Family Size |
| Married-Couple | 57 (39.3%) | 3.07 |
| Single Male/Father | 0 (0.0%) | - |
| Single Female/Mother | 88 (60.7%) | 1.53 |
| Total Families | 145 (100.0%) | 2.14 |
Median Household Size in Diablock
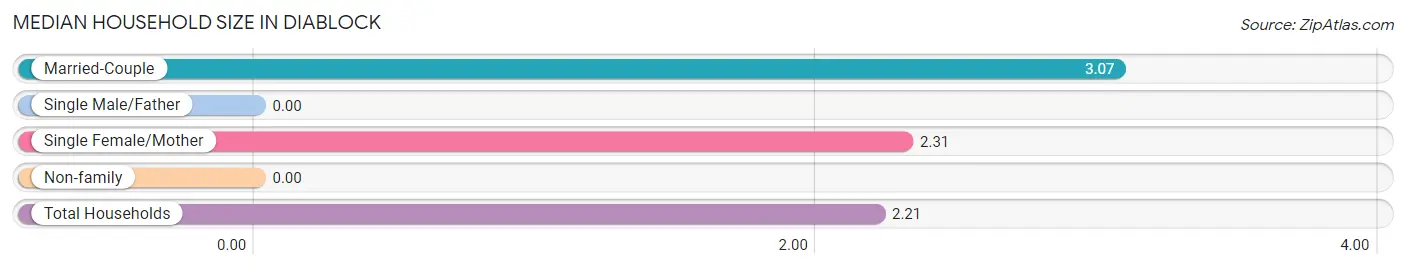
| Household Type | # Households | Household Size |
| Married-Couple | 57 (29.7%) | 3.07 |
| Single Male/Father | 0 (0.0%) | - |
| Single Female/Mother | 88 (45.8%) | 2.31 |
| Non-family | 47 (24.5%) | - |
| Total Households | 192 (100.0%) | 2.21 |
Household Size by Marriage Status in Diablock
Out of a total of 192 households in Diablock, 145 (75.5%) are family households, while 47 (24.5%) are nonfamily households. The most numerous type of family households are 4-person households, comprising 98, and the most common type of nonfamily households are 1-person households, comprising 47.
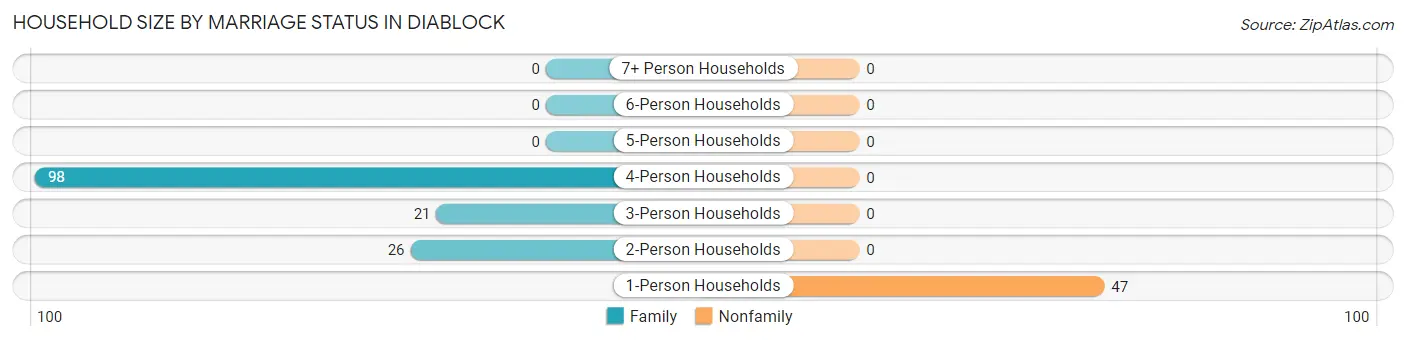
| Household Size | Family Households | Nonfamily Households |
| 1-Person Households | - | 47 (24.5%) |
| 2-Person Households | 26 (13.5%) | 0 (0.0%) |
| 3-Person Households | 21 (10.9%) | 0 (0.0%) |
| 4-Person Households | 98 (51.0%) | 0 (0.0%) |
| 5-Person Households | 0 (0.0%) | 0 (0.0%) |
| 6-Person Households | 0 (0.0%) | 0 (0.0%) |
| 7+ Person Households | 0 (0.0%) | 0 (0.0%) |
| Total | 145 (75.5%) | 47 (24.5%) |
Female Fertility in Diablock
Fertility by Age in Diablock
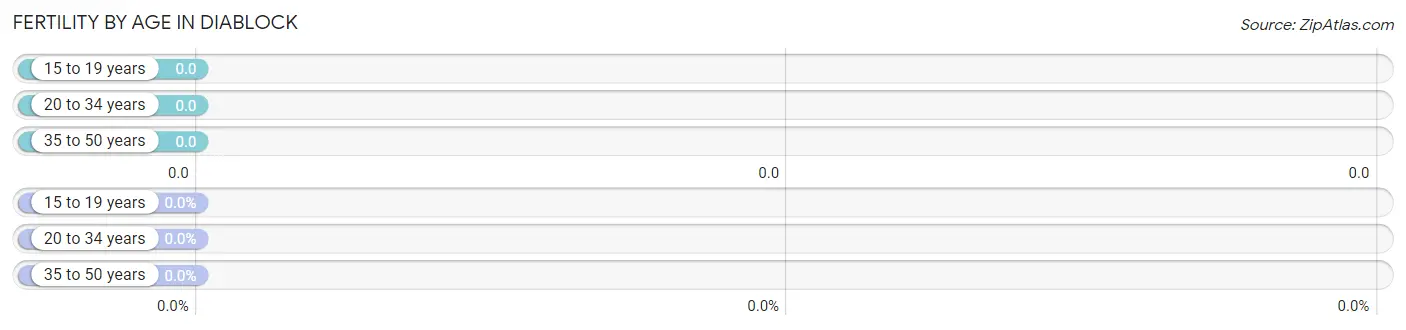
| Age Bracket | Women with Births | Births / 1,000 Women |
| 15 to 19 years | 0 (0.0%) | 0.0 |
| 20 to 34 years | 0 (0.0%) | 0.0 |
| 35 to 50 years | 0 (0.0%) | 0.0 |
| Total | 0 (0.0%) | 0.0 |
Fertility by Age by Marriage Status in Diablock
| Age Bracket | Married | Unmarried |
| 15 to 19 years | 0 (0.0%) | 0 (0.0%) |
| 20 to 34 years | 0 (0.0%) | 0 (0.0%) |
| 35 to 50 years | 0 (0.0%) | 0 (0.0%) |
| Total | 0 (0.0%) | 0 (0.0%) |
Fertility by Education in Diablock
| Educational Attainment | Women with Births | Births / 1,000 Women |
| Less than High School | 0 (0.0%) | 0.0 |
| High School Diploma | 0 (0.0%) | 0.0 |
| College or Associate's Degree | 0 (0.0%) | 0.0 |
| Bachelor's Degree | 0 (0.0%) | 0.0 |
| Graduate Degree | 0 (0.0%) | 0.0 |
| Total | 0 (0.0%) | 0.0 |
Fertility by Education by Marriage Status in Diablock
| Educational Attainment | Married | Unmarried |
| Less than High School | 0 (0.0%) | 0 (0.0%) |
| High School Diploma | 0 (0.0%) | 0 (0.0%) |
| College or Associate's Degree | 0 (0.0%) | 0 (0.0%) |
| Bachelor's Degree | 0 (0.0%) | 0 (0.0%) |
| Graduate Degree | 0 (0.0%) | 0 (0.0%) |
| Total | 0 (0.0%) | 0 (0.0%) |
Income in Diablock
Income Overview in Diablock
Per Capita Income in Diablock is $22,799, while median incomes of families and households are $46,660 and $61,119 respectively.
| Characteristic | Number | Measure |
| Per Capita Income | 425 | $22,799 |
| Median Family Income | 145 | $46,660 |
| Mean Family Income | 145 | $54,186 |
| Median Household Income | 192 | $61,119 |
| Mean Household Income | 192 | $54,171 |
| Income Deficit | 145 | $0 |
| Wage / Income Gap (%) | 425 | 43.06% |
| Wage / Income Gap ($) | 425 | 56.94¢ per $1 |
| Gini / Inequality Index | 425 | 0.30 |
Earnings by Sex in Diablock
Average Earnings in Diablock are $29,286, $26,250 for men and $46,101 for women, a difference of 43.1%.
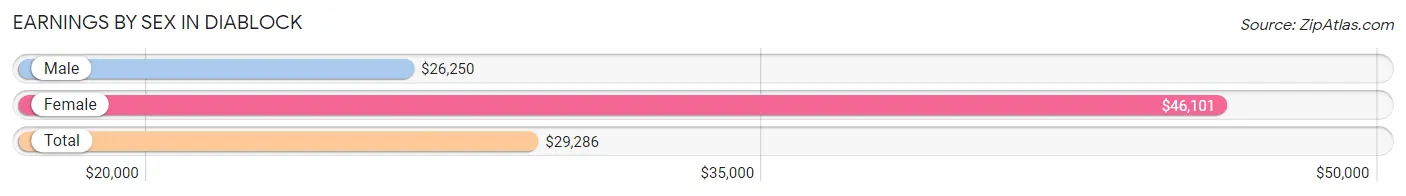
| Sex | Number | Average Earnings |
| Male | 79 (36.6%) | $26,250 |
| Female | 137 (63.4%) | $46,101 |
| Total | 216 (100.0%) | $29,286 |
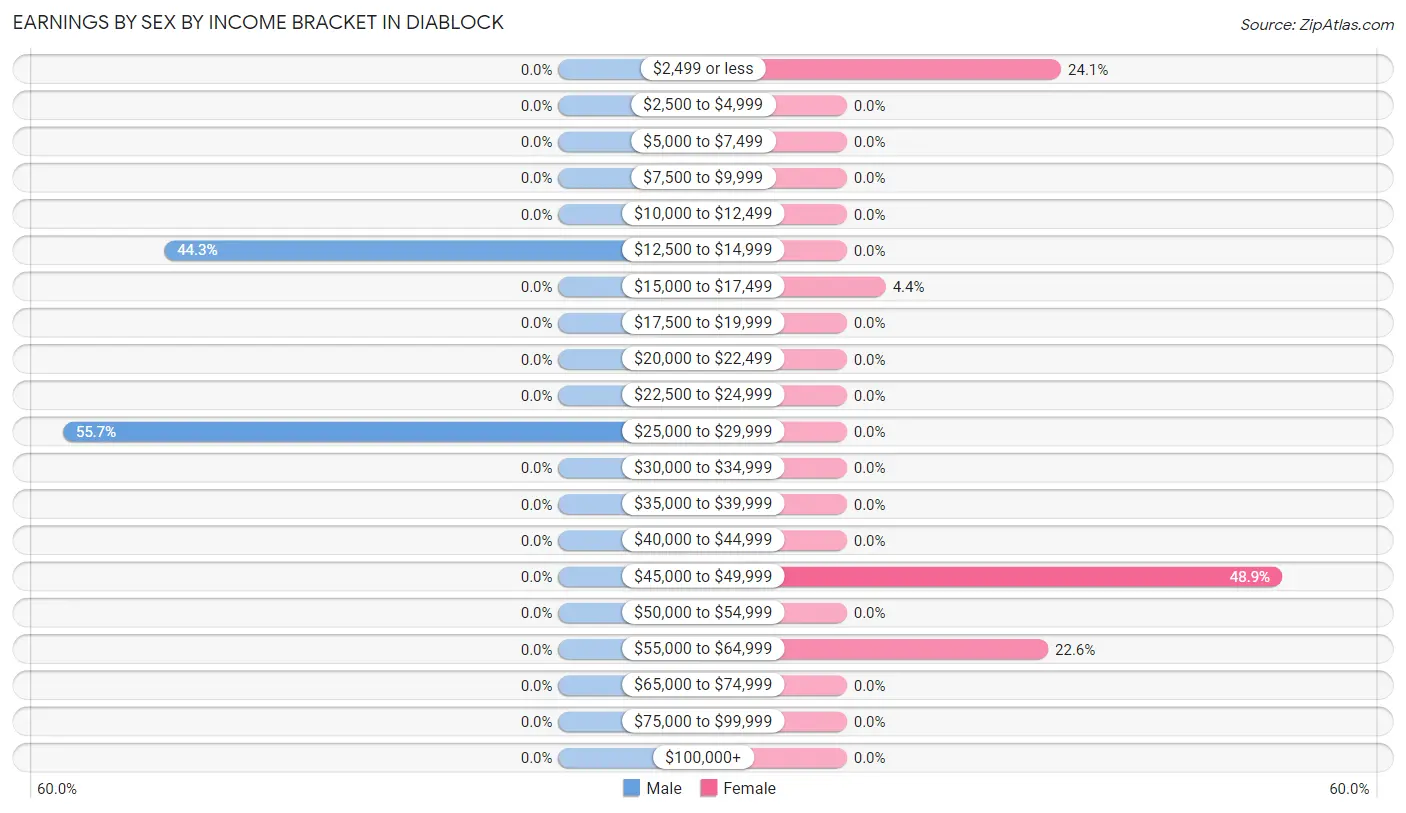
Earnings by Sex by Income Bracket in Diablock
The most common earnings brackets in Diablock are $25,000 to $29,999 for men (44 | 55.7%) and $45,000 to $49,999 for women (67 | 48.9%).
| Income | Male | Female |
| $2,499 or less | 0 (0.0%) | 33 (24.1%) |
| $2,500 to $4,999 | 0 (0.0%) | 0 (0.0%) |
| $5,000 to $7,499 | 0 (0.0%) | 0 (0.0%) |
| $7,500 to $9,999 | 0 (0.0%) | 0 (0.0%) |
| $10,000 to $12,499 | 0 (0.0%) | 0 (0.0%) |
| $12,500 to $14,999 | 35 (44.3%) | 0 (0.0%) |
| $15,000 to $17,499 | 0 (0.0%) | 6 (4.4%) |
| $17,500 to $19,999 | 0 (0.0%) | 0 (0.0%) |
| $20,000 to $22,499 | 0 (0.0%) | 0 (0.0%) |
| $22,500 to $24,999 | 0 (0.0%) | 0 (0.0%) |
| $25,000 to $29,999 | 44 (55.7%) | 0 (0.0%) |
| $30,000 to $34,999 | 0 (0.0%) | 0 (0.0%) |
| $35,000 to $39,999 | 0 (0.0%) | 0 (0.0%) |
| $40,000 to $44,999 | 0 (0.0%) | 0 (0.0%) |
| $45,000 to $49,999 | 0 (0.0%) | 67 (48.9%) |
| $50,000 to $54,999 | 0 (0.0%) | 0 (0.0%) |
| $55,000 to $64,999 | 0 (0.0%) | 31 (22.6%) |
| $65,000 to $74,999 | 0 (0.0%) | 0 (0.0%) |
| $75,000 to $99,999 | 0 (0.0%) | 0 (0.0%) |
| $100,000+ | 0 (0.0%) | 0 (0.0%) |
| Total | 79 (100.0%) | 137 (100.0%) |
Earnings by Sex by Educational Attainment in Diablock
| Educational Attainment | Male Income | Female Income |
| Less than High School | - | - |
| High School Diploma | - | - |
| College or Associate's Degree | - | - |
| Bachelor's Degree | - | - |
| Graduate Degree | - | - |
| Total | - | - |
Family Income in Diablock
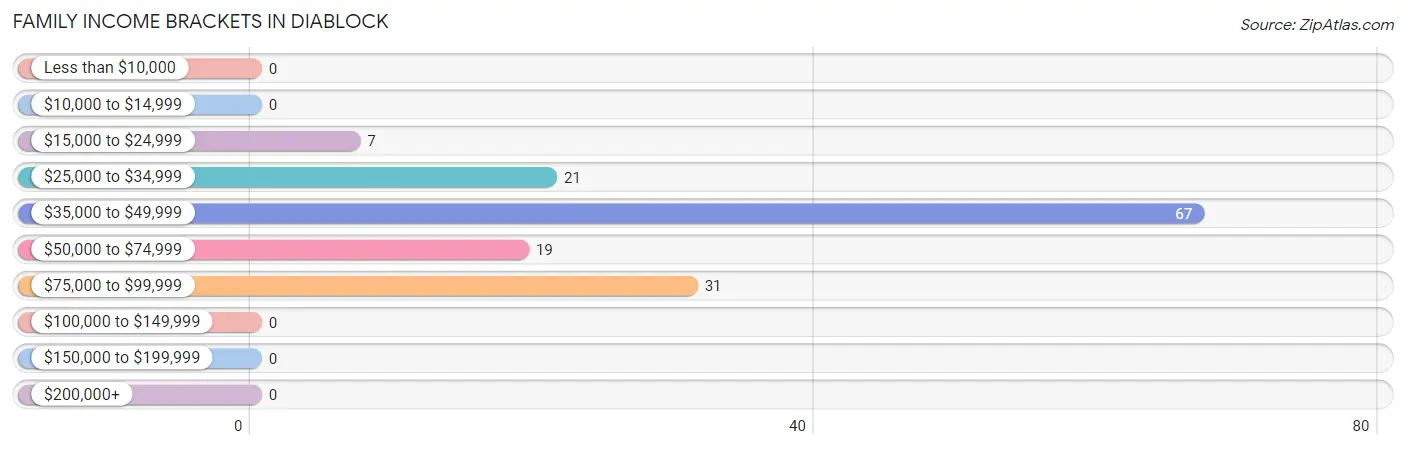
Family Income Brackets in Diablock
According to the Diablock family income data, there are 67 families falling into the $35,000 to $49,999 income range, which is the most common income bracket and makes up 46.2% of all families.
| Income Bracket | # Families | % Families |
| Less than $10,000 | 0 | 0.0% |
| $10,000 to $14,999 | 0 | 0.0% |
| $15,000 to $24,999 | 7 | 4.8% |
| $25,000 to $34,999 | 21 | 14.5% |
| $35,000 to $49,999 | 67 | 46.2% |
| $50,000 to $74,999 | 19 | 13.1% |
| $75,000 to $99,999 | 31 | 21.4% |
| $100,000 to $149,999 | 0 | 0.0% |
| $150,000 to $199,999 | 0 | 0.0% |
| $200,000+ | 0 | 0.0% |
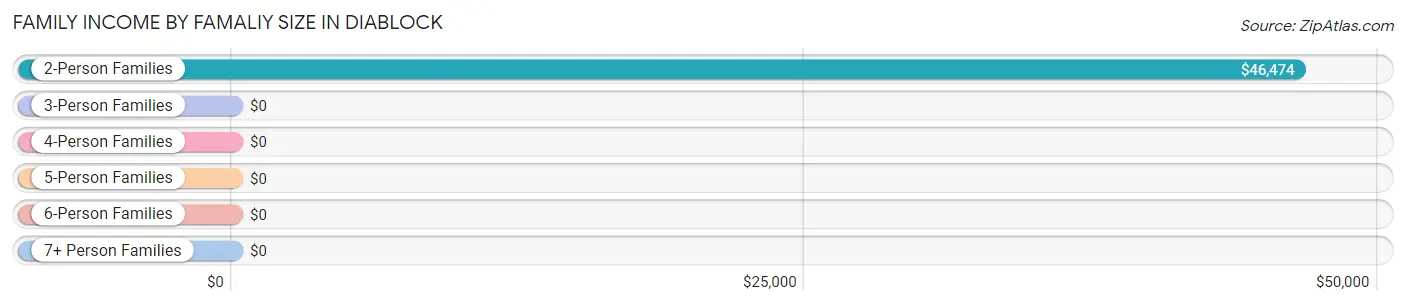
Family Income by Famaliy Size in Diablock
2-person families (93 | 64.1%) account for the highest median family income in Diablock with $46,474 per family, while 2-person families (93 | 64.1%) have the highest median income of $23,237 per family member.
| Income Bracket | # Families | Median Income |
| 2-Person Families | 93 (64.1%) | $46,474 |
| 3-Person Families | 21 (14.5%) | $0 |
| 4-Person Families | 31 (21.4%) | $0 |
| 5-Person Families | 0 (0.0%) | $0 |
| 6-Person Families | 0 (0.0%) | $0 |
| 7+ Person Families | 0 (0.0%) | $0 |
| Total | 145 (100.0%) | $46,660 |
Family Income by Number of Earners in Diablock
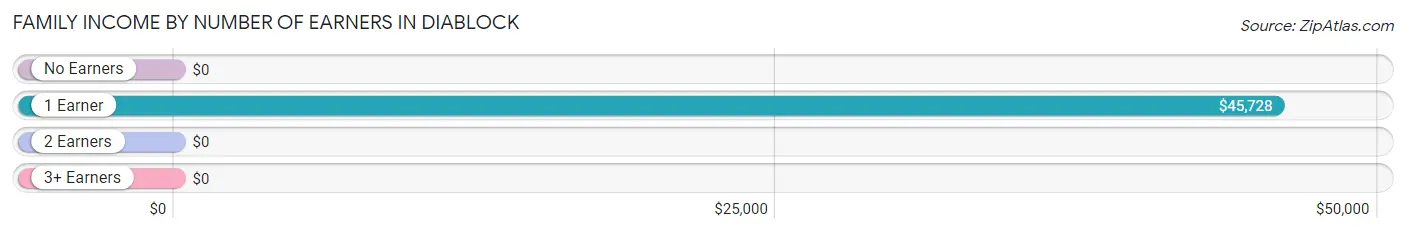
| Number of Earners | # Families | Median Income |
| No Earners | 19 (13.1%) | $0 |
| 1 Earner | 95 (65.5%) | $45,728 |
| 2 Earners | 31 (21.4%) | $0 |
| 3+ Earners | 0 (0.0%) | $0 |
| Total | 145 (100.0%) | $46,660 |
Household Income in Diablock
Household Income Brackets in Diablock
With 86 households falling in the category, the $50,000 to $74,999 income range is the most frequent in Diablock, accounting for 44.8% of all households.
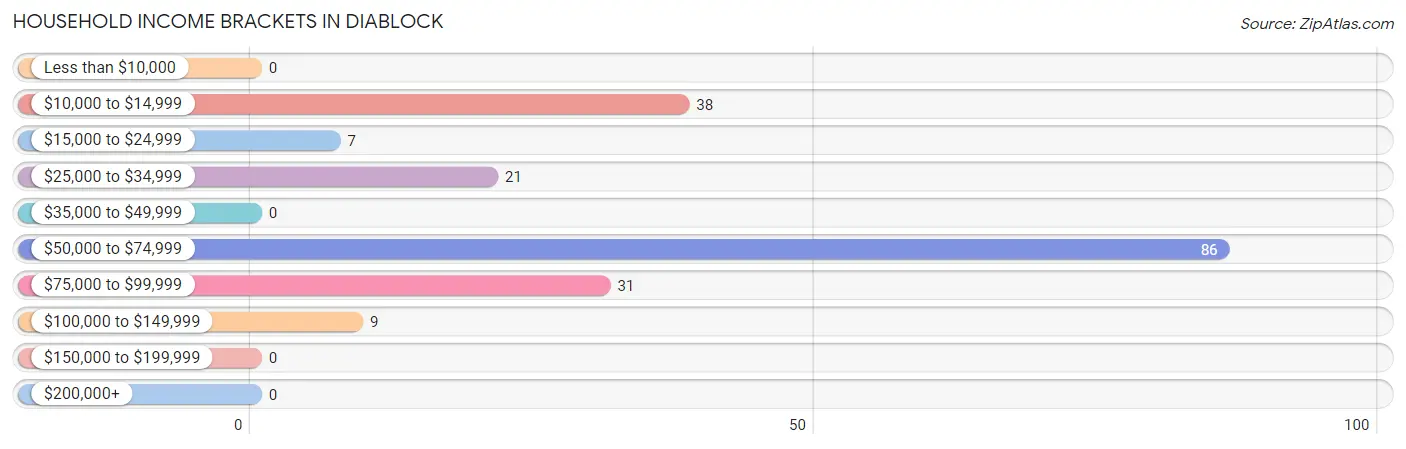
| Income Bracket | # Households | % Households |
| Less than $10,000 | 0 | 0.0% |
| $10,000 to $14,999 | 38 | 19.8% |
| $15,000 to $24,999 | 7 | 3.6% |
| $25,000 to $34,999 | 21 | 10.9% |
| $35,000 to $49,999 | 0 | 0.0% |
| $50,000 to $74,999 | 86 | 44.8% |
| $75,000 to $99,999 | 31 | 16.1% |
| $100,000 to $149,999 | 9 | 4.7% |
| $150,000 to $199,999 | 0 | 0.0% |
| $200,000+ | 0 | 0.0% |
Household Income by Householder Age in Diablock
| Income Bracket | # Households | Median Income |
| 15 to 24 Years | 0 (0.0%) | $0 |
| 25 to 44 Years | 98 (51.0%) | $0 |
| 45 to 64 Years | 7 (3.6%) | $0 |
| 65+ Years | 87 (45.3%) | $0 |
| Total | 192 (100.0%) | $61,119 |
Poverty in Diablock
Income Below Poverty by Sex and Age in Diablock
With 30.0% poverty level for males and 27.0% for females among the residents of Diablock, 18 to 24 year old males and 55 to 64 year old females are the most vulnerable to poverty, with 35 males (100.0%) and 6 females (54.5%) in their respective age groups living below the poverty level.
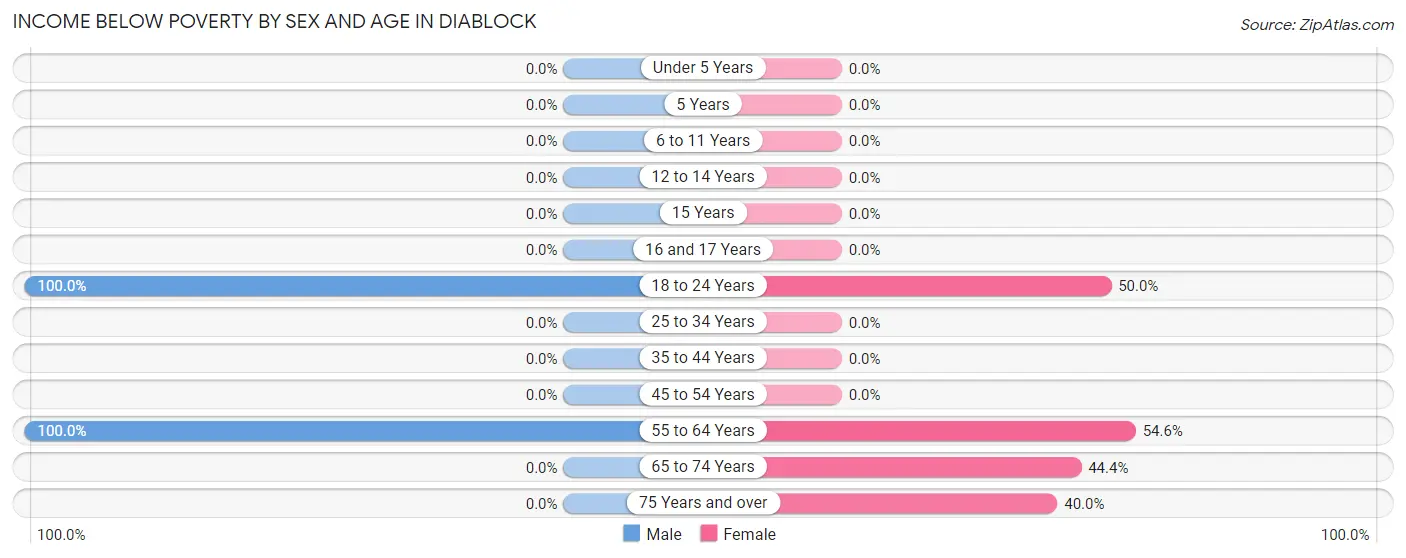
| Age Bracket | Male | Female |
| Under 5 Years | 0 (0.0%) | 0 (0.0%) |
| 5 Years | 0 (0.0%) | 0 (0.0%) |
| 6 to 11 Years | 0 (0.0%) | 0 (0.0%) |
| 12 to 14 Years | 0 (0.0%) | 0 (0.0%) |
| 15 Years | 0 (0.0%) | 0 (0.0%) |
| 16 and 17 Years | 0 (0.0%) | 0 (0.0%) |
| 18 to 24 Years | 35 (100.0%) | 33 (50.0%) |
| 25 to 34 Years | 0 (0.0%) | 0 (0.0%) |
| 35 to 44 Years | 0 (0.0%) | 0 (0.0%) |
| 45 to 54 Years | 0 (0.0%) | 0 (0.0%) |
| 55 to 64 Years | 7 (100.0%) | 6 (54.5%) |
| 65 to 74 Years | 0 (0.0%) | 32 (44.4%) |
| 75 Years and over | 0 (0.0%) | 6 (40.0%) |
| Total | 42 (30.0%) | 77 (27.0%) |
Income Above Poverty by Sex and Age in Diablock
According to the poverty statistics in Diablock, males aged 12 to 14 years and females aged 15 years are the age groups that are most secure financially, with 100.0% of males and 100.0% of females in these age groups living above the poverty line.
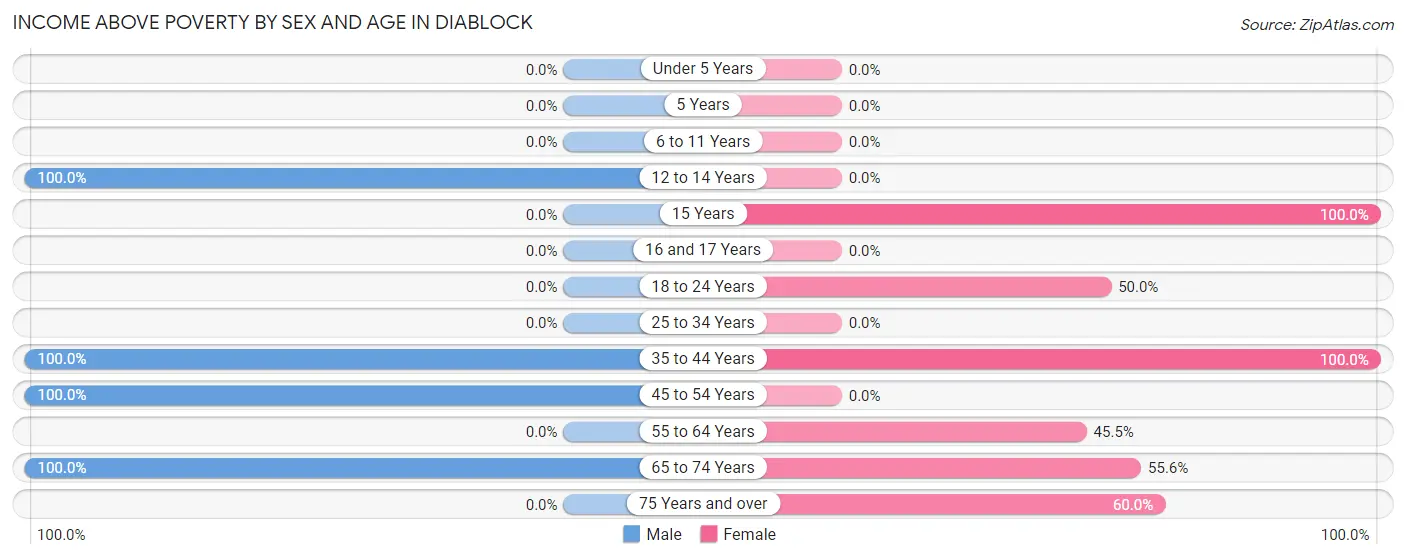
| Age Bracket | Male | Female |
| Under 5 Years | 0 (0.0%) | 0 (0.0%) |
| 5 Years | 0 (0.0%) | 0 (0.0%) |
| 6 to 11 Years | 0 (0.0%) | 0 (0.0%) |
| 12 to 14 Years | 35 (100.0%) | 0 (0.0%) |
| 15 Years | 0 (0.0%) | 23 (100.0%) |
| 16 and 17 Years | 0 (0.0%) | 0 (0.0%) |
| 18 to 24 Years | 0 (0.0%) | 33 (50.0%) |
| 25 to 34 Years | 0 (0.0%) | 0 (0.0%) |
| 35 to 44 Years | 35 (100.0%) | 98 (100.0%) |
| 45 to 54 Years | 9 (100.0%) | 0 (0.0%) |
| 55 to 64 Years | 0 (0.0%) | 5 (45.5%) |
| 65 to 74 Years | 19 (100.0%) | 40 (55.6%) |
| 75 Years and over | 0 (0.0%) | 9 (60.0%) |
| Total | 98 (70.0%) | 208 (73.0%) |
Income Below Poverty Among Married-Couple Families in Diablock
The poverty statistics for married-couple families in Diablock show that 12.3% or 7 of the total 57 families live below the poverty line. Families with no children have the highest poverty rate of 26.9%, comprising of 7 families. On the other hand, families with 1 or 2 children have the lowest poverty rate of 0.0%, which includes 0 families.
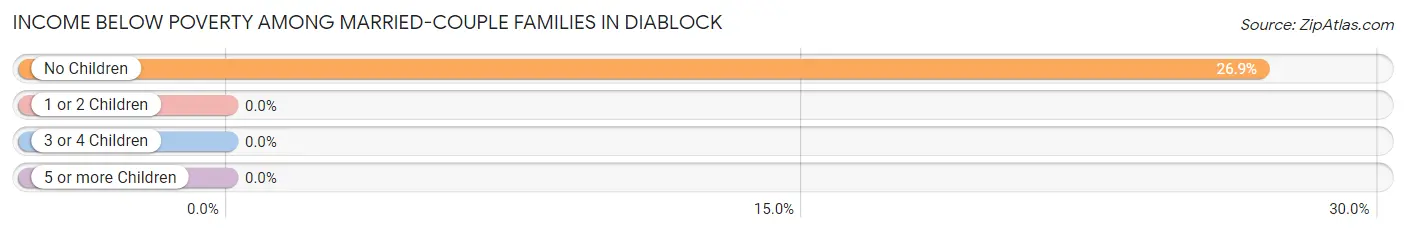
| Children | Above Poverty | Below Poverty |
| No Children | 19 (73.1%) | 7 (26.9%) |
| 1 or 2 Children | 31 (100.0%) | 0 (0.0%) |
| 3 or 4 Children | 0 (0.0%) | 0 (0.0%) |
| 5 or more Children | 0 (0.0%) | 0 (0.0%) |
| Total | 50 (87.7%) | 7 (12.3%) |
Income Below Poverty Among Single-Parent Households in Diablock
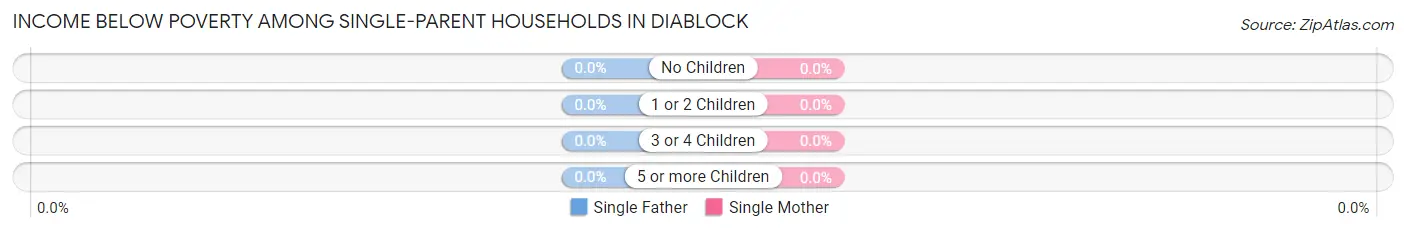
| Children | Single Father | Single Mother |
| No Children | 0 (0.0%) | 0 (0.0%) |
| 1 or 2 Children | 0 (0.0%) | 0 (0.0%) |
| 3 or 4 Children | 0 (0.0%) | 0 (0.0%) |
| 5 or more Children | 0 (0.0%) | 0 (0.0%) |
| Total | 0 (0.0%) | 0 (0.0%) |
Income Below Poverty Among Married-Couple vs Single-Parent Households in Diablock
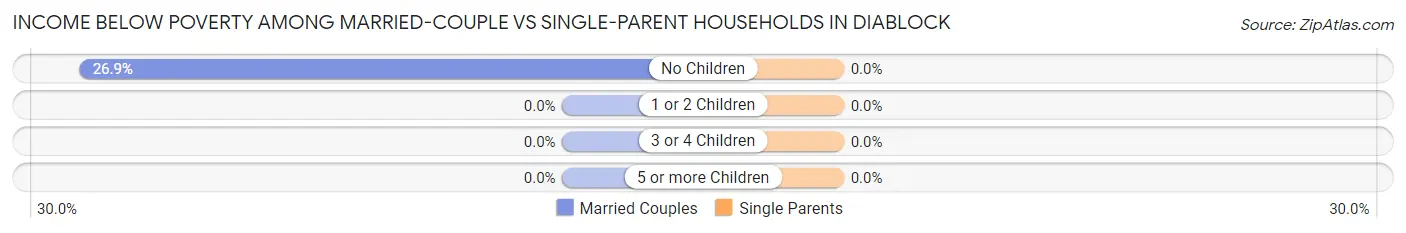
| Children | Married-Couple Families | Single-Parent Households |
| No Children | 7 (26.9%) | 0 (0.0%) |
| 1 or 2 Children | 0 (0.0%) | 0 (0.0%) |
| 3 or 4 Children | 0 (0.0%) | 0 (0.0%) |
| 5 or more Children | 0 (0.0%) | 0 (0.0%) |
| Total | 7 (12.3%) | 0 (0.0%) |
Employment Characteristics in Diablock
Employment by Class of Employer in Diablock
Among the 183 employed individuals in Diablock, private company employees (108 | 59.0%), local government employees (35 | 19.1%), and not-for-profit organizations (31 | 16.9%) make up the most common classes of employment.
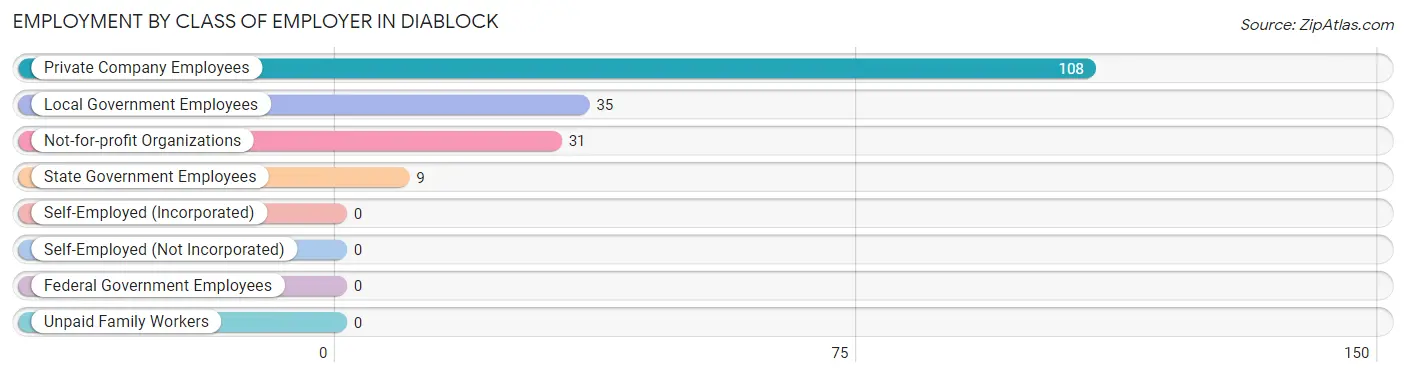
| Employer Class | # Employees | % Employees |
| Private Company Employees | 108 | 59.0% |
| Self-Employed (Incorporated) | 0 | 0.0% |
| Self-Employed (Not Incorporated) | 0 | 0.0% |
| Not-for-profit Organizations | 31 | 16.9% |
| Local Government Employees | 35 | 19.1% |
| State Government Employees | 9 | 4.9% |
| Federal Government Employees | 0 | 0.0% |
| Unpaid Family Workers | 0 | 0.0% |
| Total | 183 | 100.0% |
Employment Status by Age in Diablock
According to the labor force statistics for Diablock, out of the total population over 16 years of age (367), 58.9% or 216 individuals are in the labor force, with 15.3% or 33 of them unemployed. The age group with the highest labor force participation rate is 35 to 44 years, with 100.0% or 133 individuals in the labor force. Within the labor force, the 16 to 19 years age range has the highest percentage of unemployed individuals, with 48.5% or 33 of them being unemployed.
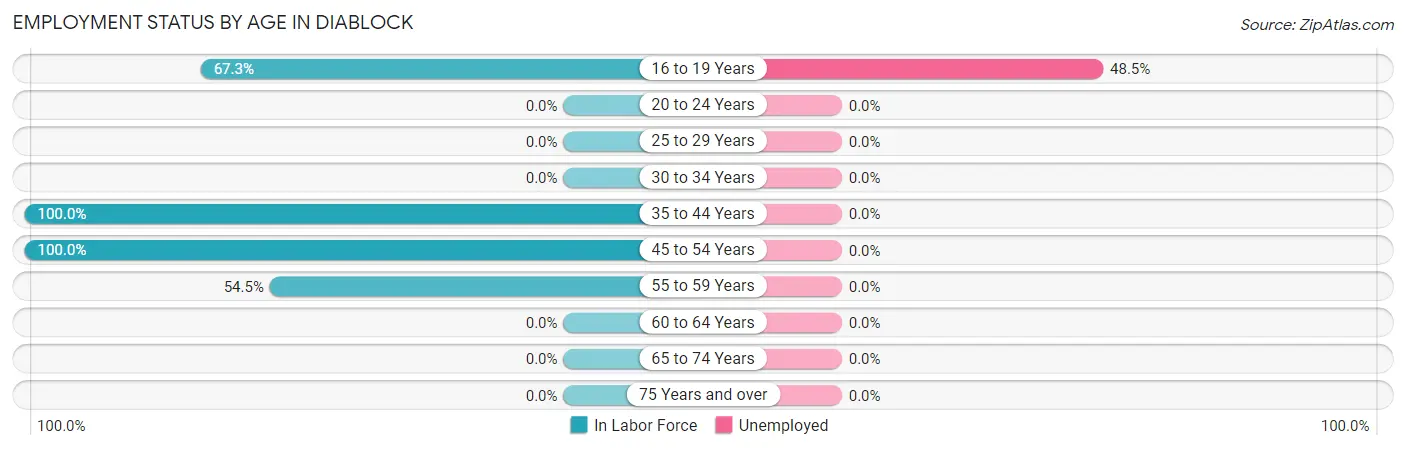
| Age Bracket | In Labor Force | Unemployed |
| 16 to 19 Years | 68 (67.3%) | 33 (48.5%) |
| 20 to 24 Years | 0 (0.0%) | 0 (0.0%) |
| 25 to 29 Years | 0 (0.0%) | 0 (0.0%) |
| 30 to 34 Years | 0 (0.0%) | 0 (0.0%) |
| 35 to 44 Years | 133 (100.0%) | 0 (0.0%) |
| 45 to 54 Years | 9 (100.0%) | 0 (0.0%) |
| 55 to 59 Years | 6 (54.5%) | 0 (0.0%) |
| 60 to 64 Years | 0 (0.0%) | 0 (0.0%) |
| 65 to 74 Years | 0 (0.0%) | 0 (0.0%) |
| 75 Years and over | 0 (0.0%) | 0 (0.0%) |
| Total | 216 (58.9%) | 33 (15.3%) |
Employment Status by Educational Attainment in Diablock
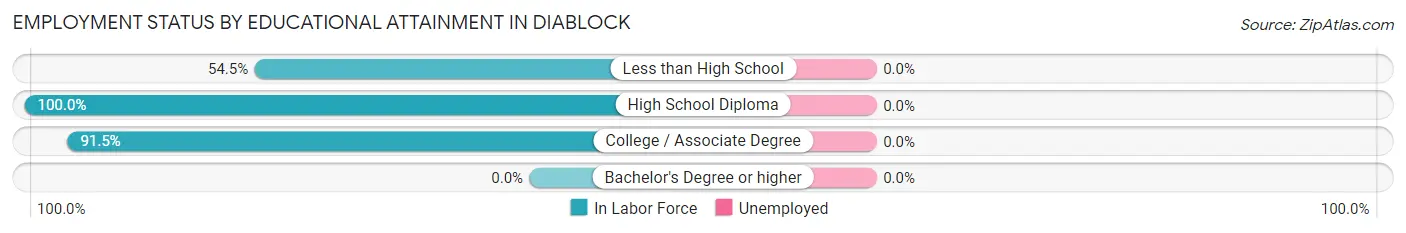
| Educational Attainment | In Labor Force | Unemployed |
| Less than High School | 6 (54.5%) | 0 (0.0%) |
| High School Diploma | 67 (100.0%) | 0 (0.0%) |
| College / Associate Degree | 75 (91.5%) | 0 (0.0%) |
| Bachelor's Degree or higher | 0 (0.0%) | 0 (0.0%) |
| Total | 148 (92.5%) | 0 (0.0%) |
Employment Occupations by Sex in Diablock
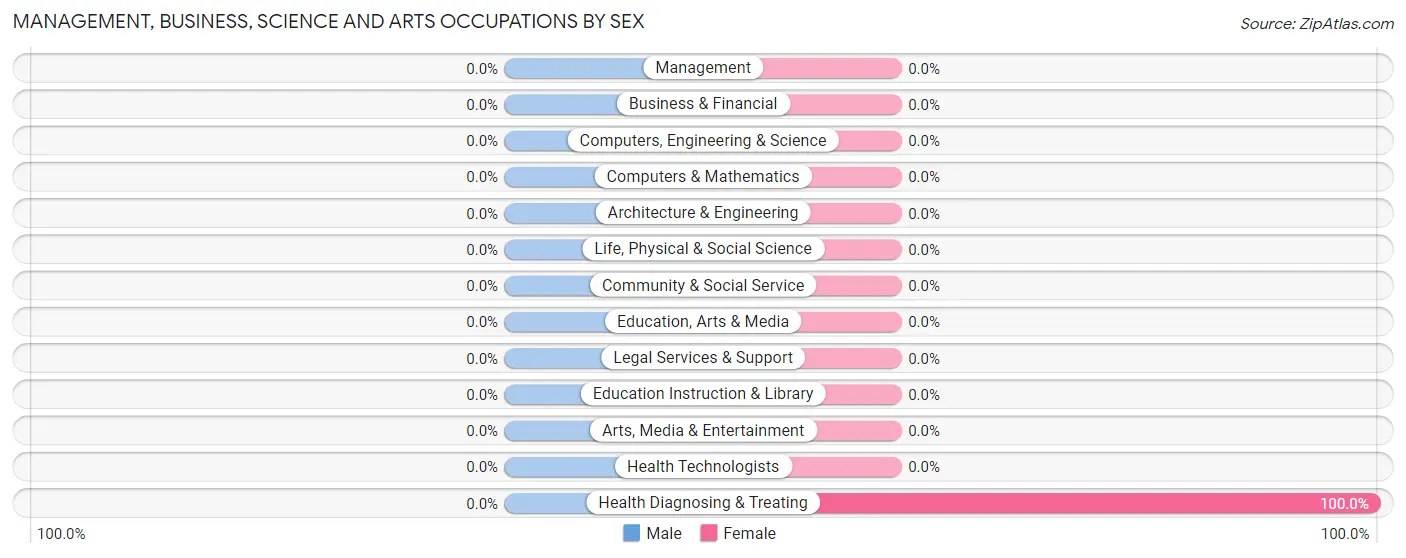
Management, Business, Science and Arts Occupations
The most common Management, Business, Science and Arts occupations in Diablock are , and Health Diagnosing & Treating (31 | 16.9%).
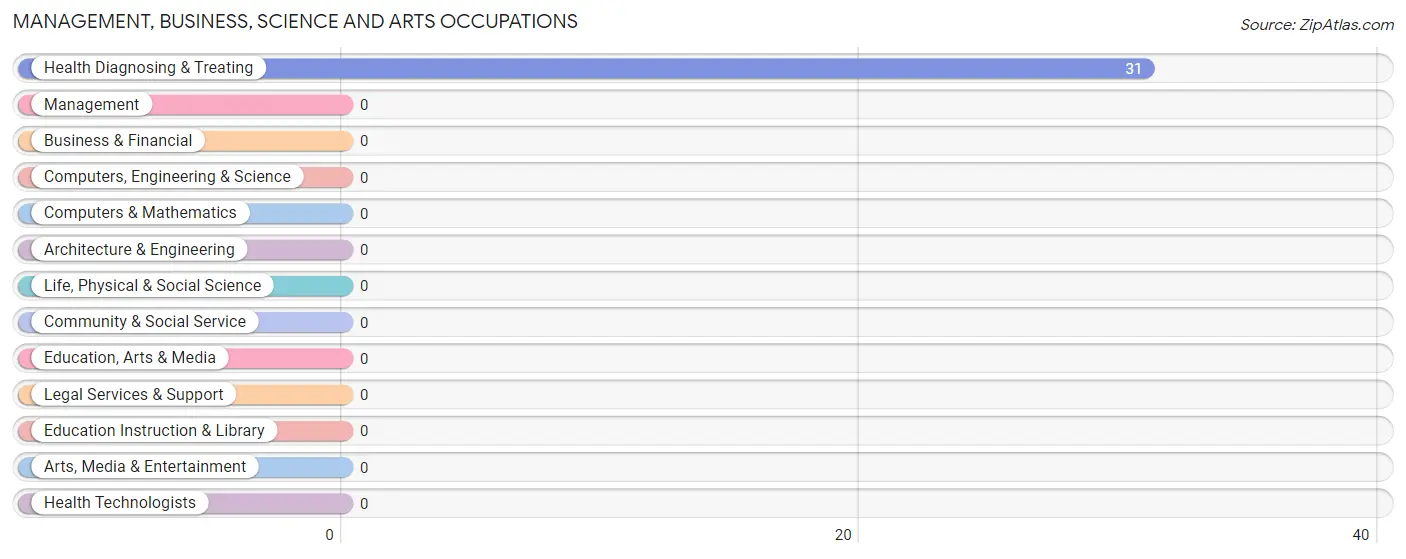
Management, Business, Science and Arts Occupations by Sex
| Occupation | Male | Female |
| Management | 0 (0.0%) | 0 (0.0%) |
| Business & Financial | 0 (0.0%) | 0 (0.0%) |
| Computers, Engineering & Science | 0 (0.0%) | 0 (0.0%) |
| Computers & Mathematics | 0 (0.0%) | 0 (0.0%) |
| Architecture & Engineering | 0 (0.0%) | 0 (0.0%) |
| Life, Physical & Social Science | 0 (0.0%) | 0 (0.0%) |
| Community & Social Service | 0 (0.0%) | 0 (0.0%) |
| Education, Arts & Media | 0 (0.0%) | 0 (0.0%) |
| Legal Services & Support | 0 (0.0%) | 0 (0.0%) |
| Education Instruction & Library | 0 (0.0%) | 0 (0.0%) |
| Arts, Media & Entertainment | 0 (0.0%) | 0 (0.0%) |
| Health Diagnosing & Treating | 0 (0.0%) | 31 (100.0%) |
| Health Technologists | 0 (0.0%) | 0 (0.0%) |
| Total (Category) | 0 (0.0%) | 31 (100.0%) |
| Total (Overall) | 79 (43.2%) | 104 (56.8%) |
Services Occupations
The most common Services occupations in Diablock are Security & Protection (9 | 4.9%), and Law Enforcement (9 | 4.9%).
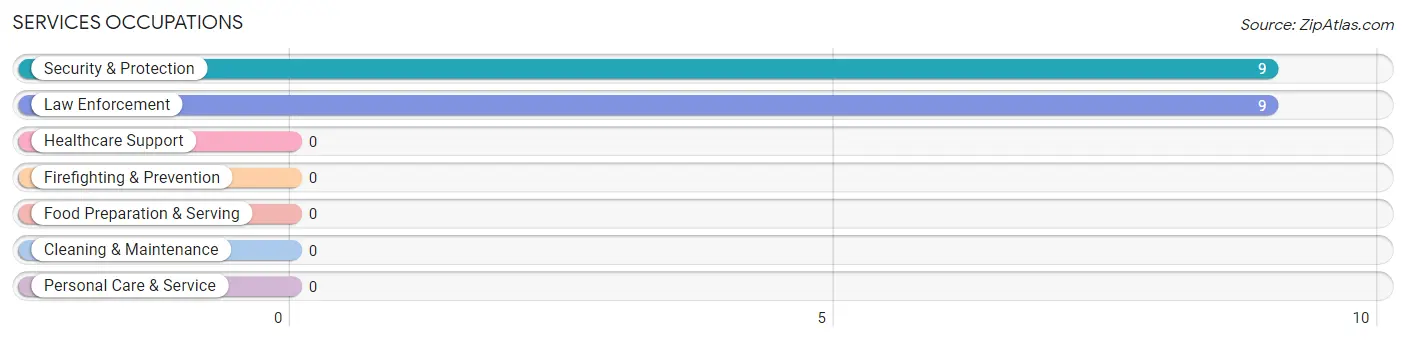
Services Occupations by Sex
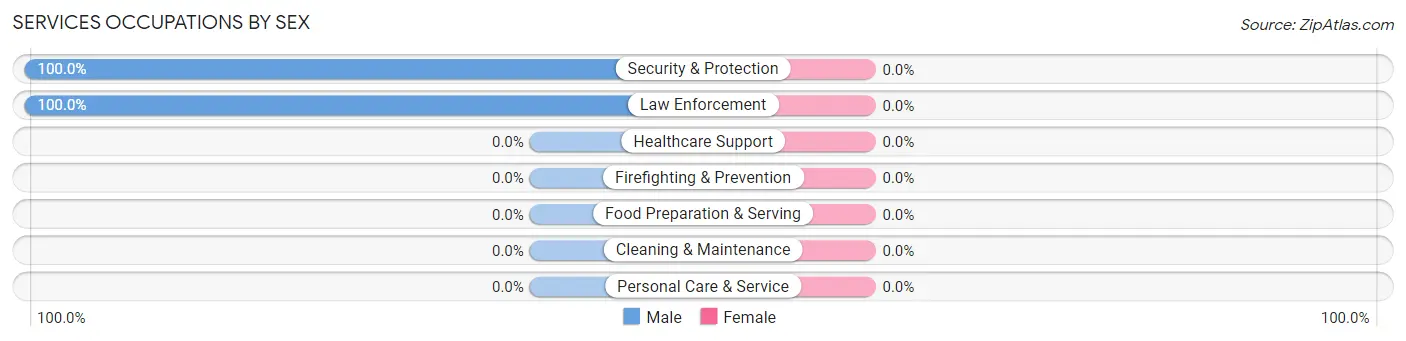
| Occupation | Male | Female |
| Healthcare Support | 0 (0.0%) | 0 (0.0%) |
| Security & Protection | 9 (100.0%) | 0 (0.0%) |
| Firefighting & Prevention | 0 (0.0%) | 0 (0.0%) |
| Law Enforcement | 9 (100.0%) | 0 (0.0%) |
| Food Preparation & Serving | 0 (0.0%) | 0 (0.0%) |
| Cleaning & Maintenance | 0 (0.0%) | 0 (0.0%) |
| Personal Care & Service | 0 (0.0%) | 0 (0.0%) |
| Total (Category) | 9 (100.0%) | 0 (0.0%) |
| Total (Overall) | 79 (43.2%) | 104 (56.8%) |
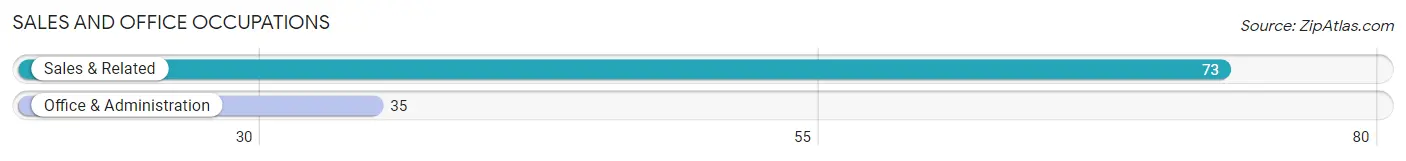
Sales and Office Occupations
The most common Sales and Office occupations in Diablock are Sales & Related (73 | 39.9%), and Office & Administration (35 | 19.1%).
Sales and Office Occupations by Sex

| Occupation | Male | Female |
| Sales & Related | 0 (0.0%) | 73 (100.0%) |
| Office & Administration | 35 (100.0%) | 0 (0.0%) |
| Total (Category) | 35 (32.4%) | 73 (67.6%) |
| Total (Overall) | 79 (43.2%) | 104 (56.8%) |
Natural Resources, Construction and Maintenance Occupations
The most common Natural Resources, Construction and Maintenance occupations in Diablock are , and Installation, Maintenance & Repair (35 | 19.1%).
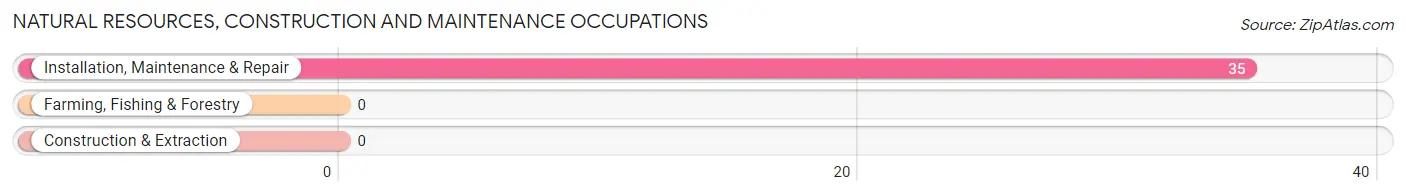
Natural Resources, Construction and Maintenance Occupations by Sex
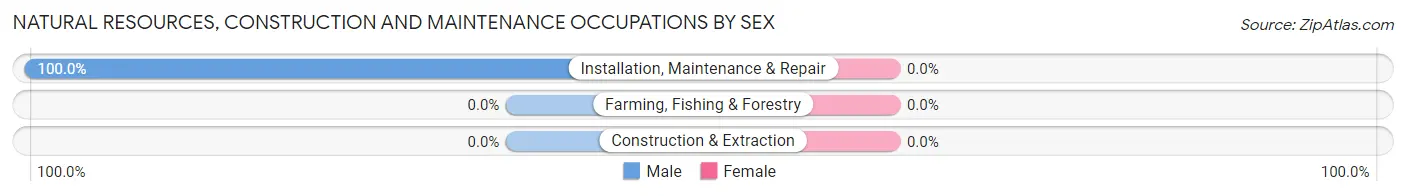
| Occupation | Male | Female |
| Farming, Fishing & Forestry | 0 (0.0%) | 0 (0.0%) |
| Construction & Extraction | 0 (0.0%) | 0 (0.0%) |
| Installation, Maintenance & Repair | 35 (100.0%) | 0 (0.0%) |
| Total (Category) | 35 (100.0%) | 0 (0.0%) |
| Total (Overall) | 79 (43.2%) | 104 (56.8%) |
Production, Transportation and Moving Occupations
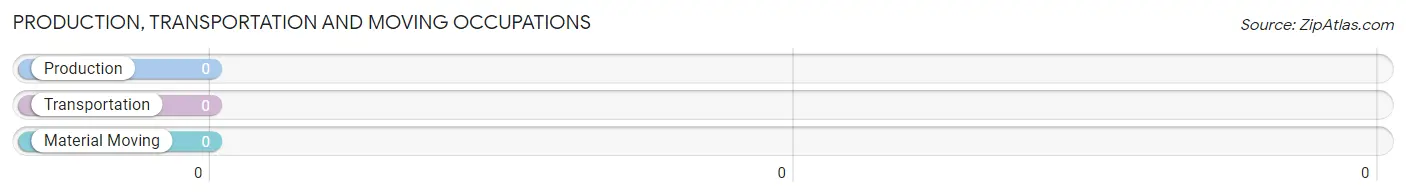
Production, Transportation and Moving Occupations by Sex
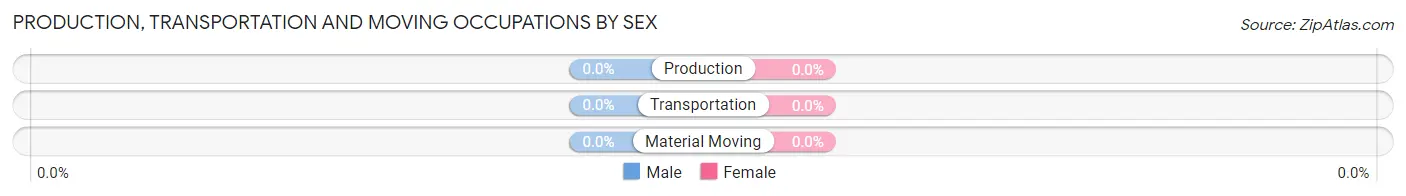
| Occupation | Male | Female |
| Production | 0 (0.0%) | 0 (0.0%) |
| Transportation | 0 (0.0%) | 0 (0.0%) |
| Material Moving | 0 (0.0%) | 0 (0.0%) |
| Total (Category) | 0 (0.0%) | 0 (0.0%) |
| Total (Overall) | 79 (43.2%) | 104 (56.8%) |
Employment Industries by Sex in Diablock
Employment Industries in Diablock
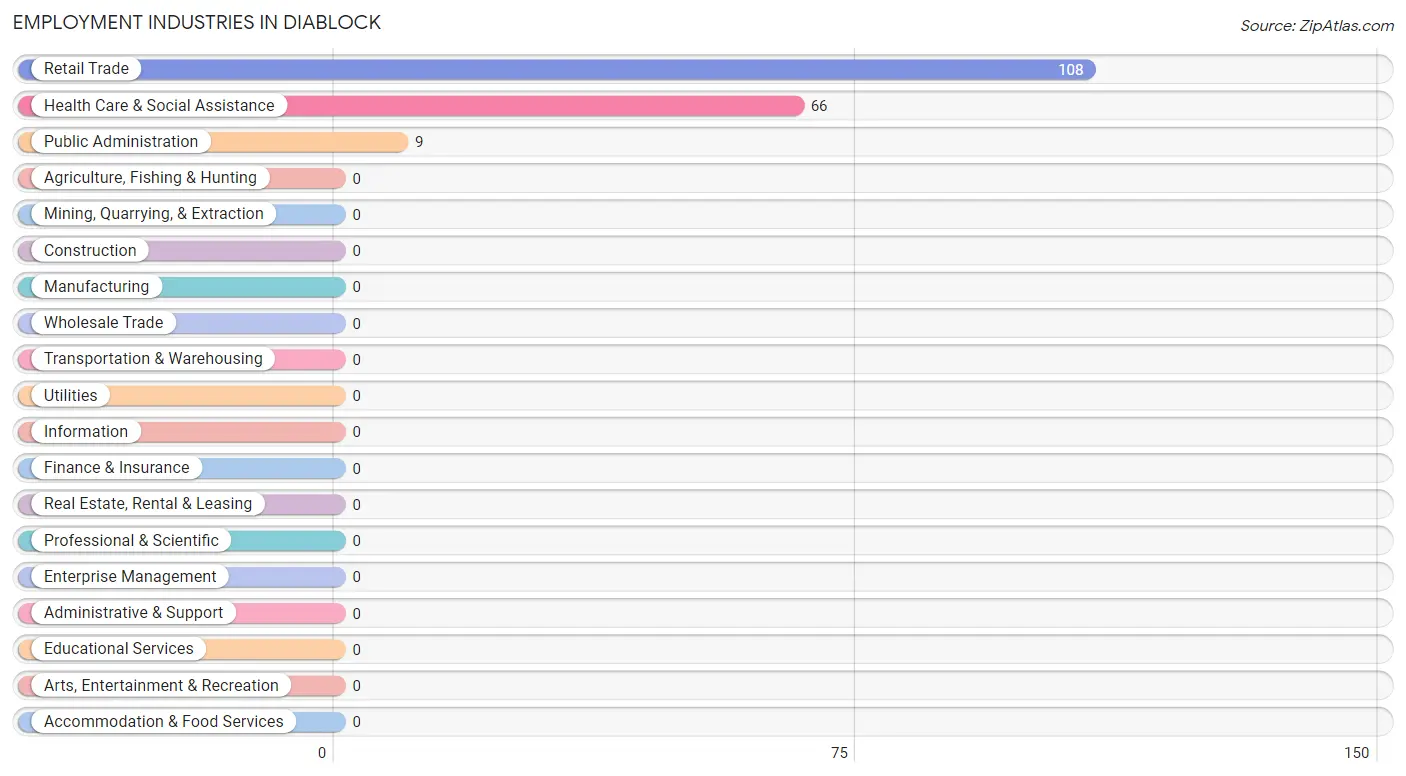
The major employment industries in Diablock include Retail Trade (108 | 59.0%), Health Care & Social Assistance (66 | 36.1%), and Public Administration (9 | 4.9%).
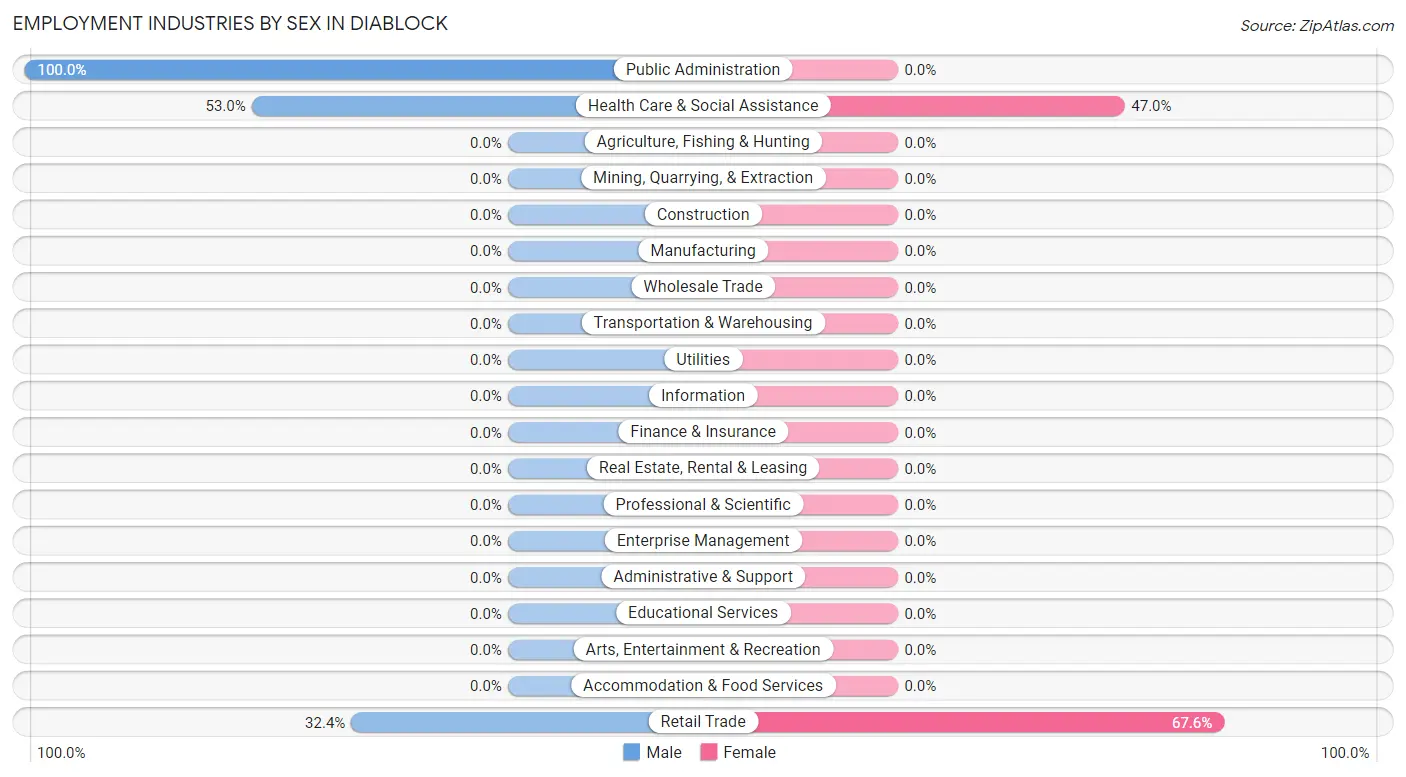
Employment Industries by Sex in Diablock
The Diablock industries that see more men than women are Public Administration (100.0%), Health Care & Social Assistance (53.0%), and Retail Trade (32.4%), whereas the industries that tend to have a higher number of women are Retail Trade (67.6%), and Health Care & Social Assistance (47.0%).
| Industry | Male | Female |
| Agriculture, Fishing & Hunting | 0 (0.0%) | 0 (0.0%) |
| Mining, Quarrying, & Extraction | 0 (0.0%) | 0 (0.0%) |
| Construction | 0 (0.0%) | 0 (0.0%) |
| Manufacturing | 0 (0.0%) | 0 (0.0%) |
| Wholesale Trade | 0 (0.0%) | 0 (0.0%) |
| Retail Trade | 35 (32.4%) | 73 (67.6%) |
| Transportation & Warehousing | 0 (0.0%) | 0 (0.0%) |
| Utilities | 0 (0.0%) | 0 (0.0%) |
| Information | 0 (0.0%) | 0 (0.0%) |
| Finance & Insurance | 0 (0.0%) | 0 (0.0%) |
| Real Estate, Rental & Leasing | 0 (0.0%) | 0 (0.0%) |
| Professional & Scientific | 0 (0.0%) | 0 (0.0%) |
| Enterprise Management | 0 (0.0%) | 0 (0.0%) |
| Administrative & Support | 0 (0.0%) | 0 (0.0%) |
| Educational Services | 0 (0.0%) | 0 (0.0%) |
| Health Care & Social Assistance | 35 (53.0%) | 31 (47.0%) |
| Arts, Entertainment & Recreation | 0 (0.0%) | 0 (0.0%) |
| Accommodation & Food Services | 0 (0.0%) | 0 (0.0%) |
| Public Administration | 9 (100.0%) | 0 (0.0%) |
| Total | 79 (43.2%) | 104 (56.8%) |
Education in Diablock
School Enrollment in Diablock
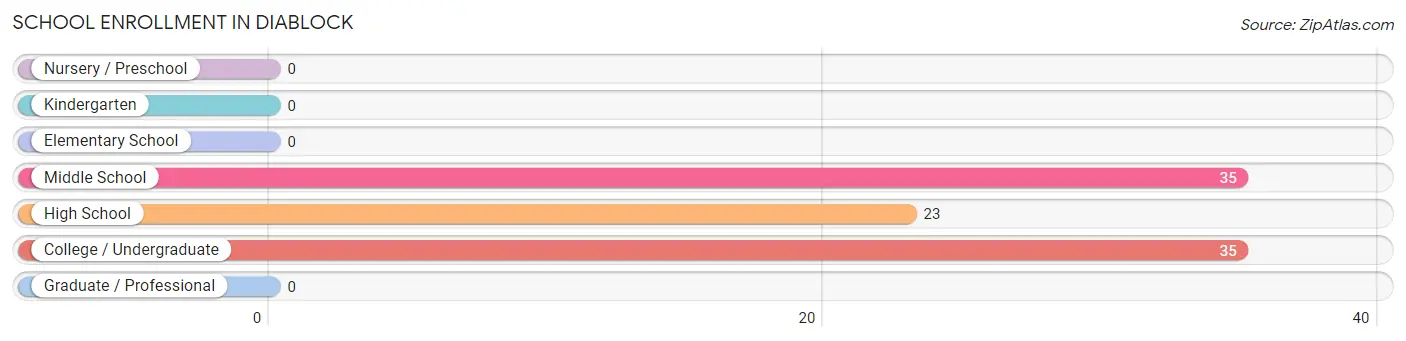
The most common levels of schooling among the 93 students in Diablock are middle school (35 | 37.6%), college / undergraduate (35 | 37.6%), and high school (23 | 24.7%).
| School Level | # Students | % Students |
| Nursery / Preschool | 0 | 0.0% |
| Kindergarten | 0 | 0.0% |
| Elementary School | 0 | 0.0% |
| Middle School | 35 | 37.6% |
| High School | 23 | 24.7% |
| College / Undergraduate | 35 | 37.6% |
| Graduate / Professional | 0 | 0.0% |
| Total | 93 | 100.0% |
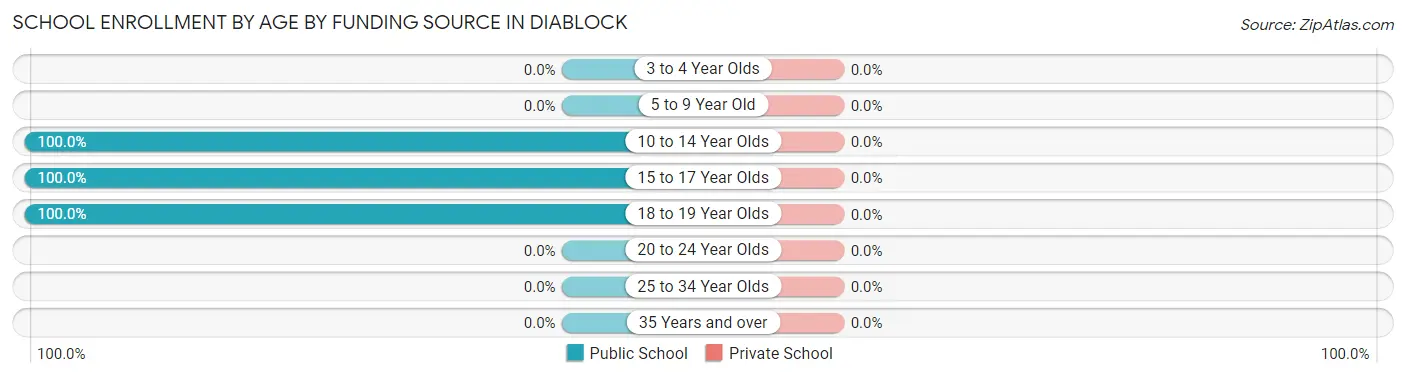
School Enrollment by Age by Funding Source in Diablock
| Age Bracket | Public School | Private School |
| 3 to 4 Year Olds | 0 (0.0%) | 0 (0.0%) |
| 5 to 9 Year Old | 0 (0.0%) | 0 (0.0%) |
| 10 to 14 Year Olds | 35 (100.0%) | 0 (0.0%) |
| 15 to 17 Year Olds | 23 (100.0%) | 0 (0.0%) |
| 18 to 19 Year Olds | 35 (100.0%) | 0 (0.0%) |
| 20 to 24 Year Olds | 0 (0.0%) | 0 (0.0%) |
| 25 to 34 Year Olds | 0 (0.0%) | 0 (0.0%) |
| 35 Years and over | 0 (0.0%) | 0 (0.0%) |
| Total | 93 (100.0%) | 0 (0.0%) |
Educational Attainment by Field of Study in Diablock
| Field of Study | # Graduates | % Graduates |
| Computers & Mathematics | 0 | 0.0% |
| Bio, Nature & Agricultural | 0 | 0.0% |
| Physical & Health Sciences | 0 | 0.0% |
| Psychology | 0 | 0.0% |
| Social Sciences | 0 | 0.0% |
| Engineering | 0 | 0.0% |
| Multidisciplinary Studies | 0 | 0.0% |
| Science & Technology | 0 | 0.0% |
| Business | 0 | 0.0% |
| Education | 0 | 0.0% |
| Literature & Languages | 0 | 0.0% |
| Liberal Arts & History | 0 | 0.0% |
| Visual & Performing Arts | 0 | 0.0% |
| Communications | 0 | 0.0% |
| Arts & Humanities | 0 | 0.0% |
| Total | 0 | 0.0% |
Transportation & Commute in Diablock
Vehicle Availability by Sex in Diablock
The most prevalent vehicle ownership categories in Diablock are males with 2 vehicles (35, accounting for 44.3%) and females with 2 vehicles (73, making up 33.7%).
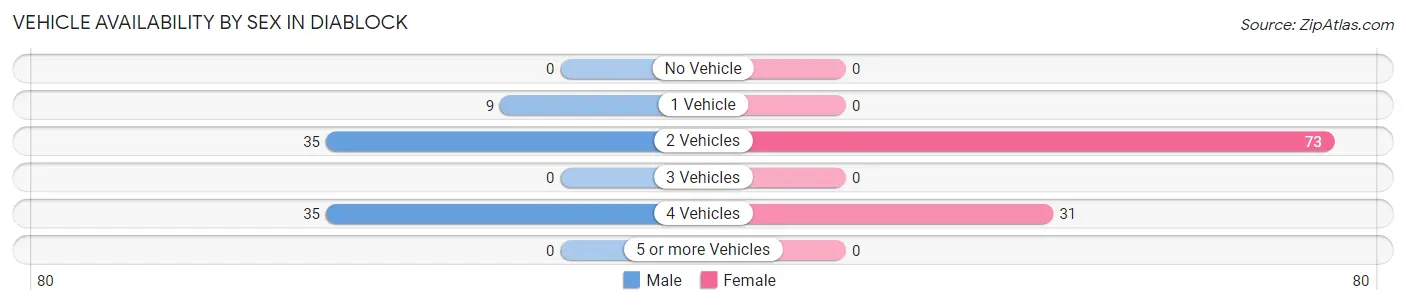
| Vehicles Available | Male | Female |
| No Vehicle | 0 (0.0%) | 0 (0.0%) |
| 1 Vehicle | 9 (11.4%) | 0 (0.0%) |
| 2 Vehicles | 35 (44.3%) | 73 (70.2%) |
| 3 Vehicles | 0 (0.0%) | 0 (0.0%) |
| 4 Vehicles | 35 (44.3%) | 31 (29.8%) |
| 5 or more Vehicles | 0 (0.0%) | 0 (0.0%) |
| Total | 79 (100.0%) | 104 (100.0%) |
Commute Time in Diablock
The most frequently occuring commute durations in Diablock are 15 to 19 minutes (73 commuters, 62.4%), 10 to 14 minutes (35 commuters, 29.9%), and 30 to 34 minutes (9 commuters, 7.7%).
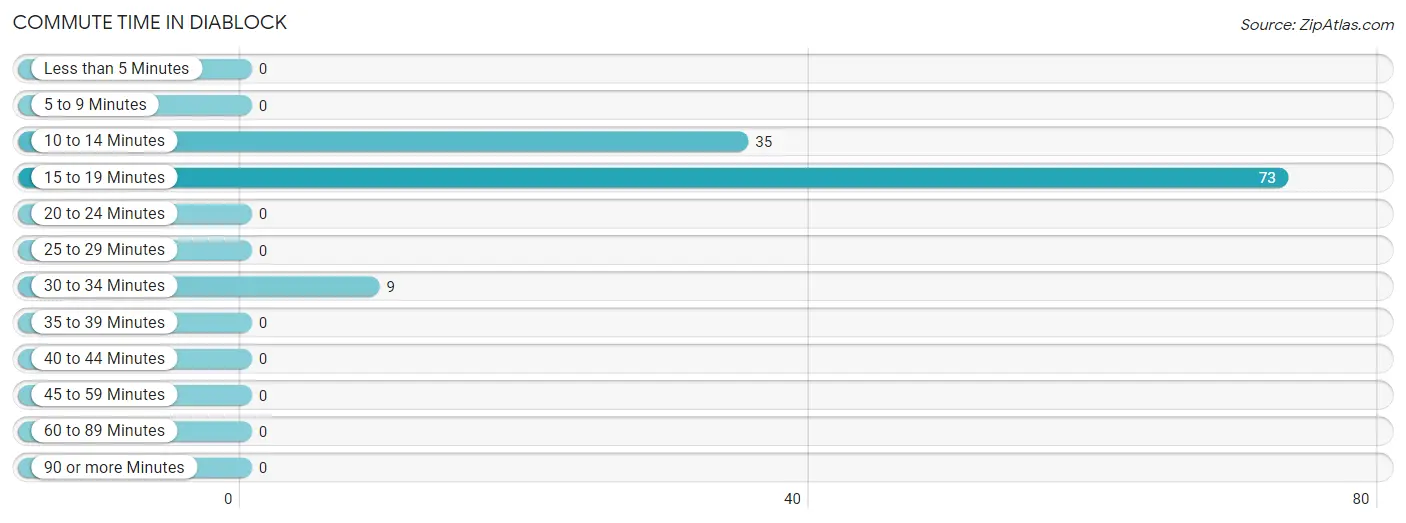
| Commute Time | # Commuters | % Commuters |
| Less than 5 Minutes | 0 | 0.0% |
| 5 to 9 Minutes | 0 | 0.0% |
| 10 to 14 Minutes | 35 | 29.9% |
| 15 to 19 Minutes | 73 | 62.4% |
| 20 to 24 Minutes | 0 | 0.0% |
| 25 to 29 Minutes | 0 | 0.0% |
| 30 to 34 Minutes | 9 | 7.7% |
| 35 to 39 Minutes | 0 | 0.0% |
| 40 to 44 Minutes | 0 | 0.0% |
| 45 to 59 Minutes | 0 | 0.0% |
| 60 to 89 Minutes | 0 | 0.0% |
| 90 or more Minutes | 0 | 0.0% |
Commute Time by Sex in Diablock
The most common commute times in Diablock are 10 to 14 minutes (35 commuters, 79.5%) for males and 15 to 19 minutes (73 commuters, 100.0%) for females.
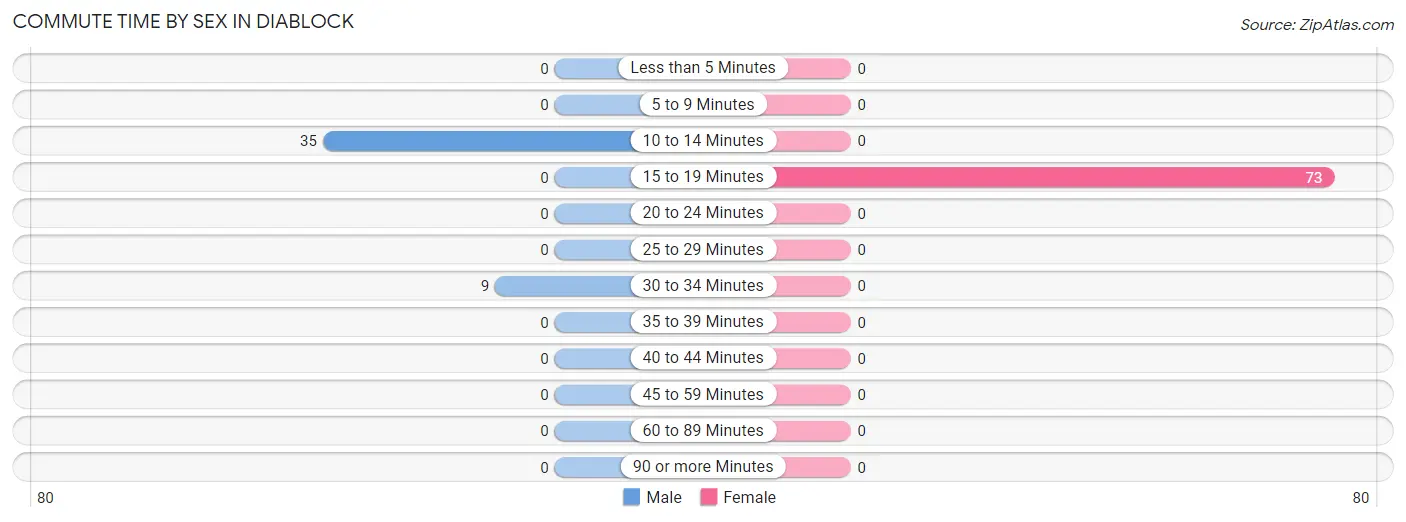
| Commute Time | Male | Female |
| Less than 5 Minutes | 0 (0.0%) | 0 (0.0%) |
| 5 to 9 Minutes | 0 (0.0%) | 0 (0.0%) |
| 10 to 14 Minutes | 35 (79.5%) | 0 (0.0%) |
| 15 to 19 Minutes | 0 (0.0%) | 73 (100.0%) |
| 20 to 24 Minutes | 0 (0.0%) | 0 (0.0%) |
| 25 to 29 Minutes | 0 (0.0%) | 0 (0.0%) |
| 30 to 34 Minutes | 9 (20.4%) | 0 (0.0%) |
| 35 to 39 Minutes | 0 (0.0%) | 0 (0.0%) |
| 40 to 44 Minutes | 0 (0.0%) | 0 (0.0%) |
| 45 to 59 Minutes | 0 (0.0%) | 0 (0.0%) |
| 60 to 89 Minutes | 0 (0.0%) | 0 (0.0%) |
| 90 or more Minutes | 0 (0.0%) | 0 (0.0%) |
Time of Departure to Work by Sex in Diablock
The most frequent times of departure to work in Diablock are 6:30 AM to 6:59 AM (35, 79.5%) for males and 7:30 AM to 7:59 AM (67, 91.8%) for females.
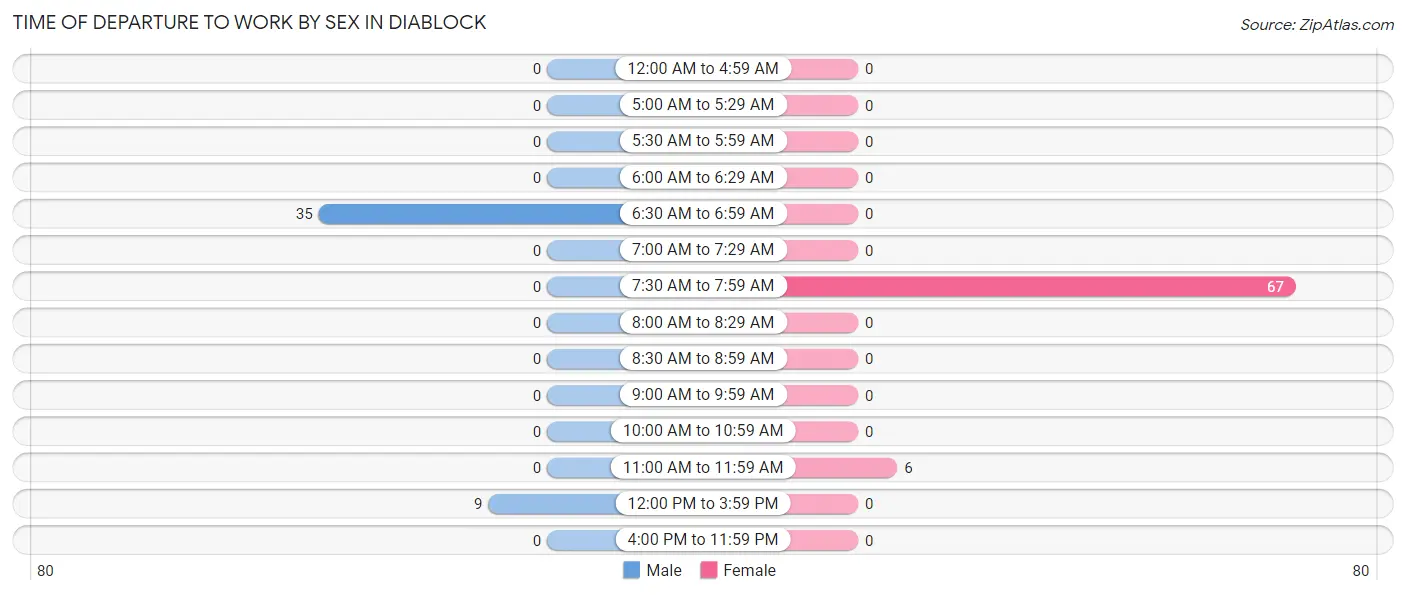
| Time of Departure | Male | Female |
| 12:00 AM to 4:59 AM | 0 (0.0%) | 0 (0.0%) |
| 5:00 AM to 5:29 AM | 0 (0.0%) | 0 (0.0%) |
| 5:30 AM to 5:59 AM | 0 (0.0%) | 0 (0.0%) |
| 6:00 AM to 6:29 AM | 0 (0.0%) | 0 (0.0%) |
| 6:30 AM to 6:59 AM | 35 (79.5%) | 0 (0.0%) |
| 7:00 AM to 7:29 AM | 0 (0.0%) | 0 (0.0%) |
| 7:30 AM to 7:59 AM | 0 (0.0%) | 67 (91.8%) |
| 8:00 AM to 8:29 AM | 0 (0.0%) | 0 (0.0%) |
| 8:30 AM to 8:59 AM | 0 (0.0%) | 0 (0.0%) |
| 9:00 AM to 9:59 AM | 0 (0.0%) | 0 (0.0%) |
| 10:00 AM to 10:59 AM | 0 (0.0%) | 0 (0.0%) |
| 11:00 AM to 11:59 AM | 0 (0.0%) | 6 (8.2%) |
| 12:00 PM to 3:59 PM | 9 (20.4%) | 0 (0.0%) |
| 4:00 PM to 11:59 PM | 0 (0.0%) | 0 (0.0%) |
| Total | 44 (100.0%) | 73 (100.0%) |
Housing Occupancy in Diablock
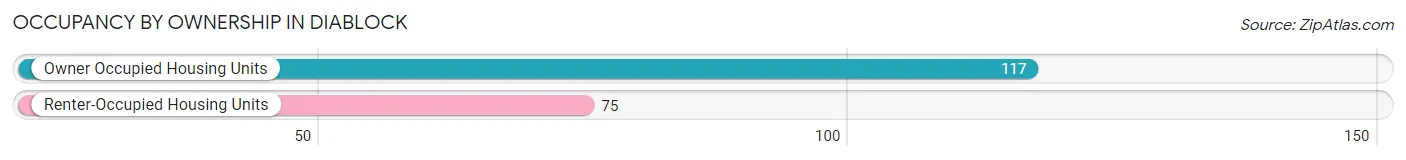
Occupancy by Ownership in Diablock
Of the total 192 dwellings in Diablock, owner-occupied units account for 117 (60.9%), while renter-occupied units make up 75 (39.1%).
| Occupancy | # Housing Units | % Housing Units |
| Owner Occupied Housing Units | 117 | 60.9% |
| Renter-Occupied Housing Units | 75 | 39.1% |
| Total Occupied Housing Units | 192 | 100.0% |
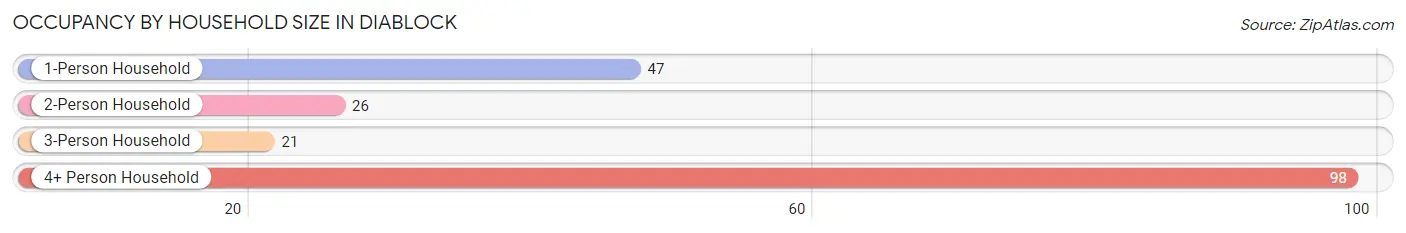
Occupancy by Household Size in Diablock
| Household Size | # Housing Units | % Housing Units |
| 1-Person Household | 47 | 24.5% |
| 2-Person Household | 26 | 13.5% |
| 3-Person Household | 21 | 10.9% |
| 4+ Person Household | 98 | 51.0% |
| Total Housing Units | 192 | 100.0% |
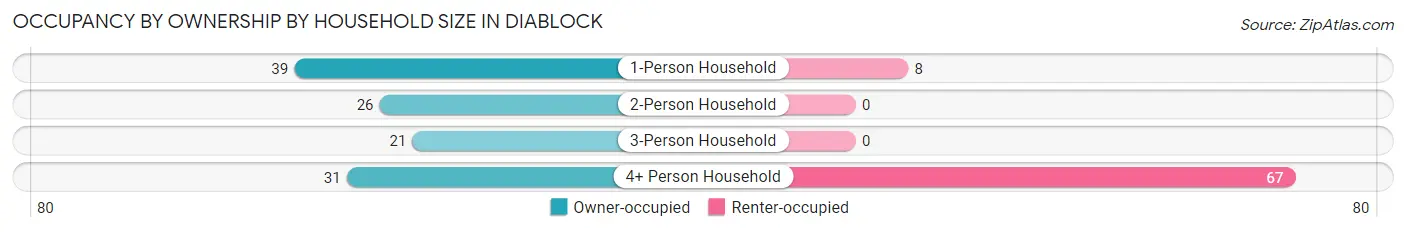
Occupancy by Ownership by Household Size in Diablock
| Household Size | Owner-occupied | Renter-occupied |
| 1-Person Household | 39 (83.0%) | 8 (17.0%) |
| 2-Person Household | 26 (100.0%) | 0 (0.0%) |
| 3-Person Household | 21 (100.0%) | 0 (0.0%) |
| 4+ Person Household | 31 (31.6%) | 67 (68.4%) |
| Total Housing Units | 117 (60.9%) | 75 (39.1%) |
Occupancy by Educational Attainment in Diablock
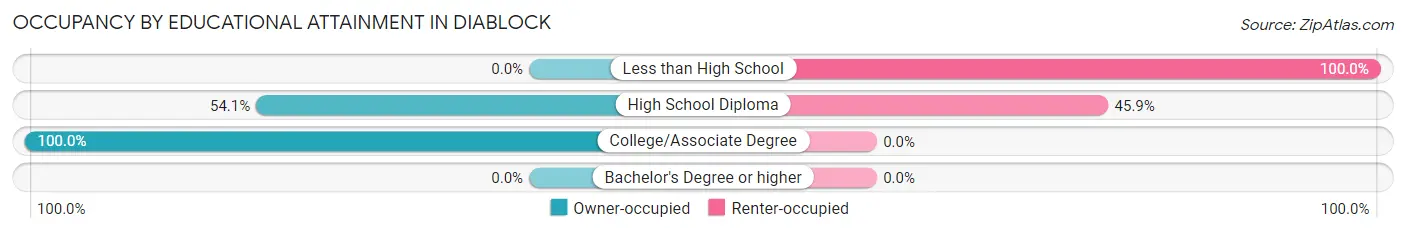
| Household Size | Owner-occupied | Renter-occupied |
| Less than High School | 0 (0.0%) | 8 (100.0%) |
| High School Diploma | 79 (54.1%) | 67 (45.9%) |
| College/Associate Degree | 38 (100.0%) | 0 (0.0%) |
| Bachelor's Degree or higher | 0 (0.0%) | 0 (0.0%) |
Occupancy by Age of Householder in Diablock
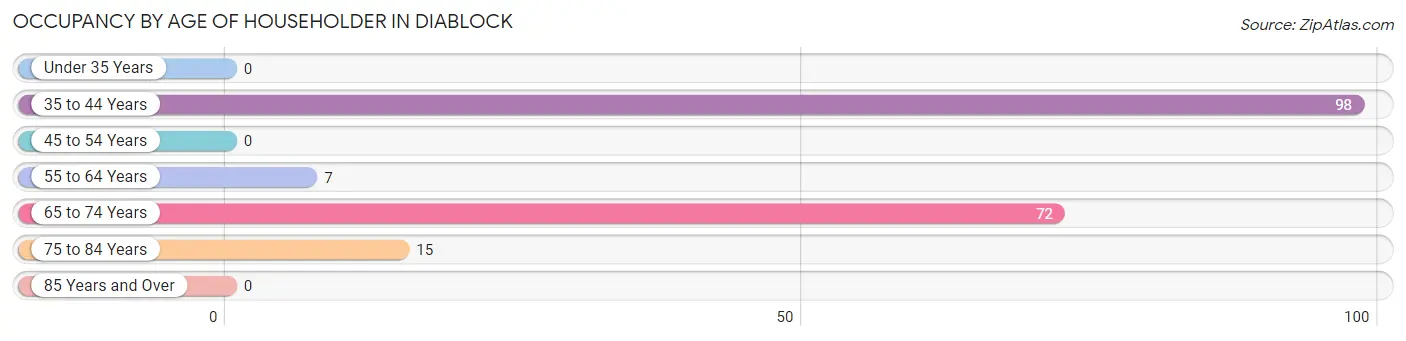
| Age Bracket | # Households | % Households |
| Under 35 Years | 0 | 0.0% |
| 35 to 44 Years | 98 | 51.0% |
| 45 to 54 Years | 0 | 0.0% |
| 55 to 64 Years | 7 | 3.6% |
| 65 to 74 Years | 72 | 37.5% |
| 75 to 84 Years | 15 | 7.8% |
| 85 Years and Over | 0 | 0.0% |
| Total | 192 | 100.0% |
Housing Finances in Diablock
Median Income by Occupancy in Diablock
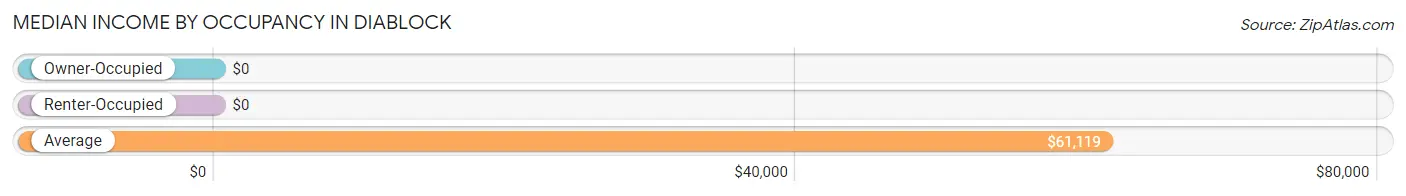
| Occupancy Type | # Households | Median Income |
| Owner-Occupied | 117 (60.9%) | $0 |
| Renter-Occupied | 75 (39.1%) | $0 |
| Average | 192 (100.0%) | $61,119 |
Occupancy by Householder Income Bracket in Diablock
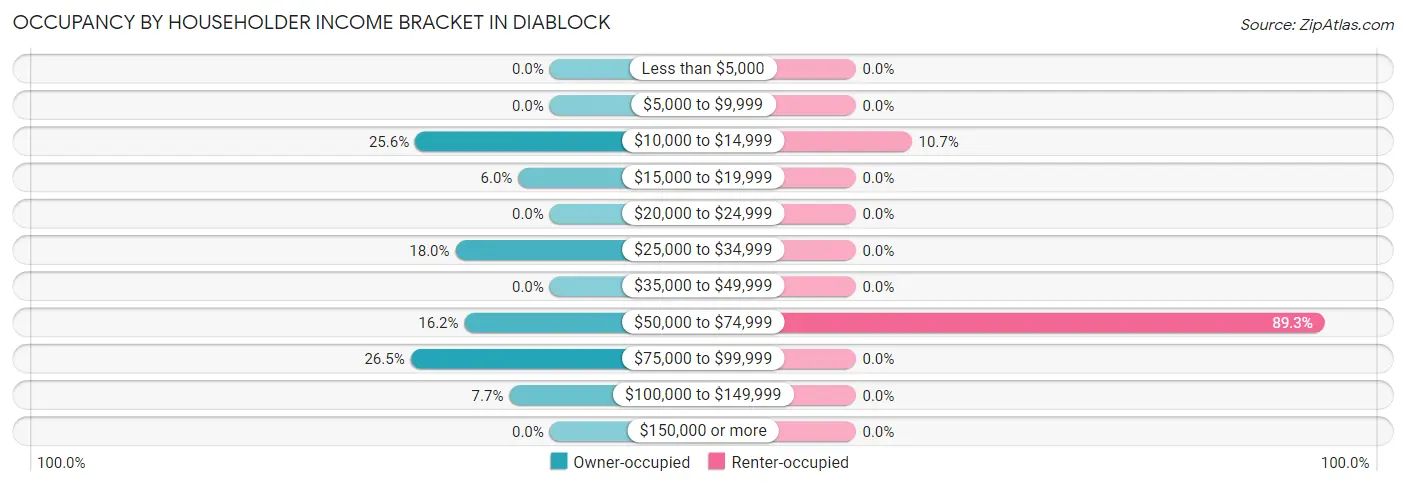
| Income Bracket | Owner-occupied | Renter-occupied |
| Less than $5,000 | 0 (0.0%) | 0 (0.0%) |
| $5,000 to $9,999 | 0 (0.0%) | 0 (0.0%) |
| $10,000 to $14,999 | 30 (25.6%) | 8 (10.7%) |
| $15,000 to $19,999 | 7 (6.0%) | 0 (0.0%) |
| $20,000 to $24,999 | 0 (0.0%) | 0 (0.0%) |
| $25,000 to $34,999 | 21 (17.9%) | 0 (0.0%) |
| $35,000 to $49,999 | 0 (0.0%) | 0 (0.0%) |
| $50,000 to $74,999 | 19 (16.2%) | 67 (89.3%) |
| $75,000 to $99,999 | 31 (26.5%) | 0 (0.0%) |
| $100,000 to $149,999 | 9 (7.7%) | 0 (0.0%) |
| $150,000 or more | 0 (0.0%) | 0 (0.0%) |
| Total | 117 (100.0%) | 75 (100.0%) |
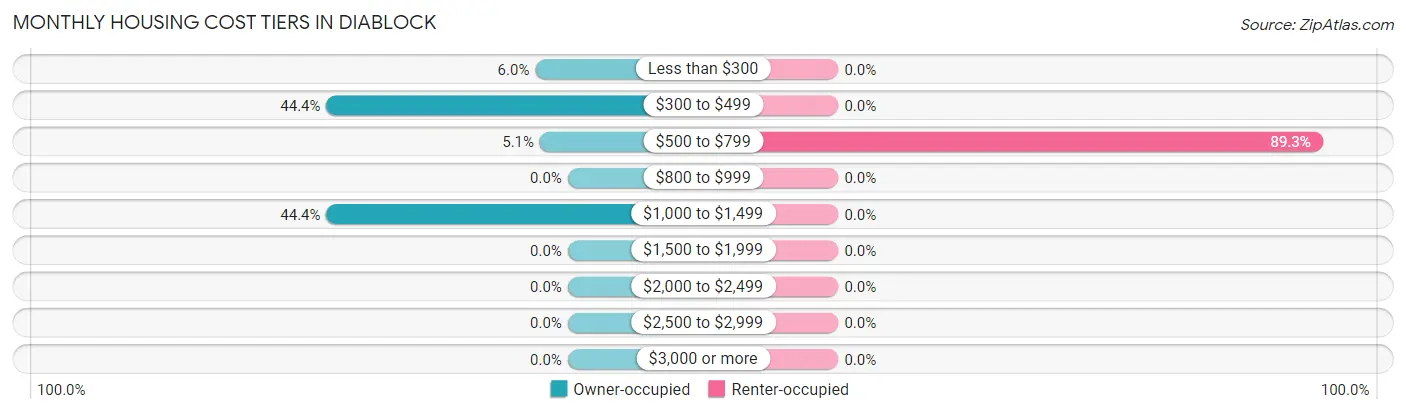
Monthly Housing Cost Tiers in Diablock
| Monthly Cost | Owner-occupied | Renter-occupied |
| Less than $300 | 7 (6.0%) | 0 (0.0%) |
| $300 to $499 | 52 (44.4%) | 0 (0.0%) |
| $500 to $799 | 6 (5.1%) | 67 (89.3%) |
| $800 to $999 | 0 (0.0%) | 0 (0.0%) |
| $1,000 to $1,499 | 52 (44.4%) | 0 (0.0%) |
| $1,500 to $1,999 | 0 (0.0%) | 0 (0.0%) |
| $2,000 to $2,499 | 0 (0.0%) | 0 (0.0%) |
| $2,500 to $2,999 | 0 (0.0%) | 0 (0.0%) |
| $3,000 or more | 0 (0.0%) | 0 (0.0%) |
| Total | 117 (100.0%) | 75 (100.0%) |
Physical Housing Characteristics in Diablock
Housing Structures in Diablock
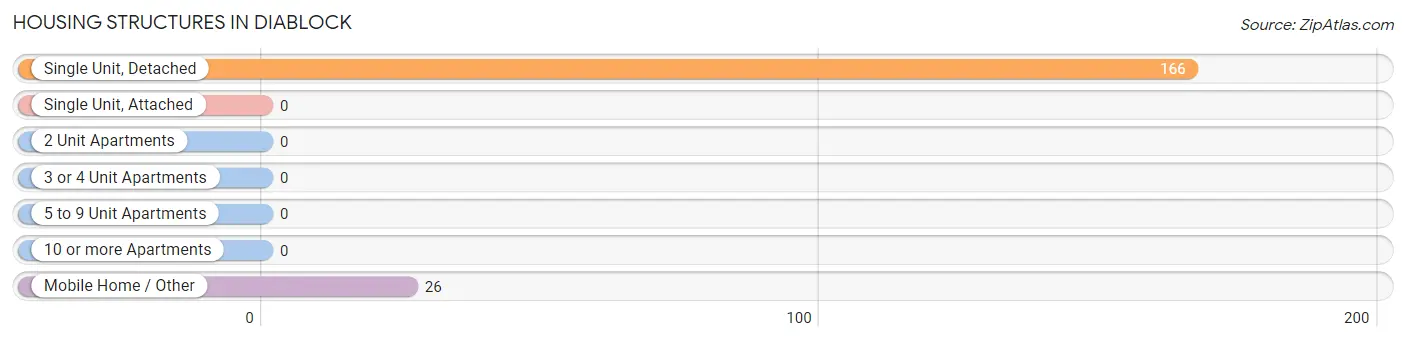
| Structure Type | # Housing Units | % Housing Units |
| Single Unit, Detached | 166 | 86.5% |
| Single Unit, Attached | 0 | 0.0% |
| 2 Unit Apartments | 0 | 0.0% |
| 3 or 4 Unit Apartments | 0 | 0.0% |
| 5 to 9 Unit Apartments | 0 | 0.0% |
| 10 or more Apartments | 0 | 0.0% |
| Mobile Home / Other | 26 | 13.5% |
| Total | 192 | 100.0% |
Housing Structures by Occupancy in Diablock
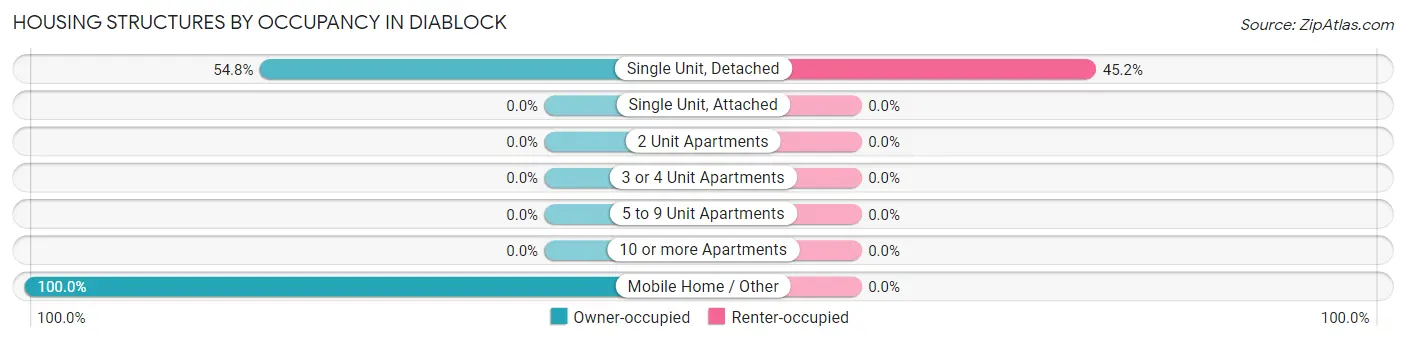
| Structure Type | Owner-occupied | Renter-occupied |
| Single Unit, Detached | 91 (54.8%) | 75 (45.2%) |
| Single Unit, Attached | 0 (0.0%) | 0 (0.0%) |
| 2 Unit Apartments | 0 (0.0%) | 0 (0.0%) |
| 3 or 4 Unit Apartments | 0 (0.0%) | 0 (0.0%) |
| 5 to 9 Unit Apartments | 0 (0.0%) | 0 (0.0%) |
| 10 or more Apartments | 0 (0.0%) | 0 (0.0%) |
| Mobile Home / Other | 26 (100.0%) | 0 (0.0%) |
| Total | 117 (60.9%) | 75 (39.1%) |
Housing Structures by Number of Rooms in Diablock
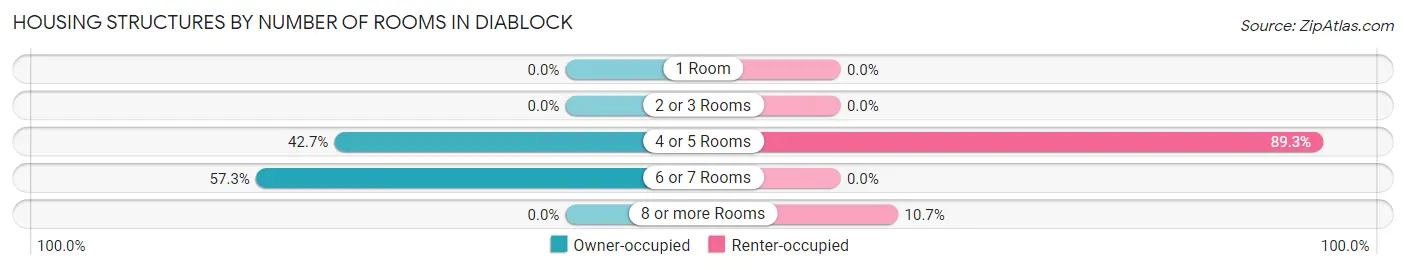
| Number of Rooms | Owner-occupied | Renter-occupied |
| 1 Room | 0 (0.0%) | 0 (0.0%) |
| 2 or 3 Rooms | 0 (0.0%) | 0 (0.0%) |
| 4 or 5 Rooms | 50 (42.7%) | 67 (89.3%) |
| 6 or 7 Rooms | 67 (57.3%) | 0 (0.0%) |
| 8 or more Rooms | 0 (0.0%) | 8 (10.7%) |
| Total | 117 (100.0%) | 75 (100.0%) |
Housing Structure by Heating Type in Diablock
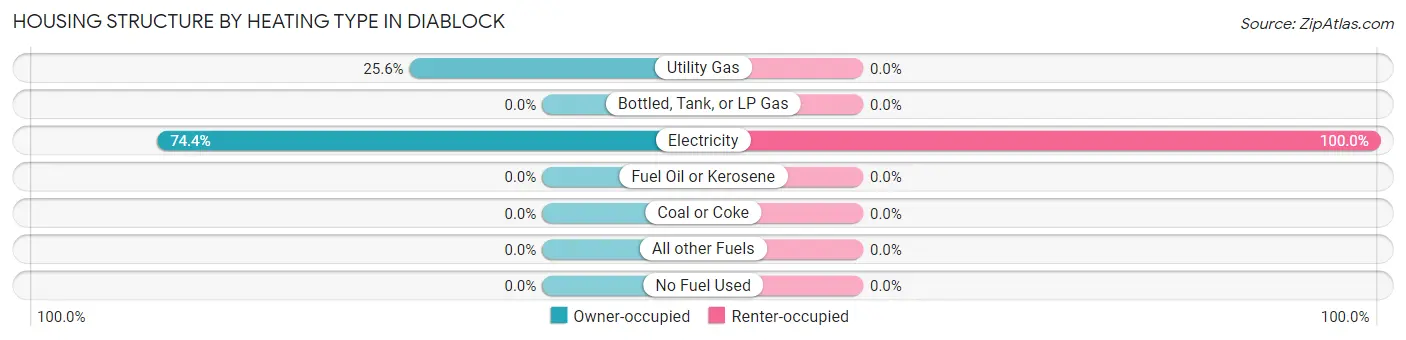
| Heating Type | Owner-occupied | Renter-occupied |
| Utility Gas | 30 (25.6%) | 0 (0.0%) |
| Bottled, Tank, or LP Gas | 0 (0.0%) | 0 (0.0%) |
| Electricity | 87 (74.4%) | 75 (100.0%) |
| Fuel Oil or Kerosene | 0 (0.0%) | 0 (0.0%) |
| Coal or Coke | 0 (0.0%) | 0 (0.0%) |
| All other Fuels | 0 (0.0%) | 0 (0.0%) |
| No Fuel Used | 0 (0.0%) | 0 (0.0%) |
| Total | 117 (100.0%) | 75 (100.0%) |
Household Vehicle Usage in Diablock
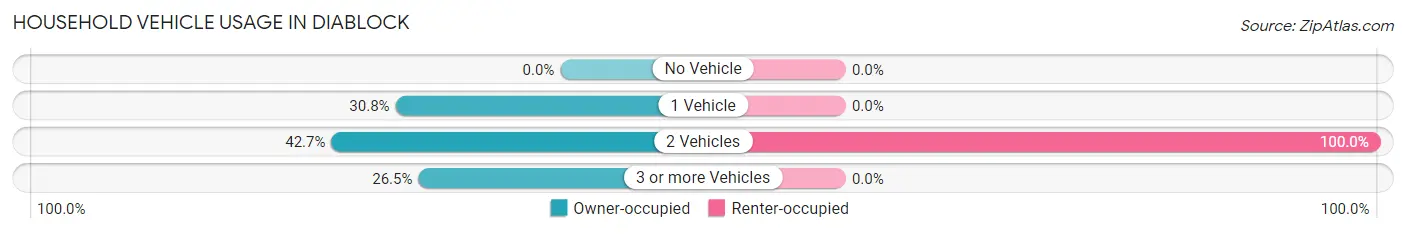
| Vehicles per Household | Owner-occupied | Renter-occupied |
| No Vehicle | 0 (0.0%) | 0 (0.0%) |
| 1 Vehicle | 36 (30.8%) | 0 (0.0%) |
| 2 Vehicles | 50 (42.7%) | 75 (100.0%) |
| 3 or more Vehicles | 31 (26.5%) | 0 (0.0%) |
| Total | 117 (100.0%) | 75 (100.0%) |
Real Estate & Mortgages in Diablock
Real Estate and Mortgage Overview in Diablock
| Characteristic | Without Mortgage | With Mortgage |
| Housing Units | 59 | 58 |
| Median Property Value | - | - |
| Median Household Income | - | - |
| Monthly Housing Costs | $334 | $0 |
| Real Estate Taxes | - | - |
Property Value by Mortgage Status in Diablock
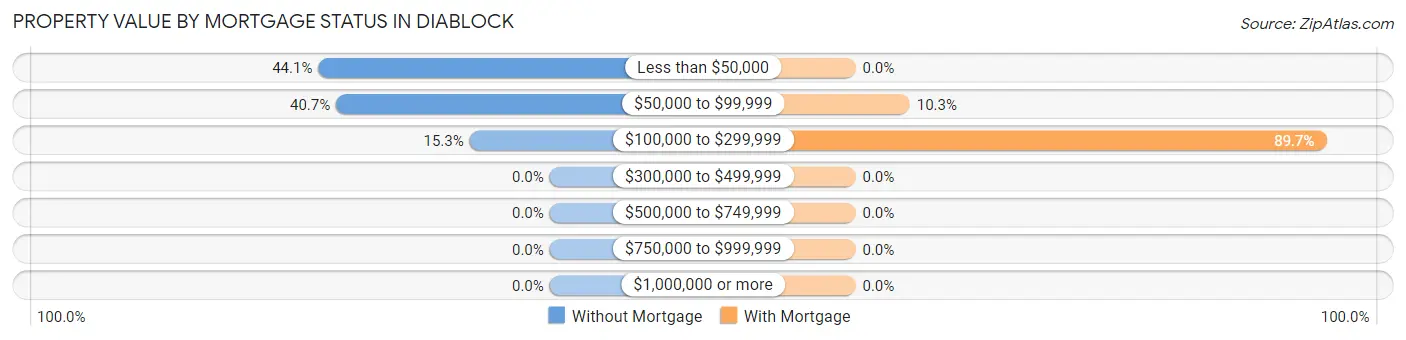
| Property Value | Without Mortgage | With Mortgage |
| Less than $50,000 | 26 (44.1%) | 0 (0.0%) |
| $50,000 to $99,999 | 24 (40.7%) | 6 (10.3%) |
| $100,000 to $299,999 | 9 (15.2%) | 52 (89.7%) |
| $300,000 to $499,999 | 0 (0.0%) | 0 (0.0%) |
| $500,000 to $749,999 | 0 (0.0%) | 0 (0.0%) |
| $750,000 to $999,999 | 0 (0.0%) | 0 (0.0%) |
| $1,000,000 or more | 0 (0.0%) | 0 (0.0%) |
| Total | 59 (100.0%) | 58 (100.0%) |
Household Income by Mortgage Status in Diablock
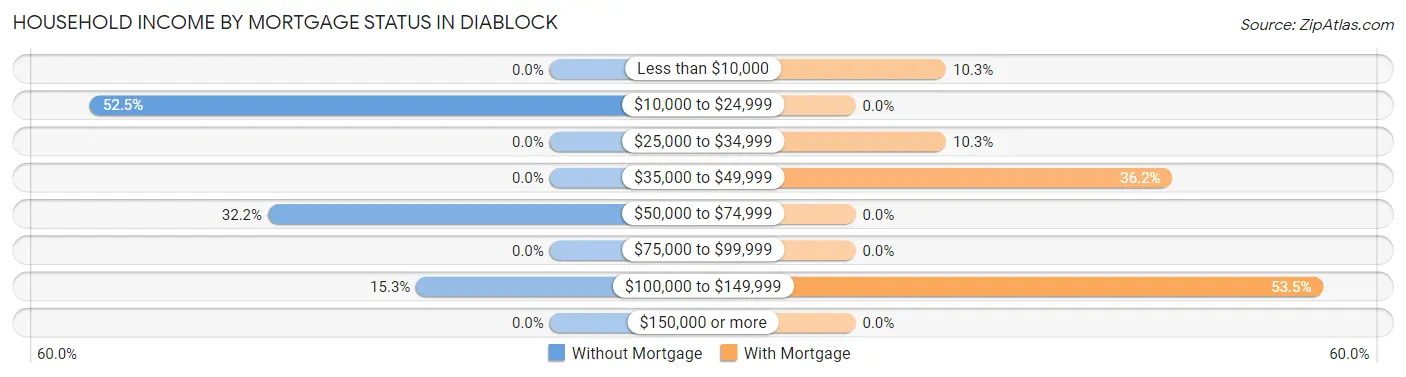
| Household Income | Without Mortgage | With Mortgage |
| Less than $10,000 | 0 (0.0%) | 6 (10.3%) |
| $10,000 to $24,999 | 31 (52.5%) | 0 (0.0%) |
| $25,000 to $34,999 | 0 (0.0%) | 6 (10.3%) |
| $35,000 to $49,999 | 0 (0.0%) | 21 (36.2%) |
| $50,000 to $74,999 | 19 (32.2%) | 0 (0.0%) |
| $75,000 to $99,999 | 0 (0.0%) | 0 (0.0%) |
| $100,000 to $149,999 | 9 (15.2%) | 31 (53.4%) |
| $150,000 or more | 0 (0.0%) | 0 (0.0%) |
| Total | 59 (100.0%) | 58 (100.0%) |
Property Value to Household Income Ratio in Diablock
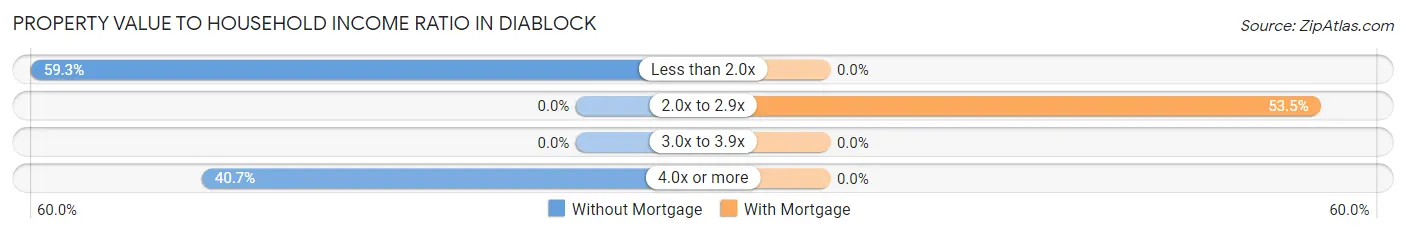
| Value-to-Income Ratio | Without Mortgage | With Mortgage |
| Less than 2.0x | 35 (59.3%) | 0 (0.0%) |
| 2.0x to 2.9x | 0 (0.0%) | 31 (53.4%) |
| 3.0x to 3.9x | 0 (0.0%) | 0 (0.0%) |
| 4.0x or more | 24 (40.7%) | 0 (0.0%) |
| Total | 59 (100.0%) | 58 (100.0%) |
Real Estate Taxes by Mortgage Status in Diablock
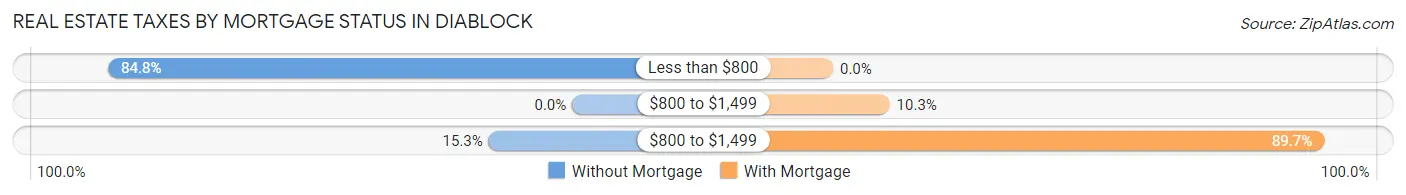
| Property Taxes | Without Mortgage | With Mortgage |
| Less than $800 | 50 (84.8%) | 0 (0.0%) |
| $800 to $1,499 | 0 (0.0%) | 6 (10.3%) |
| $800 to $1,499 | 9 (15.2%) | 52 (89.7%) |
| Total | 59 (100.0%) | 58 (100.0%) |
Health & Disability in Diablock
Health Insurance Coverage by Age in Diablock
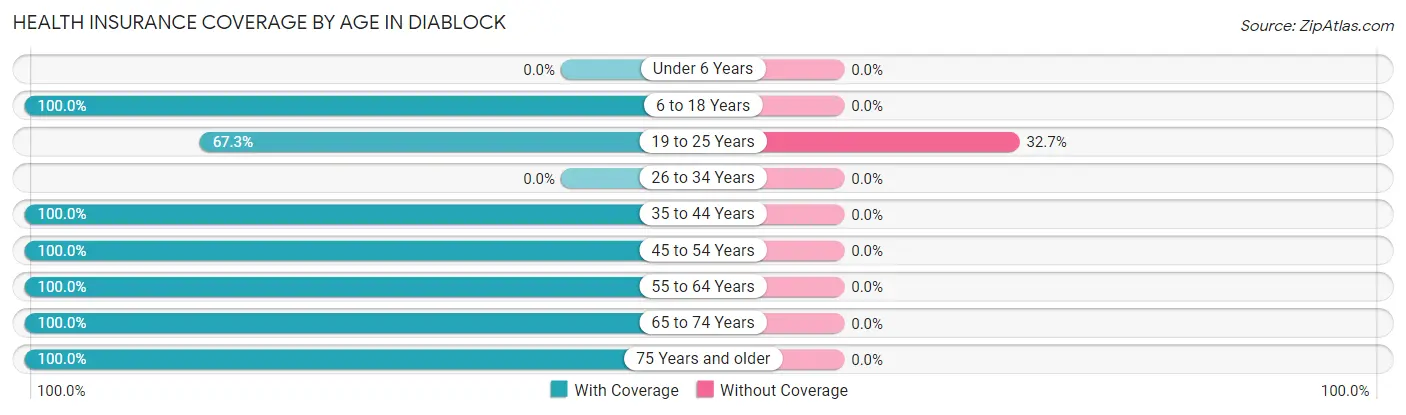
| Age Bracket | With Coverage | Without Coverage |
| Under 6 Years | 0 (0.0%) | 0 (0.0%) |
| 6 to 18 Years | 58 (100.0%) | 0 (0.0%) |
| 19 to 25 Years | 68 (67.3%) | 33 (32.7%) |
| 26 to 34 Years | 0 (0.0%) | 0 (0.0%) |
| 35 to 44 Years | 133 (100.0%) | 0 (0.0%) |
| 45 to 54 Years | 9 (100.0%) | 0 (0.0%) |
| 55 to 64 Years | 18 (100.0%) | 0 (0.0%) |
| 65 to 74 Years | 91 (100.0%) | 0 (0.0%) |
| 75 Years and older | 15 (100.0%) | 0 (0.0%) |
| Total | 392 (92.2%) | 33 (7.8%) |
Health Insurance Coverage by Citizenship Status in Diablock
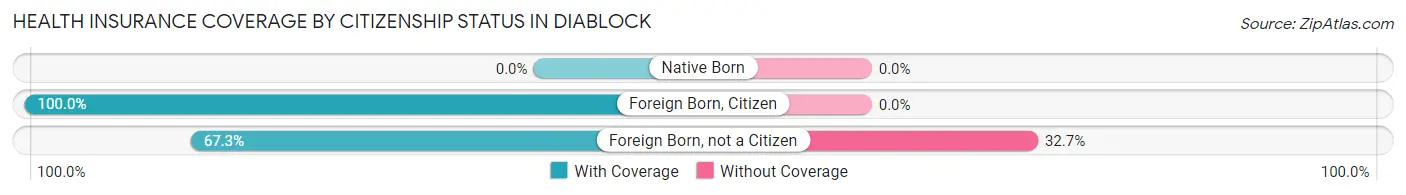
| Citizenship Status | With Coverage | Without Coverage |
| Native Born | 0 (0.0%) | 0 (0.0%) |
| Foreign Born, Citizen | 58 (100.0%) | 0 (0.0%) |
| Foreign Born, not a Citizen | 68 (67.3%) | 33 (32.7%) |
Health Insurance Coverage by Household Income in Diablock
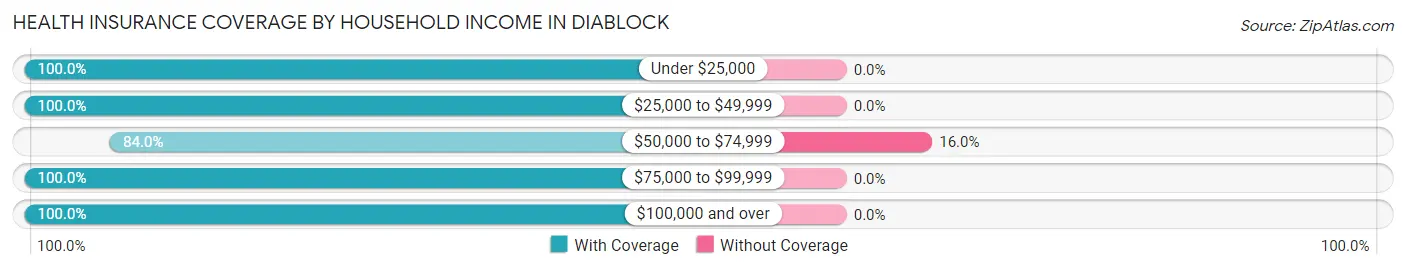
| Household Income | With Coverage | Without Coverage |
| Under $25,000 | 51 (100.0%) | 0 (0.0%) |
| $25,000 to $49,999 | 35 (100.0%) | 0 (0.0%) |
| $50,000 to $74,999 | 173 (84.0%) | 33 (16.0%) |
| $75,000 to $99,999 | 124 (100.0%) | 0 (0.0%) |
| $100,000 and over | 9 (100.0%) | 0 (0.0%) |
Public vs Private Health Insurance Coverage by Age in Diablock
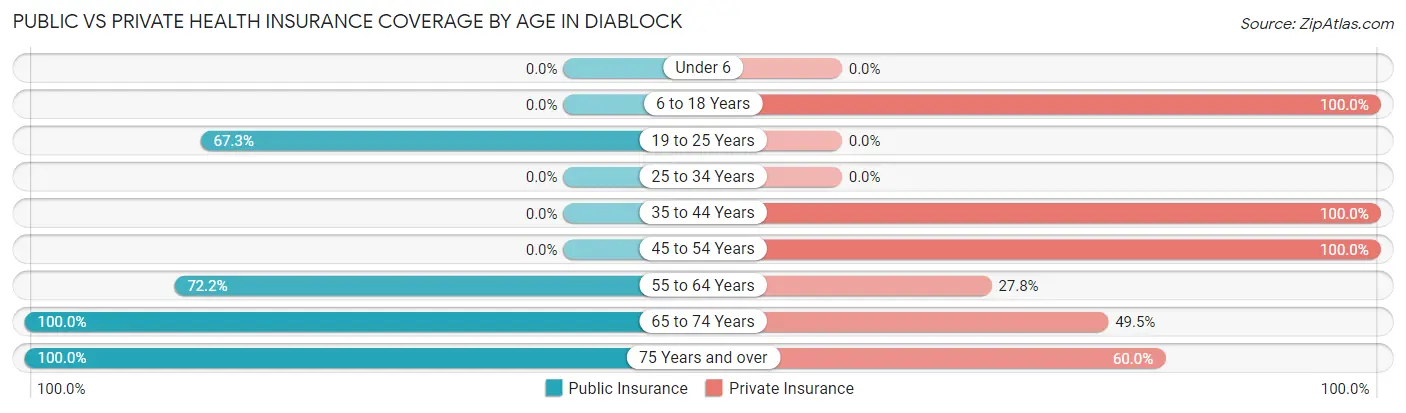
| Age Bracket | Public Insurance | Private Insurance |
| Under 6 | 0 (0.0%) | 0 (0.0%) |
| 6 to 18 Years | 0 (0.0%) | 58 (100.0%) |
| 19 to 25 Years | 68 (67.3%) | 0 (0.0%) |
| 25 to 34 Years | 0 (0.0%) | 0 (0.0%) |
| 35 to 44 Years | 0 (0.0%) | 133 (100.0%) |
| 45 to 54 Years | 0 (0.0%) | 9 (100.0%) |
| 55 to 64 Years | 13 (72.2%) | 5 (27.8%) |
| 65 to 74 Years | 91 (100.0%) | 45 (49.4%) |
| 75 Years and over | 15 (100.0%) | 9 (60.0%) |
| Total | 187 (44.0%) | 259 (60.9%) |
Disability Status by Sex by Age in Diablock
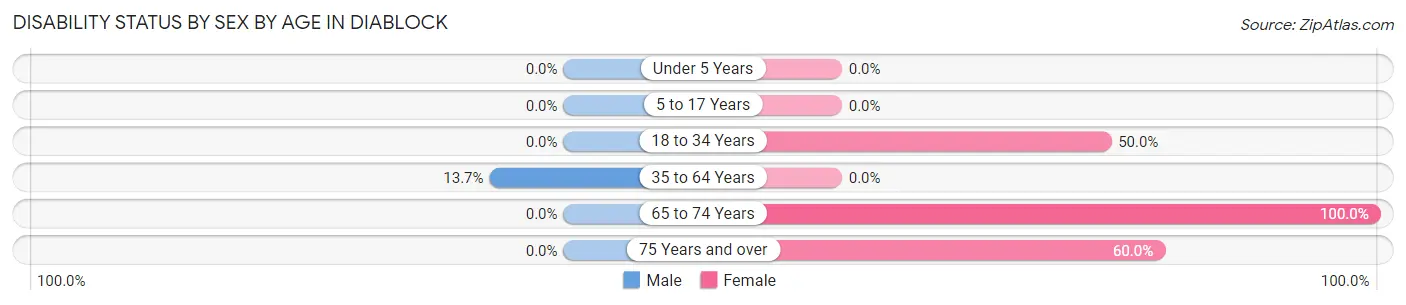
| Age Bracket | Male | Female |
| Under 5 Years | 0 (0.0%) | 0 (0.0%) |
| 5 to 17 Years | 0 (0.0%) | 0 (0.0%) |
| 18 to 34 Years | 0 (0.0%) | 33 (50.0%) |
| 35 to 64 Years | 7 (13.7%) | 0 (0.0%) |
| 65 to 74 Years | 0 (0.0%) | 72 (100.0%) |
| 75 Years and over | 0 (0.0%) | 9 (60.0%) |
Disability Class by Sex by Age in Diablock
Disability Class: Hearing Difficulty
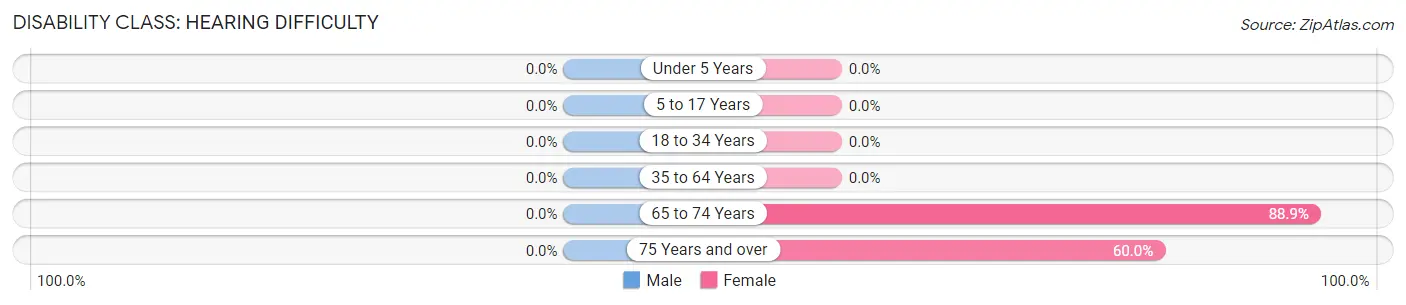
| Age Bracket | Male | Female |
| Under 5 Years | 0 (0.0%) | 0 (0.0%) |
| 5 to 17 Years | 0 (0.0%) | 0 (0.0%) |
| 18 to 34 Years | 0 (0.0%) | 0 (0.0%) |
| 35 to 64 Years | 0 (0.0%) | 0 (0.0%) |
| 65 to 74 Years | 0 (0.0%) | 64 (88.9%) |
| 75 Years and over | 0 (0.0%) | 9 (60.0%) |
Disability Class: Vision Difficulty
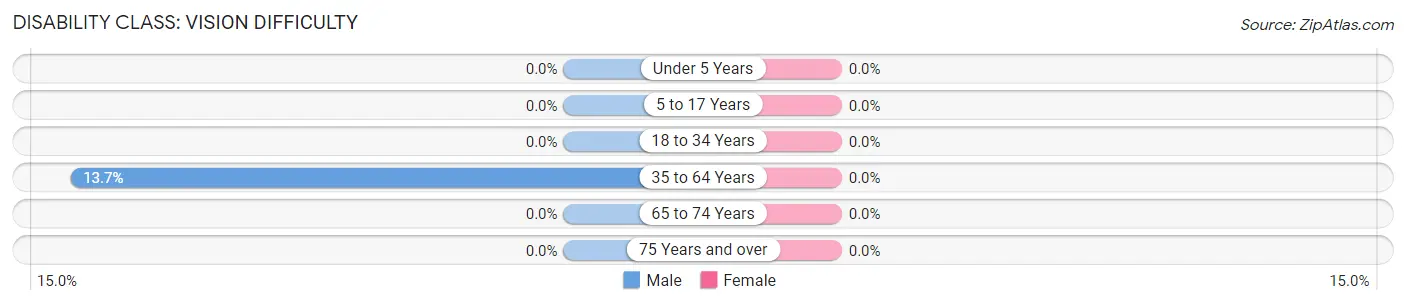
| Age Bracket | Male | Female |
| Under 5 Years | 0 (0.0%) | 0 (0.0%) |
| 5 to 17 Years | 0 (0.0%) | 0 (0.0%) |
| 18 to 34 Years | 0 (0.0%) | 0 (0.0%) |
| 35 to 64 Years | 7 (13.7%) | 0 (0.0%) |
| 65 to 74 Years | 0 (0.0%) | 0 (0.0%) |
| 75 Years and over | 0 (0.0%) | 0 (0.0%) |
Disability Class: Cognitive Difficulty
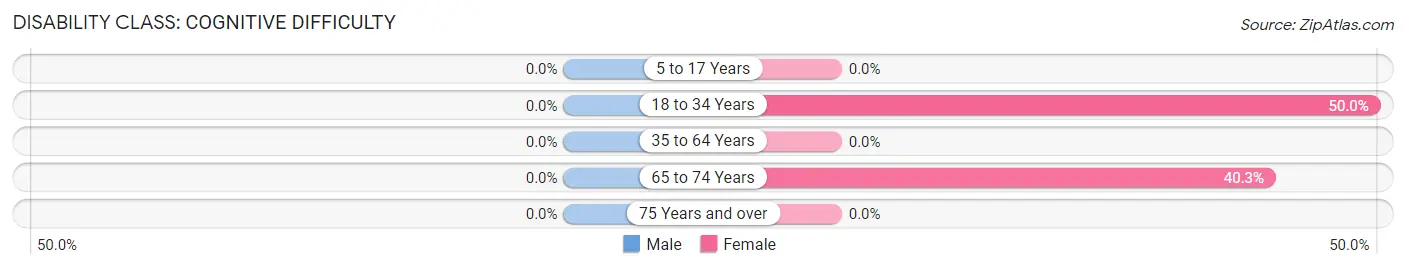
| Age Bracket | Male | Female |
| 5 to 17 Years | 0 (0.0%) | 0 (0.0%) |
| 18 to 34 Years | 0 (0.0%) | 33 (50.0%) |
| 35 to 64 Years | 0 (0.0%) | 0 (0.0%) |
| 65 to 74 Years | 0 (0.0%) | 29 (40.3%) |
| 75 Years and over | 0 (0.0%) | 0 (0.0%) |
Disability Class: Ambulatory Difficulty
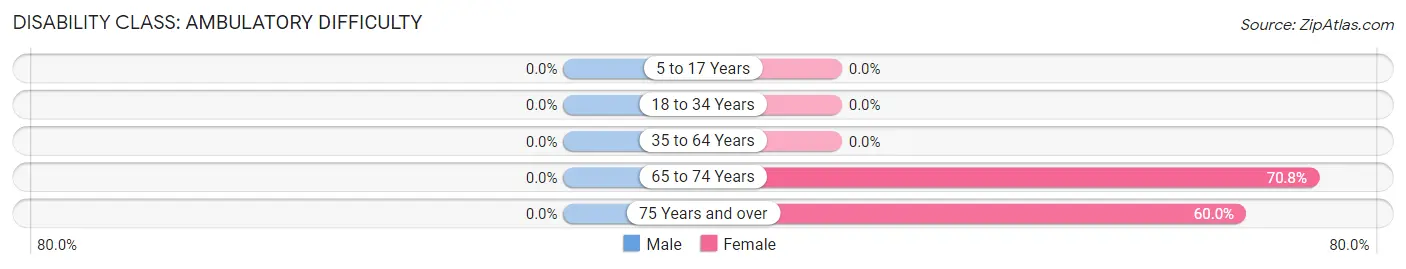
| Age Bracket | Male | Female |
| 5 to 17 Years | 0 (0.0%) | 0 (0.0%) |
| 18 to 34 Years | 0 (0.0%) | 0 (0.0%) |
| 35 to 64 Years | 0 (0.0%) | 0 (0.0%) |
| 65 to 74 Years | 0 (0.0%) | 51 (70.8%) |
| 75 Years and over | 0 (0.0%) | 9 (60.0%) |
Disability Class: Self-Care Difficulty
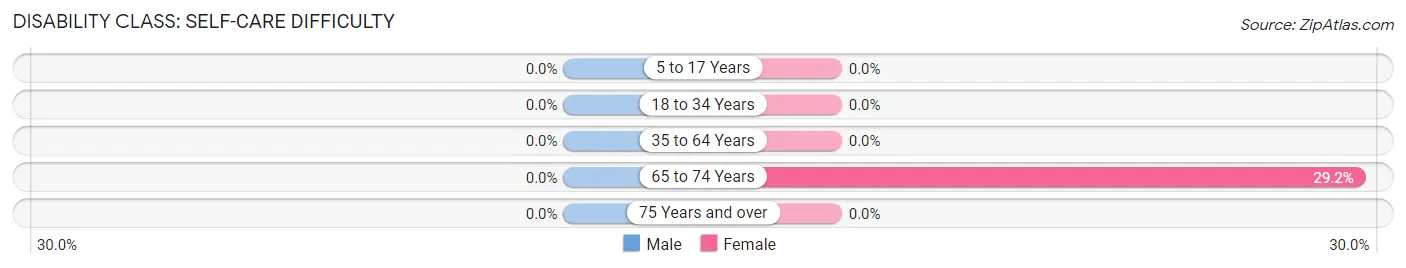
| Age Bracket | Male | Female |
| 5 to 17 Years | 0 (0.0%) | 0 (0.0%) |
| 18 to 34 Years | 0 (0.0%) | 0 (0.0%) |
| 35 to 64 Years | 0 (0.0%) | 0 (0.0%) |
| 65 to 74 Years | 0 (0.0%) | 21 (29.2%) |
| 75 Years and over | 0 (0.0%) | 0 (0.0%) |
Technology Access in Diablock
Computing Device Access in Diablock
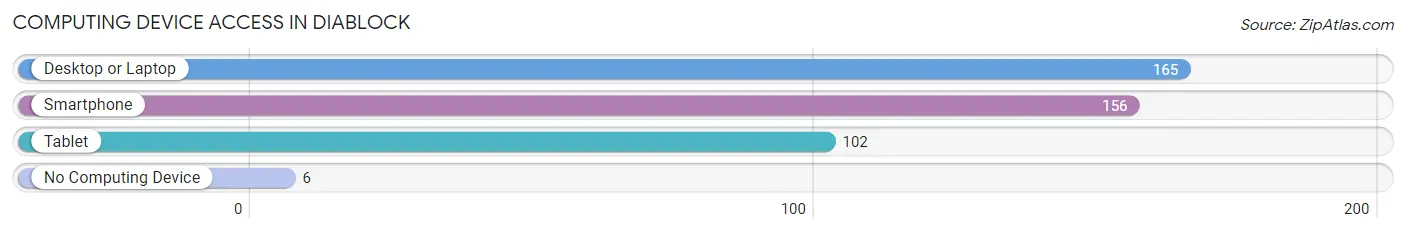
| Device Type | # Households | % Households |
| Desktop or Laptop | 165 | 85.9% |
| Smartphone | 156 | 81.2% |
| Tablet | 102 | 53.1% |
| No Computing Device | 6 | 3.1% |
| Total | 192 | 100.0% |
Internet Access in Diablock
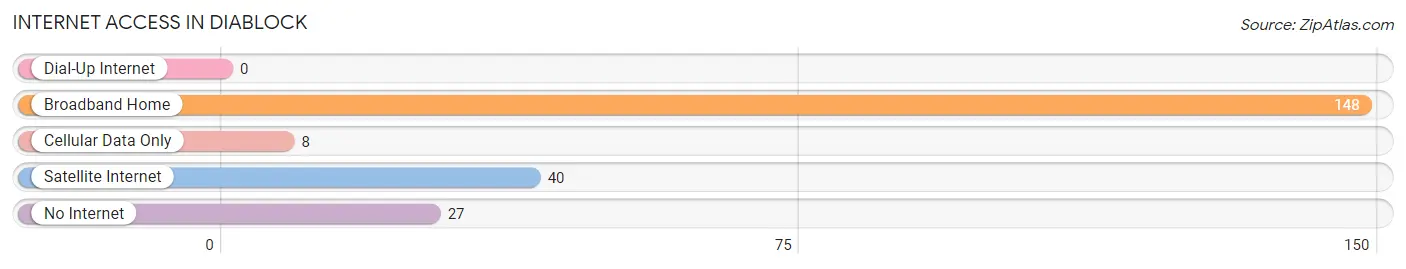
| Internet Type | # Households | % Households |
| Dial-Up Internet | 0 | 0.0% |
| Broadband Home | 148 | 77.1% |
| Cellular Data Only | 8 | 4.2% |
| Satellite Internet | 40 | 20.8% |
| No Internet | 27 | 14.1% |
| Total | 192 | 100.0% |
Diablock Summary
Diablock is a small unincorporated community located in the southeastern corner of Kentucky, in the foothills of the Appalachian Mountains. It is situated in the county of Harlan, and is part of the Harlan Micropolitan Statistical Area. The population of Diablock was estimated to be around 1,000 people in 2000.
History
Diablock was first settled in the late 1700s by a group of settlers from North Carolina. The town was originally known as “Diablock”, which is derived from the Cherokee word for “place of the deer”. The town was officially incorporated in 1820, and was named after the nearby creek of the same name.
In the early 1900s, Diablock was a thriving coal mining town. The coal industry was the main source of employment for the town’s residents, and the town was home to several coal mines. The coal industry in Diablock declined in the mid-1900s, and the town’s population began to decline as well.
Geography
Diablock is located in the southeastern corner of Kentucky, in the foothills of the Appalachian Mountains. The town is situated in the county of Harlan, and is part of the Harlan Micropolitan Statistical Area. The town is located at an elevation of 1,000 feet above sea level.
The town is surrounded by rolling hills and mountains, and is home to several creeks and streams. The town is located near the Cumberland Gap National Historical Park, which is a popular tourist destination.
Economy
The economy of Diablock is largely based on agriculture and tourism. The town is home to several farms, which produce a variety of crops, including corn, soybeans, and tobacco. The town is also home to several tourist attractions, including the Cumberland Gap National Historical Park.
The town is also home to several small businesses, including restaurants, stores, and other services. The town is also home to several manufacturing companies, which produce a variety of products, including furniture, clothing, and other items.
Demographics
The population of Diablock was estimated to be around 1,000 people in 2000. The town is predominantly white, with a small African American population. The median household income in the town is around $30,000, and the median age is around 40 years old. The town is home to several churches, and the town’s residents are predominantly Christian.
Common Questions
What is the Total Population of Diablock?
Total Population of Diablock is 425.
What is the Total Male Population of Diablock?
Total Male Population of Diablock is 140.
What is the Total Female Population of Diablock?
Total Female Population of Diablock is 285.
What is the Ratio of Males per 100 Females in Diablock?
There are 49.12 Males per 100 Females in Diablock.
What is the Ratio of Females per 100 Males in Diablock?
There are 203.57 Females per 100 Males in Diablock.
What is the Median Population Age in Diablock?
Median Population Age in Diablock is 41.6 Years.
What is the Average Family Size in Diablock
Average Family Size in Diablock is 2.1 People.
What is the Average Household Size in Diablock
Average Household Size in Diablock is 2.2 People.
What is Per Capita Income in Diablock?
Per Capita income in Diablock is $22,799.
What is the Median Family Income in Diablock?
Median Family Income in Diablock is $46,660.
What is the Median Household income in Diablock?
Median Household Income in Diablock is $61,119.
What is Income or Wage Gap in Diablock?
Income or Wage Gap in Diablock is 43.1%.
Women in Diablock earn 56.9 cents for every dollar earned by a man.
What is Inequality or Gini Index in Diablock?
Inequality or Gini Index in Diablock is 0.30.
How Large is the Labor Force in Diablock?
There are 216 People in the Labor Forcein in Diablock.
What is the Percentage of People in the Labor Force in Diablock?
58.9% of People are in the Labor Force in Diablock.
What is the Unemployment Rate in Diablock?
Unemployment Rate in Diablock is 15.3%.