Zip Codes with the Highest Percentage of Population Employed in Health Diagnosing & Treating in Covington, KY
RELATED REPORTS & OPTIONS
Health Diagnosing & Treating
Covington
Compare Zip Codes
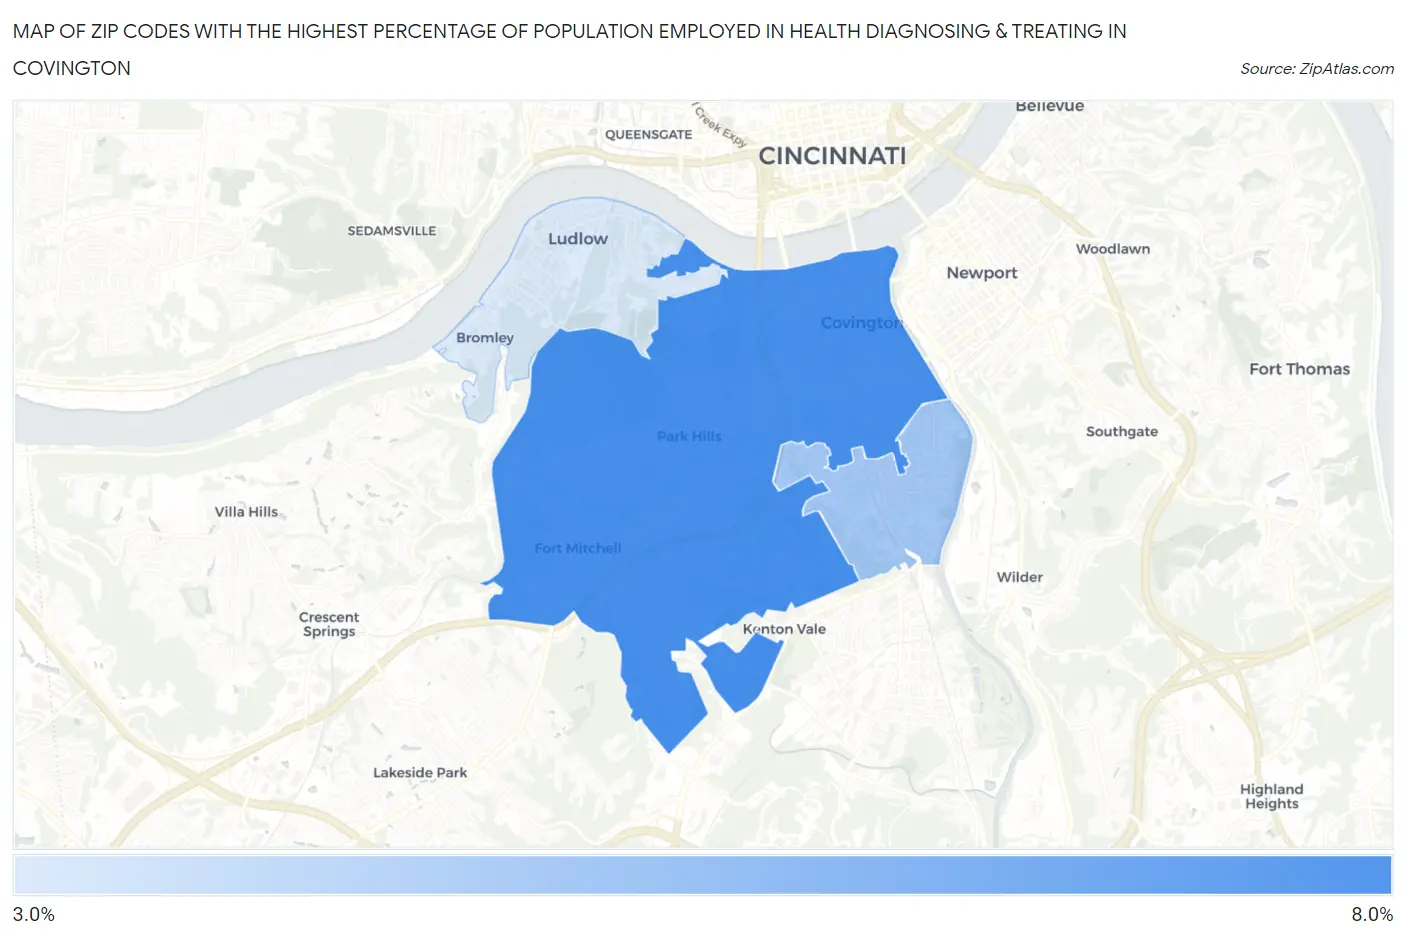
Map of Zip Codes with the Highest Percentage of Population Employed in Health Diagnosing & Treating in Covington
0.0%
8.0%
Zip Codes with the Highest Percentage of Population Employed in Health Diagnosing & Treating in Covington, KY
| Zip Code | % Employed | vs State | vs National | |
| 1. | 41011 | 7.6% | 7.2%(+0.346)#264 | 6.2%(+1.31)#8,637 |
| 2. | 41014 | 4.8% | 7.2%(-2.44)#443 | 6.2%(-1.48)#18,614 |
| 3. | 41016 | 3.1% | 7.2%(-4.16)#528 | 6.2%(-3.19)#24,173 |
1
Common Questions
What are the Top Zip Codes with the Highest Percentage of Population Employed in Health Diagnosing & Treating in Covington, KY?
Top Zip Codes with the Highest Percentage of Population Employed in Health Diagnosing & Treating in Covington, KY are:
What zip code has the Highest Percentage of Population Employed in Health Diagnosing & Treating in Covington, KY?
41011 has the Highest Percentage of Population Employed in Health Diagnosing & Treating in Covington, KY with 7.6%.
What is the Percentage of Population Employed in Health Diagnosing & Treating in Covington, KY?
Percentage of Population Employed in Health Diagnosing & Treating in Covington is 5.3%.
What is the Percentage of Population Employed in Health Diagnosing & Treating in Kentucky?
Percentage of Population Employed in Health Diagnosing & Treating in Kentucky is 7.2%.
What is the Percentage of Population Employed in Health Diagnosing & Treating in the United States?
Percentage of Population Employed in Health Diagnosing & Treating in the United States is 6.2%.